Article

Winter Wheat Phenology Variation and Its Response to Climate Change in Shandong Province, China

1
CAS Key Laboratory of Coastal Environmental Processes and Ecological Remediation, Yantai Institute of Coastal Zone Research, Chinese Academy of Sciences, Yantai 264003, China
2
Shandong Key Laboratory of Coastal Environmental Processes, Yantai 264003, China
3
Center for Ocean Mega-Science, Chinese Academy of Sciences, Qingdao 266071, China
4
University of Chinese Academy of Sciences, Beijing 100049, China
5
Marine Science and Technology College, Zhejiang Ocean University, Zhoushan 316022, China
*
Author to whom correspondence should be addressed.
Remote Sens. 2022, 14(18), 4482; https://doi.org/10.3390/rs14184482
Submission received: 13 July 2022 / Revised: 1 September 2022 / Accepted: 1 September 2022 / Published: 8 September 2022
(This article belongs to the Section Remote Sensing in Agriculture and Vegetation)

Abstract

:
Crop phenology is considered to be an important indicator reflecting the biophysical and physiological processes of crops facing climate change. Therefore, quantifying crop phenology change and its relationship with climate variables is of great significance for developing agricultural management and adaptation strategies to cope with global warming. Based on the Moderate Resolution Imaging Spectroradiometer (MODIS) Enhanced Vegetation Index (EVI) product, winter wheat green-up date, heading date, jointing date, and maturity date were first retrieved by Savitzky–Golay (S-G) filtering and threshold methods and then the variation of winter wheat phenology and its correlation with mean (Tmean), minimum (Tmin), and maximum (Tmax) temperature and precipitation (Pre) during 2003–2019 were comprehensively analyzed in Shandong Province, China. Results showed that green-up date, jointing date, heading date, and maturity date generally ranged from 50–70 DOY, 75–95 DOY, 100–120 DOY, and 130–150 DOY. Winter wheat phenology presented a spatial pattern of the South earlier than the North and the inland earlier than the coastal regions. For every 1° increase in latitude/longitude, green-up date, jointing date, heading date, and maturity date were respectively delayed by 3.93 days/0.43 days, 2.31 days/1.19 days, 2.80 days/1.14 days, and 2.12 days/1.09 days. Green-up date and jointing date were both advanced in the West and delayed in the Eastern coastal areas and the South, and heading date and maturity date respectively showed a widespread advance and a delayed tendency in Shandong Province, however, the trend of winter wheat phenological changes was generally insignificant. In addition, green-up date, jointing date, and heading date generally presented a significant negative correlation with mean/minimum temperature, while maturity date was positively associated with the current month maximum temperature, notably in the West of Shandong Province. Regarding precipitation, a generally insignificant relationship with winter wheat phenology was detected. Results in this study are anticipated to provide insight into the impact of climate change on winter wheat phenology and to supply reference for the agricultural production and field management of winter wheat in Shandong Province, China.

1. Introduction

Vegetation phenology refers to the periodic phase of the plant life cycle, which is related to climate change and the environmental factors involved [1,2,3]. For cereal crops, phenology usually represents the physiological development stages of crop growth, such as sowing date, green-up date, jointing date, heading date, and maturity date [4,5,6]. There is evidence that crop phenology plays a crucial role in exchange of material and energy between agriculture crops and biosphere–atmosphere [7], which thus regulates the crop growth process and finally affects the crop quality and yield [8,9,10]. For instance, accelerated crop growth may shorten the growing season, which is not conducive to nutrient accumulation, and ultimately negatively affects crop yield [11]. Under climate change in the future, crops, such as wheat and maize, would experience yield reduction due to the advance in anthesis and maturity date [12]. Therefore, given the impact of crop phenology on agricultural production and crop yield, the exploration of explicit information on crop phenology and its drivers has attracted extensive attention from scientists and decision makers around the world.
With the advantage in manually observing and recording the important growth periods of crops according to the morphological characteristics of crops, observation based agro-meteorological stations are generally believed to be an effective method to monitor crop phenology [13]. However, the shortcomings of manual observation, such as being time consuming and labor intensive as well as the inability to continuously achieve long time series and large spatial scale of crop phenology changes are extremely prominent [3,14]. In recent years, multi-temporal remote sensing data, which overcomes the limitations of small monitoring range and large artificial error in field observations, has been gradually applied to crop phenology detection with a macro-scale perspective [15,16,17,18,19,20].
Previous studies have documented that the crop phenology derived from remote sensing data, such as Moderate Resolution Imaging Spectroradiometer (MODIS), Advanced Very High Resolution Radiometer (AVHRR), Systeme Probatoire d’Observation de la Terre (SPOT), and Sentinel series, was highly correlated with that from ground records when compared with traditional ground observations; crop phenology acquired based on remote sensing technology therefore has been more widely recognized and applied in the current period. For example, Lu et al. (2013) demonstrated that the phenological metrics of winter wheat derived from SPOT-4 VEGETATION sensor data were in good agreement with those from ground observations in the North China Plain [21]. Gan et al. (2020) found that the green-up date of winter wheat extracted by MODIS vegetation index, especially the Normalized Difference Phenology Index, had a significant correlation with the ground-observed green-up date from agrometeorological stations in the Huanghuai region of China [22]. Recently, Schreier et al. (2021) derived the phenometrics of the main crops in Bila Tserkva district of Ukraine by fusing time series from Landsat 8 and Sentinel 2 with MODIS data and discovered that there were only a few days deviation from on-field reported growing-stages for most crops [23].
As a key indicator of crop growth, crop phenology usually changes with the influence of local temperature, precipitation, and other climatic factors as well as crop management practices [24,25,26]. More recently, growing evidence has shown that the change in terrestrial vegetation, including agricultural crops, is significantly affected by climate change in the context of global warming, which exerts a profound impact on the ecological environment and agricultural operations both globally [27] and regionally [2,28,29,30,31,32,33,34].
In China, numerous studies have also explored the effects of climate change on crop phenology. For instance, a common negative effect of rising temperature on the key phenological dates and growth periods of crops in the North China Plain, the Loess Plateau of China, and the whole of China was widely documented [6,13,25,35,36,37,38]. On the contrary, several existing research recognize the significant positive role played by the increasing minimum temperature on crop phenology based on agro-meteorological stations records [39,40]. What’s more, precipitation and sunshine duration were also identified to affect the phenological stages of grain and cash crops (i.e., winter wheat, soybean, and cotton) to some extent in China [25,26,40]. Evidence from the studies mentioned above indicate that changes in crop phenological stages presented different relationships with climate factors to varying degrees, generally highlighting various correlations between crop phenology and climate variables in China.
Located in the lower reaches of the Yellow River Basin in China, Shandong Province is known as one of the main production bases of winter wheat in China [21,36]. Various researches in the early stage have conducted studies on winter wheat phenology related issues based on either remote sensing datasets [5,10,21,22,41,42,43,44] or observation records [35,39,40] in the areas associated with Shandong Province and have provided a valuable understanding of the shift in winter wheat phenology over the past years. However, previous studies usually focused on a finite number of winter wheat phenological stages, and the variation characteristics of winter wheat phenology along the longitude and latitude as well as the diverse responses of winter wheat phenological stages to climate change from the perspective of both pre- and current season periods are still unknown in Shandong Province.
In the present study, we extracted the plant area and four major winter wheat phenological stages (i.e., green-up date, jointing date, heading date, and maturity date) throughout the life cycle of winter wheat in Shandong Province during 2003–2019 using a satellite vegetation index (MODIS-EVI) in combination with field survey sample data, Google Earth maps, and records of agro-meteorological station. We also quantitatively analyzed the interannual variation of winter wheat phenology and its relationship with climate factors (mean temperature, minimum temperature, maximum temperature and precipitation) from meteorological stations with a perspective of both pre- and current season in Shandong Province. The objectives of this study are (1) to evaluate the satellite-based winter wheat phenology against agro-observations, (2) to explore the spatial and temporal characteristics of the key winter wheat phenological stages, and further (3) to reveal the correlation between the winter wheat phenological stages and temperature as well as precipitation during winter wheat seasons.

2. Materials and Methods
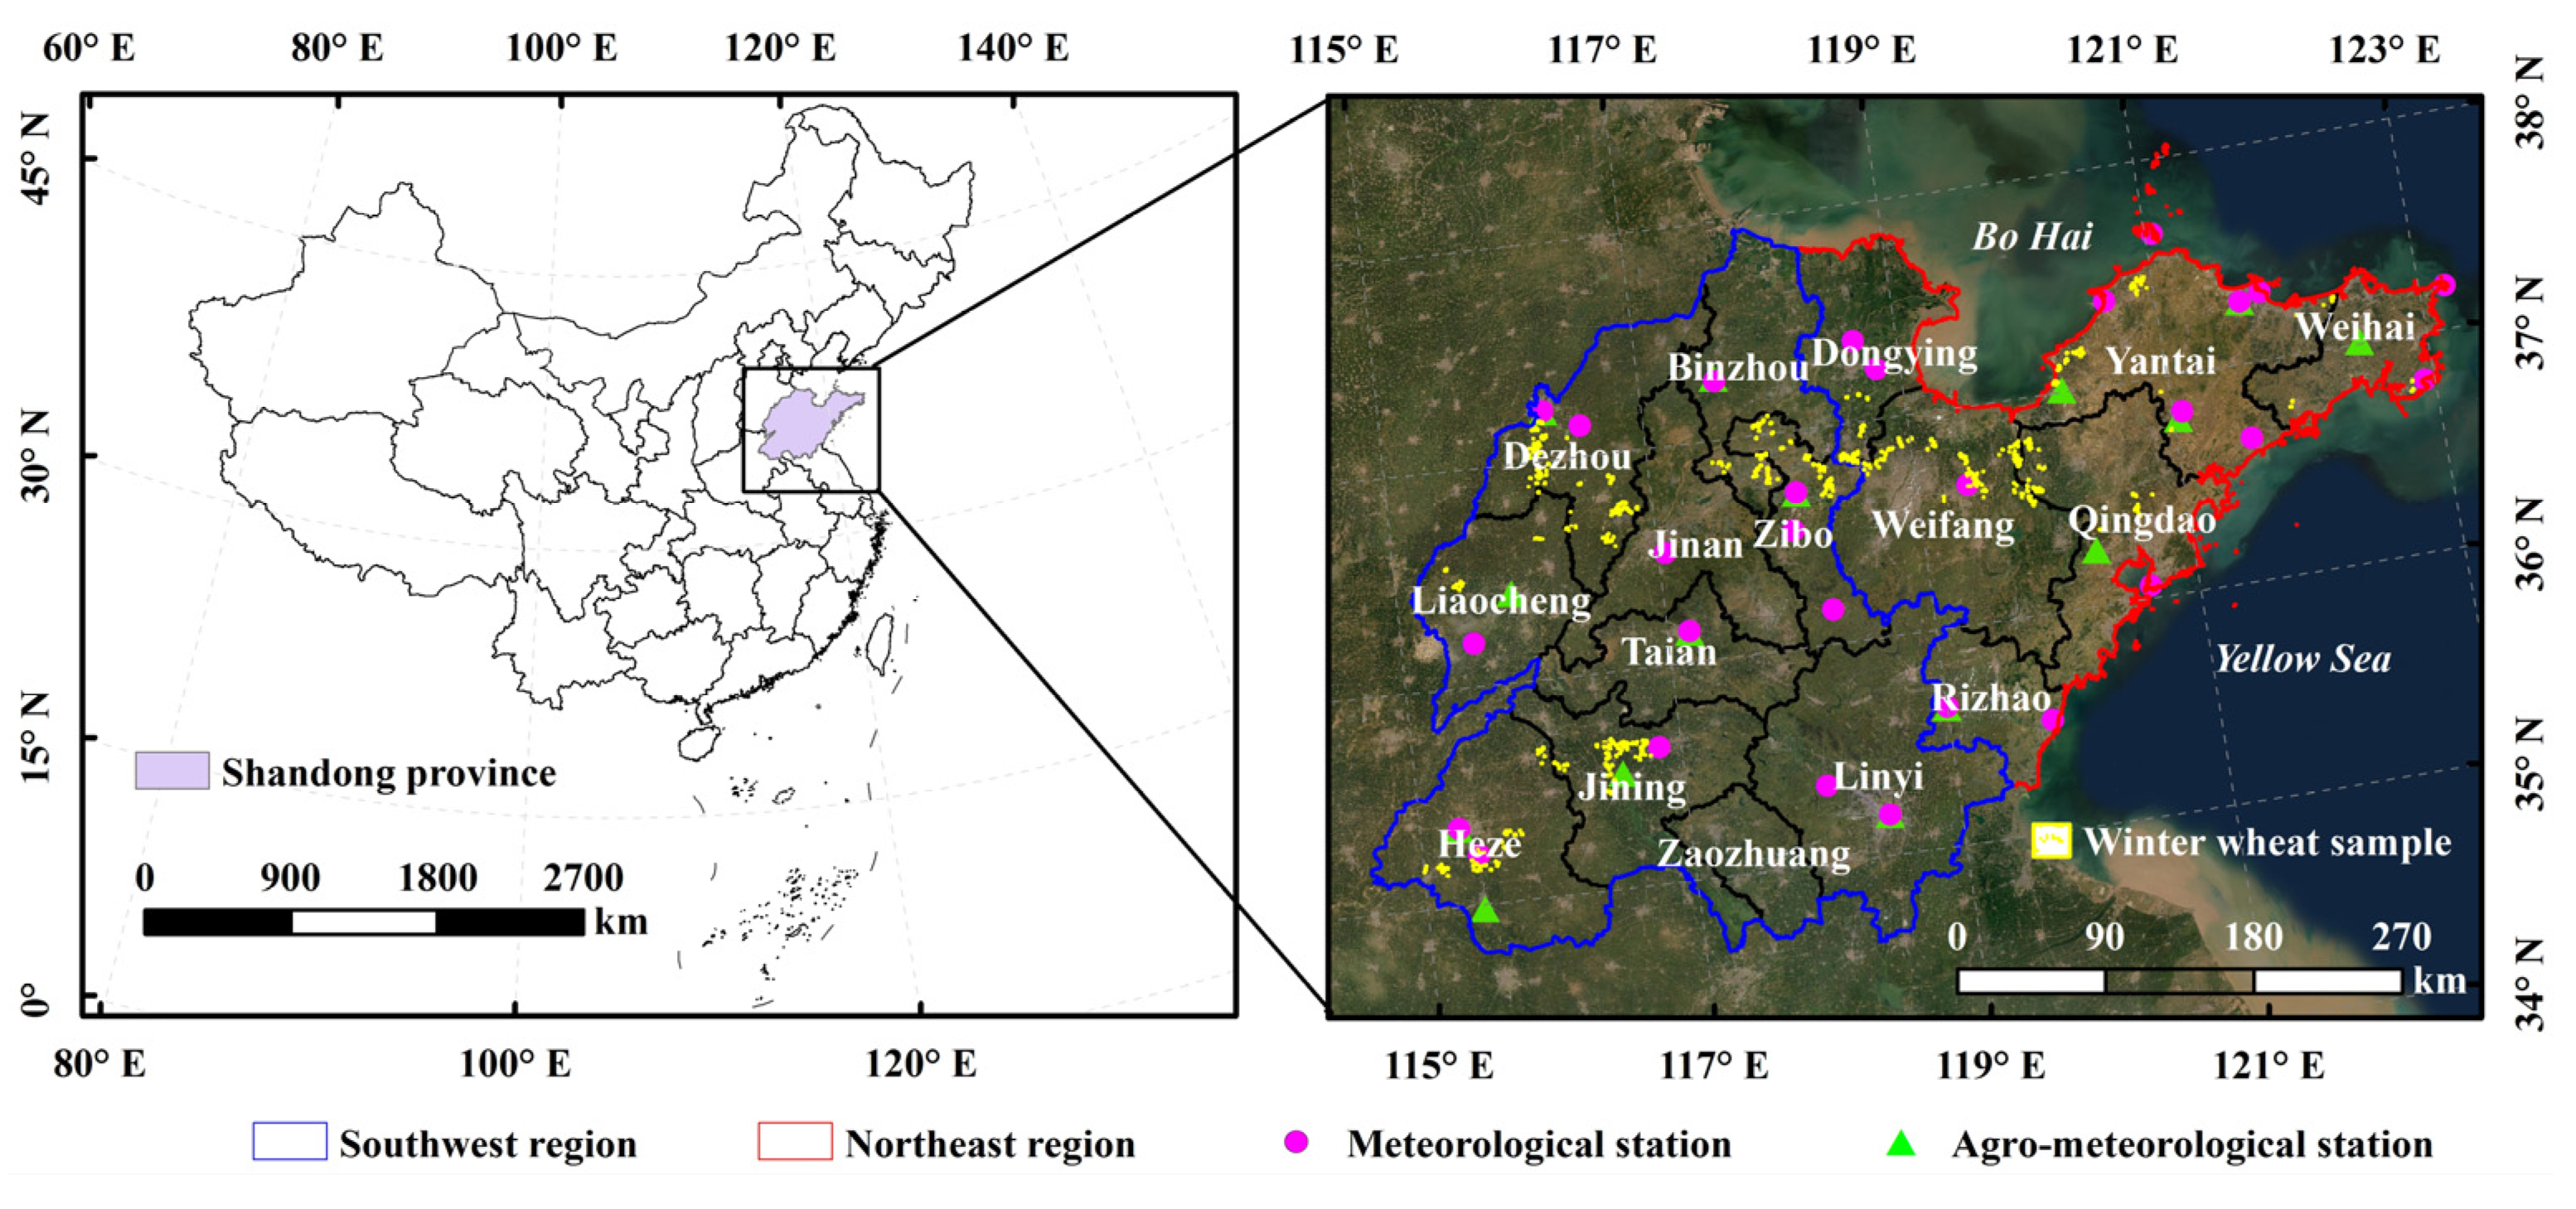
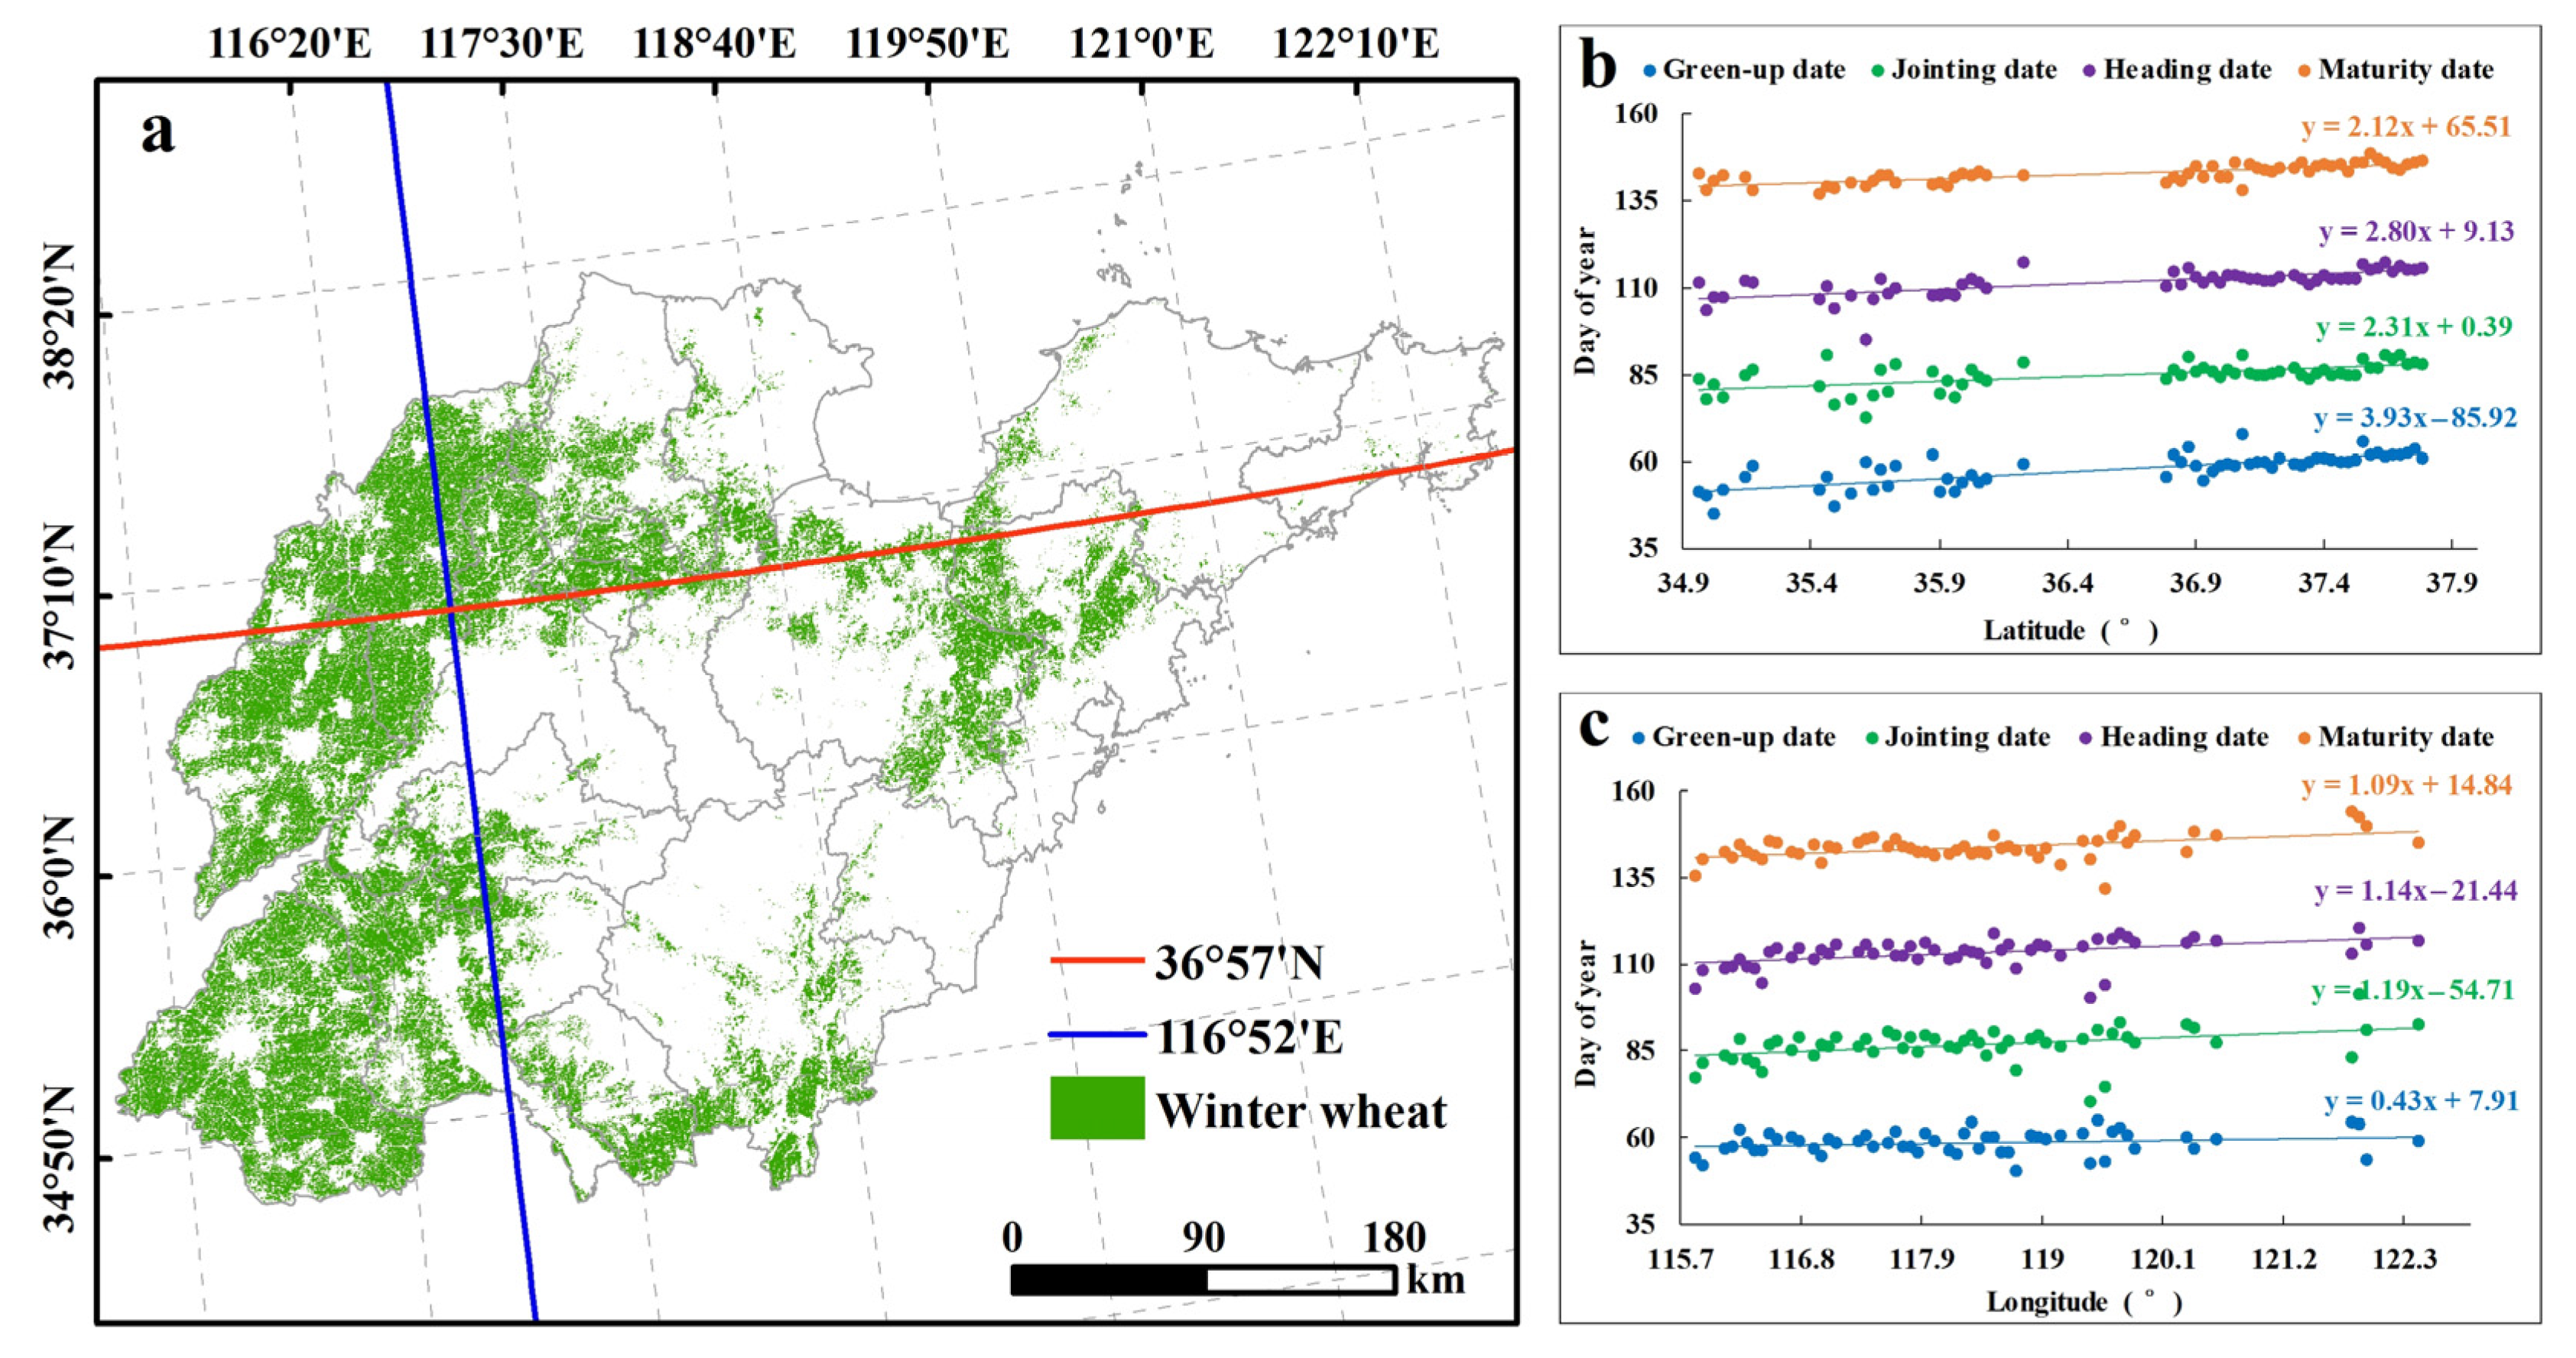
2.1. Study Area

As a coastal province, Shandong is located in the North China Plain and bordered by the Bo Hai to the north and the Yellow Sea to the east (Figure 1). The total area of Shandong Province is almost 1.57 × 10⁷ hm2 of which approximately 65.56% is cultivated land. The annual average temperature and annual total precipitation are 11–14 °C and 550–950 mm, respectively. Benefitting from the appropriate temperature and snowmelt in winter and spring, winter wheat in Shandong Province changes from the dormant period to the green-up stage under the conditions of suitable climate and stable soil moisture, and it continues its lifecycle of 230 to 260 days in general [41].

2.2. Data

2.2.1. MODIS EVI

With high temporal resolution and rapid availability of a wide range of multiple products, MODIS is of great significance for vegetation monitoring and thus plays an important role in detecting crop development at large spatial scales [15]. Downloaded from National Aeronautics and Space Administration freely (https://ladsweb.modaps.eosdis.nasa.gov, accessed on 3 January 2020), MODIS EVI date, namely MOD13Q1 and MYD13Q1 EVI (Enhanced Vegetation Index) products during 2003–2019 were employed to calculate the winter wheat planting area and to extract the phenological stages in this study. MOD13Q1 and MYD13Q1 EVI data are generated every 16 days at 250 m spatial resolution in the Sinusoidal projection and are computed from atmospherically-corrected bi-directional surface reflectance that have beFen masked for water, clouds, heavy aerosols, and cloud shadow. Since the production time is staggered by 8 days, the interaction of MOD13Q1 and MYD13Q1 enables the acquisition of a data product with a time interval of 8 days. Compensating for being easily affected by green degree saturation and disturbed by the soil background conditions of NDVI [45], MODIS EVI are considered to reflect the variation of crop growth more accurately and thus have been widely used for crop phenology observation worldwide [10,15,34,46]. Python was employed to deal with EVI dataset processing, such as format conversion, projection transformation, clipping, and 8-day resolution dataset synthesis.

2.2.2. Meteorological Data

Meteorological station data of climate variables and agro-meteorological station records of winter wheat phenology during 2002–2019 were obtained from the China Meteorological Data Service Centre (http://data.cma.cn/, accessed on 15 April 2020) in this study. Specifically, daily climate data covering mean (Tmean), minimum (Tmin), and maximum (Tmax) temperature as well as precipitation (Pre) at 28 meteorological stations in Shandong Province were selected (Figure 1). MATLAB was employed to deal with the meteorological data processing in terms of format conversion and real value calculation. ArcGIS software (ArcGIS 10.7, Environmental Systems Research Institute (Redlands, CA, USA)) was used to build the monthly raster datasets of climate variables during winter wheat seasons. The records which documented the annual occurrence dates of major winter wheat phenology at 15 agro-meteorological station were chosen to verify the accuracy of winter wheat phenology detected by remote sensing data (Figure 1).

2.2.3. Winter Wheat Sample Data

Field surveys were conducted to investigate the winter wheat planting plots in Dongying, Weifang, and Yantai in Shandong Province from December 2019 to May 2020 by RTK (Real-time kinematic), which combines GPS measuring technique and data transfer technique with the positioning error of centimeter scale. We first measured a series of points along the boundary of winter wheat planting fields using RTK and then connected the boundary point data of each winter wheat sample field and again converted the closed-loop vector data of winter wheat sample points into polygon shape sample plots data using ArcGIS software. Finally, with reference to the winter wheat cropland map by Qiu et al. (2017) [42] and Google Earth maps, 200 field samples of winter wheat were collected by RTK measurement. According to the characteristics of the winter wheat plot samples in the field survey, another 360 winter wheat plots were selected again from November to May of the following year during the critical growth period of winter wheat based on Google Earth historical images from 2013 to 2019. Eventually, a total of 560 winter wheat plot samples distributed evenly in the study region were obtained for the establishment of extraction rules of winter wheat planting areas and verification of accuracy in planting area extraction in Shandong Province (Figure 1). Among the total 560 samples, 350 samples (100 samples by RTK and 250 samples by Google Earth images) were used for extraction rule establishment, and the remaining 210 samples (100 samples by RTK and 110 samples by Google Earth images) were used for accuracy verification. It must be noted that the winter wheat plot sample area should not be less than 250 m × 250 m in order to match the pixel size of MODIS EVI.

2.3. Methods

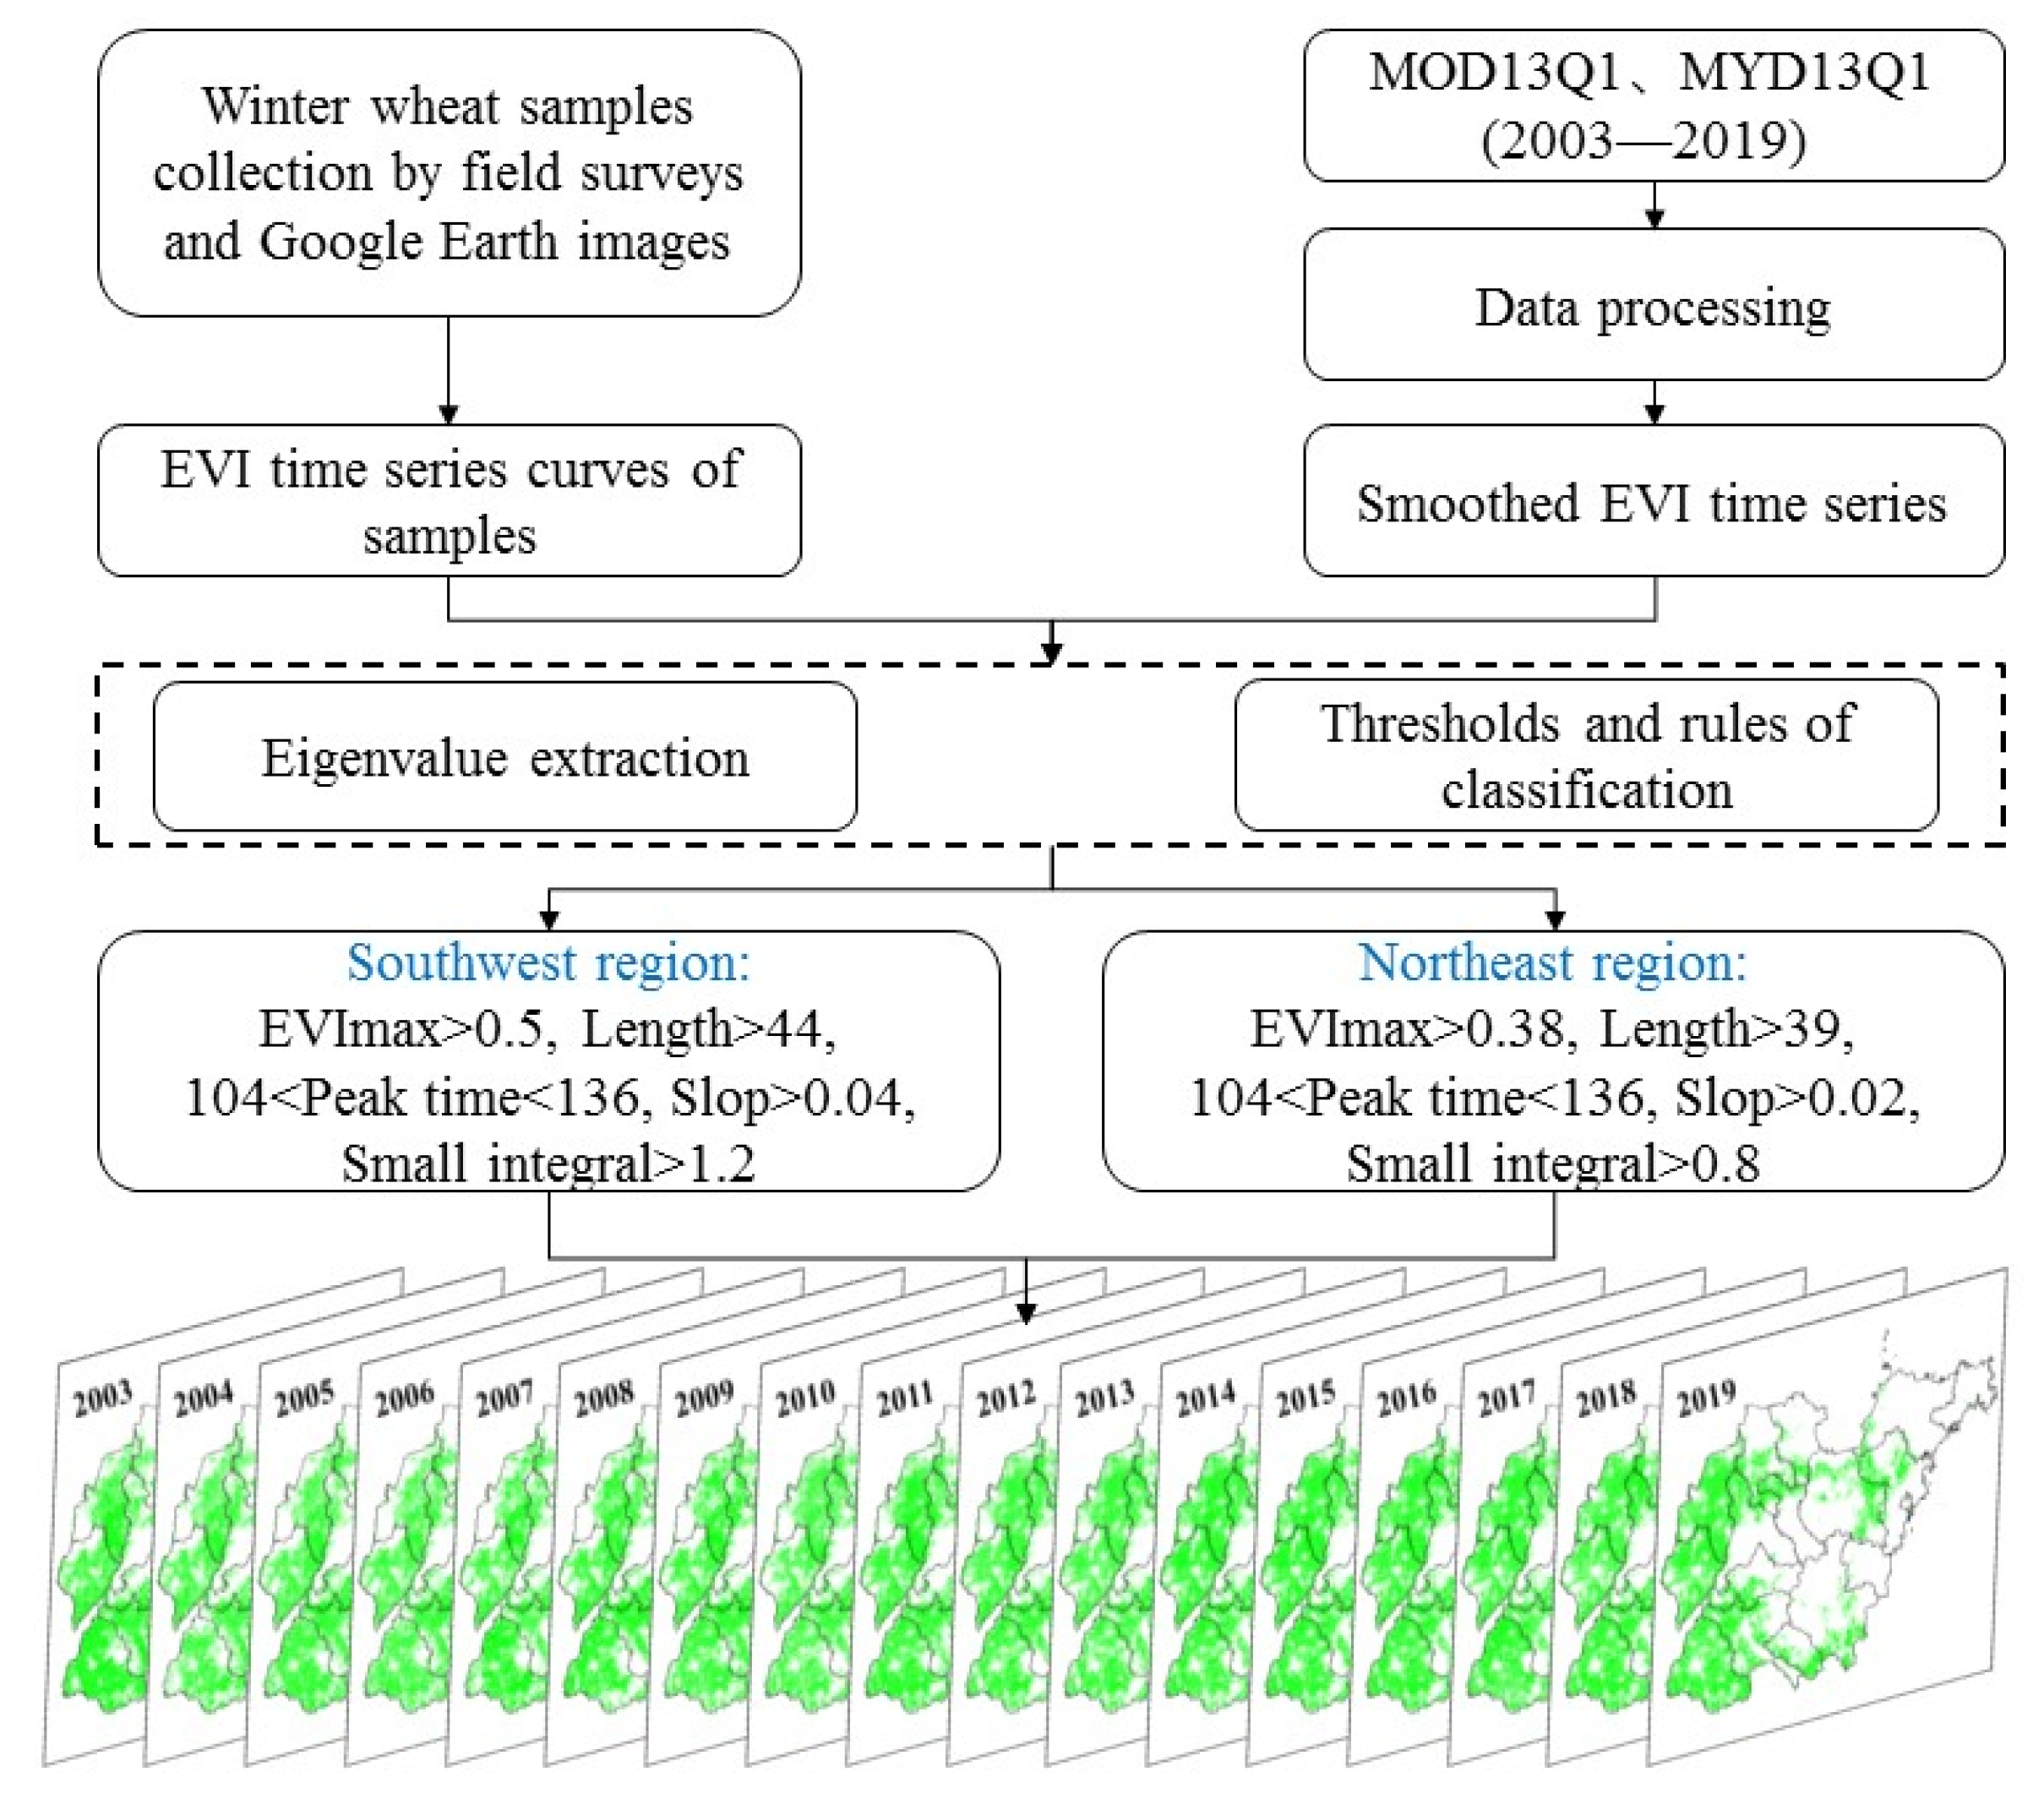
2.3.1. Extraction of Winter Wheat Planting Area and Phenology

In order to reduce cloud contamination and poor atmospheric condition interference, the Savitzky–Golay (S-G) filtering method [47] was employed to smooth the MODIS EVI time series by TIMESAT software (http://www.nateko.lu.se/TIMESAT/, accessed on 20 January 2020) in this study. The S–G filtering method has the advantages of effective smoothing and denoising and preserving the local features of the original data series to the maximum extent [48]. In order to avoid using the planted area of a single year to represent the planted area of all years, the classification threshold method, which classified the morphological characteristic parameters of EVI time series according to different regions of Shandong Province, was used to extract the winter wheat planting area during 2003–2019 year by year based on the field sampling data and the annual growth characteristics of winter wheat. According to the obvious differences in the growth start time and the growth status of winter wheat in Shandong Province, different thresholds of morphological parameters of the filtering curve for EVI time series were set, respectively, in the Southwest and Northeast of Shandong Province in this study (Figure 2).
Combined with the derivation method [27,34], the four major phenological periods (i.e., green-up date, jointing date, heading date, and maturity date) of winter wheat in Shandong Province were extracted furtherly based on the EVI time series (Figure 3). To be more specific, the green-up stage, referring to the period when winter wheat recovered to grow after winter dormancy, was determined as the date when the EVI time series increased by 9% of its maximum value [46]. As the fast-growing period of winter wheat, the jointing stage was identified as the date that the peak value of the first derivative of the EVI time series was reached. The heading stage, characterized as the peak of winter wheat growth, was defined as the date equivalent with the peak of the EVI time series. As the rapid decline period of winter wheat, the maturity stage referred to the date corresponding to the trough value of the EVI derivation time series after the peak value. Moreover, the day of year (DOY) was employed to record the start time of each phenological stage mentioned in this study. The date of January 1 was recorded as the first day of the year, and the DOY of the phenological stage was defined as the day since January 1. It is noteworthy that the average values of the phenological stages in the surrounding area (10 × 10, 100 pixels in total) centered on the pixel, where the agro-meteorological station was located, were calculated and used for the accuracy verification of the winter wheat phenological stages extracted by remote sensing.

2.3.2. Trend Detection

Linear regression was employed to estimate the temporal trends of winter wheat phenological stages at pixel scale in Shandong Province from 2003 to 2019. The calculation formula of slope was as follows:
θ slope = n   × i = 1 n ( i   ×   y i ) i = 1 n i i = 1 n y i n   × i = 1 n i 2 ( i = 1 n i ) 2
where n is the total number of years in the study period, y i is the date of phenological stage in year i , and θ slope is the slope of winter wheat phenological variation trend. When θ slope > 0, the phenology stage shows a delayed trend during the considered period, and when θ slope < 0, an advanced trend of phenology stage is revealed. Furthermore, the statistical significance test of the winter wheat phenological stages trends was conducted by F-test at the 0.05 level in this study.

2.3.3. Correlation Analysis

The Pearson’s correlation coefficient and mean absolute error (MAE) were calculated between the phenological stages retrieved by remote sensing data and ground observations. T-test was used to proceed the significance test at the 0.01 level.
In addition, a spatial correlation was applied to demonstrate the relationships between winter wheat phenological stages and climate factors at pixel scale using the Pearson’s correlation, and the correlation coefficient was calculated by:
R xy = i = 1 n ( x i x ¯ ) ( y i y ¯ ) i = 1 n ( x i x ¯ ) 2 i = 1 n ( y i y ¯ ) 2
where x i is the winter wheat phenological stages of year i , y i indicates the climate factors of year i , n is the number of considered years, x ¯ and y ¯ respectively denote the average values of winter wheat phenological stages and climate factors during the study period, and R xy is the correlation coefficient of phenological stages and climate factors. Correlation results were tested by T-test at the 0.05 level for significance.
Considering that the crop phenology is greatly affected by climate changes at different antecedent times in the preseason [31,37], we thus restricted the candidate preseason periods of climate factors from the current month to the recent three months before the date of the winter wheat phenological stages occurrence, according to previous studies [49,50]. More specifically, the preseason climate factors were defined as Tmean (min, max) 1, Tmean (min, max) 2, and Tmean (min, max) 3 for the monthly average temperature and Pre1, Pre2, and Pre3 for the monthly cumulative precipitation in the current month, the recent two months, and the recent three months, respectively.

3. Results

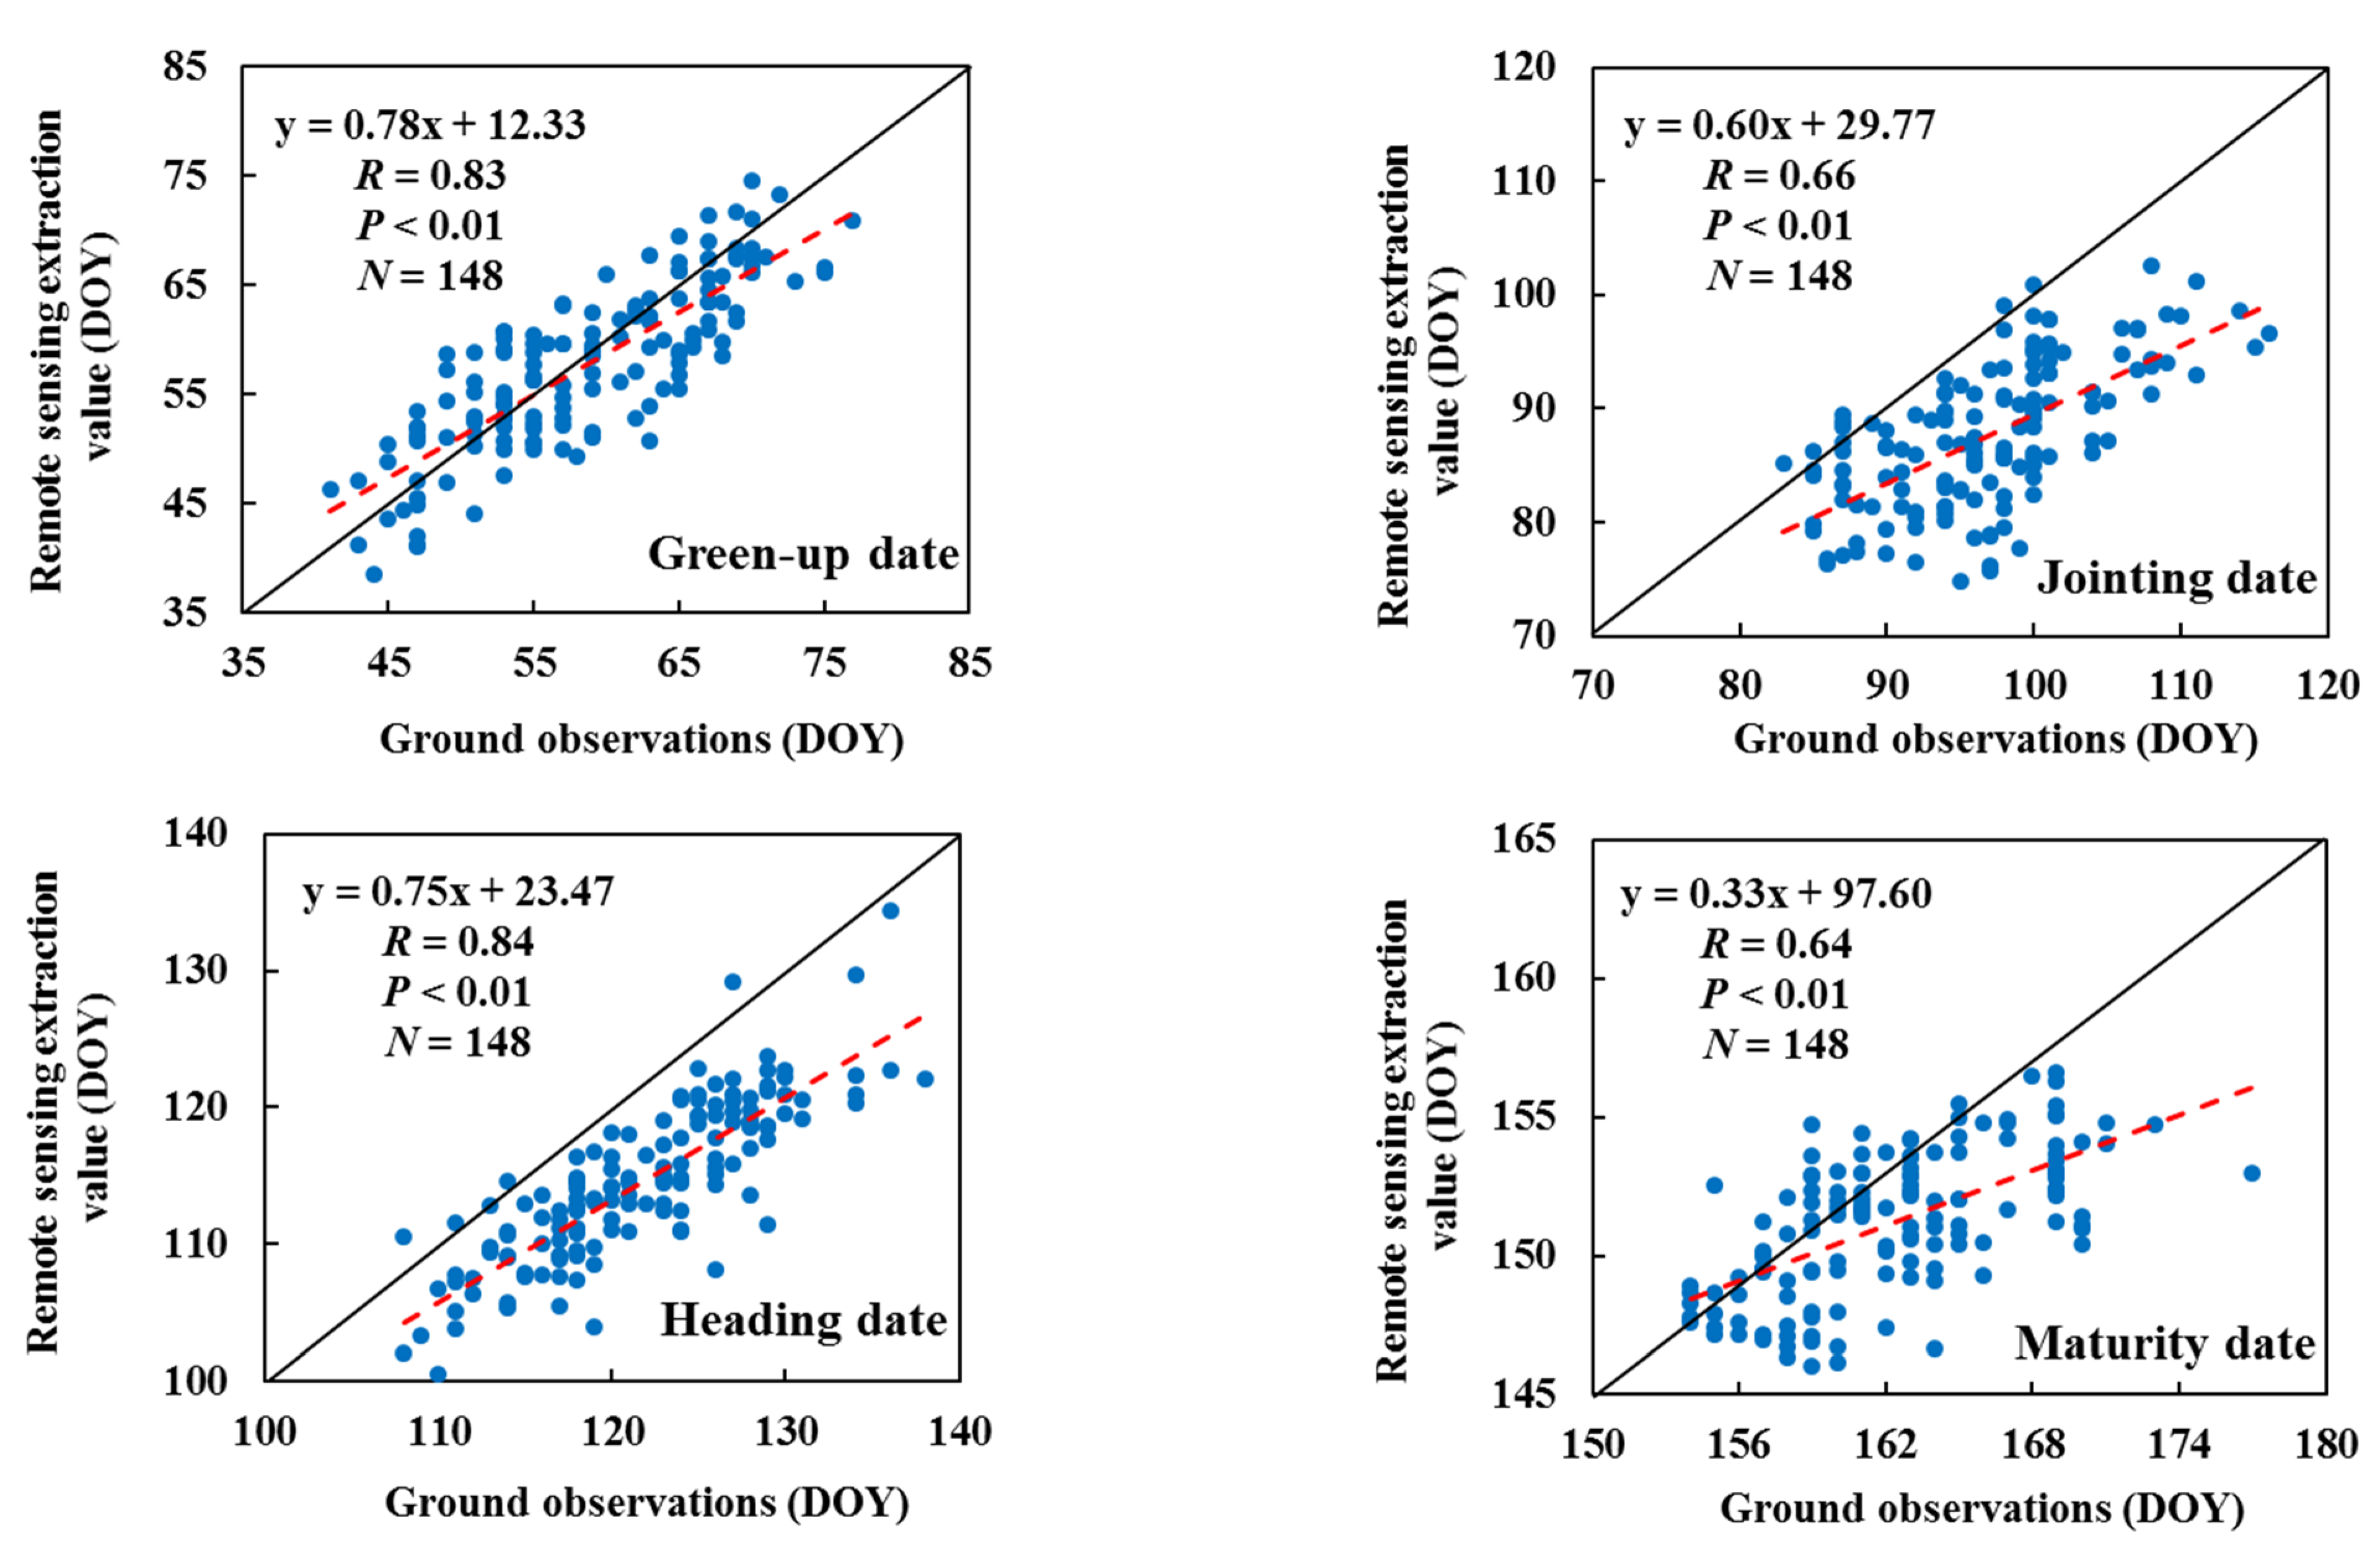
3.1. Winter Wheat Phenology Validation

For the 210 winter wheat samples used for accuracy verification, 190 samples were extracted correctly, and the extraction accuracy was 90.48%. Furtherly, the winter wheat phenological stages extracted by remote sensing were compared against those from the observations at agro-meteorological stations in Shandong Province. Figure 4 demonstrates that the satellite-extracted phenology was highly consistent with the ground observations (p < 0.01). Specifically, the correlation coefficients between satellite-extracted and ground-observed values were 0.83, 0.66, 0.84, and 0.64 for green-up date, jointing date, heading date, and maturity date, respectively. The extraction accuracy of green-up date was the highest (MAE = 4.11 days), followed by heading date (MAE = 7.12 days) and jointing date (MAE = 9.50 days), with the lowest for maturity date (MAE = 11.20 days).

3.2. Spatio-Temporal Pattern in Winter Wheat Phenology

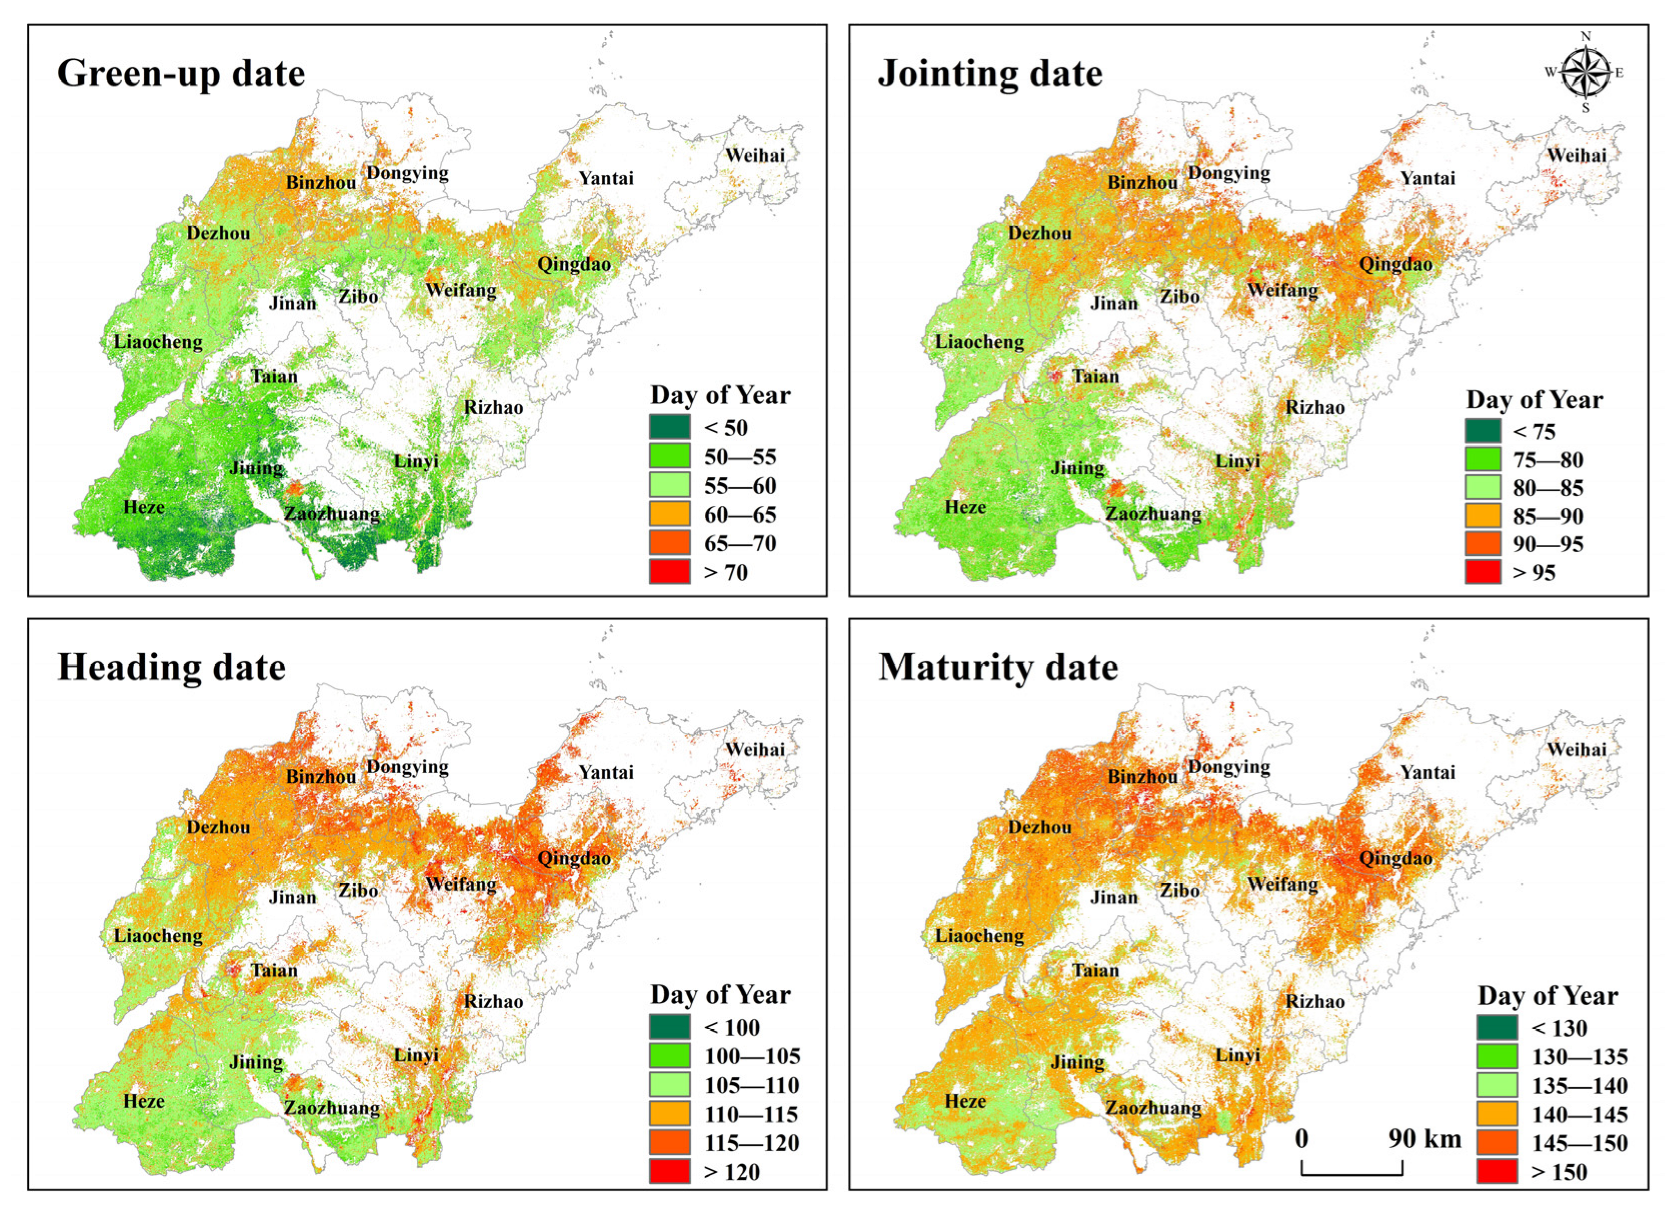
3.2.1. Spatial Pattern in Winter Wheat Phenology

The spatial pattern of multi-year average winter wheat phenological stages during 2003–2019 in Shandong Province is shown in Figure 5 The green-up date, jointing date, heading date, and maturity date of winter wheat generally fell into the ranges of 50–70 DOY, 75–95 DOY, 100–120 DOY, and 130–150 DOY, respectively. We found that winter wheat phenology exhibited a spatial pattern of the South earlier than the North and the inland earlier than the coastal regions. The earliest phenology was detected in the Southwest regions, where the green-up date, jointing date, heading date, and maturity date of winter wheat respectively occurred at approximately 50–60 DOY, 75–85 DOY, 100–110 DOY, and 130–140 DOY. Whereas, the Eastern and Northwestern regions of Shandong Province witnessed the latest phenology of winter wheat, with DOY of 60–70, 85–95, 110–120, and 140–150 for the green-up date, jointing date, heading date, and maturity date, respectively.
To further identify the spatial heterogeneity of winter wheat phenology, the latitudinal and longitudinal shifts in winter wheat phenology stages were also examined (Figure 6). Following the principle of covering as much of the winter wheat growing area as possible, we set up two transect lines along 116°52′E and 36°57′N, respectively, with the former running through the inland area of Western Shandong Province from south to north and the latter extending from the inland to the coast from west to east (Figure 6a). A total of 100 sample points were collected evenly along each transect line, and the latitudinal and longitudinal shifts of winter wheat phenological stages were quantitatively calculated after excluding the samples falling into non-winter wheat pixels. It was found that the winter wheat green-up date, jointing date, heading date, and maturity date were respectively delayed by 3.93 days/0.43 days, 2.31 days/1.19 days, 2.80 days/1.14 days, and 2.12 days/1.09 days for every 1° increase in latitude (Figure 6b)/longitude (Figure 6c). It was obvious that the later the changes in winter wheat phenology occurred, the higher the latitude and the closer the location to the sea. Moreover, the latitudinal shifts of winter wheat phenology were steeper than the longitudinal in Shandong Province.

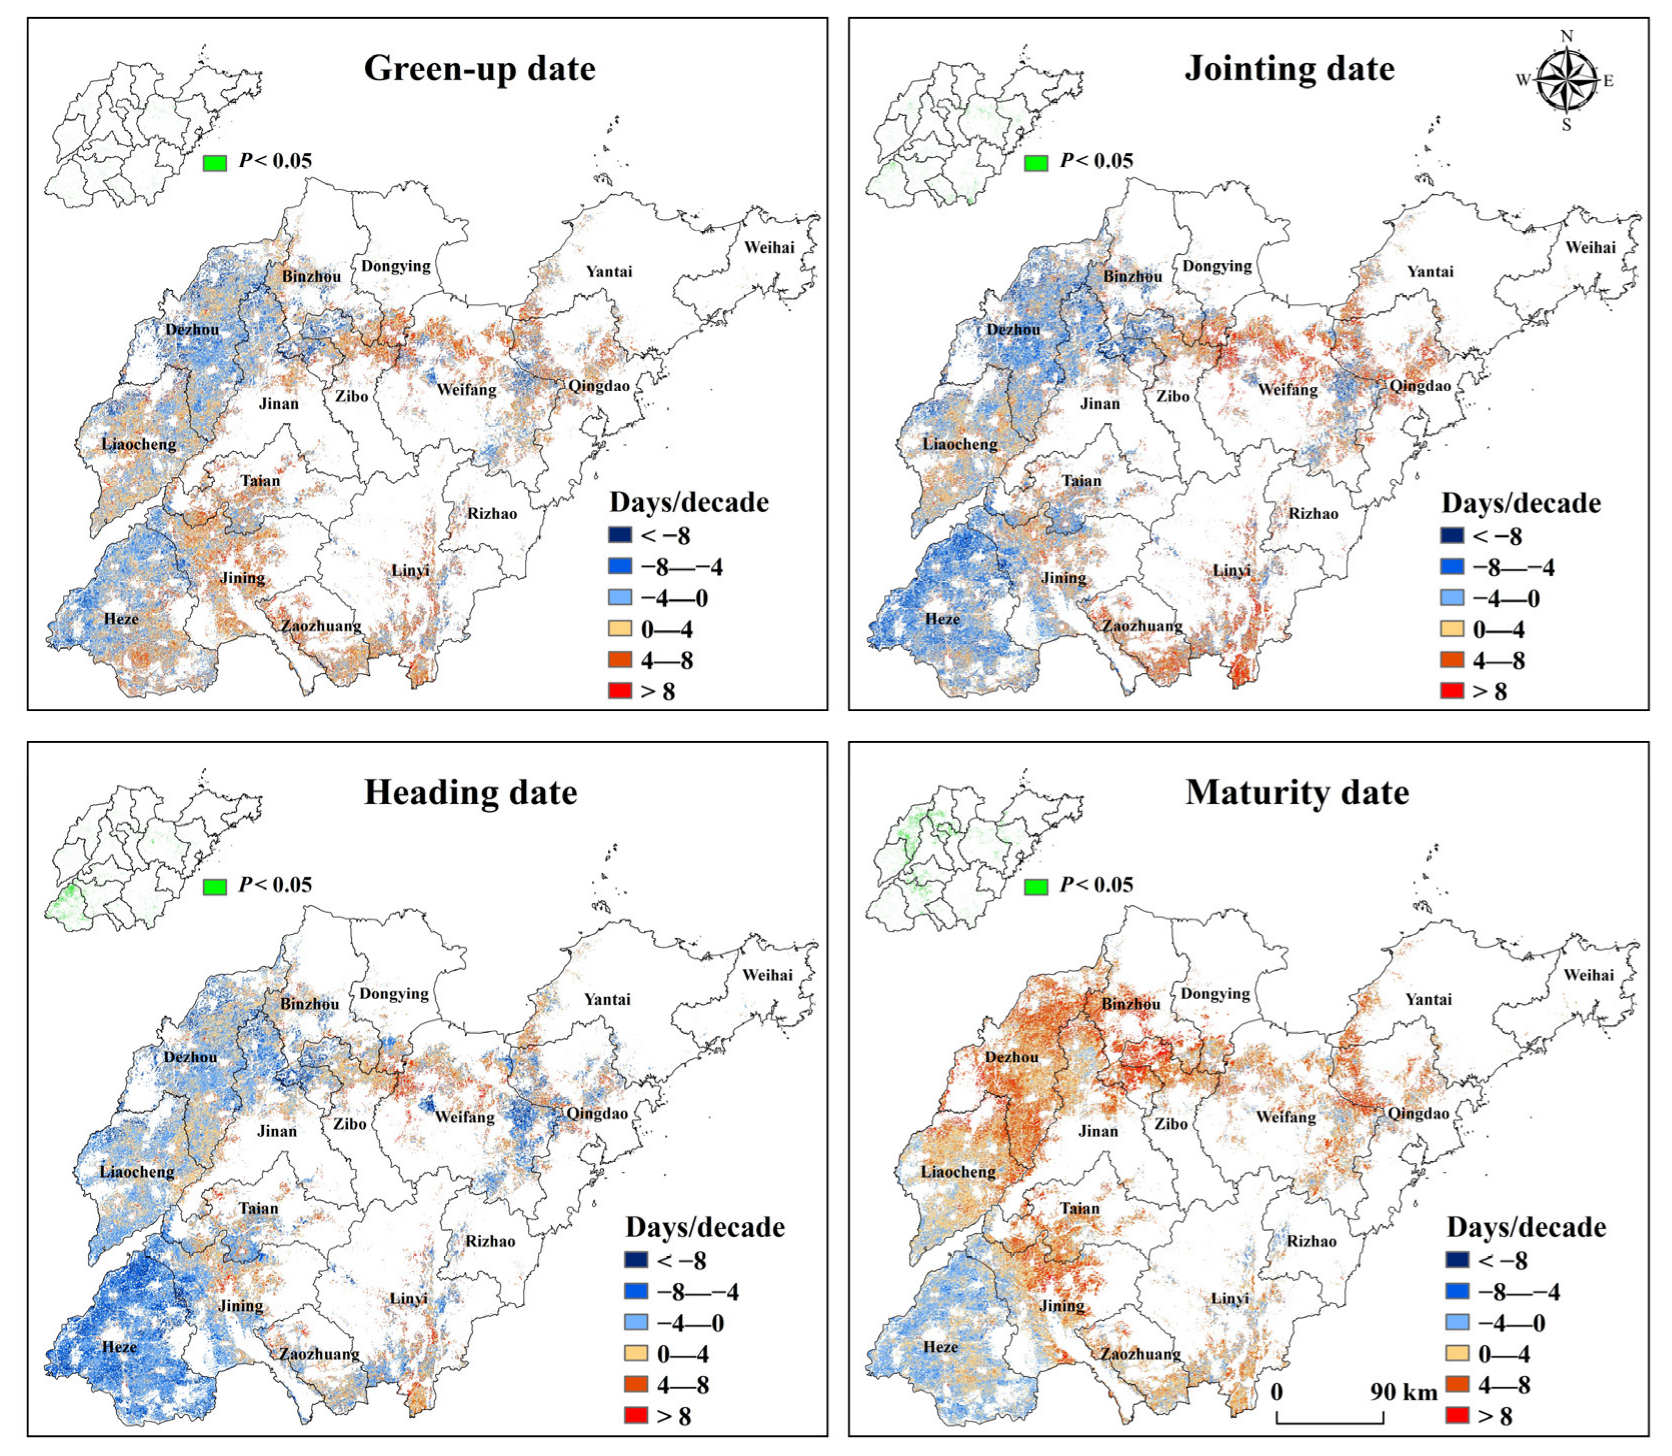
3.2.2. Temporal Trends in Winter Wheat Phenology

Figure 7 reveals the change trends of the key winter wheat phenological stages at pixel scale from 2003 to 2019 in Shandong Province. The green-up date, jointing date and maturity date of winter wheat was delayed in 53.33%, 51.23%, and 72.40% of the pixels, presenting a trend rate of 0–8.00 days/decade on the whole. The areas where the green-up date and jointing date tended to be delayed were generally located in the coastal areas, such as Weifang, Dongying, and Qingdao, as well as in the Southern regions, such as Jining, Zaozhuang, and Linyi. The trend of delayed maturity date was widely observed in other winter wheat planting areas in Shandong Province, except Heze. There were, respectively, 46.67%, 48.77%, and 27.60% of the pixels showing an advanced trend with a dominant trend rate of −4.00–0 days/decade for green-up date, jointing date and maturity date. The regions with advanced green-up date and jointing date were primarily situated in Dezhou, Liaocheng, and Heze in the West of Shandong Province, while those areas with advanced maturity dates were mainly distributed in Heze.
Approximately 1.51%/0.71%, 2.94%/1.87%, and 11.18%/0.53% of the pixels with delayed/advanced tendency passed the significance test at p < 0.05 for green-up date, jointing date, and maturity date, respectively. Except that the pixels with a significance of delayed maturity date were generally concentrated in the Northwest of Shandong Province; the spatial pattern of the three phenological stages with significant changes was scattered in the study area.
Different from the other three phenological stages, the variation of winter wheat heading date was dominated by an advanced tendency, with a trend rate mainly between −8.00–0 days/decade. The area with an advanced trend accounted for 62.58% of the total pixels, generally located in the Western region of Shandong Province. A delayed trend with a primary rate of 0–4.00 days/decade for heading date was found in 37.42% of the pixels, which was distributed in other winter wheat planting areas. There were nearly 5.36% and 1.70% of the pixels presenting a significance advanced and delayed trend (p < 0.05) for heading date, respectively. In addition to the North of Heze, where the remarked advance trend was very concentrated, the spatial distribution of the regions with significant change trend of heading date was scattered.

3.3. Correlations between Winter Wheat Phenology and Climate Factors

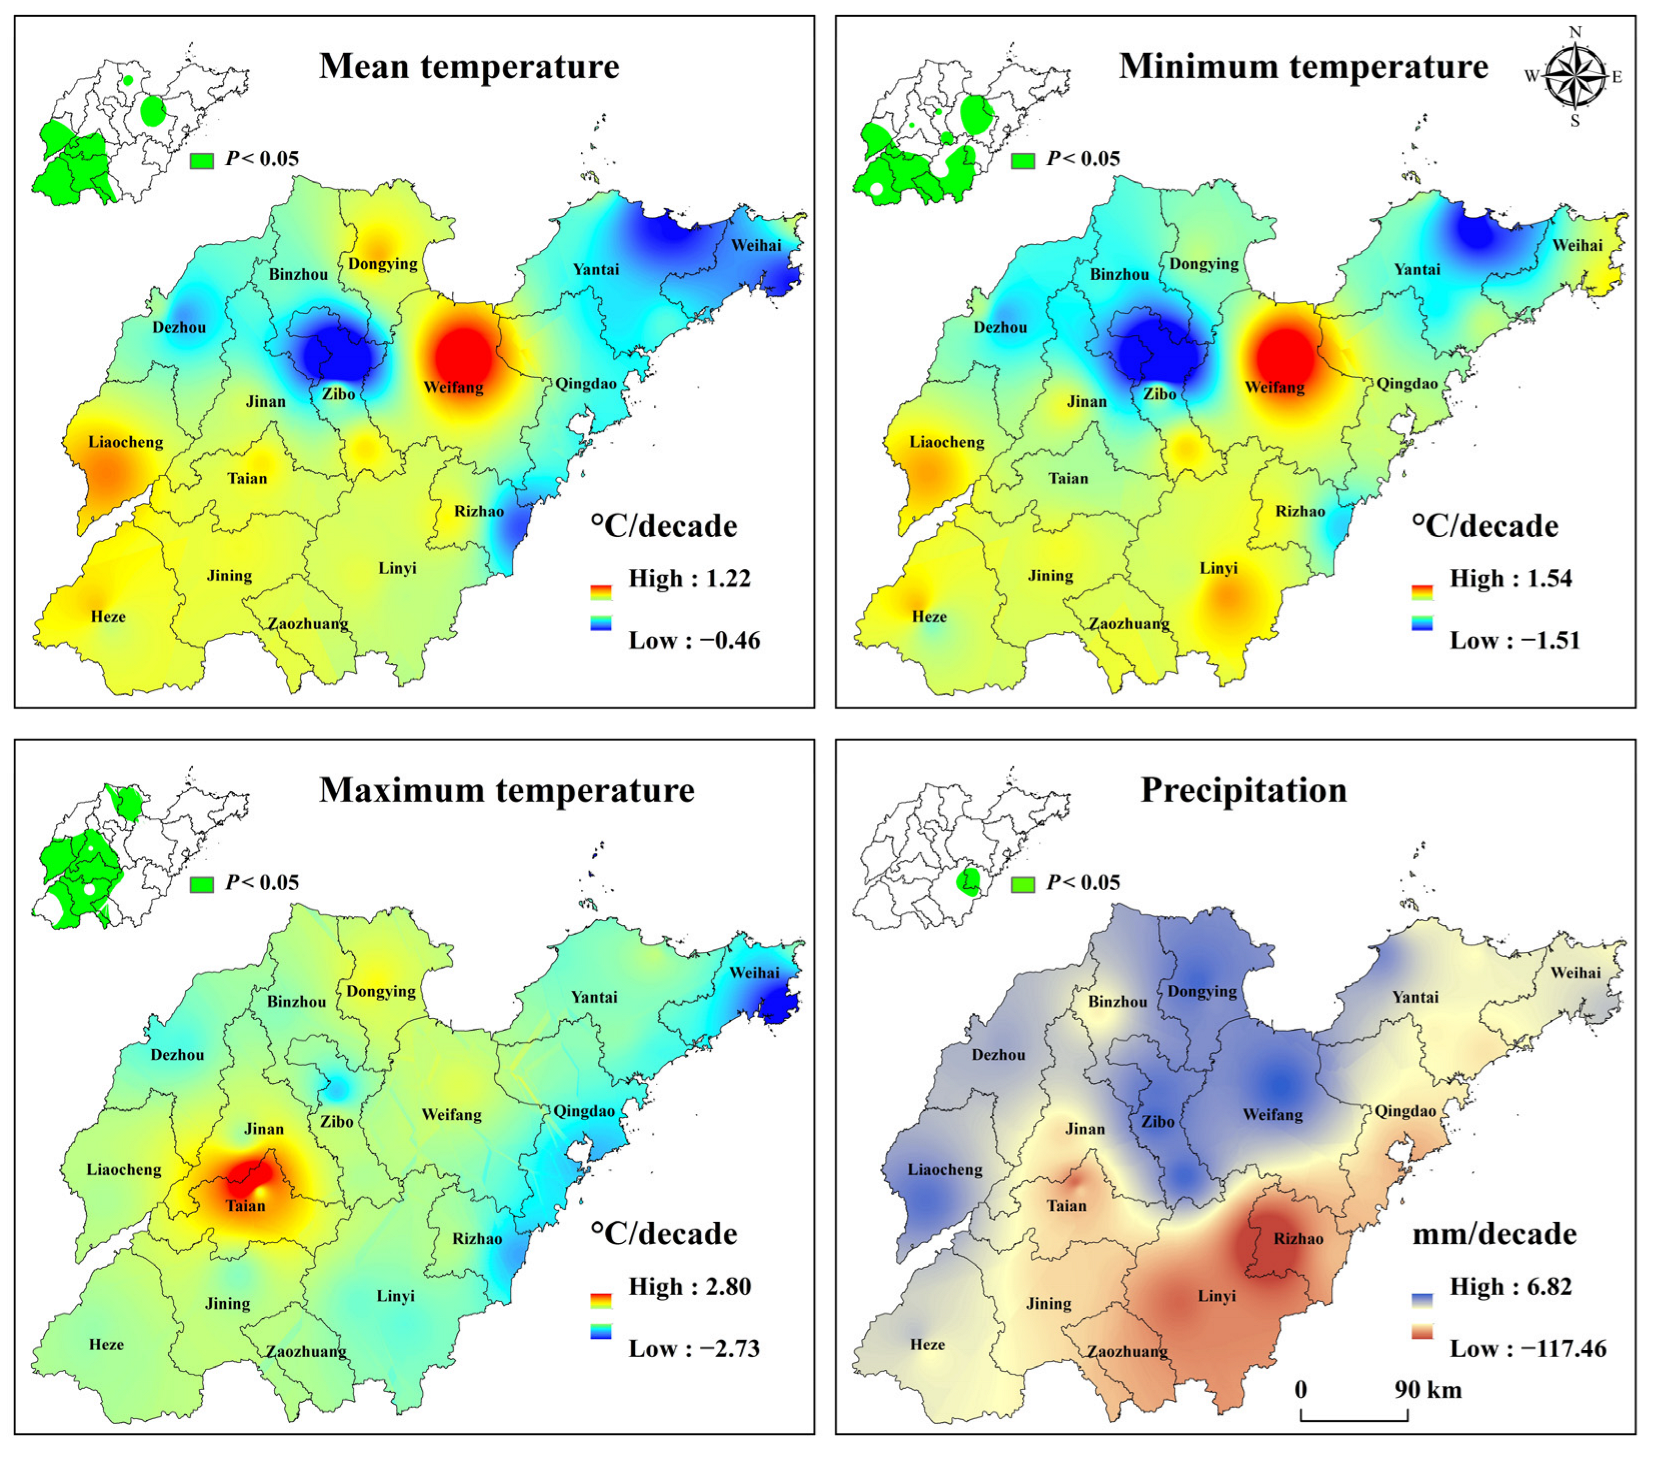
3.3.1. Temporal Trends in Climate Factors

The temporal trends of mean, minimum, maximum temperature, and precipitation during winter wheat seasons from 2003 to 2019 in Shandong Province are displayed in Figure 8. The change rates of mean and minimum temperature were between −0.46–1.22 °C/decade and −1.51–1.54 °C/decade, respectively, and the most common variation of mean and minimum temperature in Shandong Province was 0–1.00 °C/decade, however, only the change trend in Southwest Shandong and Weifang passed the significance test at the 0.05 level. The change rate of maximum temperature was −2.73–2.80 °C/decade during 2003–2019, and a significantly upward dominant trend across Shandong Province was detected. Additionally, the variability of precipitation ranged from −117.46–6.82 mm/decade from 2003 to 2019 in Shandong Province. Apart from sporadic areas, such as Dongying, precipitation in Shandong Province presented a general downward trend. A declining rate of precipitation in Southeast Shandong (−100.00–−50.00 mm/decade) was commonly higher than in the other parts of Shandong (−50.00–0 mm/decade), but only the downward trend of precipitation in Rizhao passed the significance test. Overall, the climate change in Shandong Province was warm and dry during winter wheat seasons from 2003 to 2019, which could pose a challenge to both farmers and agricultural administration.

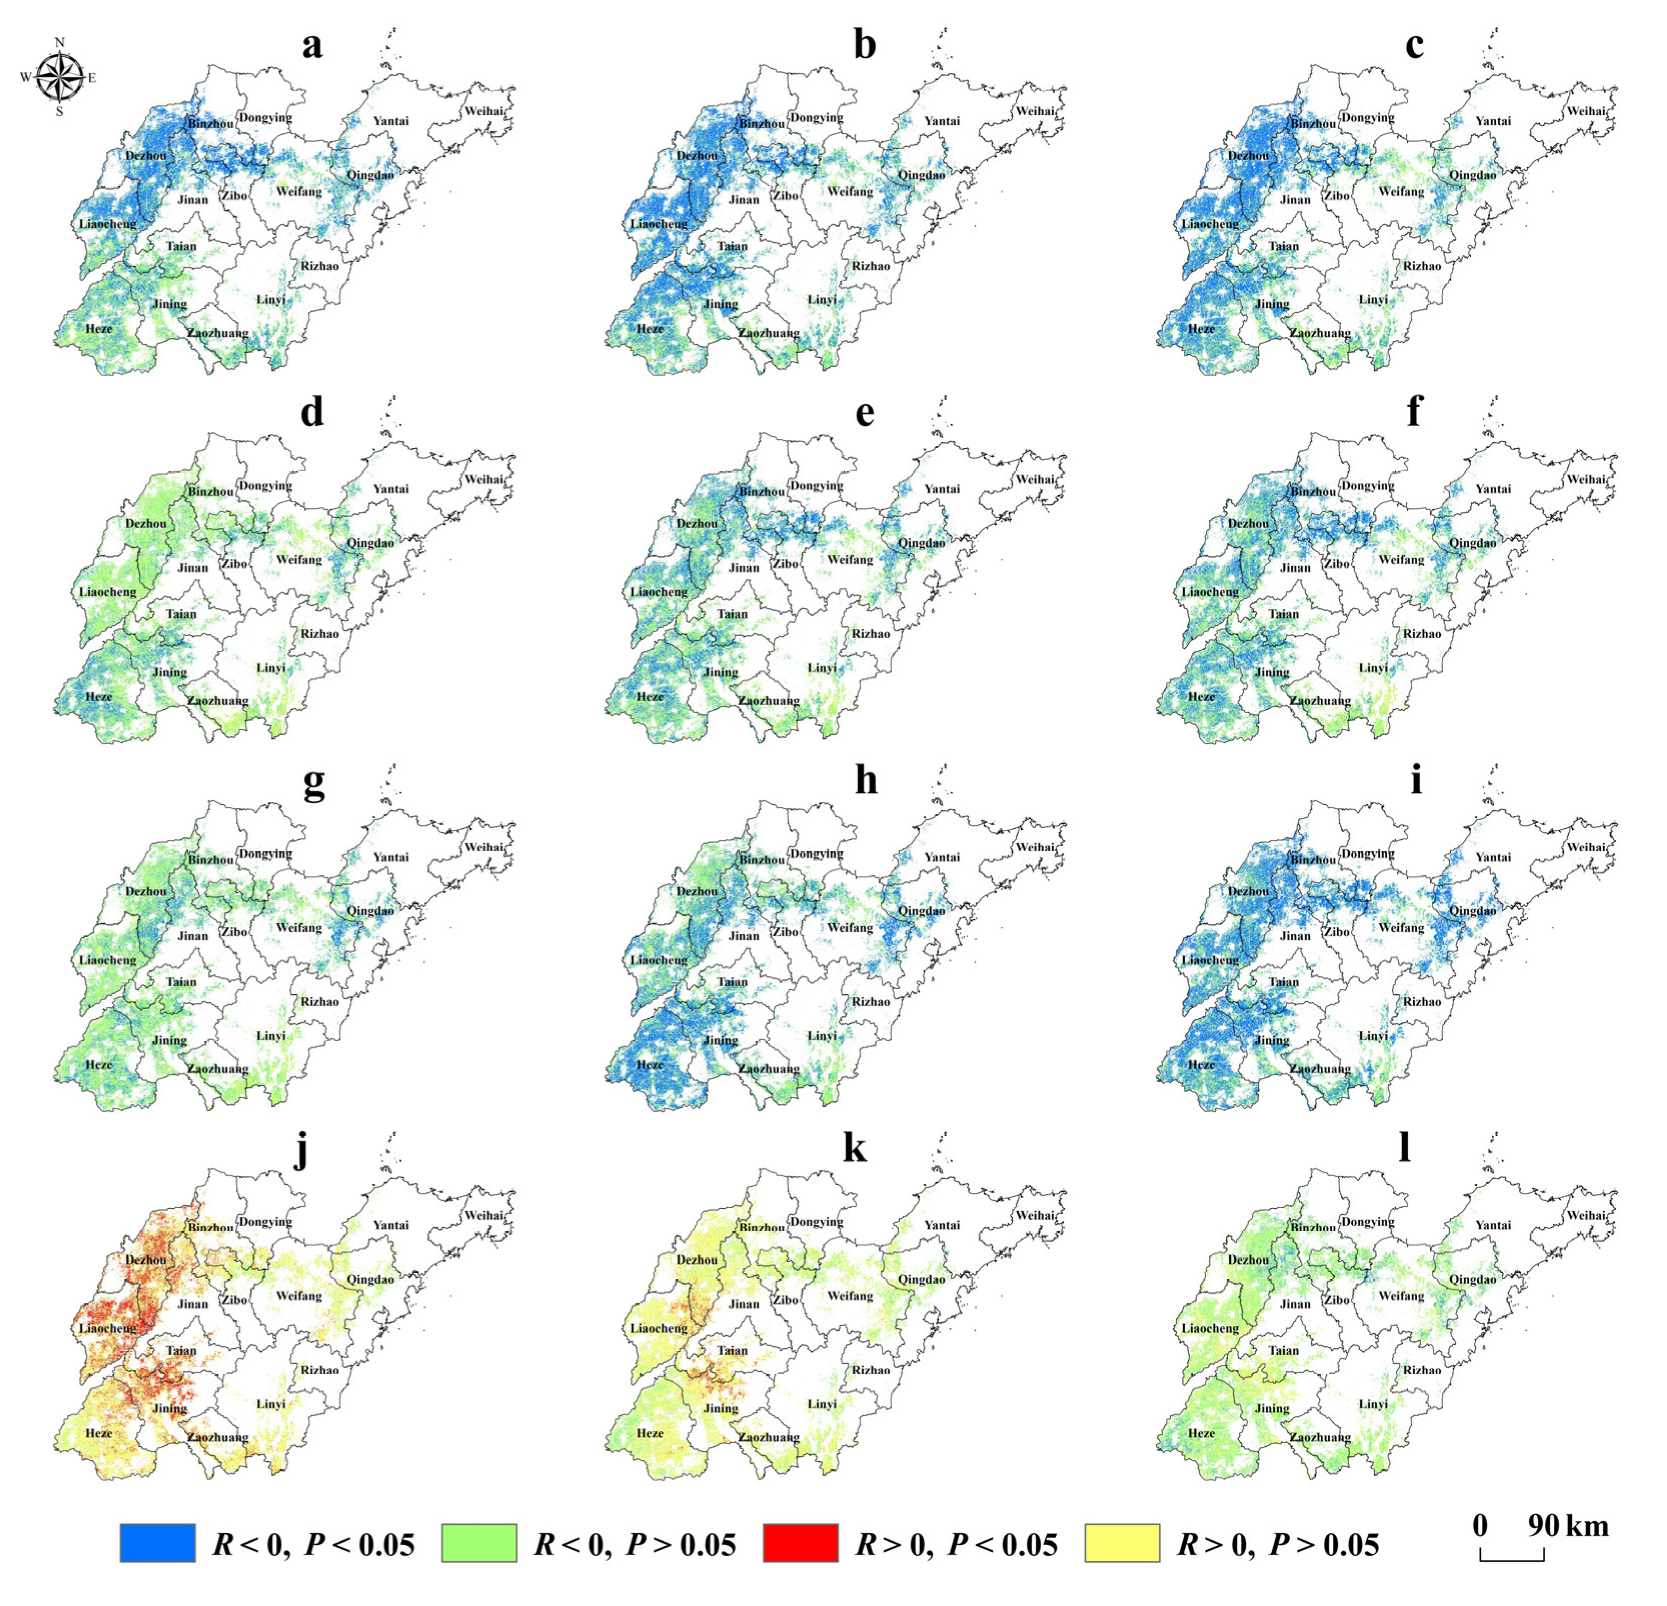
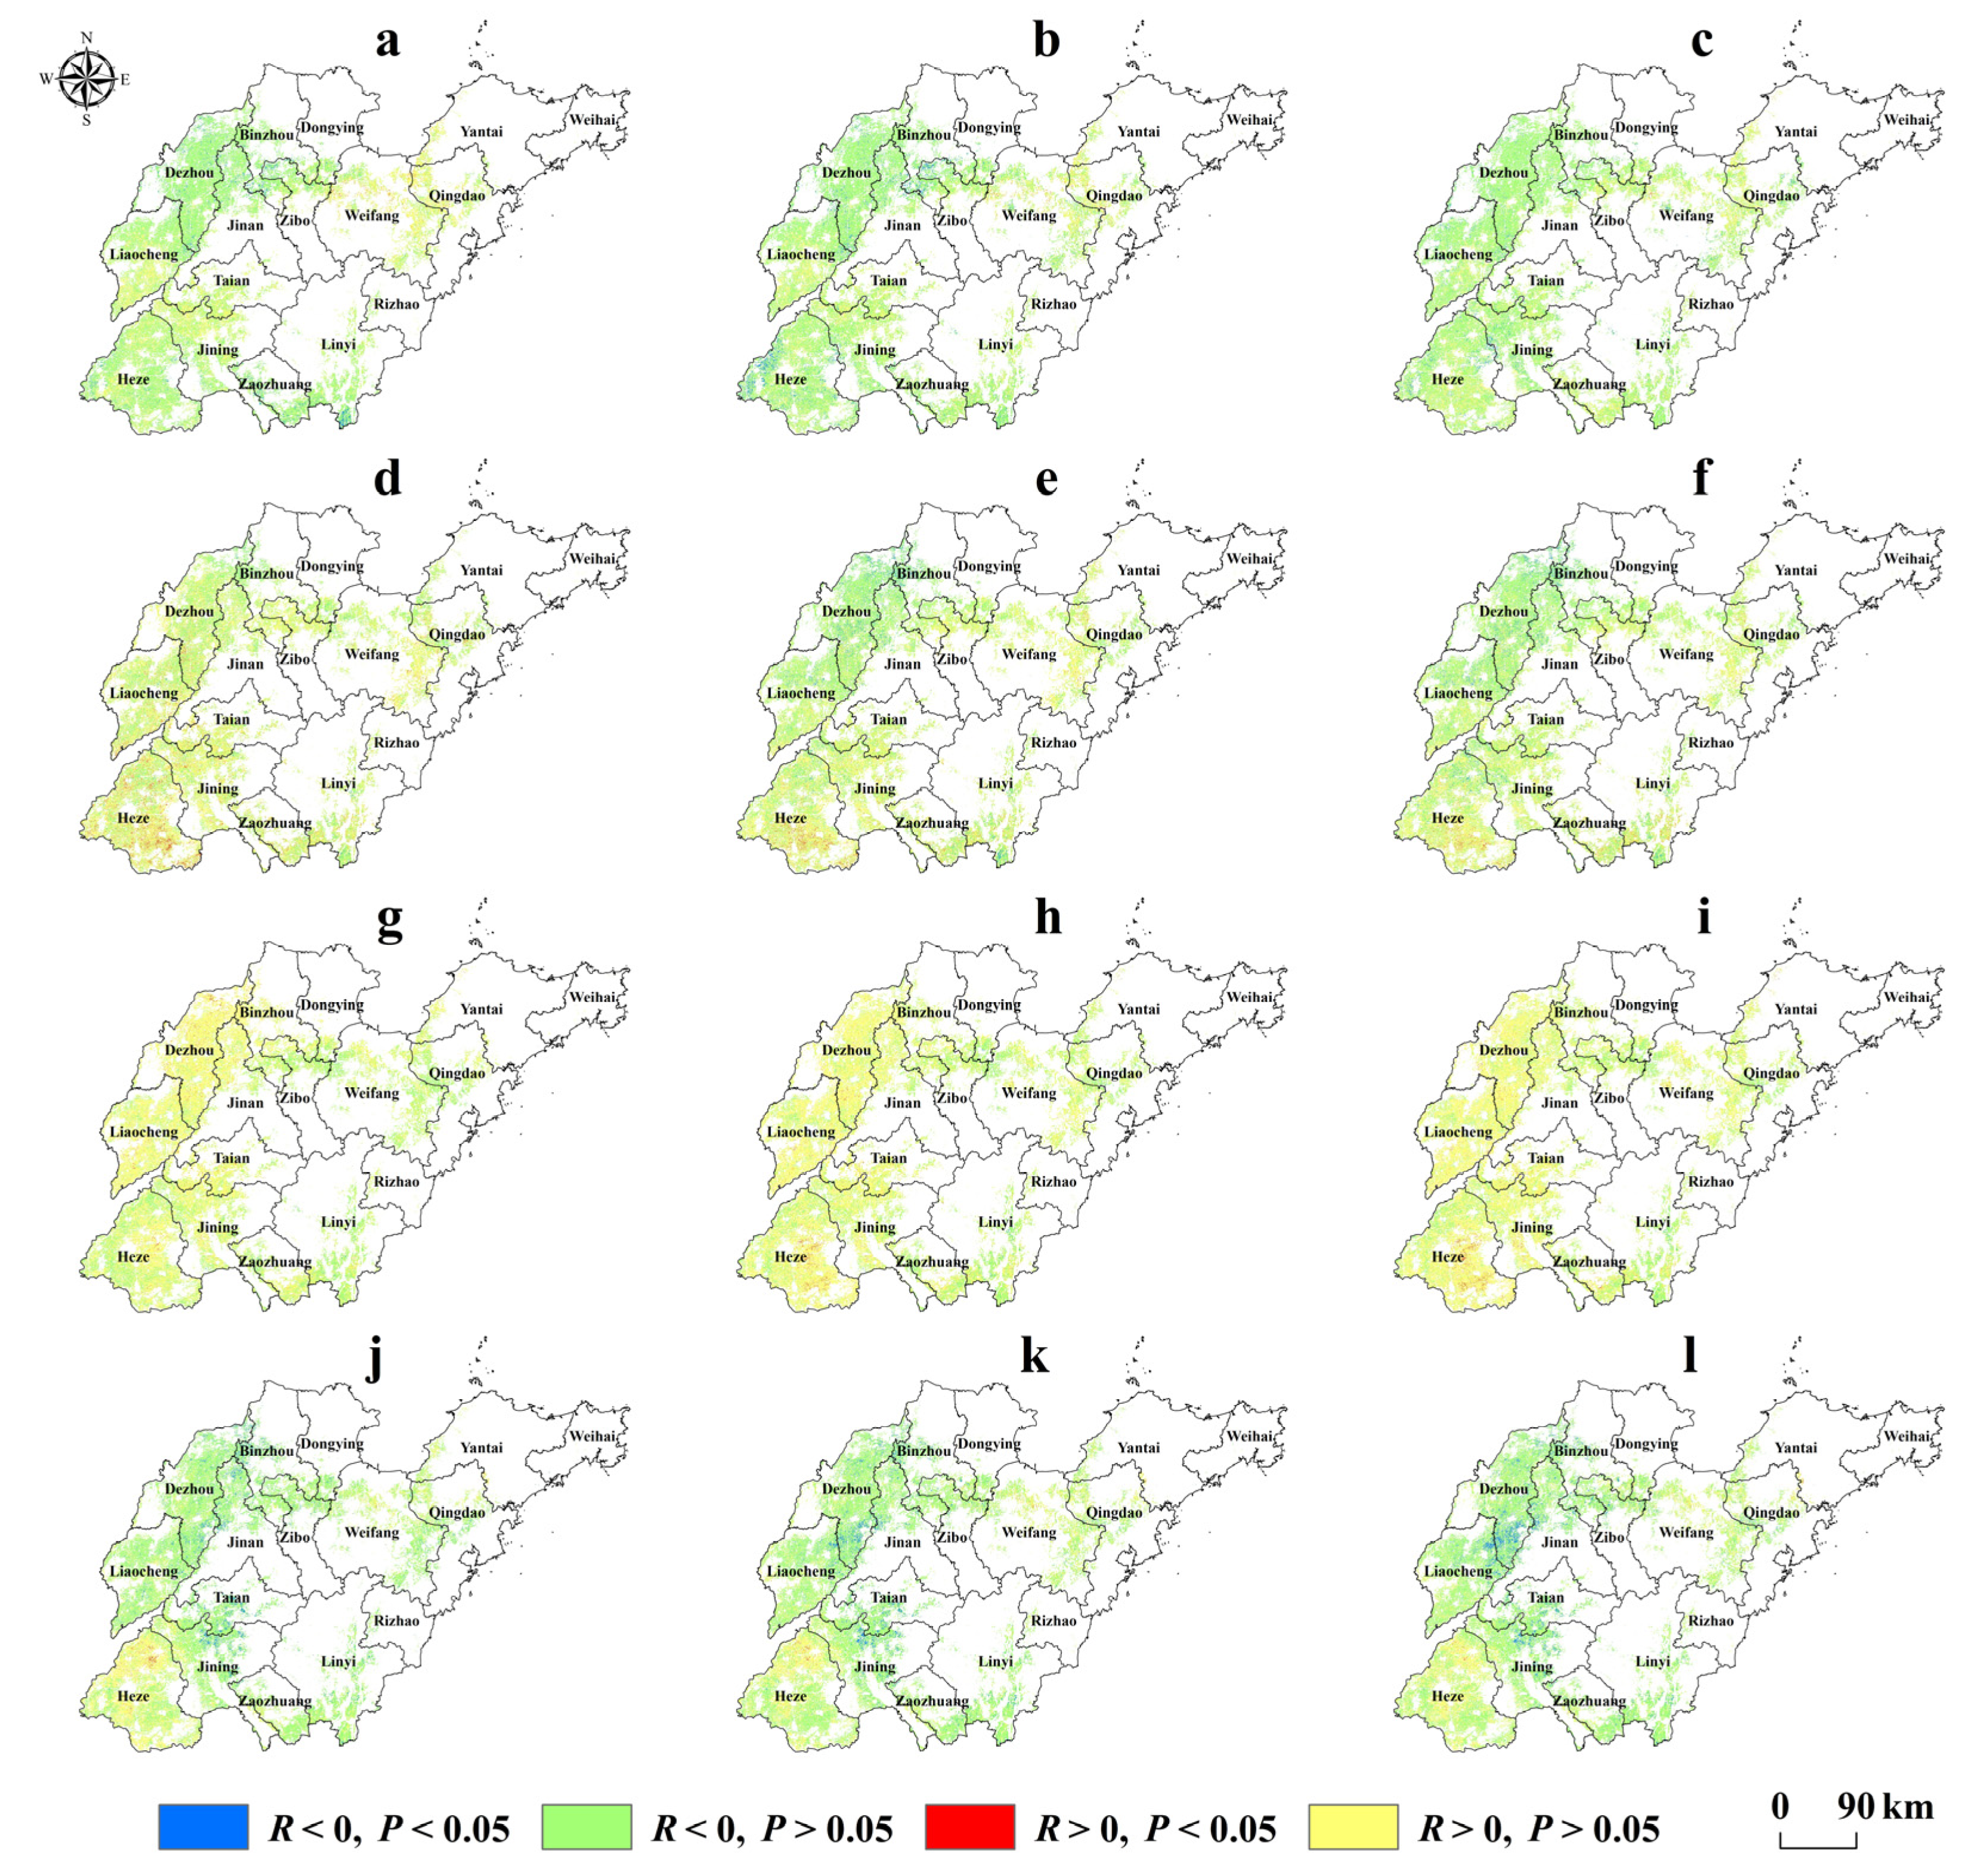
3.3.2. Correlations between Winter Wheat Phenology and Temperature

(1)
Mean temperature
Figure 9 shows the spatial pattern of the Pearson’s correlation coefficient between the key winter wheat phenological stages and mean temperature.
There was a generally negative correlation between winter wheat green-up date9aand Tmean1 (Figure 9a), Tmean2 (Figure 9b), and Tmean3 (Figure 9c) in 97.10%, 97.96%, and 97.08% of the pixels of which 47.68%, 56.58%, and 47.32% passed the significance test at p < 0.05, respectively. The pixels with a significantly negative correlation were universally located in the winter wheat growing area of Shandong Province, implying that the winter wheat green-up date in the study region could advance noticeably with a higher mean temperature.
Of the total pixels presented, 91.62%, 95.85%, and 95.73% had a negative correlation between jointing date and Tmean1 (Figure 9d), Tmean2 (Figure 9e), and Tmean3 (Figure 9f), respectively. A significant negative association between the jointing date and Tmean2 in 38.96% of the pixels and Tmean3 in 43.30% of the pixels was detected in the winter wheat growing area of Shandong Province, indicating a marked promotion of the mean temperature in the recent two and three months to the advancement of winter wheat jointing date. Only 18.11% of the total pixels, which were commonly located in parts of the Southwest region, showed a significant negative correlation between jointing date and Tmean1.
A general negative relevance was found in 93.05%, 97.76%, and 98.85% of the pixels between heading date and Tmean1 (Figure 9g), Tmean2 (Figure 9h), and Tmean3 (Figure 9i), respectively. The heading date between Tmean2 in 48.27% of the pixels and Tmean3 in 62.22% of the pixels presented a significantly negative connection in the winter wheat planting area of Shandong Province, which meant that mean temperature in the recent two and three months would greatly advance the winter wheat heading date in Shandong Province. However, there were just 17.46% of the total pixels showing a significant negative relationship between heading date and Tmean1 in the South of Dezhou and the junction areas of Qingdao-Weifang.
The maturity date correlated positively with Tmean1 (Figure 9j) and Tmean2 (Figure 9k) in 90.89% and 68.85% of the pixels of which 22.91% and 5.78% passed the significance test at p < 0.05, respectively. The significant positive correlation between maturity date and Tmean1 and Tmean2 was generally found in the West of Shandong Province, revealing a general delayed impact of mean temperature in the current month and the two recent months on winter wheat maturity date. However, Tmean3 and maturity date were mainly negatively correlated (Figure 9l), and the proportion of the pixels with a negative relationship was 72.10%, with 4.28% pixels that were generally concentrated in the winter wheat cultivation area along the Northern coast of Shandong Province, having passed the significance test at p < 0.05.
(2)
Minimum temperature
The spatial distribution of the Pearson’s correlation coefficient between the key winter wheat phenological stages and minimum temperature is shown in Figure 10.
In approximately 97.48%, 97.85, and 96.95% of the pixels, a negative relationship between green-up date and Tmin1 (Figure 10a), Tmin2 (Figure 10b), and Tmin3 (Figure 10c) was detected, of which 48.95%, 58.59%, and 56.64% passed the significance test at p < 0.05, respectively. The pixels with a significant negative correlation were distributed widely in the winter wheat growing areas, especially in the West of Shandong Province, which indicated that a higher minimum temperature most likely caused the advance of winter wheat green-up date during the study period.
A general negative relevance was found in 92.15%, 95.03%, and 95.07% of the pixels between jointing date and Tmin1 (Figure 10d), Tmin2 (Figure 10e), and Tmin3 (Figure 10f), with 18.71%, 36.45%, and 40.56% having passed the significance test of correlation (p < 0.05), respectively. It was obvious that minimum temperature in the recent two and three months significantly correlated with jointing date, with the negative correlation coefficient generally increased from inland to coastal areas in Shandong Province, which indicated that minimum temperature in the recent two and three months was considerably responsible for the advance of winter wheat jointing date, with a stronger promotion effect inland than in coastal areas.
The heading date was negatively correlated with Tmin1 (Figure 10g), Tmin2 (Figure 10h), and Tmin3 (Figure 10i) in 94.50%, 97.83%, and 98.78% of the pixels of which 20.58%, 47.03%, and 61.10% showed a significant association (p < 0.05), respectively. In comparison, minimum temperature in the recent two and three months, especially the latter, demonstrated a more widely noticeable relevance between heading date in Shandong Province.
For maturity date, a positive correlation was identified with Tmin1 in 89.34% (Figure 10j) of the pixels and Tmin2 in 67.59% (Figure 10k) of the pixels, with 23.19% and 3.99% revealing a significant relation (p < 0.05) and generally distributed in the West of Shandong Province. On the contrary, a negative correlation was detected in 80.06% of the pixels between maturity date and Tmin3 (Figure 10l), with approximately 6.62% of the pixels scattering in the Northern coastal areas and showing a remarkably correlation (p < 0.05).
(3)
Maximum temperature
Figure 11 displays the spatial distribution of the Pearson’s correlation coefficient between the key winter wheat phenological stages and maximum temperature.
Winter wheat green-up date with 69.30%, 63.94%, and 73.62% of the pixels presented a negative relevance with Tmax1 (Figure 11a), Tmax2 (Figure 11b), and Tmax3 (Figure 11c), and 6.31%, 8.70%, and 5.59% passed the significance test at the 0.05 level, respectively, which were mainly located in the West of Shandong Province as well as parts of winter wheat growing areas in Qingdao and Weifang.
In nearly 51.61%, 54.92%, and 54.48% of the pixels a negative correlation between jointing date and Tmax1 (Figure 11d), Tmax2 (Figure 11e), and Tmax3 (Figure 11f) was found of which 5.09%, 9.15%, and 11.03% passed the significance test at p < 0.05, respectively. The pixels presented a significant negative correlation mainly distributed in the Northwest of Heze, Southwest of Shandong Province, as well as parts of Qingdao and Weifang. The remaining pixels which showed a positive relevance between jointing date and preseason maximum temperature commonly situated in the South of Shandong Province, and only a few pixels passed the significance test of correlation (Tmax1: 1.64%, Tmax2: 1.57%, Tmax3: 1.80%). It can be seen that the preseason maximum temperature has generally taken an insignificant effect on the winter wheat jointing date in Shandong Province.
The heading date correlated positively/negatively with Tmax1 (Figure 11g), Tmax2 (Figure 11h), and Tmax3 (Figure 11i) in 56.03%/43.97%, 46.74%/53.26%, and 45.66%/54.34% of the pixels of which 3.05%/1.58%, 10.32%/1.00%, and 12.47%/0.98% presented a significant correlation (p < 0.05), respectively. Similar to the jointing date, the proportion of the pixels showed a significant correlation between heading date and maximum temperature in preseason, which was relatively small, demonstrating that few areas showed a critical effect of maximum temperature on winter wheat heading date in Shandong Province.
There were, respectively, 92.46%, 77.70%, and 66.32% of the pixels displaying a positive correlation between maturity date and Tmax1 (Figure 11j), Tmax2 (Figure 11k), and Tmax3 (Figure 11l), with 19.47%, 9.37%, and 5.93% passed the significant test at p < 0.05 accordingly. The pixels with a significant positive correlation were generally found in the West of Shandong Province. Whereas, the proportion of pixels showing a negative relevance was relatively small, and the significance of a negative correlation between the maturity date and the maximum temperature was generally not obvious.

3.3.3. Correlations between Winter Wheat Phenology and Precipitation

The spatial distribution of the Pearson’s correlation coefficient between the key winter wheat phenological stages and precipitation is shown in Figure 12.
Almost 71.05%, 75.84%, and 76.72% of the pixels presented a negative correlation between green-up date and Pre1 (Figure 12a), Pre2 (Figure 12b), and Pre3 (Figure 12c) of which 2.73%, 3.99%, and 3.12% passed the significance test at p < 0.05, respectively. The pixels with a negative association between green-up date and precipitation were generally distributed in the western inland region, and the remaining pixels showing a positive correlation were commonly found in the Eastern coastal areas. However, the significance of the correlation was universally weak, indicating that the effect of precipitation on the winter wheat green-up date was not noticeable in Shandong Province.
With respect to the correlation between jointing date and precipitation, we found that 44.47%, 56.62%, and 61.17% of the pixels showed a negative relevance for Pre1 (Figure 12d), Pre2 (Figure 12e), and Pre3 (Figure 12f), with 1.02%, 2.74%, and 2.94% passing the significance test at p < 0.05, respectively, which were generally located in the Northwest of Shandong Province. In addition, of those pixels with a positive correlation between jointing date and precipitation commonly situated in the Southern inland and Eastern coast, only 3.28%, 1.62%, and 1.25% showed a significant relationship.
The proportion of pixels with a positive/negative correlation between heading date and Pre1 (Figure 12g), Pre2 (Figure 12h), and Pre3 (Figure 12i) was, respectively, 63.87%/36.13%, 66.33%/33.67%, and 67.98%/32.02%. The pixels with a positive correlation between heading date and precipitation were detected in the West of Shandong Province, and those pixels presenting a negative relevance were found in parts of winter wheat growing areas on the Eastern coast, whereas the significance of either negative or positive correlation was not yet obvious on the whole.
The maturity date correlated negatively with Pre1 (Figure 12j), Pre2 (Figure 12k), and Pre3 (Figure 12l) in 73.69%, 74.90%, and 75.22% of the pixels of which 4.11%, 4.35%, and 5.49% passed the significance test at p < 0.05, respectively. The pixels with a remarkably negative relationship between maturity date and cumulative precipitation were usually distributed in the Northwest of Shandong Province. The maturity date of the rest of the pixels, which were generally located in the Southwest and the Eastern coastal areas, were positively correlated with precipitation, but only a few pixels presented a noticeable correlation.

4. Discussion

4.1. Winter Wheat Phenology and Its Changes

Based on MODIS EVI, we found that the four key phenological stages, i.e., green-up date, heading date, jointing date, and maturity date in Shandong Province, China presented a spatial pattern of the South earlier than the North, which was consistent with the latitude gradient of winter wheat phenology in Northern China disclosed by previous studies [36,41,43,50,51]. In addition, we also discovered a longitudinal shift of winter wheat phenology from West to East in Shandong Province, confirming that the phenology occurred earlier in the inland than in the coastal regions found by Wang et al. (2017) [52]. Earlier studies revealed that the spatial difference of winter wheat phenology in Shandong Province partly reflected the spatial heterogeneity of climate [50,53]. The temperature in the Southern region of Shandong Province rebounded quickly after winter, which is beneficial to advance the growth and development period of winter wheat. Moreover, the temperature in the South of Shandong Province is generally higher than in the North from March to May, which further promotes winter wheat growth and development in the South. In addition, the Eastern region of Shandong Province, especially the coastal areas of Bo Hai, is affected by both land and marine climates, the temperature in coastal areas is lower than that of inland areas in the same period, which is not conducive to the growth of winter wheat, eventually resulting in a later winter wheat phenology in coastal areas than in inland areas.
Regarding the temporal trend of winter wheat phenology, a decadal trend rate of approximately −8.00–8.00 days/decade for the key phenological stages at pixel scale was detected by this current study, generally in line with Wang et al. (2017) [52]. For change trends of winter wheat green-up date in Shandong Province, a spatial pattern that was advanced in the west and delayed in the Eastern coastal areas and in the South was consistent with previous research results. For example, Wang et al. (2017) documented that the winter wheat green-up date was generally delayed with a trend rate less than 6 days/decade in the Northeast of the North China Plain [52]. Guo et al. (2019) also revealed a common delayed trend in green-up date of winter wheat during 2001–2015 in the Eastern areas of the North China Plain [50], covering the coastal areas, such as Weifang, Dongying, and Qingdao in Shandong Province. However, the trend of jointing date being advanced in the West and delayed in the Eastern coasts and in the South, as well as the widespread tendency of advanced for heading date and delayed for maturity date detected by this study have not been described in former works. Notably, we discovered the change trends of winter wheat phenology in most pixels were generally insignificant, matching with the trends in crops or natural vegetation phenology uncovered in earlier studies in China [26,36,41,50,52,54] and other parts of the world [28,29,30,31,32,34].

4.2. Response of Winter Wheat Phenology to Climate Factors

It is generally believed that crop phenology is highly influenced by climatic factors, especially temperature, which plays an important role in regulating winter wheat phenology at both global and regional scales [11,27,36,40,50,53]. In this study, we identified that green-up date, jointing date, and heading date of winter wheat generally presented a significant negative relationship with the mean and minimum temperature in Shandong Province, which was in accordance with Wu et al. (2019), who revealed that the green-up date and heading date obviously correlated negatively with preseason mean temperature in the North China Plain [36]. Shandong Province is located in Northern China, where a warm temperature monsoon climate prevails. The temperature in winter and spring is generally low and serves as an important stress factor in affecting the early growth stage of winter wheat [39,55]. The warming trends, which signify a fast-effective temperature accumulation and thus leads to an earlier growth of winter wheat under sufficient light capture [56], could therefore compensate for the adverse effects of low temperature stress to a certain extent and be beneficial to winter wheat growth [51]. Additionally, melting snow due to rising temperature could replenish soil moisture and provide the water needed for winter wheat to grow after winter dormancy date. Thus, the rising temperature in the seedling stage of winter wheat would advance its phenology [27,40]. In addition, it revealed that green-up date, jointing date, and heading date significantly correlated with the mean and minimum temperature in the recent two and three months in more regions than those in the current month, indicating that the temperature in earlier periods had a stronger influence on winter wheat phenology in Shandong Province, especially on jointing date and heading date.
We also found green-up date, jointing date, and heading date generally negatively correlated with maximum temperature, but the proportion of pixels with a significant negative relationship was commonly less than 10%, which indicated that the maximum temperature had a mild effect on green-up date, jointing date, and heading date in Shandong Province during 2003–2019. Shandong Province is situated in the North China Plain, where there is a typical irrigated area in China [51]. The effects of high temperature on winter wheat phenology could be regulated by irrigation from farmers in each season [57], which would pronounce a limited influence of maximum temperature on winter wheat phenology from green-up date to jointing date.
For maturity date, a common significant positive correlation with the mean/minimum/maximum temperature in the current month in the West of Shandong Province, and a general notable negative correlation with the mean/minimum temperature in the recent three months along the Northern coastal areas were discovered by this study. Recent evidence has suggested that water demand is the highest during the heading-maturity stage of winter wheat [6]. Generally, the ambient temperature in May to June during the winter wheat maturity stage is high in the Western inland area of Shandong Province, where drought is prominent and water shortage is extremely serious [44,51,57,58,59]. The water consumption would increase and trigger severe water stress if the temperature climbs excessively. Insufficient water supply thus delays winter wheat growth and development [55], causing prolonged grain filling and a correspondingly delayed maturity date. However, in the winter wheat planting area along the Northern coastal areas, the temperature is usually lower than inland areas and the moisture is relatively abundant under the context of marine climate, the rising temperature could accelerate the milk-ripening of winter wheat, which could shorten the grain-filling stage and eventually advance the maturity date [60].
Generally, green-up date, jointing date, and maturity date were found to be correlated with precipitation negatively/positively in the West/East of Shandong Province, on the contrary, heading date presented a positive relevance between precipitation in the West and a negative correlation in parts of Eastern Shandong Province. The significance, however, was not obvious between the winter wheat phenology and precipitation, which furtherly revealed that winter wheat phenology was not sensitive enough to precipitation due to regular irrigation management under the context of water shortage condition in Shandong Province [44,57].
From the above, it was noticeable that the dominant climatic factors affecting winter wheat phenology varied spatially due to different hydrothermal conditions in Shandong Province, especially demonstrating a significant difference between the inland area in the West and the coastal regions in the East. Meanwhile, the response of winter wheat to the same climatic factor also varied considerably during different phenological stages, which suggests a consideration of the necessity of winter wheat to cope with and adapt to climate change according to the influence characteristics of climate factors on different phenology stages in the future.

4.3. Uncertainties

The deviation of winter wheat green-up date, jointing date, heading date, and maturity date extracted from MODIS EVI in Shandong Province during 2003–2019 were 4–12 days against agro-meteorological observations. This discrepancy could be attributed to the challenge in identifying the peak and troughs of the EVI time series data when facing the disturbances of atmosphere, soil background, snowfall, and natural vegetation growth [41,44]. For example, EVI may change oppositely with snow cover fraction in high latitude areas, and presents an increasing trend in spring not only by winter wheat growth but also by snowmelt [36,61]. We also found that the deviation for green-up date and heading date were smaller than those for jointing date and maturity date. This result may be explained by the fact that the thresholds of extracting jointing date and maturity date were not directly based on the smoothed EVI time series but the derivation curves, which still had not only abnormal fluctuations but also some interference caused by data noise [62], and thus might cause greater final deviations. Moreover, remote-sensing based winter wheat and vegetation classifications have mixed pixels at the moderate spatial resolution of MODIS EVI, which might also create uncertainties in revealing the changes of winter wheat phenology [15,27]. In addition, it is inevitable that the field phenology observation, algorithm applied, and interpolated meteorological datasets will all introduce some uncertainties in crop phenology extraction and relevance assessment between phenology and climate factors [3,22,37,52,63].
Finally, the role of anthropogenic-management practices on phenology change, which would also influence the winter wheat phenology variation [13,64,65], is not involved in this study. Shandong Province is usually regarded as an area where irrigation agriculture is more common due to the shortage of water sources. For example, previous studies revealed that the impact of precipitation on winter wheat before sowing was limited in the North China Plain because farmland was usually fully irrigated before winter wheat was sown in order to ensure its seedling emergence rate [26]. In future, we will be engaged in assessing the impact of crop-management and climate change on winter wheat phenology in order to furtherly demonstrate the mechanisms of winter wheat phenology change in the context of global warming.

5. Conclusions

Based on the MODIS EVI product, four key winter wheat phenological periods (i.e., green-up date, jointing date, heading date, and maturity date) in Shandong Province, China from 2003 to 2019 were retrieved, and the spatiotemporal characteristics of winter wheat phenology and its response to temperature and precipitation in the pre- and current season periods were analyzed. We found that green-up date, jointing date, heading date, and maturity date generally ranged from 50–70 DOY, 75–95 DOY, 100–120 DOY, and 130–150 DOY, respectively. Winter wheat phenology in Shandong Province presented a spatial pattern of the South earlier than the North and the inland earlier than the coastal regions. With the increase of latitude and longitude, the winter wheat phenology increased correspondingly, and the latitudinal shifts of winter wheat phenology were steeper than the longitudinal. Green-up date and jointing date were both generally advanced in the West and delayed in the East coast and the South, and heading date and maturity date showed a widespread advance and delayed tendency, respectively, however, the phenological trend of winter wheat in Shandong Province was insignificant in general. Additionally, green-up date, jointing date, and heading date commonly presented a significantly negative correlation with mean/minimum temperature, while maturity date was found to be positively associated with the current month maximum temperature, notably in the West of Shandong Province. For precipitation, a general insignificant relationship between winter wheat phenology was detected in Shandong Province.

Author Contributions

Conceptualization, X.W. and X.H.; methodology, Y.Z.; investigation and analysis, Y.Z. and X.W.; writing, review, and editing, X.W., Y.G. and L.D.; funding acquisition, X.W. and X.H. All authors have read and agreed to the published version of the manuscript.

Funding

This work was supported by the National Natural Science Foundation of China (No. 41901133), Strategic Priority Research Program of the Chinese Academy of Sciences (No. XDA19060205), Key Deployment Project of Centre for Ocean Mega-Research of Science, Chinese Academy of Sciences (No. COMS2020Q07), the Open Fund Project of Key Laboratory of Marine Environmental Information Technology, Ministry of Natural Resources of the People’s Republic of China, and Special Exchange Program of Chinese Academy of Sciences (No. E229030101).

Acknowledgments

The authors kindly thank the China Meteorological Data Service Centre for providing climate data and the three anonymous reviewers for their insights and recommendations.

Conflicts of Interest

The authors declare no conflict of interest.

References

  1. Li, X.; Zhou, Y.; Asrar, G.R.; Meng, L. Characterizing spatiotemporal dynamics in phenology of urban ecosystems based on Landsat data. Sci. Total Environ. 2017, 605–606, 721–734. [Google Scholar]
  2. Chen, L.; Huang, J.G.; Ma, Q.; Hänninen, H.; Tremblay, F.; Bergeron, Y. Long term changes in the impacts of global warming on leaf phenology of four temperate tree species. Glob. Chang. Biol. 2019, 25, 997–1004. [Google Scholar] [CrossRef] [PubMed]
  3. Berra, E.F.; Gaulton, R. Remote sensing of temperate and boreal forest phenology: A review of progress, challenges and opportunities in the intercomparison of in-situ and satellite phenological metrics. For. Ecol. Manag. 2021, 480, 118663. [Google Scholar]
  4. Gao, F.; Zhang, X. Mapping crop phenology in near real-time using satellite remote sending: Challenges and opportunities. J. Remote Sens. 2021, 2021, 8379391. [Google Scholar] [CrossRef]
  5. Dong, Q.; Chen, X.; Chen, J.; Zhang, C.; Liu, L.; Cao, X.; Zang, Y.; Zhu, X.; Cui, X. Mapping Winter Wheat in North China Using Sentinel 2A/B Data: A Method Based on Phenology-Time Weighted Dynamic Time Warping. Remote Sens. 2020, 12, 1274. [Google Scholar]
  6. Zhang, L.; Chu, Q.; Jiang, Y.; Chen, F.; Lei, Y. Impacts of climate change on drought risk of winter wheat in the North China Plain. J. Integr. Agric. 2021, 20, 2601–2612. [Google Scholar] [CrossRef]
  7. Richardson, A.D.; Keenan, T.F.; Migliavacca, M.; Ryu, Y.; Sonnentag, O.; Toomey, M. Climate change, phenology, and phenological control of vegetation feedbacks to the climate system. Agric. For. Meteorol. 2013, 169, 156–173. [Google Scholar] [CrossRef]
  8. Wang, M.; Tao, F.L.; Shi, W.J. Corn yield forecasting in Northeast China using remotely sensed spectral indices and crop phenology metrics. J. Integr. Agric. 2014, 13, 1538–1545. [Google Scholar]
  9. Ji, H.; Xiao, L.; Xia, Y.; Song, H.; Liu, B.; Tang, L.; Cao, W.; Zhu, Y.; Liu, L. Effects of jointing and booting low temperature stresses on grain yield and yield components in wheat. Agric. For. Meteorol. 2017, 243, 33–42. [Google Scholar]
  10. Guo, L.; Gao, J.; Ma, S.; Chang, Q.; Zhang, L.; Wang, S.; Zou, Y.; Wu, S.; Xiao, X. Impact of spring phenology variation on GPP and its lag feedback for winter wheat over the North China Plain. Sci. Total Environ. 2020, 725, 138342. [Google Scholar] [CrossRef]
  11. Rezaei, E.E.; Siebert, S.; Ewert, F. Intensity of heat stress in winter wheat—phenology compensates for the adverse effect of global warming. Environ. Res. Lett. 2015, 10, 024012. [Google Scholar] [CrossRef]
  12. Liu, Y.; Zhang, J.; Pan, T.; Chen, Q.; Qin, Y.; Ge, Q. Climate-associated major food crops production change under multi-scenario in China. Sci. Total Environ. 2022, 811, 151393. [Google Scholar] [CrossRef] [PubMed]
  13. He, L.; Asseng, S.; Zhao, G.; Wu, D.; Yang, X.; Zhuang, W.; Jin, N.; Yu, Q. Impacts of recent climate warming, cultivar changes, and crop management on winter wheat phenology across the Loess Plateau of China. Agric. For. Meteorol. 2015, 200, 135–143. [Google Scholar] [CrossRef]
  14. Guo, L.; An, N.; Wang, K. Reconciling the discrepancy in ground- and satellite-observed trends in the spring phenology of winter wheat in China from 1993 to 2008. J. Geophys. Res. Atmos. 2016, 121, 1027–1042. [Google Scholar] [CrossRef]
  15. Pan, Y.; Li, L.; Zhang, J.; Liang, S.; Zhu, X.; Sulla-Menashe, D. Winter wheat area estimation from MODIS-EVI time series data using the Crop Proportion Phenology Index. Remote Sens. Environ. 2012, 119, 232–242. [Google Scholar]
  16. Tao, J.; Wu, W.; Zhou, Y.; Wang, Y.; Jian, Y. Mapping winter wheat using phenological feature of peak before winter on the North China Plain based on time-series MODIS data. J. Integr. Agric. 2017, 16, 348–359. [Google Scholar] [CrossRef] [Green Version]
  17. Bolton, D.K.; Gray, J.M.; Melaas, E.K.; Moon, M.; Eklundh, L.; Friedl, M.A. Continental-scale land surface phenology from harmonized Landsat 8 and Sentinel-2 imagery. Remote Sens. Environ. 2020, 240, 111685. [Google Scholar] [CrossRef]
  18. Schlund, M.; Erasmi, S. Sentinel-1 time series data for monitoring the phenology of winter wheat. Remote Sens. Environ. 2020, 264, 111814. [Google Scholar] [CrossRef]
  19. Meroni, M.; d’Andrimont, R.; Vrieling, A.; Fasbender, D.; Lemoine, G.; Rembold, F.; Seguini, L.; Verhegghen, A. Comparing land surface phenology of major European crops as derived from SAR and multispectral data of Sentinel-1 and -2. Remote Sens. Environ. 2021, 253, 112232. [Google Scholar] [CrossRef]
  20. Sarvia, F.; De Petris, S.; Borgogno-Mondino, E. Exploring climate change effects on vegetation phenology by MOD13Q1 data: The Piemonte region case study in the period 2001–2019. Agronomy 2021, 11, 555. [Google Scholar] [CrossRef]
  21. Lu, L.; Wang, C.; Guo, H.; Li, Q. Detecting winter wheat phenology with SPOT-VEGETATION data in the North China Plain. Geocarto Int. 2013, 29, 244–255. [Google Scholar] [CrossRef]
  22. Gan, L.; Cao, X.; Chen, X.; Dong, Q.; Cui, X.; Chen, J. Comparison of MODIS-based vegetation indices and methods for winter wheat green-up date detection in Huanghuai region of China. Agric. For. Meteorol. 2020, 288–289, 108019. [Google Scholar] [CrossRef]
  23. Schreier, J.; Ghazaryan, G.; Dubovyk, O. Crop-specific phenomapping by fusing Landsat and Sentinel data with MODIS time series. Eur. J. Remote Sens. 2021, 54, 47–58. [Google Scholar]
  24. Oteros, J.; García-Mozo, H.; Botey, R.; Mestre, A.; Galán, C. Variations in cereal crop phenology in Spain over the last twenty-six years (1986–2012). Clim. Chang. 2015, 130, 545–558. [Google Scholar] [CrossRef]
  25. He, L.; Jin, N.; Yu, Q. Impacts of climate change and crop management practices on soybean phenology changes in China. Sci. Total Environ. 2020, 707, 135638. [Google Scholar] [CrossRef]
  26. Li, N.; Li, Y.; Biswas, A.; Wang, J.; Dong, H.; Chen, J.; Liu, C.; Fan, X. Impact of climate change and crop management on cotton phenology based on statistical analysis in the main-cotton-planting areas of China. J. Clean. Prod. 2021, 298, 126750. [Google Scholar] [CrossRef]
  27. Ren, S.; Qin, Q.; Ren, H. Contrasting wheat phenological responses to climate change in global scale. Sci. Total Environ. 2019, 665, 620–631. [Google Scholar] [CrossRef]
  28. Shimono, H. Earlier rice phenology as a result of climate change can increase the risk of cold damage during reproductive growth in northern Japan. Agric. Ecosyst. Environ. 2011, 144, 201–207. [Google Scholar] [CrossRef]
  29. Mechiche-Alami, A.; Abdi, A.M. Agricultural productivity in relation to climate and cropland management in West Africa. Sci. Rep. 2020, 10, 3393. [Google Scholar] [CrossRef]
  30. Wang, H.; Ghosh, A.; Linquist, B.A.; Hijmans, R.J. Satellite-Based Observations Reveal Effects of Weather Variation on Rice Phenology. Remote Sens. 2020, 12, 1522. [Google Scholar] [CrossRef]
  31. Yuan, H.; Wu, C.; Gu, C.; Wang, X. Evidence for satellite observed changes in the relative influence of climate indicators on autumn phenology over the Northern Hemisphere. Global Planet. Chang. 2020, 187, 103131. [Google Scholar] [CrossRef]
  32. Wu, L.; Ma, X.; Dou, X.; Zhu, J.; Zhao, C. Impacts of climate change on vegetation phenology and net primary productivity in arid Central Asia. Sci. Total Environ. 2021, 796, 149055. [Google Scholar] [CrossRef]
  33. Tao, F.; Zhang, L.; Zhang, Z.; Chen, Y. Climate warming outweighed agricultural managements in affecting wheat phenology across China during 1981–2018. Agric. For. Meteorol. 2022, 316, 108865. [Google Scholar] [CrossRef]
  34. Yang, Y.; Ren, W.; Tao, B.; Ji, L.; Liang, L.; Ruane, A.C.; Fisher, J.B.; Liu, J.; Sama, M.; Li, Z.; et al. Characterizing spatiotemporal patterns of crop phenology across North America during 2000–2016 using satellite imagery and agricultural survey data. ISPRS J. Photogramm. 2020, 170, 156–173. [Google Scholar] [CrossRef]
  35. Xiao, D.P.; Moiwo, J.P.; Tao, F.L.; Yang, Y.; Shen, Y.; Xu, Q.; Liu, J.; Zhang, H.; Liu, F. Spatiotemporal variability of winter wheat phenology in response to weather and climate variability in China. Mitig. Adapt. Strat. Gl. 2015, 20, 1191–1202. [Google Scholar] [CrossRef]
  36. Wu, X.; Yang, W.; Wang, C.; Shen, Y.; Kondoh, A. Interactions among the Phenological Events of Winter Wheat in the North China Plain-Based on Field Data and Improved MODIS Estimation. Remote Sens. 2019, 11, 2976. [Google Scholar] [CrossRef]
  37. Ji, S.; Ren, S.; Li, Y.; Dong, J.; Wang, L.; Quan, Q.; Liu, J. Diverse responses of spring phenology to preseason drought and warming under different biomes in the North China Plain. Sci. Total Environ. 2021, 766, 144437. [Google Scholar] [CrossRef]
  38. Liu, Y.; Zhang, J.; Pan, T.; Ge, Q. Assessing the adaptability of maize phenology to climate change: The role of anthropogenic-management practices. J. Environ. Manag. 2021, 293, 112874. [Google Scholar] [CrossRef]
  39. Tao, F.; Xiao, D.; Zhang, S.; Zhang, Z.; Rötter, R. Wheat yield benefited from increases in minimum temperature in the Huang-Huai-Hai Plain of China in the past three decades. Agric. For. Meteorol. 2017, 239, 1–14. [Google Scholar] [CrossRef]
  40. Luo, Y.; Zhang, Z.; Zhang, L.; Cao, J. Spatiotemporal patterns of winter wheat phenology and its climatic drivers based on an improved pDSSAT model. Sci. China Earth Sci. 2021, 64, 2144–2160. [Google Scholar] [CrossRef]
  41. Liu, Z.; Wu, C.; Liu, Y.; Wang, X.; Fang, B.; Yuan, W.; Ge, Q. Spring green-up date derived from GIMMS3g and SPOT-VGT NDVI of winter wheat cropland in the North China Plain. ISPRS J. Photogramm. 2017, 130, 81–91. [Google Scholar] [CrossRef]
  42. Qiu, B.; Luo, Y.; Tang, Z.; Chen, C.; Lu, D.; Huang, H.; Chen, Y.; Chen, N.; Xu, W. Winter wheat mapping combining variations before and after estimated heading dates. ISPRS J. Photogramm. 2017, 123, 35–46. [Google Scholar] [CrossRef]
  43. Chen, X.; Wang, W.; Chen, J.; Zhu, X.; Shen, M.; Gan, L.; Cao, X. Does any phenological event defined by remote sensing deserve particular attention? An examination of spring phenology of winter wheat in Northern China. Ecol. Indic. 2020, 116, 106456. [Google Scholar] [CrossRef]
  44. Li, J.; Lei, H. Tracking the spatio-temporal change of planting area of winter wheat-summer maize cropping system in the North China Plain during 2001–2018. Comput. Electron. Agric. 2021, 187, 106222. [Google Scholar] [CrossRef]
  45. Huete, A.; Justice, C.; Liu, H. Development of vegetation and soil indices for MODIS-EOS. Remote Sens. Environ. 1994, 49, 224–234. [Google Scholar] [CrossRef]
  46. Huang, X.; Liu, J.; Zhu, W.; Atzberger, C.; Liu, Q. The Optimal threshold and vegetation index time series for retrieving crop phenology based on a modified dynamic threshold method. Remote Sens. 2019, 11, 2725. [Google Scholar] [CrossRef]
  47. Savitzky, A.; Golay, M.J.E. Smoothing and Differentiation of Data by Simplified Least Squares Procedures. Anal. Chem. 1964, 36, 1627–1639. [Google Scholar] [CrossRef]
  48. Chen, J.; Jönsson, P.; Tamura, M.; Gu, Z.; Matsushita, B.; Eklundh, L. A simple method for reconstructing a high-quality NDVI time-series data set based on the Savitzky–Golay filter. Remote Sens. Environ. 2004, 91, 332–344. [Google Scholar] [CrossRef]
  49. Wen, Y.; Liu, X.; Xin, Q.; Wu, J.; Xu, X.; Pei, F.; Li, X.; Du, G.; Cai, Y.; Lin, K.; et al. Cumulative Effects of Climatic Factors on Terrestrial Vegetation Growth. J. Geophys. Res. Biogeosci. 2019, 124, 789–806. [Google Scholar] [CrossRef]
  50. Guo, L.; Gao, J.; Hao, C.; Zhang, L.; Wu, S.; Xiao, X. Winter wheat green-up date variation and its diverse response on the hydrothermal conditions over the North China plain, using MODIS time-series data. Remote Sens. 2019, 11, 1593. [Google Scholar] [CrossRef]
  51. Lu, C.; Fan, L. Winter wheat yield potentials and yield gaps in the North China Plain. Field Crops Res. 2013, 143, 98–105. [Google Scholar] [CrossRef]
  52. Wang, S.; Mo, X.; Liu, Z.; Baig, M.H.A.; Chi, W. Understanding long-term (1982–2013) patterns and trends in winter wheat spring green-up date over the North China Plain. Int. J. Appl. Earth Obs. 2017, 57, 235–244. [Google Scholar] [CrossRef]
  53. Liu, Y.; Chen, Q.; Ge, Q.; Dai, J. Spatiotemporal differentiation of changes in wheat phenology in China under climate change from 1981 to 2010. Sci. China Earth Sci. 2018, 61, 1088–1097. [Google Scholar] [CrossRef]
  54. Shen, M.; Zhang, G.; Cong, N.; Wang, S.; Kong, W.; Piao, S. Increasing altitudinal gradient of spring vegetation phenology during the last decade on the Qinghai–Tibetan Plateau. Agric. For. Meteorol. 2014, 189–190, 71–80. [Google Scholar] [CrossRef]
  55. Osman, R.; Zhu, Y.; Ma, W.; Zhang, D.; Ding, Z.; Liu, L.; Tang, L.; Liu, B.; Cao, W. Comparison of wheat simulation models for impacts of extreme temperature stress on grain quality. Agric. For. Meteorol. 2020, 288–289, 107995. [Google Scholar] [CrossRef]
  56. Porter, J.R.; Gawith, M. Temperatures and the growth and development of wheat: A review. Eur. J. Agron. 1999, 10, 23–36. [Google Scholar] [CrossRef]
  57. Zhang, X.; Qin, W.; Chen, S.; Shao, L.; Sun, H. Responses of yield and WUE of winter wheat to water stress during the past three decades—A case study in the North China Plain. Agric. Water Manag. 2017, 179, 47–54. [Google Scholar] [CrossRef]
  58. Wang, X.; Hou, X.; Li, Z.; Wang, Y. Spatial and Temporal Characteristics of Meteorological Drought in Shandong Province, China, from 1961 to 2008. Adv. Meteorol. 2014, 2014, 873593. [Google Scholar] [CrossRef]
  59. Fang, Q.; Zhang, X.; Shao, L.; Chen, S.; Sun, H. Assessing the performance of different irrigation systems on winter wheat under limited water supply. Agric. Water Manag. 2018, 196, 133–143. [Google Scholar] [CrossRef]
  60. Tao, F.; Zhang, Z. Climate change, wheat productivity and water use in the North China Plain: A new super-ensemble-based probabilistic projection. Agric. For. Meteorol. 2013, 170, 146–165. [Google Scholar] [CrossRef]
  61. Delbart, N.; Kergoat, L.; Le Toan, T.; Lhermitte, J.; Picard, G. Determination of phenological dates in boreal regions using normalized difference water index. Remote Sens. Environ. 2005, 97, 26–38. [Google Scholar] [CrossRef]
  62. Yan, H.; Liu, F.; Qin, Y.; Niu, Z.; Doughty, R.; Xiao, X. Tracking the spatio-temporal change of cropping intensity in China during 2000–2015. Environ. Res. Lett. 2019, 14, 035008. [Google Scholar] [CrossRef]
  63. Baumann, M.; Ozdogan, M.; Richardson, A.D.; Radeloff, V.C. Phenology from Landsat when data is scarce: Using MODIS and Dynamic Time-Warping to combine multi-year Landsat imagery to derive annual phenology curves. Int. J. Appl. Earth Obs. 2017, 54, 72–83. [Google Scholar] [CrossRef]
  64. Ahmad, S.; Abbas, G.; Ahmed, M.; Fatima, Z.; Anjum, M.A.; Rasul, G.; Khan, M.A.; Hoogenboom, G. Climate warming and management impact on the change of phenology of the rice-wheat cropping system in Punjab, Pakistan. Field Crops Res. 2019, 230, 46–61. [Google Scholar] [CrossRef]
  65. Azadi, Y.; Yazdanpanah, M.; Mahmoudi, H. Understanding smallholder farmers’ adaptation behaviors through climate change beliefs, risk perception, trust, and psychological distance: Evidence from wheat growers in Iran. J. Environ. Manag. 2019, 250, 109456. [Google Scholar] [CrossRef]
Figure 1. Location, subregion, winter wheat sample, meteorological station, and agro-meteorological station of Shandong Province.
Remotesensing 14 04482 g001
Figure 2. Flowchart for extracting the winter wheat planting area in Shandong Province.
Remotesensing 14 04482 g002
Figure 3. Winter wheat phenological stages extraction.
Remotesensing 14 04482 g003
Figure 4. Comparison between satellite-based winter wheat phenological stages and ground observations.
Remotesensing 14 04482 g004
Figure 5. Spatial pattern of multi-year average green-up date, jointing date, heading date, and maturity date of winter wheat during 2003–2019 in Shandong Province.
Remotesensing 14 04482 g005
Figure 6. Latitudinal and longitudinal shifts in winter wheat phenology stages in Shandong Province. Subfigure (a) indicates the location of the transects, and subfigure (b,c) represent the latitudinal and longitudinal shifts in winter wheat phenology stages, respectively.
Remotesensing 14 04482 g006
Figure 7. Change trends of winter wheat green-up date, jointing date, heading date, and maturity date in Shandong Province during 2003–2019. The inset at the upper left indicates the pixels with significant trends.
Remotesensing 14 04482 g007
Figure 8. Change trends of mean, minimum, maximum temperature and precipitation during winter wheat seasons from 2003 to 2019 in Shandong Province. The inset at the upper left indicates the pixels with significant trends.
Remotesensing 14 04482 g008
Figure 9. Spatial pattern of the Pearson’s correlation coefficient between the key winter wheat phenological stages and mean temperature in preseason. (ac), respectively, refer to correlations of green-up date with Tmean1, Tmean2, and Tmean3; (df) represent the correlations of jointing date with Tmean1, Tmean2, and Tmean3, respectively; (gi) are correlations of heading date with Tmean1, Tmean2, and Tmean3, respectively; and (jl) are correlations of maturity date with Tmean1, Tmean2, and Tmean3, respectively.
Remotesensing 14 04482 g009
Figure 10. (al) Same as Figure 9 but for minimum temperature.
Remotesensing 14 04482 g010
Figure 11. (al) Same as Figure 9 but for maximum temperature.
Remotesensing 14 04482 g011
Figure 12. (al) Same as Figure 9 but for precipitation.
Remotesensing 14 04482 g012
Publisher’s Note: MDPI stays neutral with regard to jurisdictional claims in published maps and institutional affiliations.

