

A Case Study on Ground Subsidence and Backfill Deformation Induced by Multi-Stage Filling Mining in a Steeply Inclined Ore Body

Abstract
:
1. Introduction
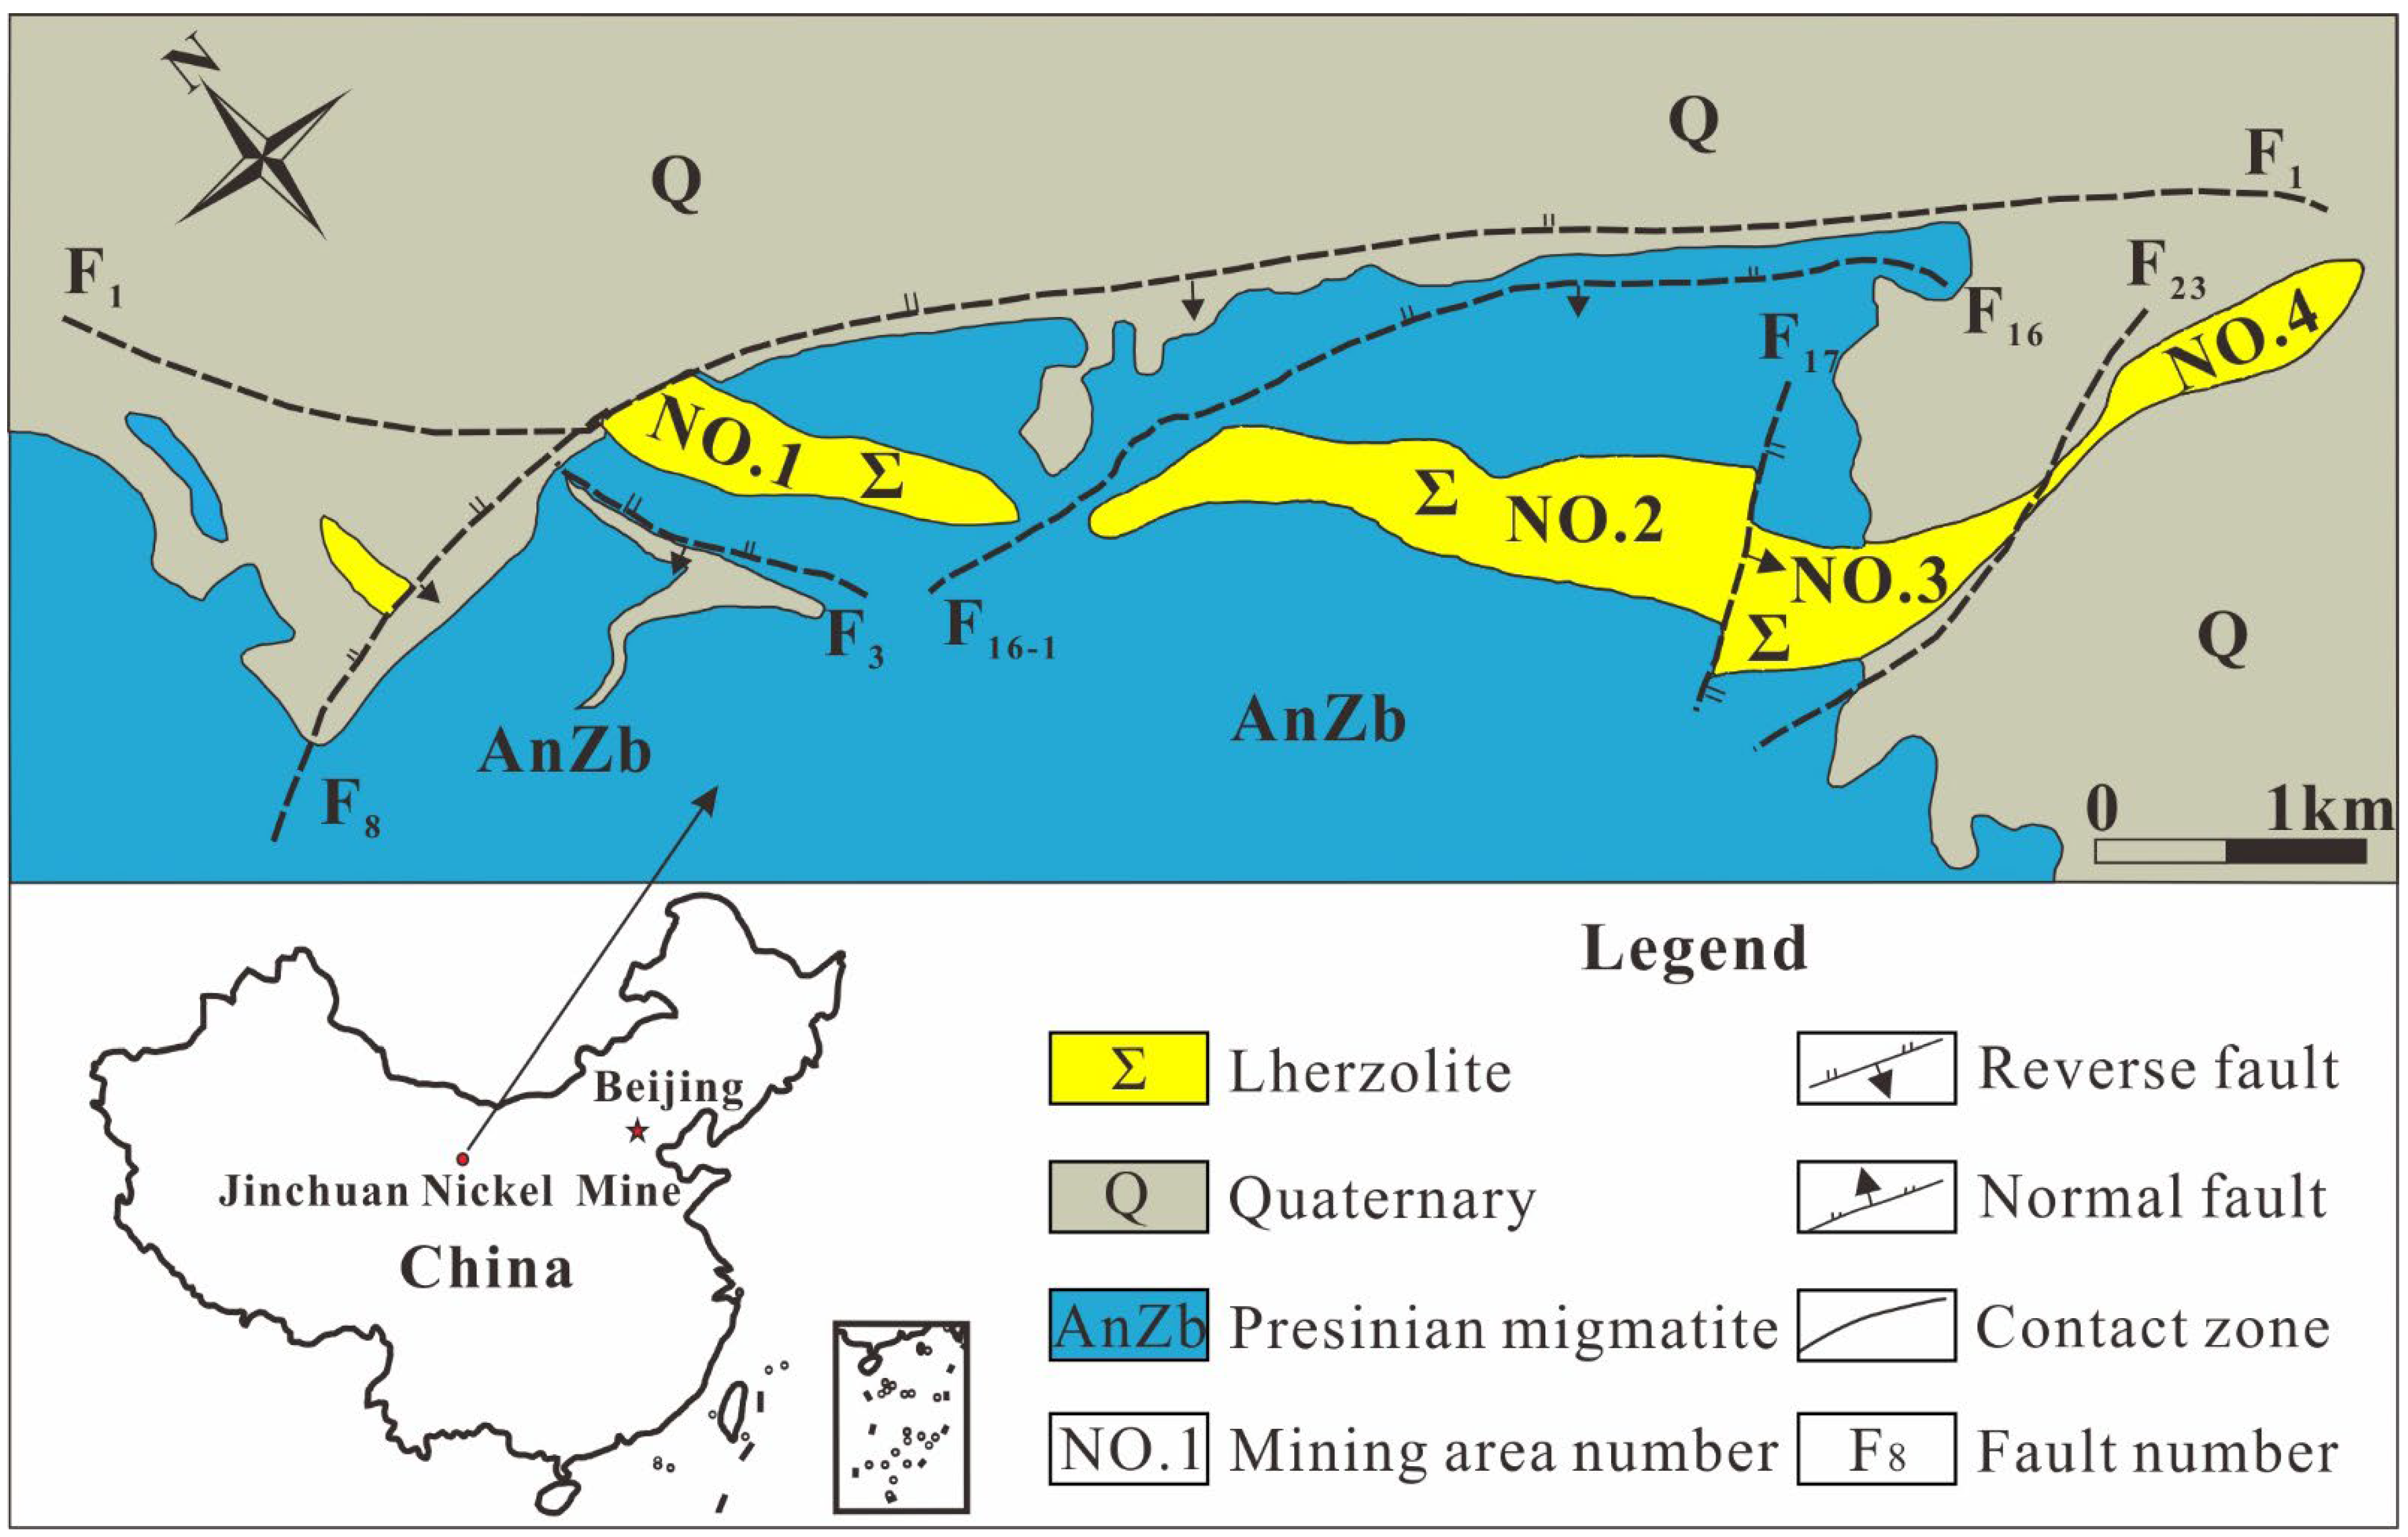
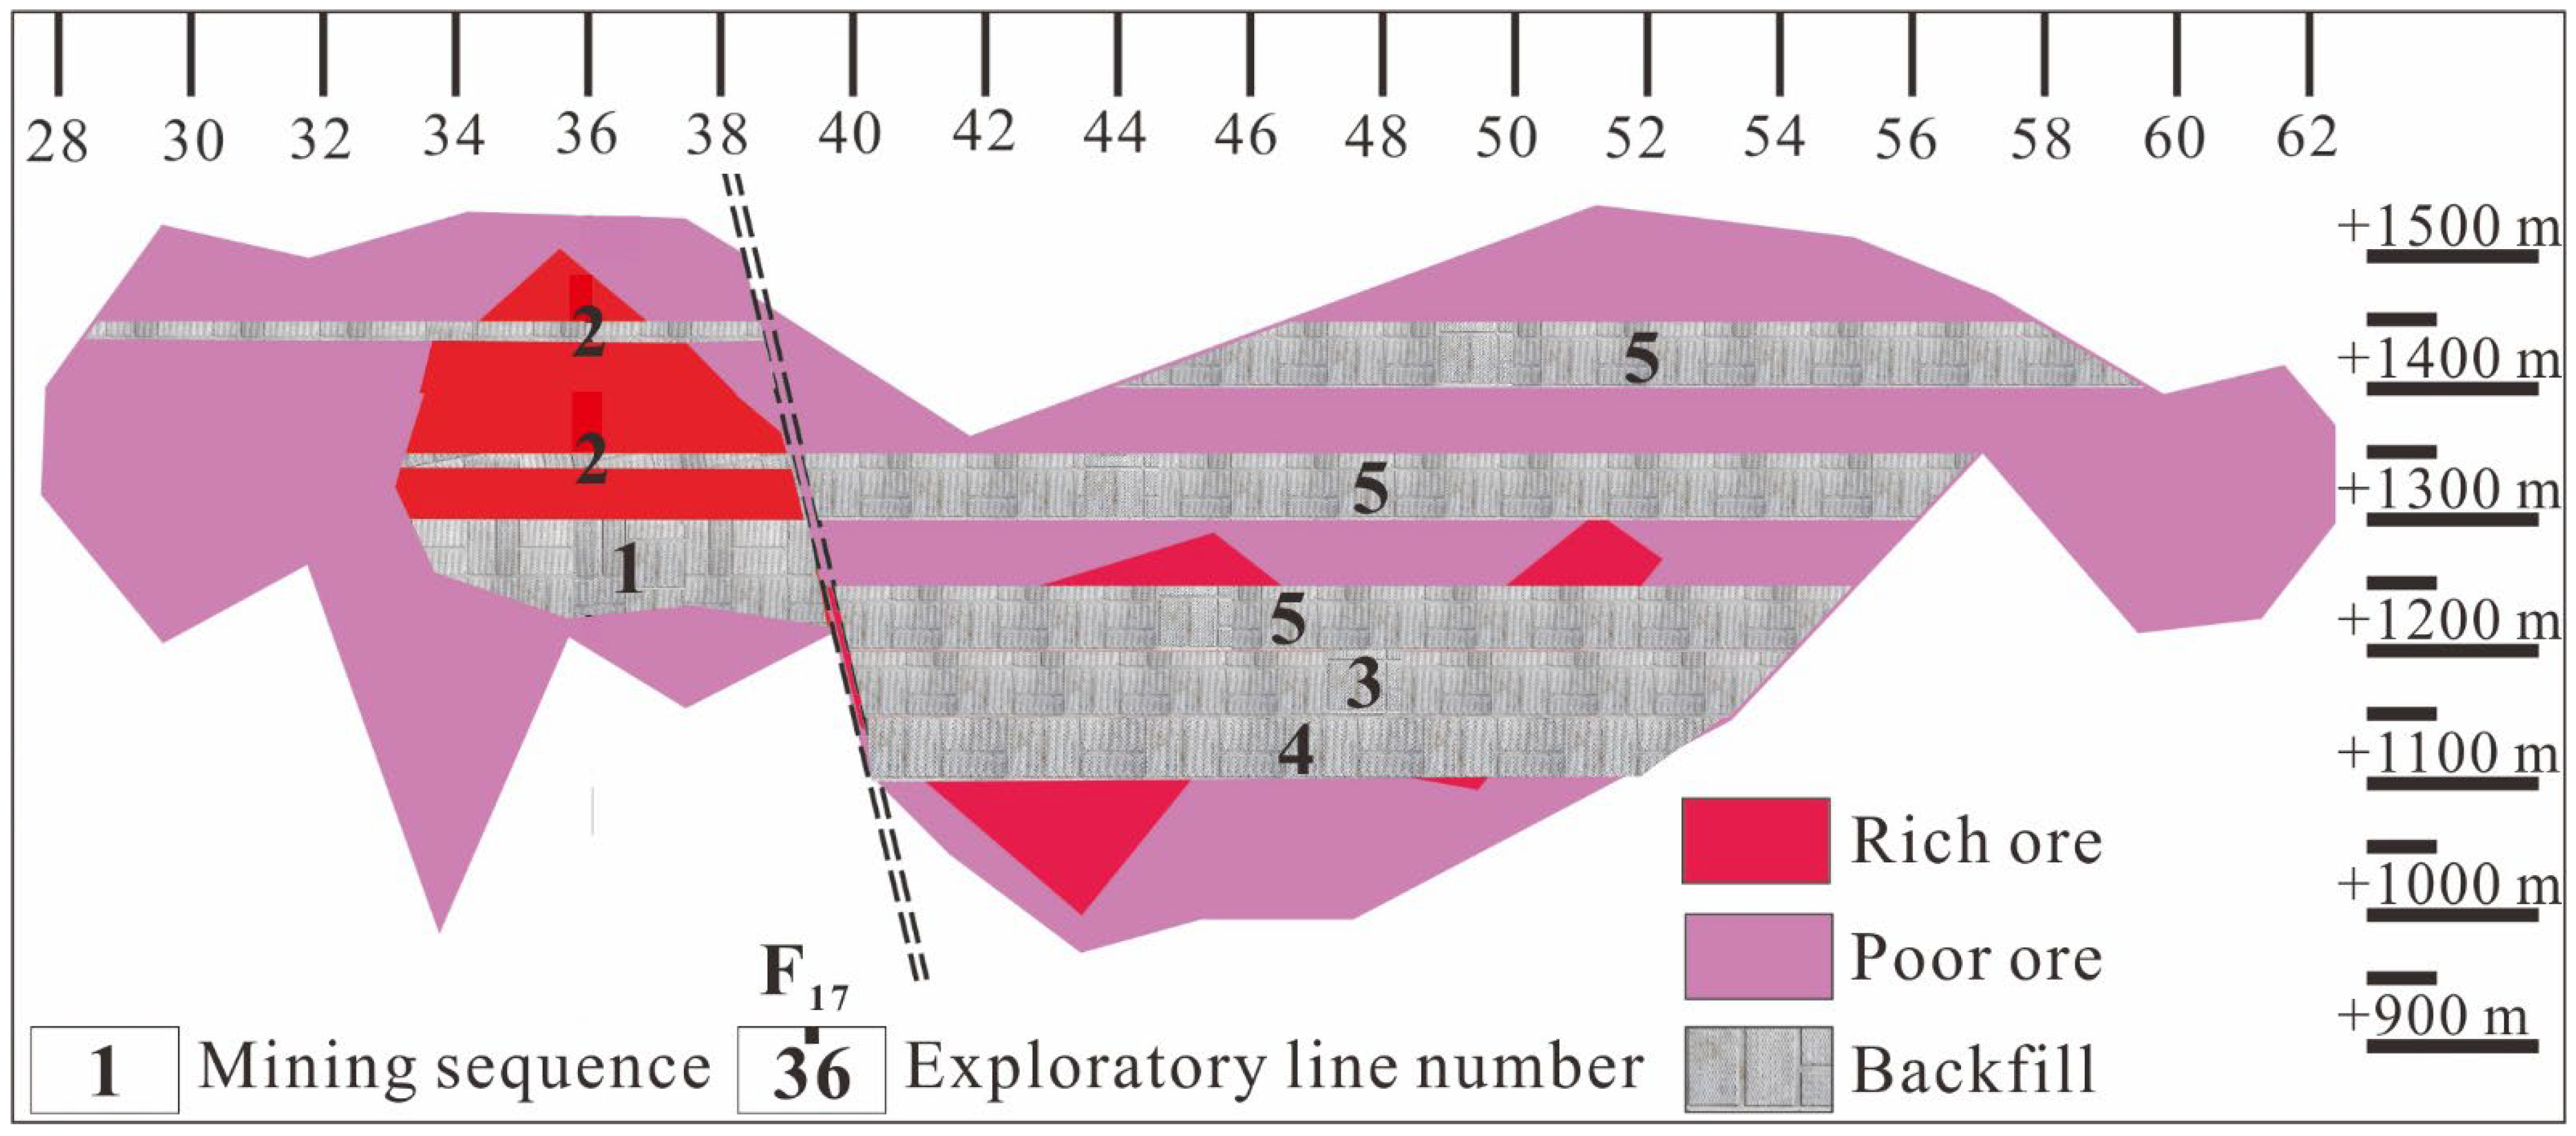
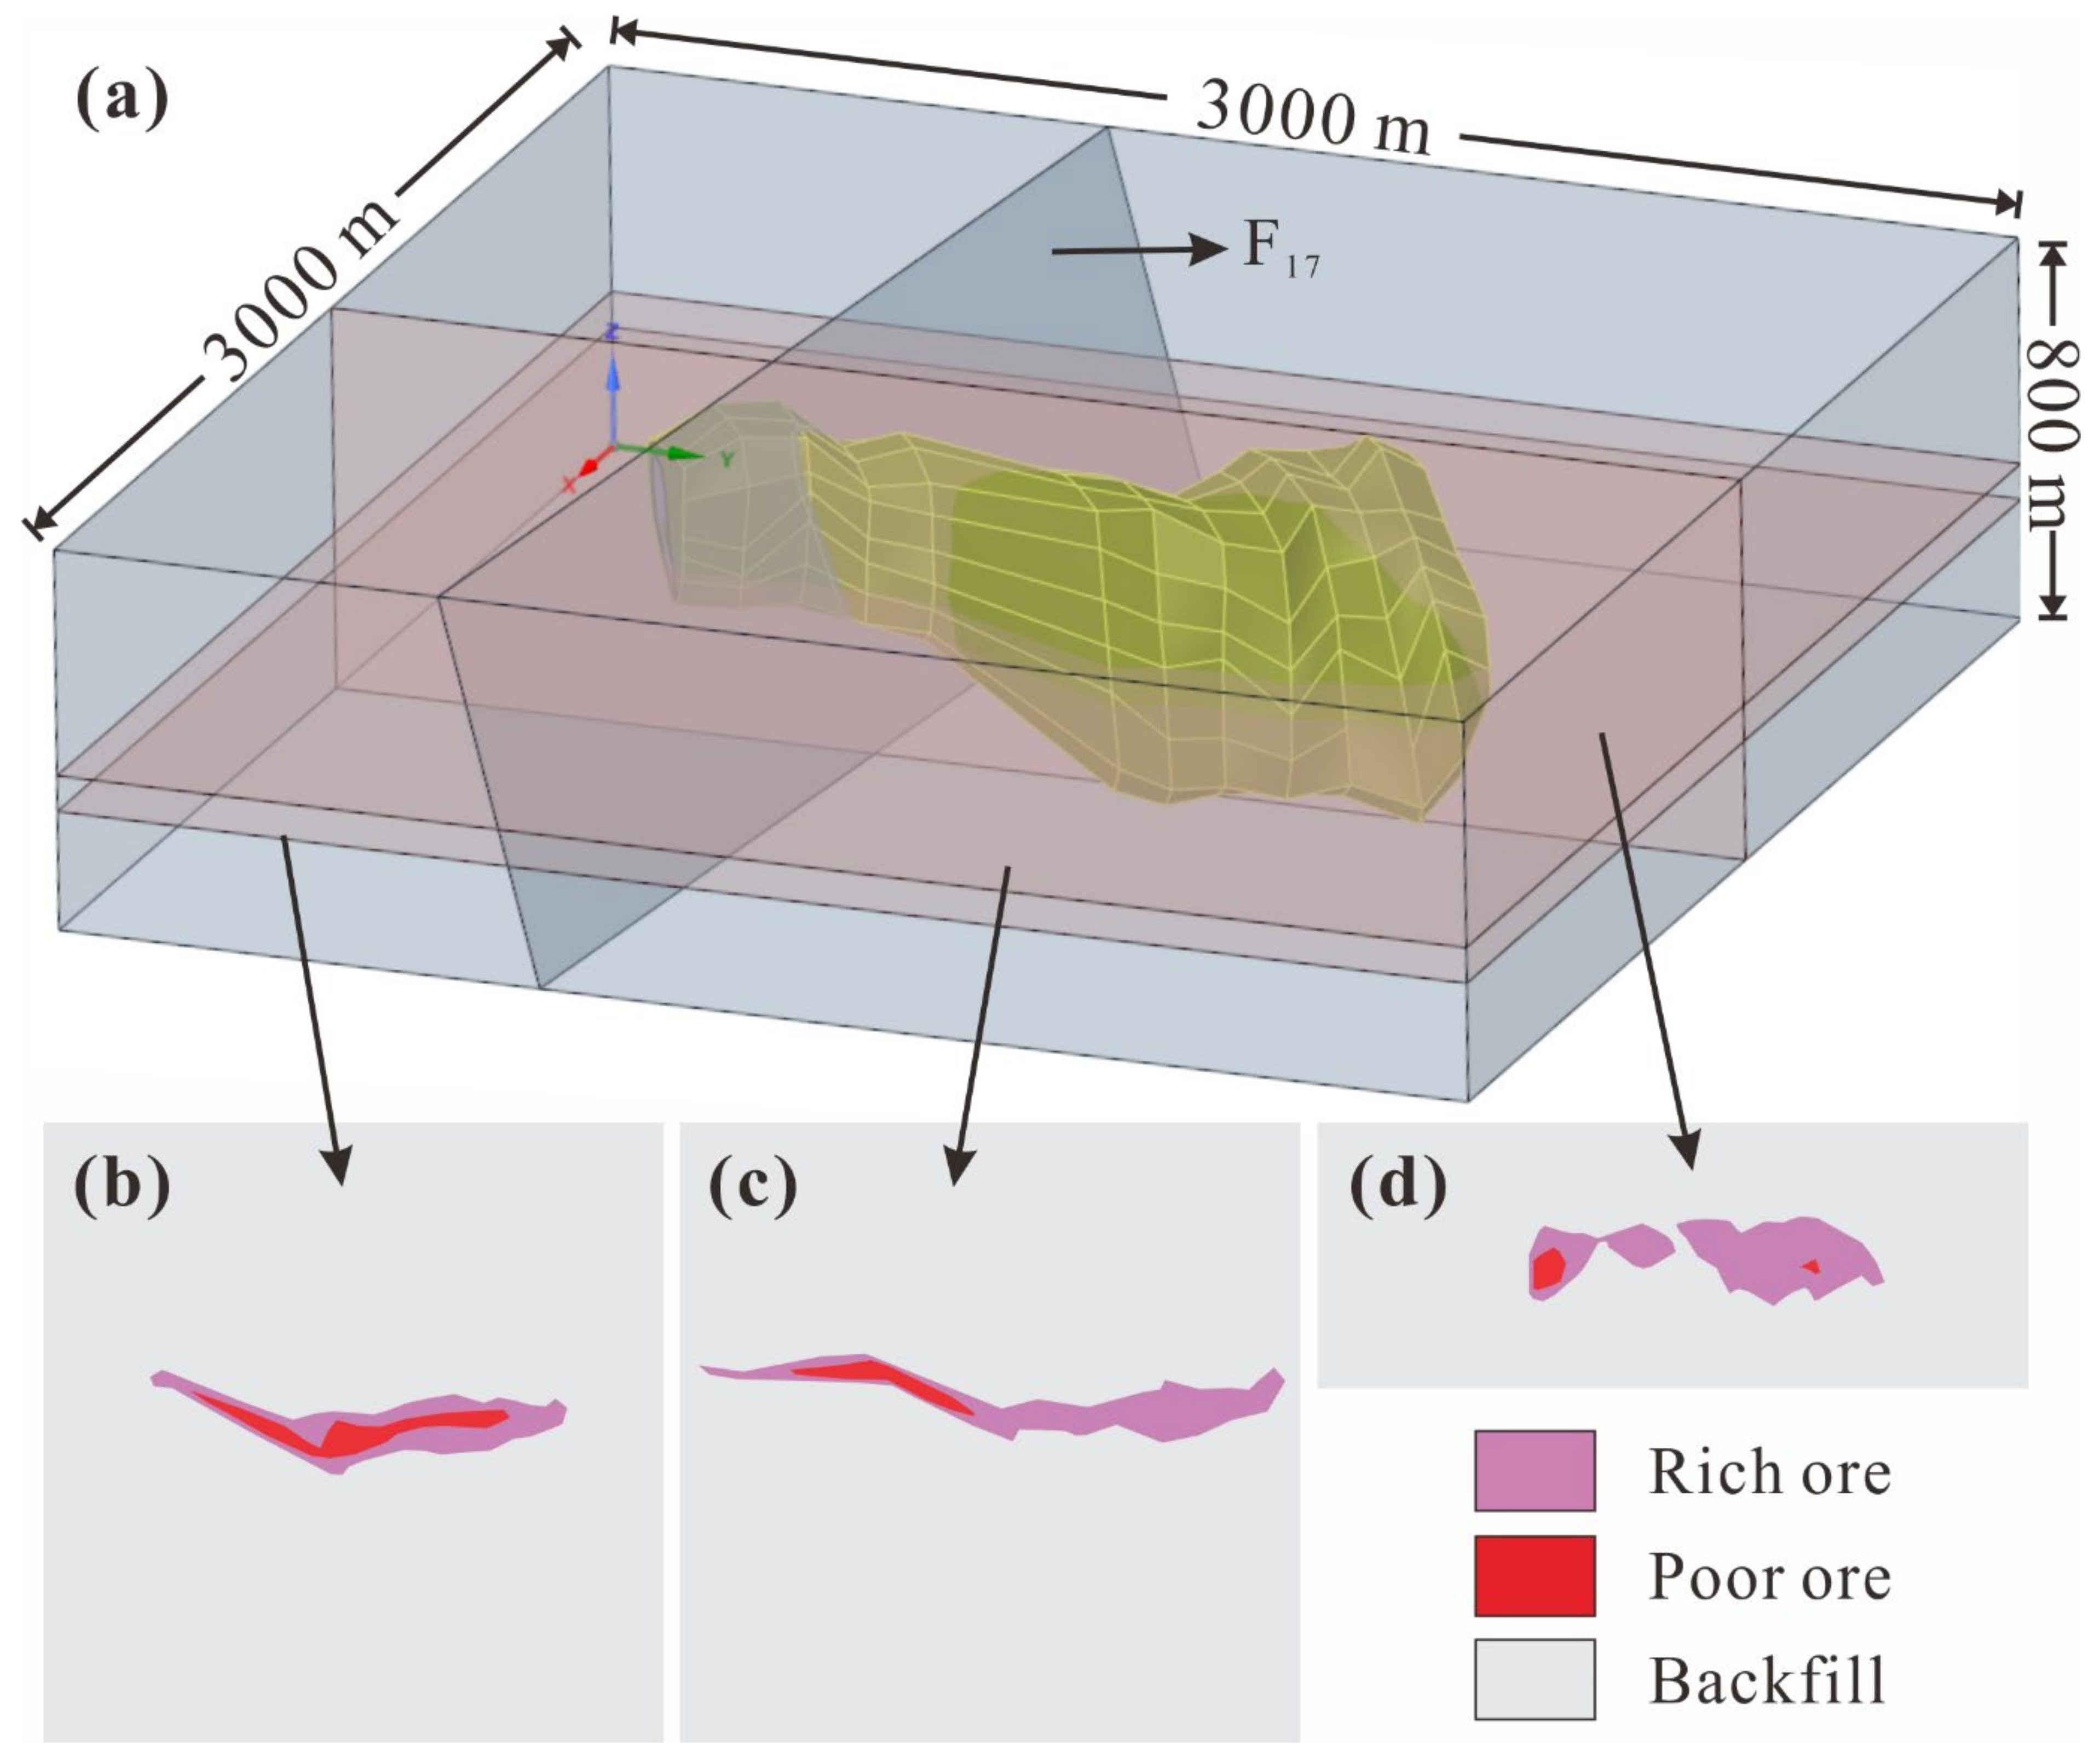
2. The Study Area
3. Field Monitoring
3.1. Monitoring Method
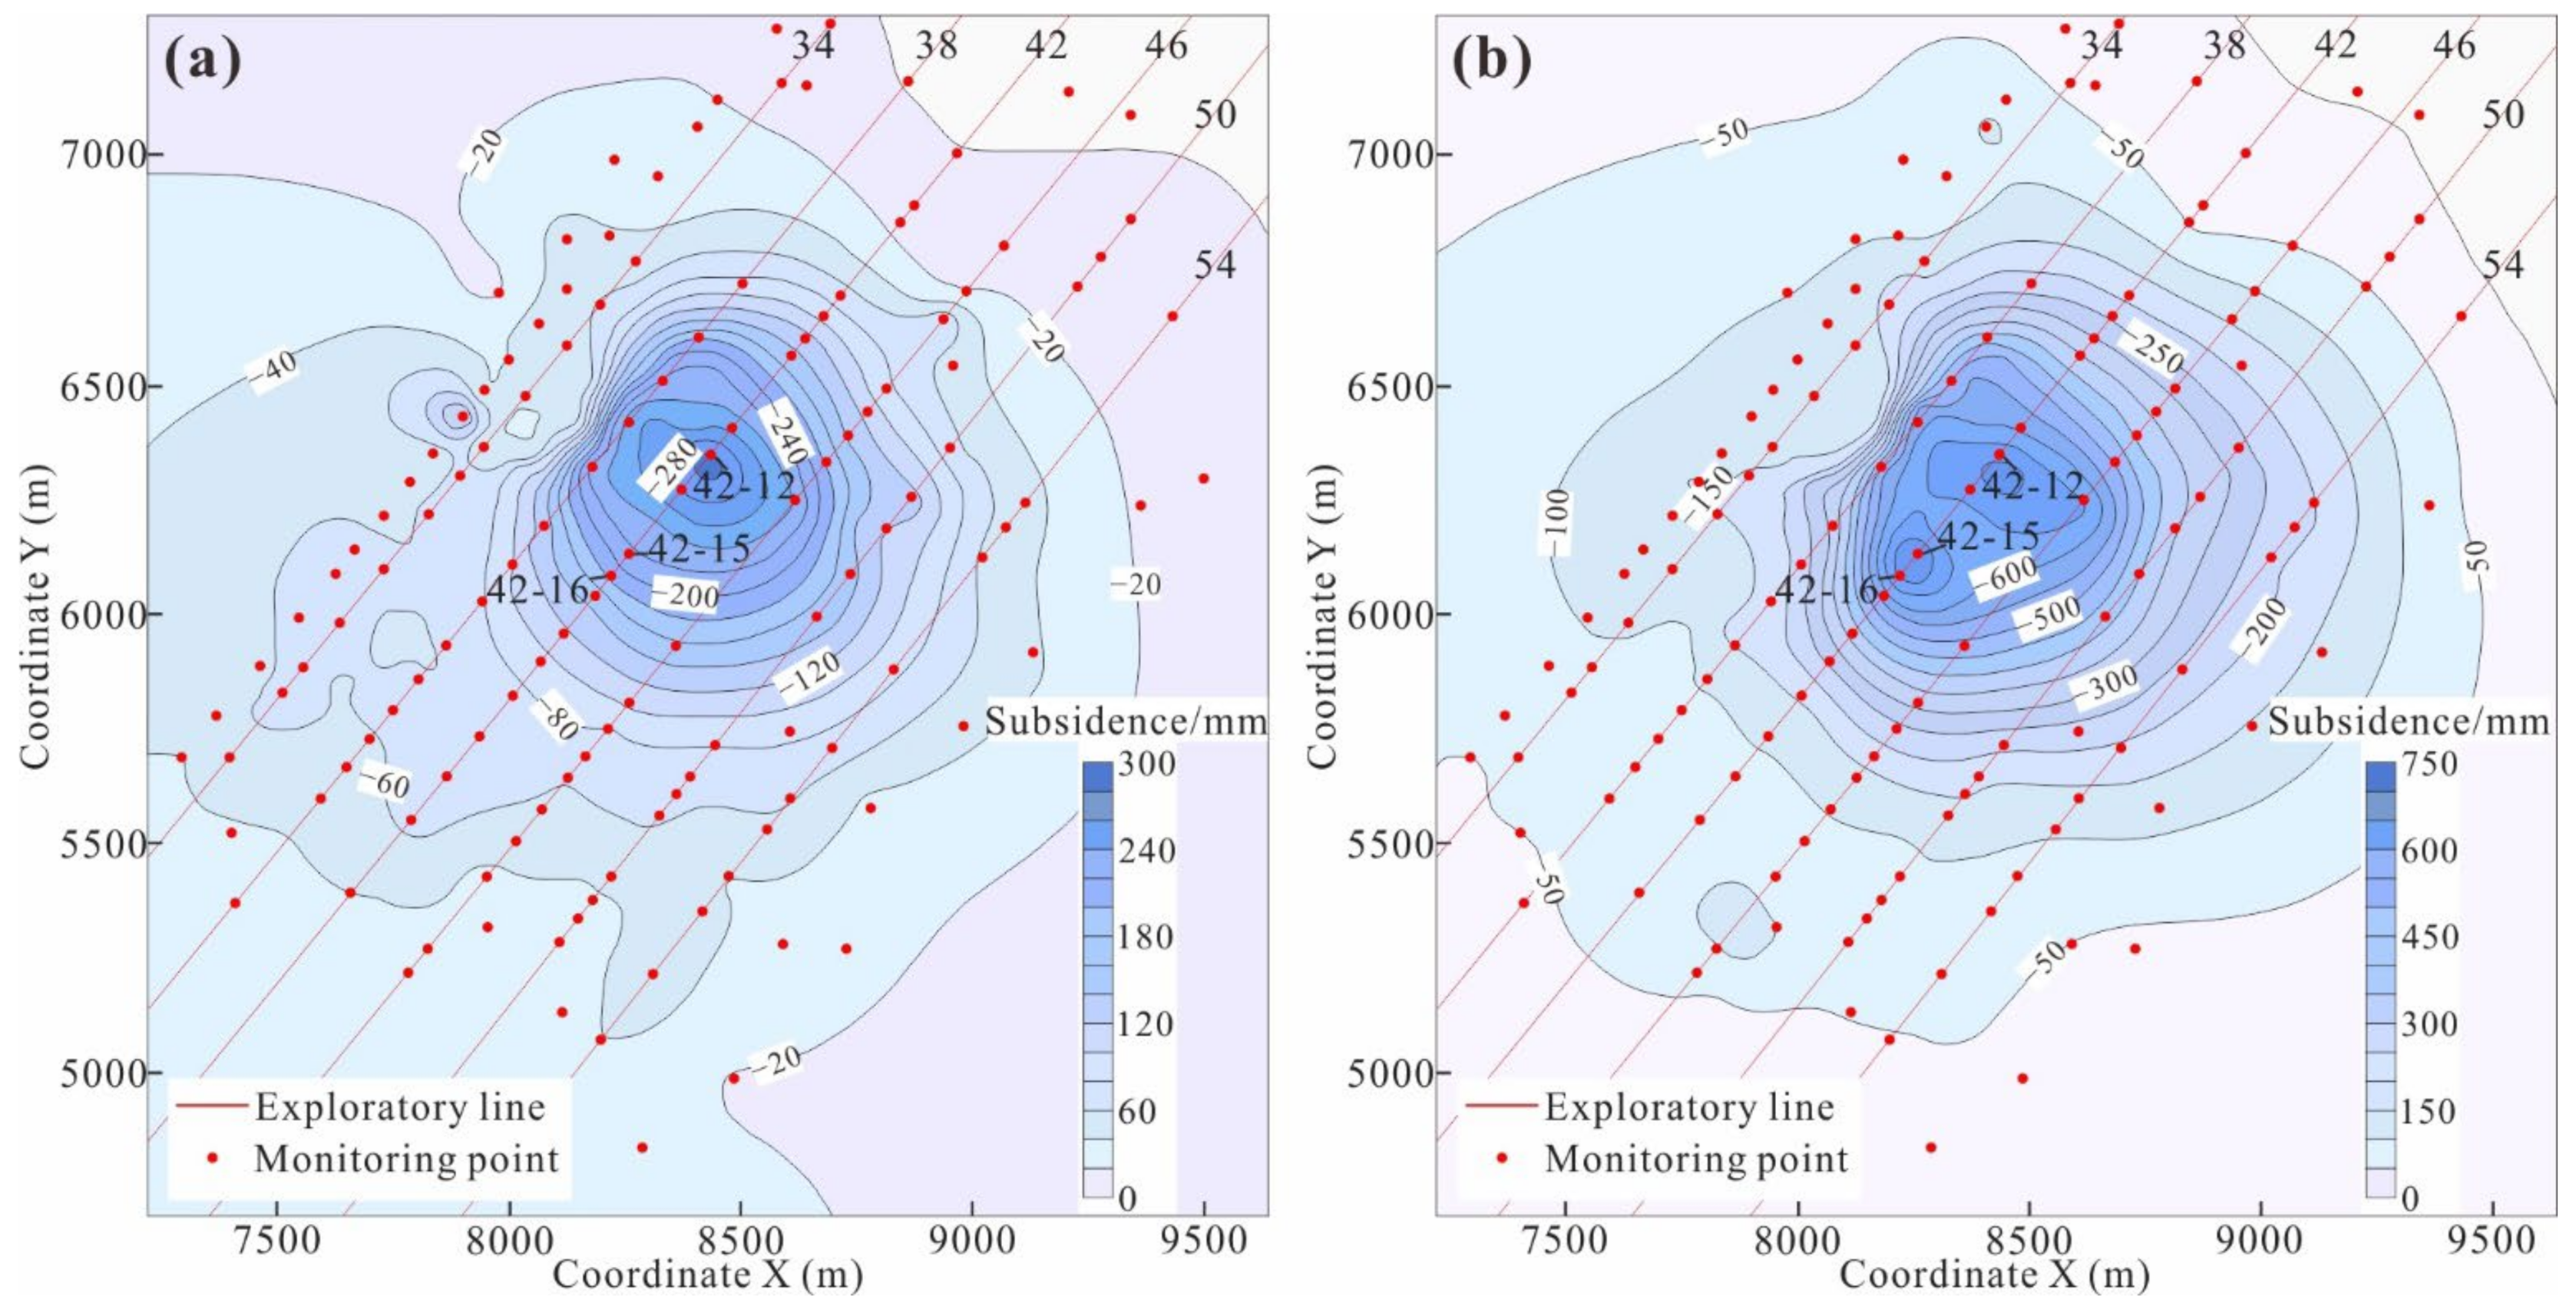
3.2. Analysis of Surface Subsidence
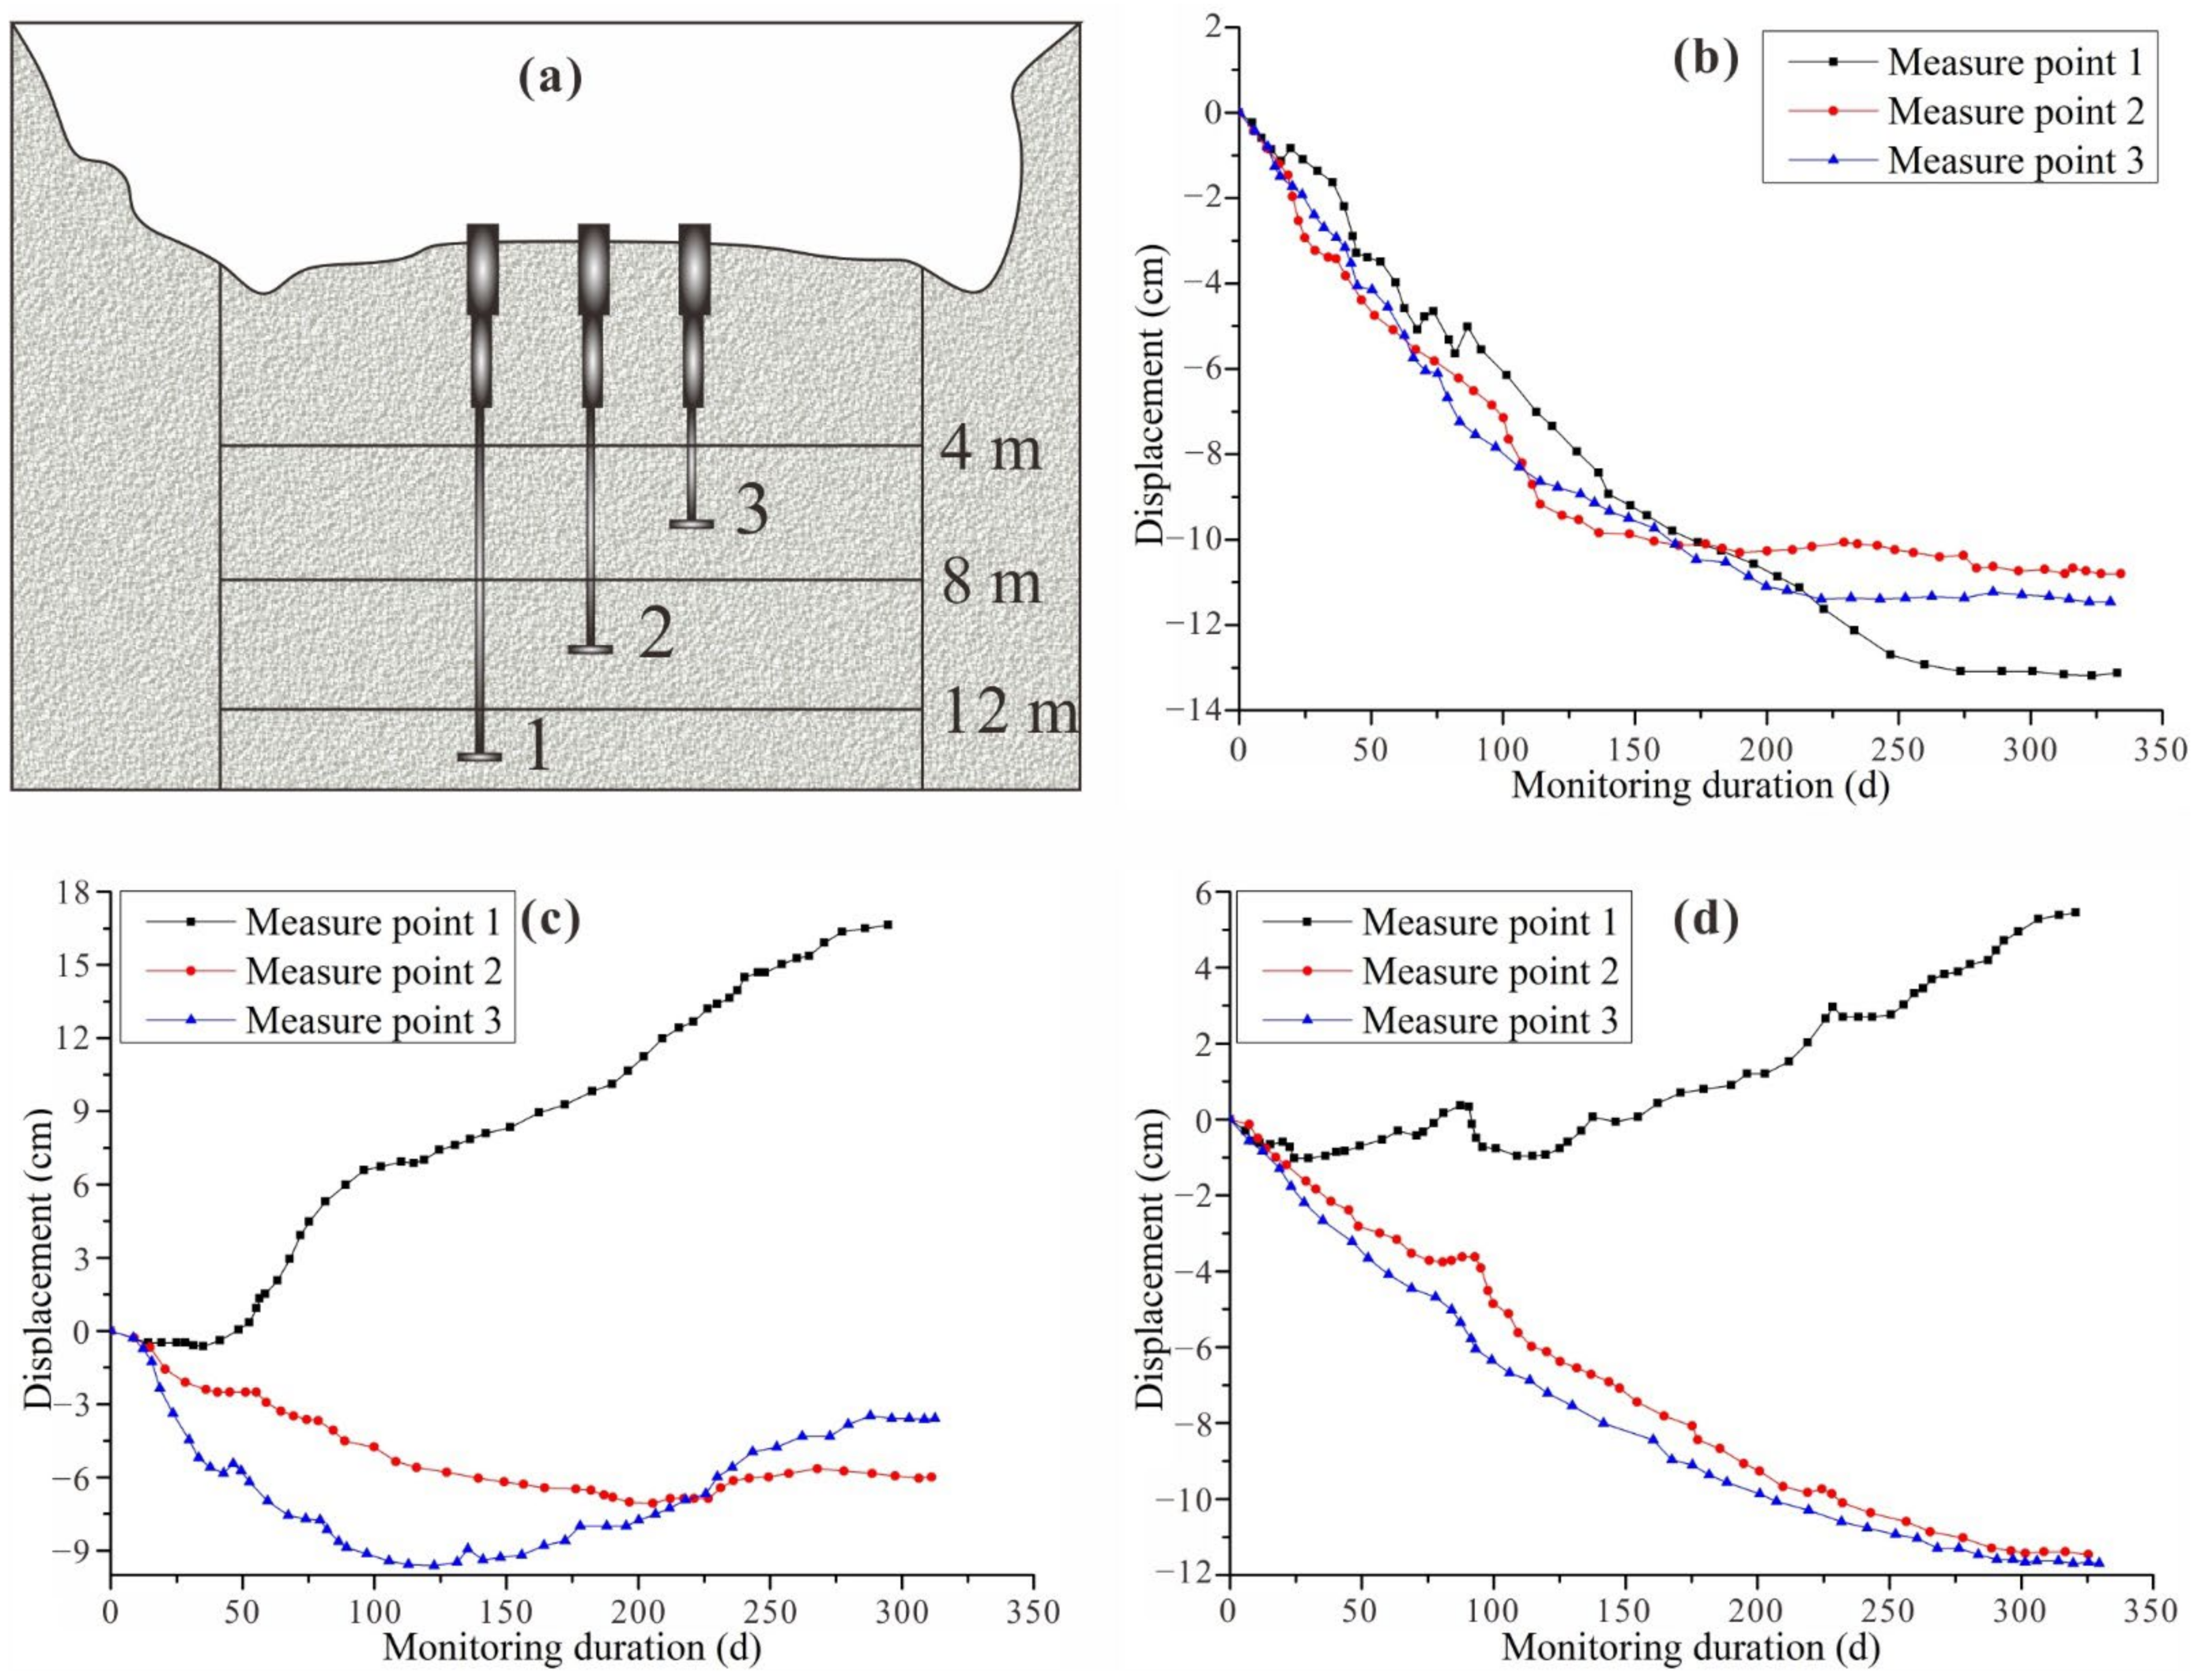
3.3. Analysis of Backfill Deformation
4. Numerical Simulation
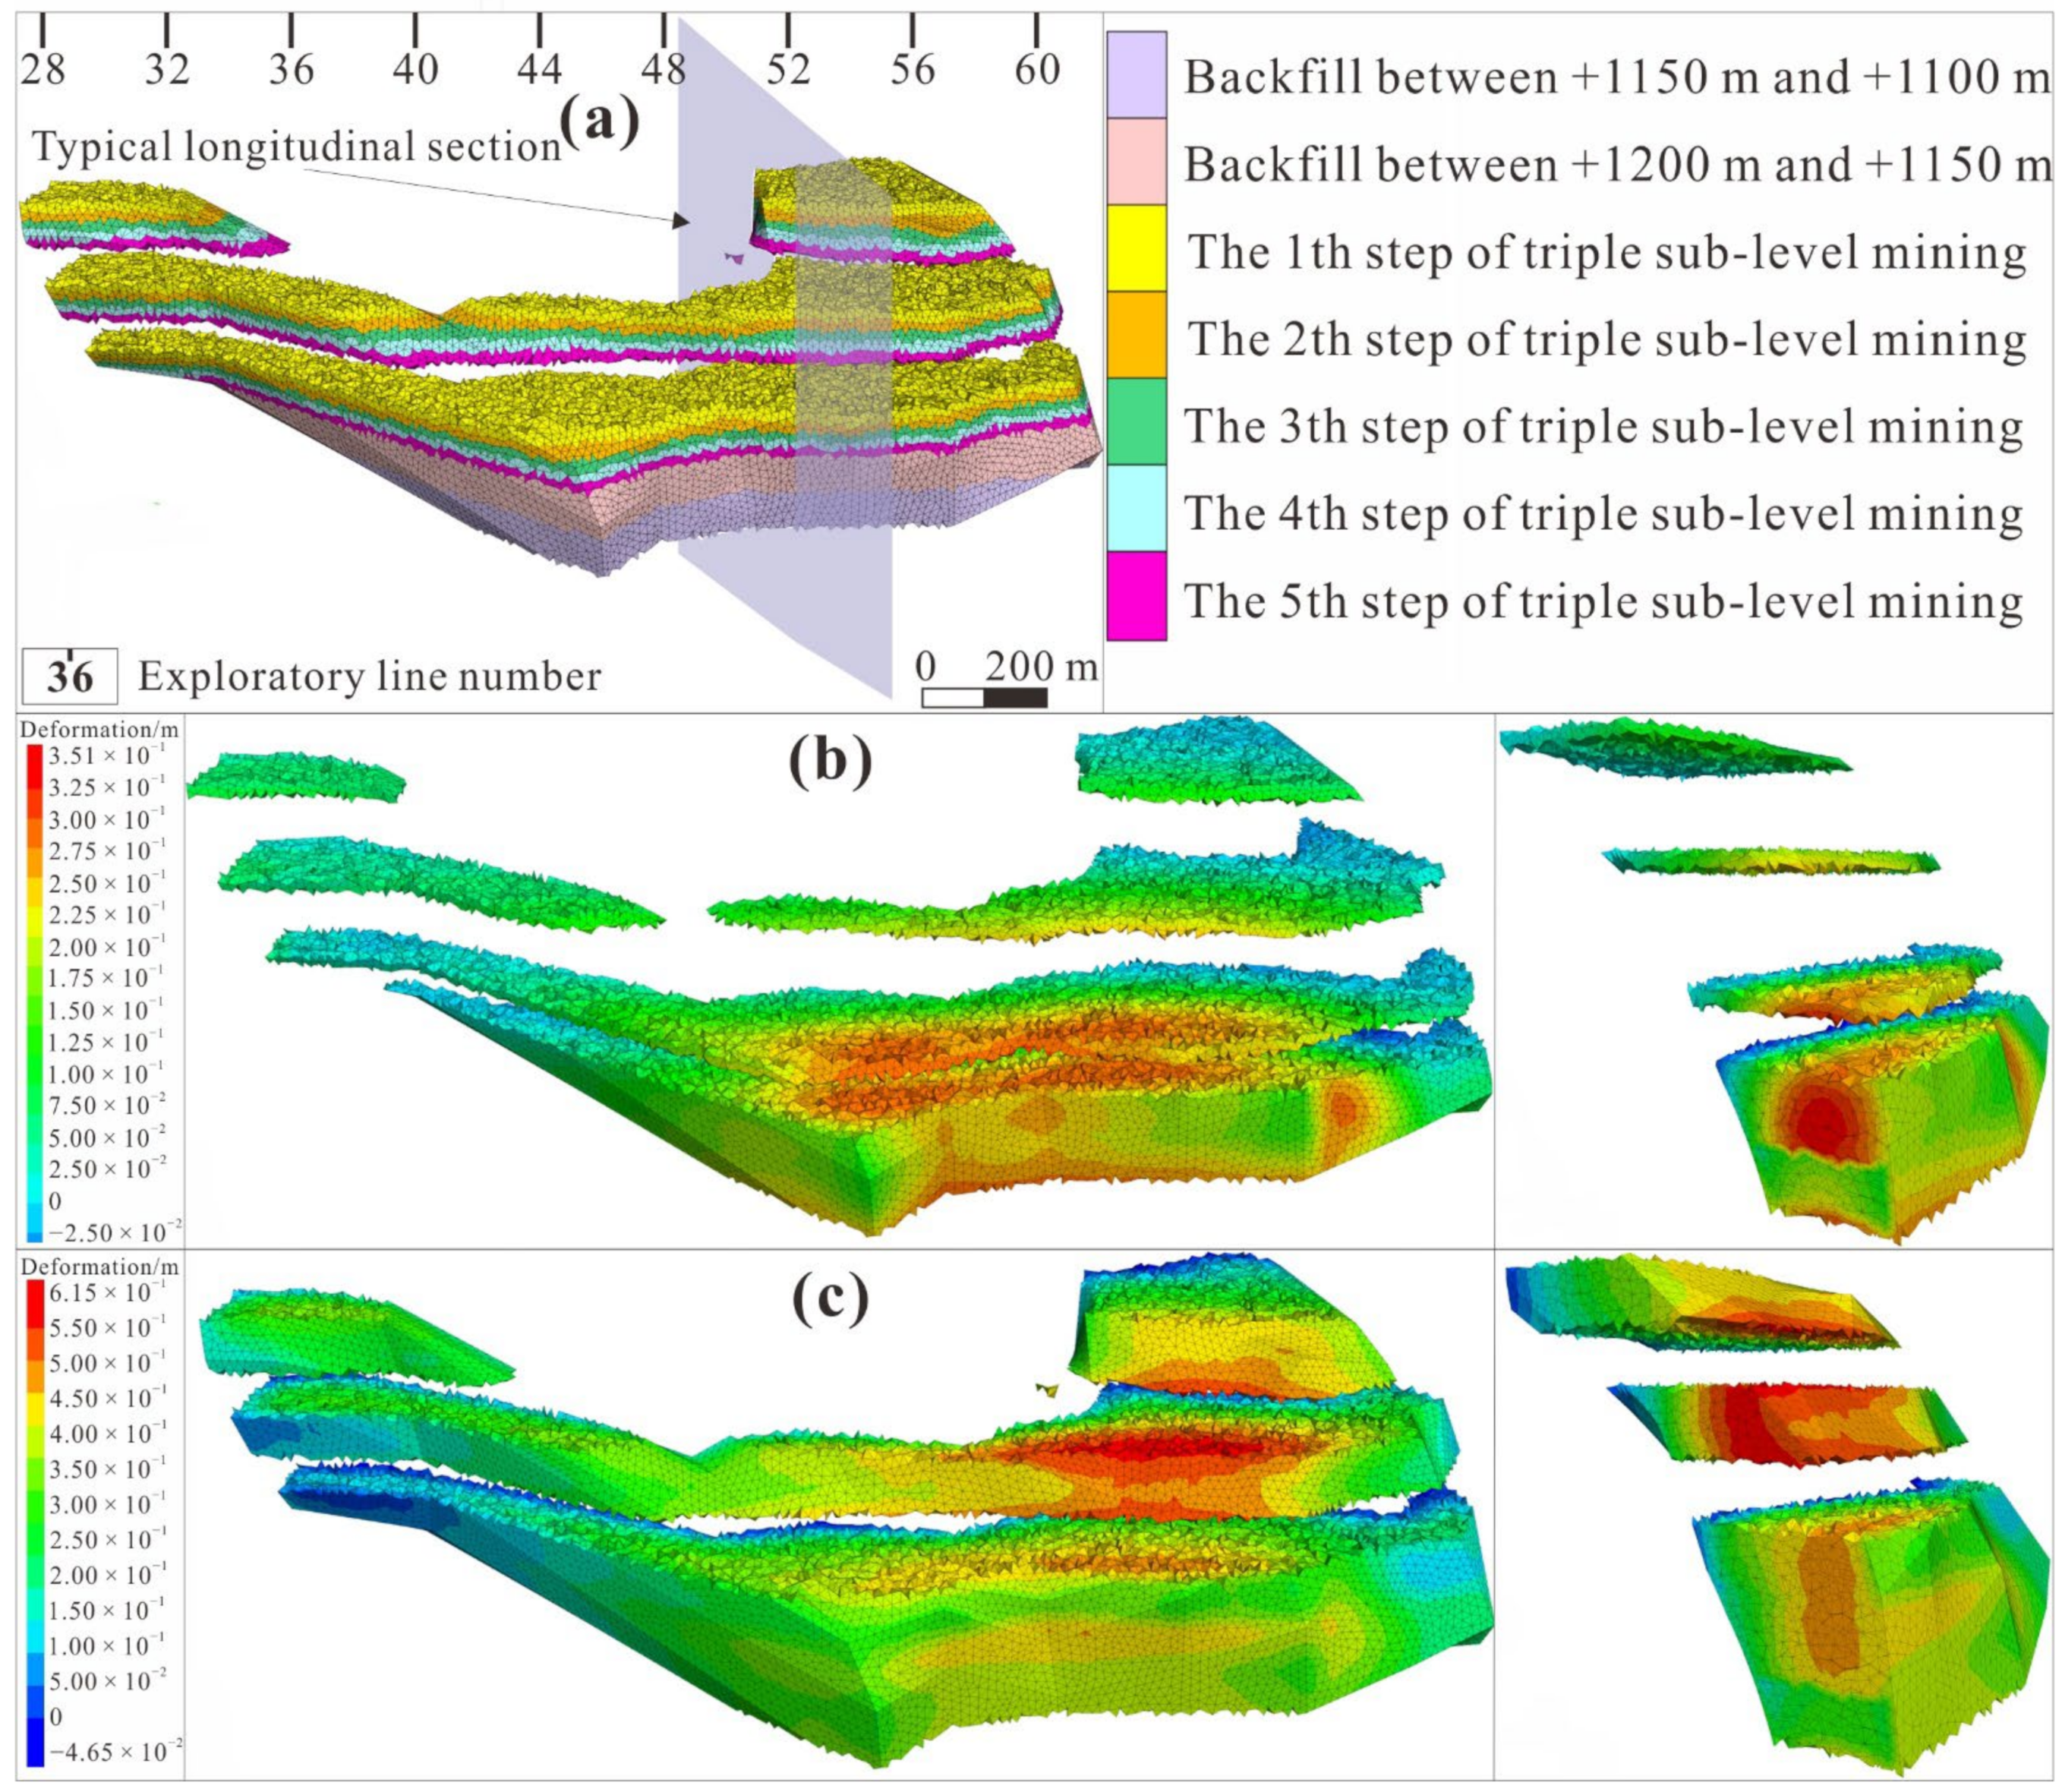
4.1. Model Building
4.2. Numerical Simulation Results of Surface Subsidence
4.3. Numerical Simulation Results of Backfill Deformation
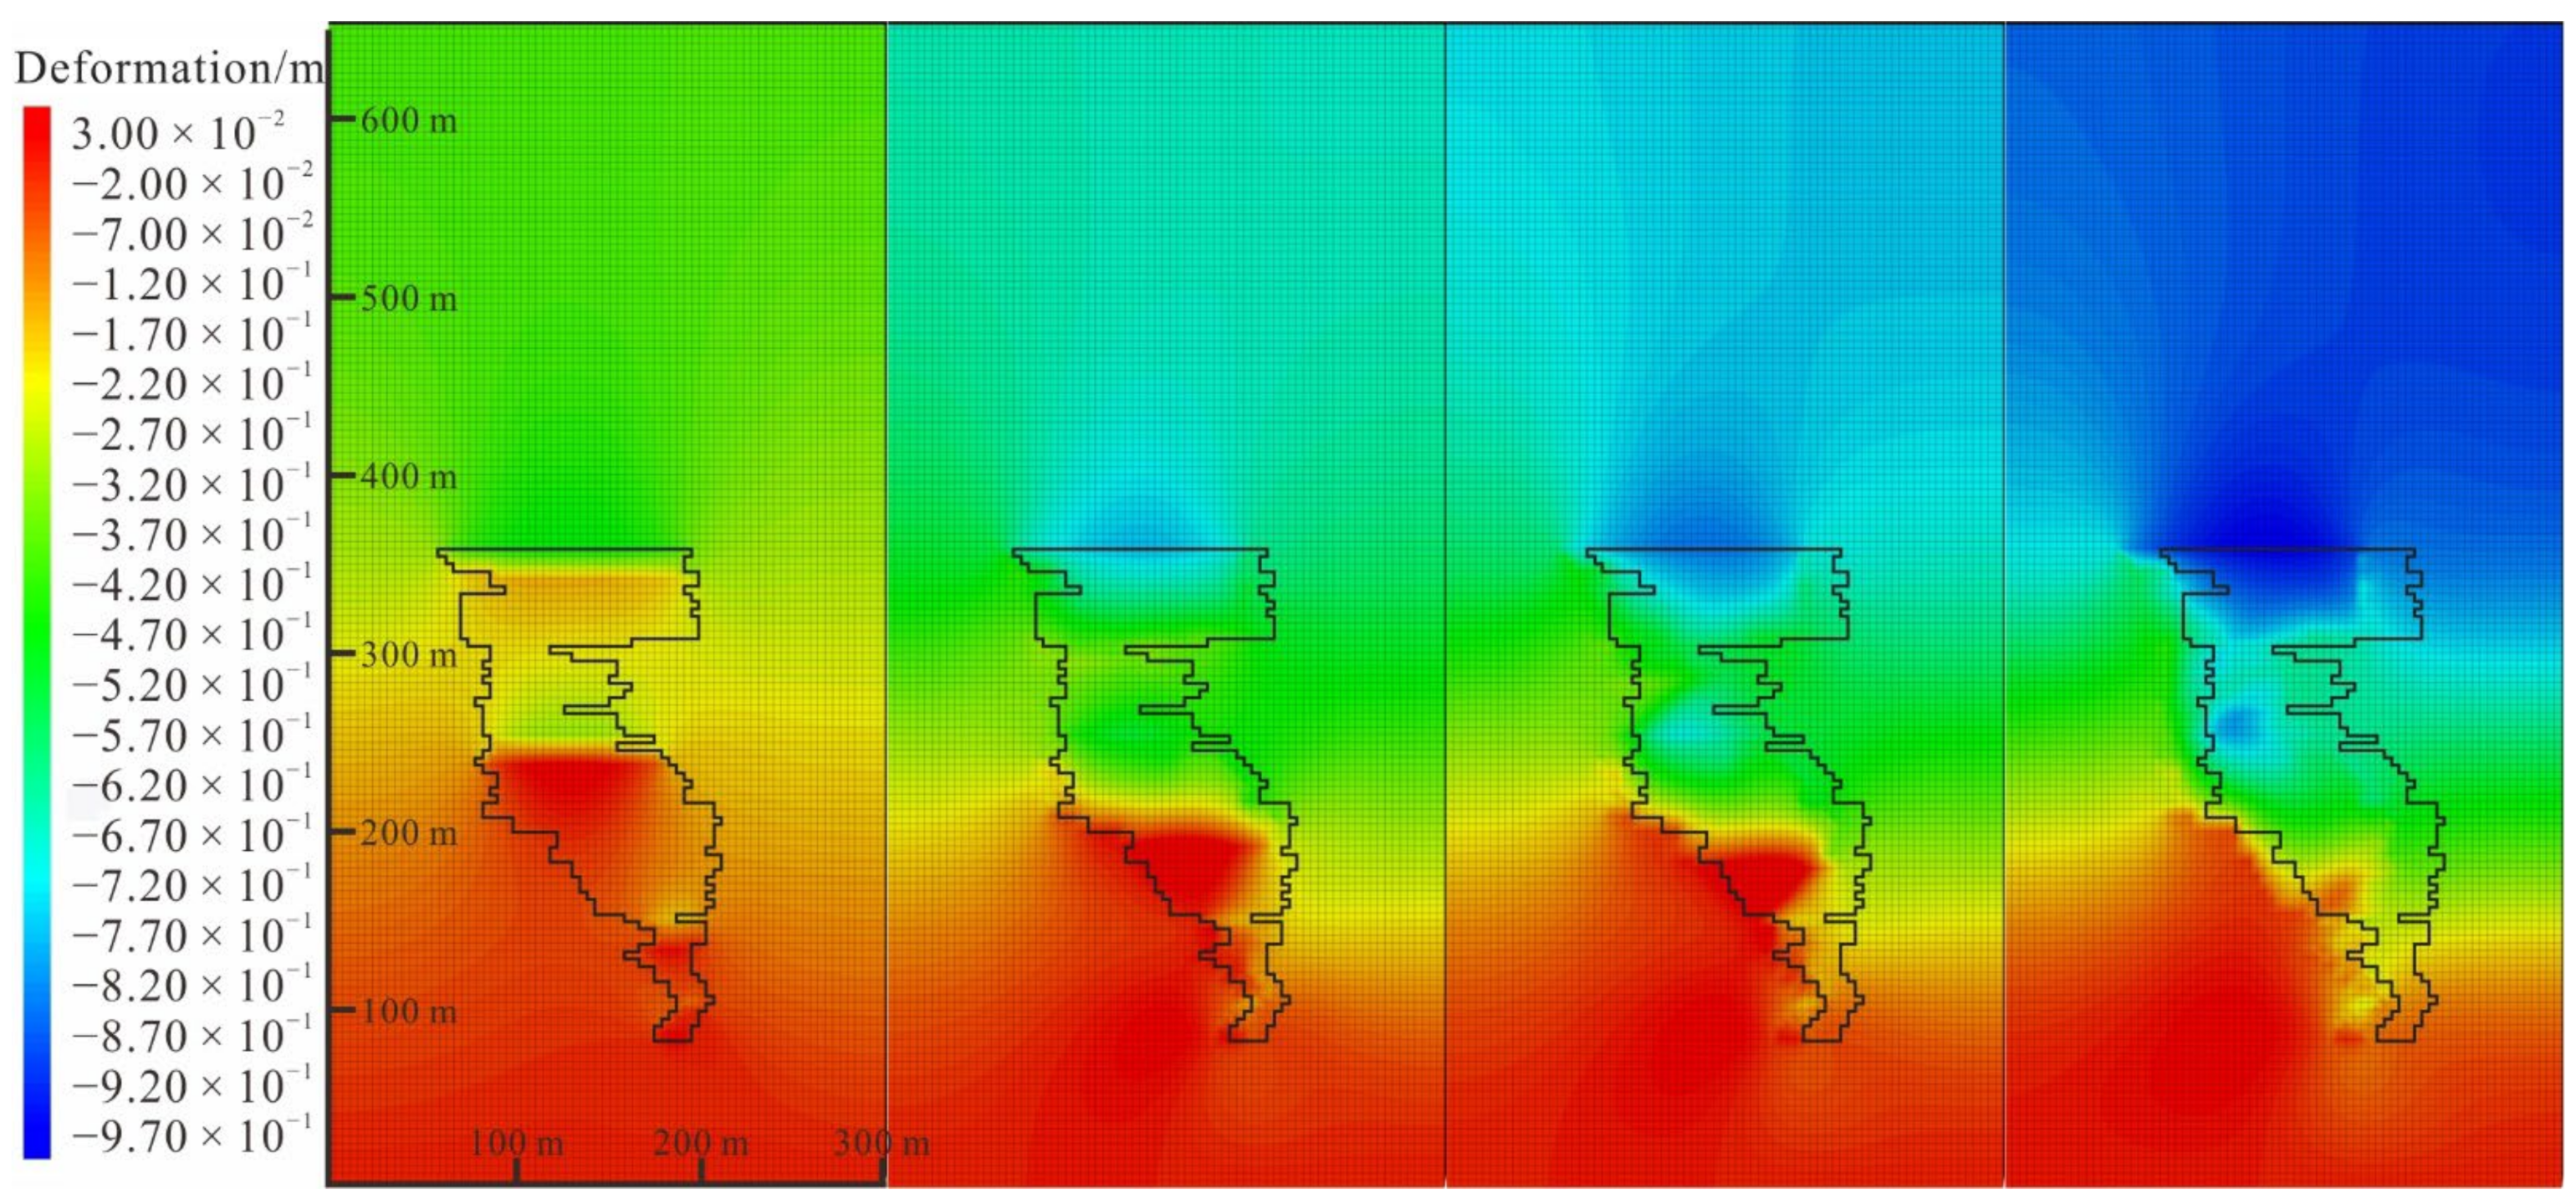
4.4. Numerical Simulation Analysis of a Typical Section
5. Discussion
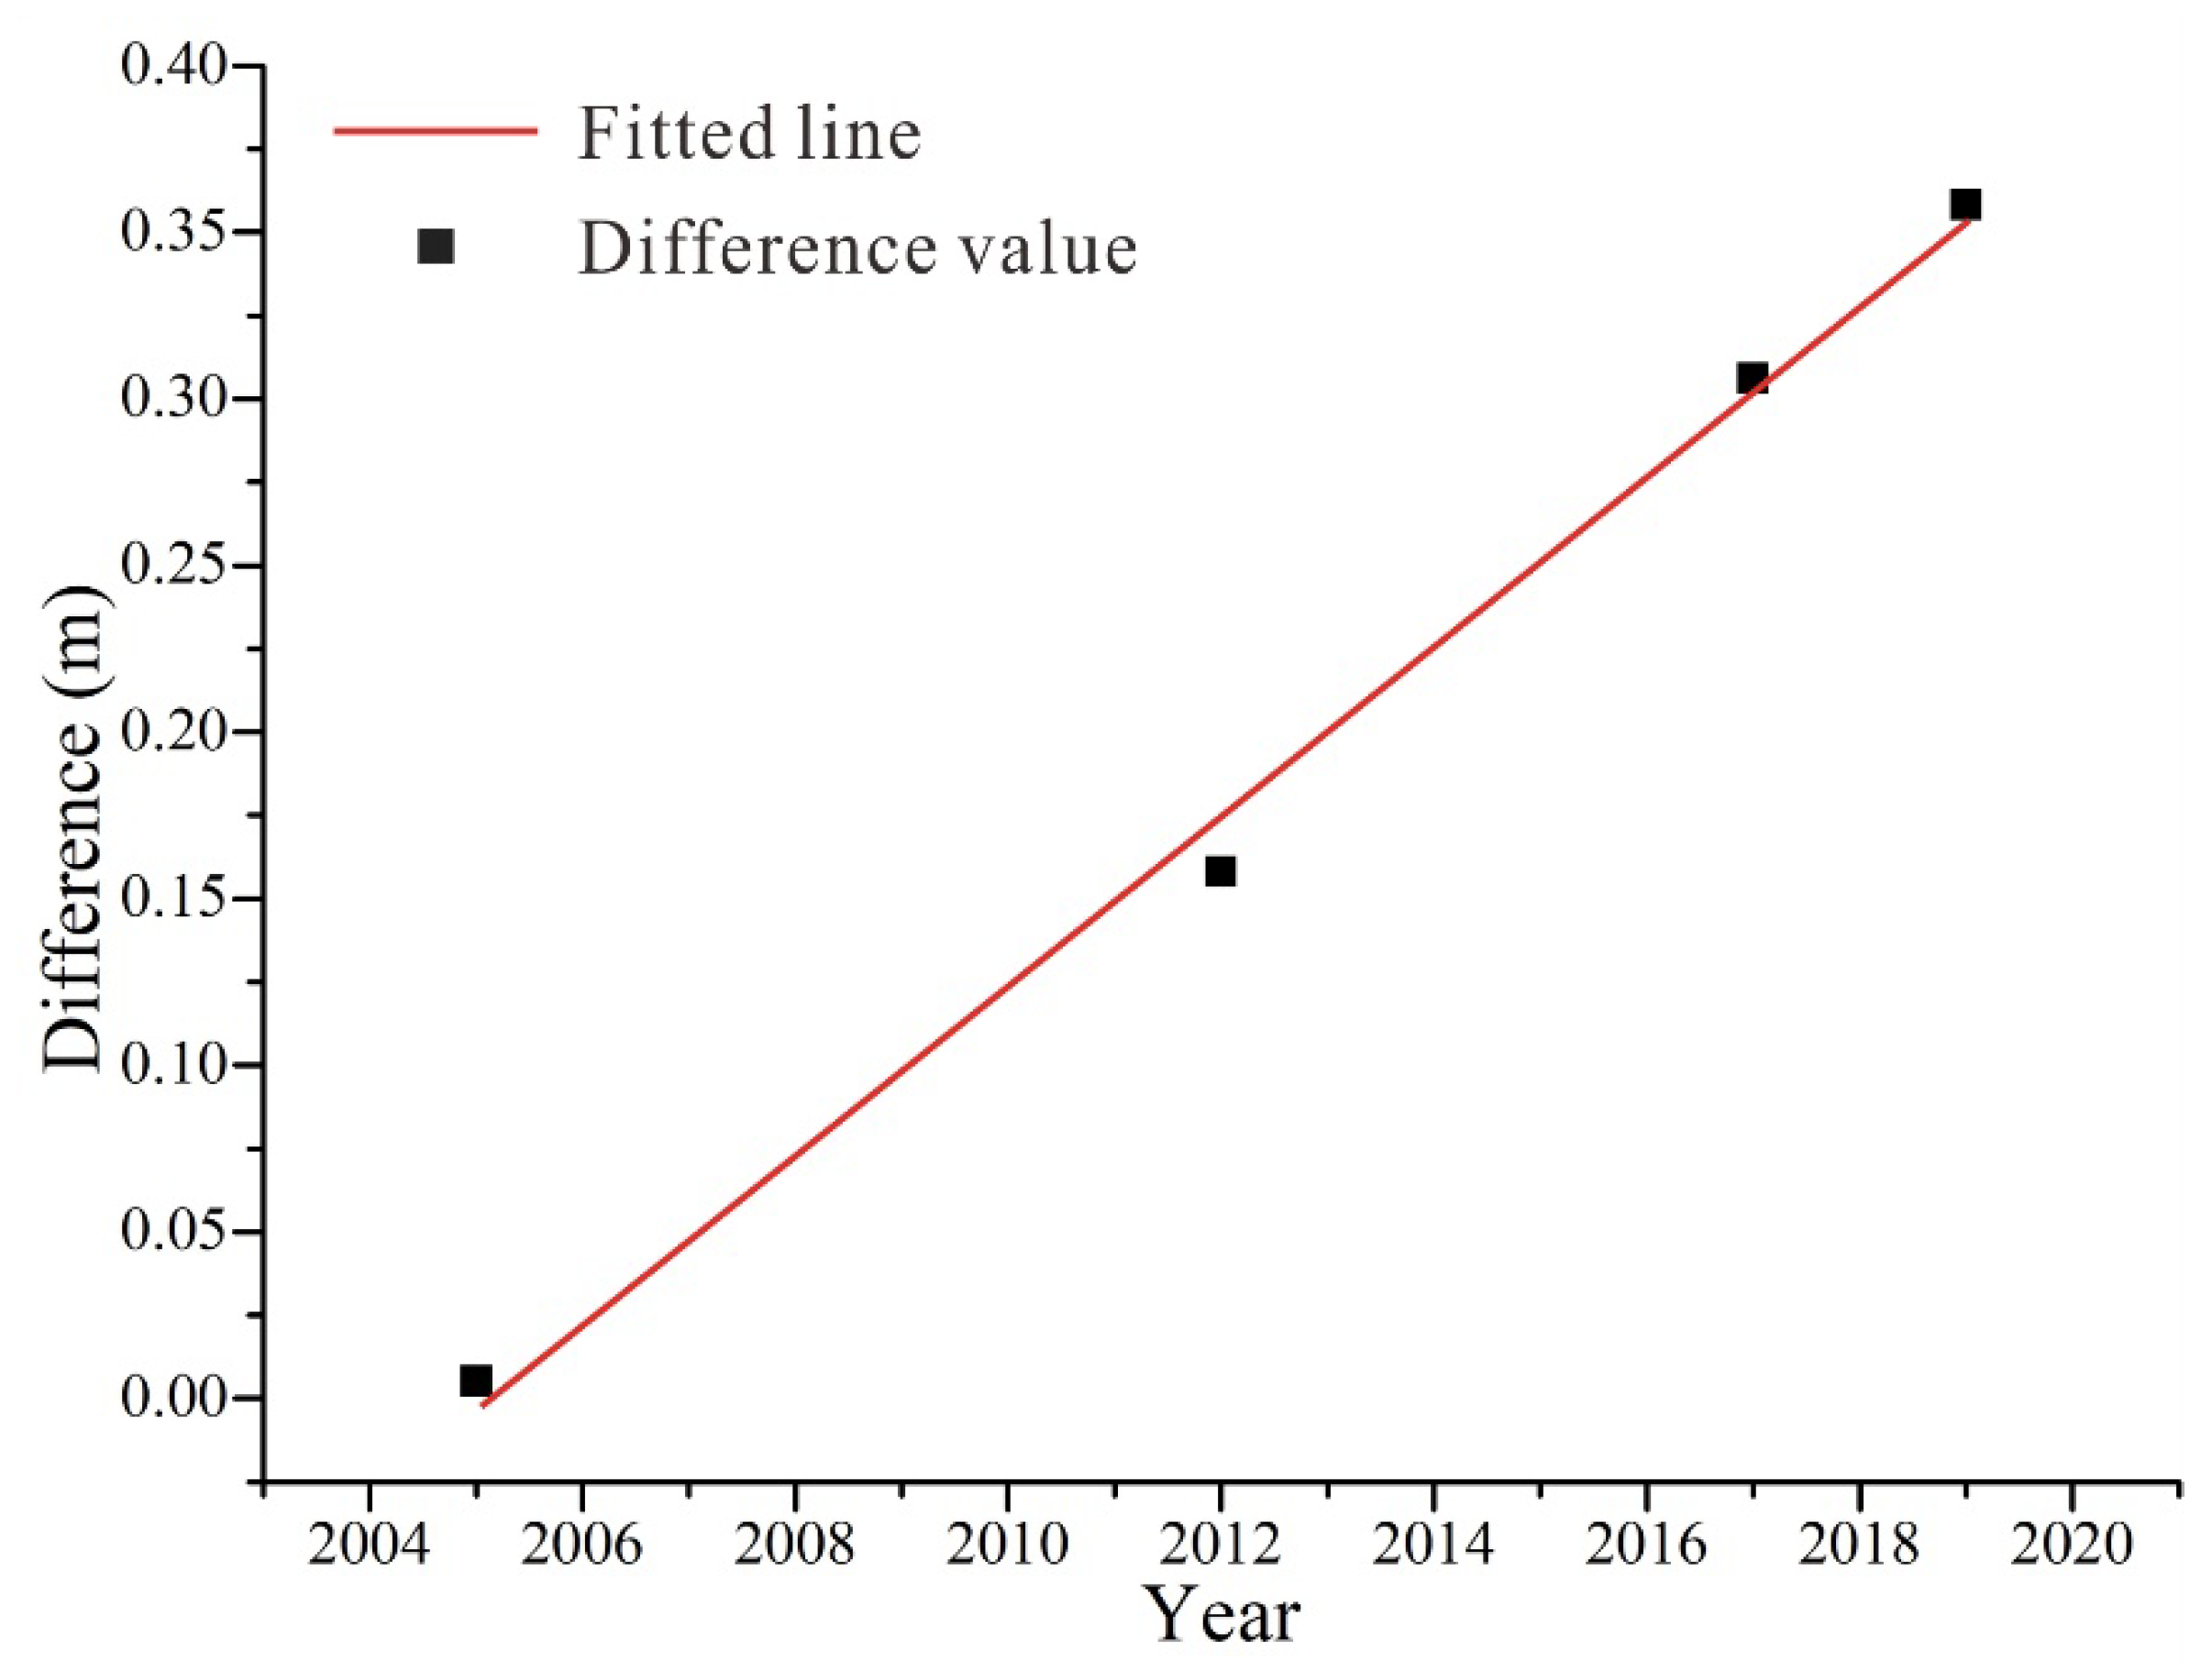
5.1. Comparison of the Results of On-Site Monitoring and Numerical Simulation
5.2. Deformation Mechanism of the Backfill
6. Conclusions
- Through the use of GNSS monitoring for many years, the mechanisms of the surface deformation in the Jinchuan No.3 mining area are analyzed. Surface deformation is mainly affected by underground mining, and a settlement funnel is formed on the ground. With continuous mining and filling, the radius of the funnel gradually expands. The settlement near the orebody is obviously larger than that far away from the orebody, and the maximum subsidence reaches 739 mm in 14.5 years. The location of the settlement center exhibits an obvious movement toward the surface above the footwall of the ore body.
- The influence of mining in the third section of the surface deformation is very significant, which is far greater than that of mining in the double section and the single section. In addition, the trend of surface movement is predicted. The single subsidence center on the upper wall develops into a double subsidence center, and the maximum value of the surface subsidence reaches about 1.35 m. Overall, the range of surface deformation will further expand, and the settlement value of the subsidence center will increase steadily. The law of surface rock movement has not changed significantly, and the settlement center has not shifted seriously, so the mining area can be considered to still be in a relatively stable state.
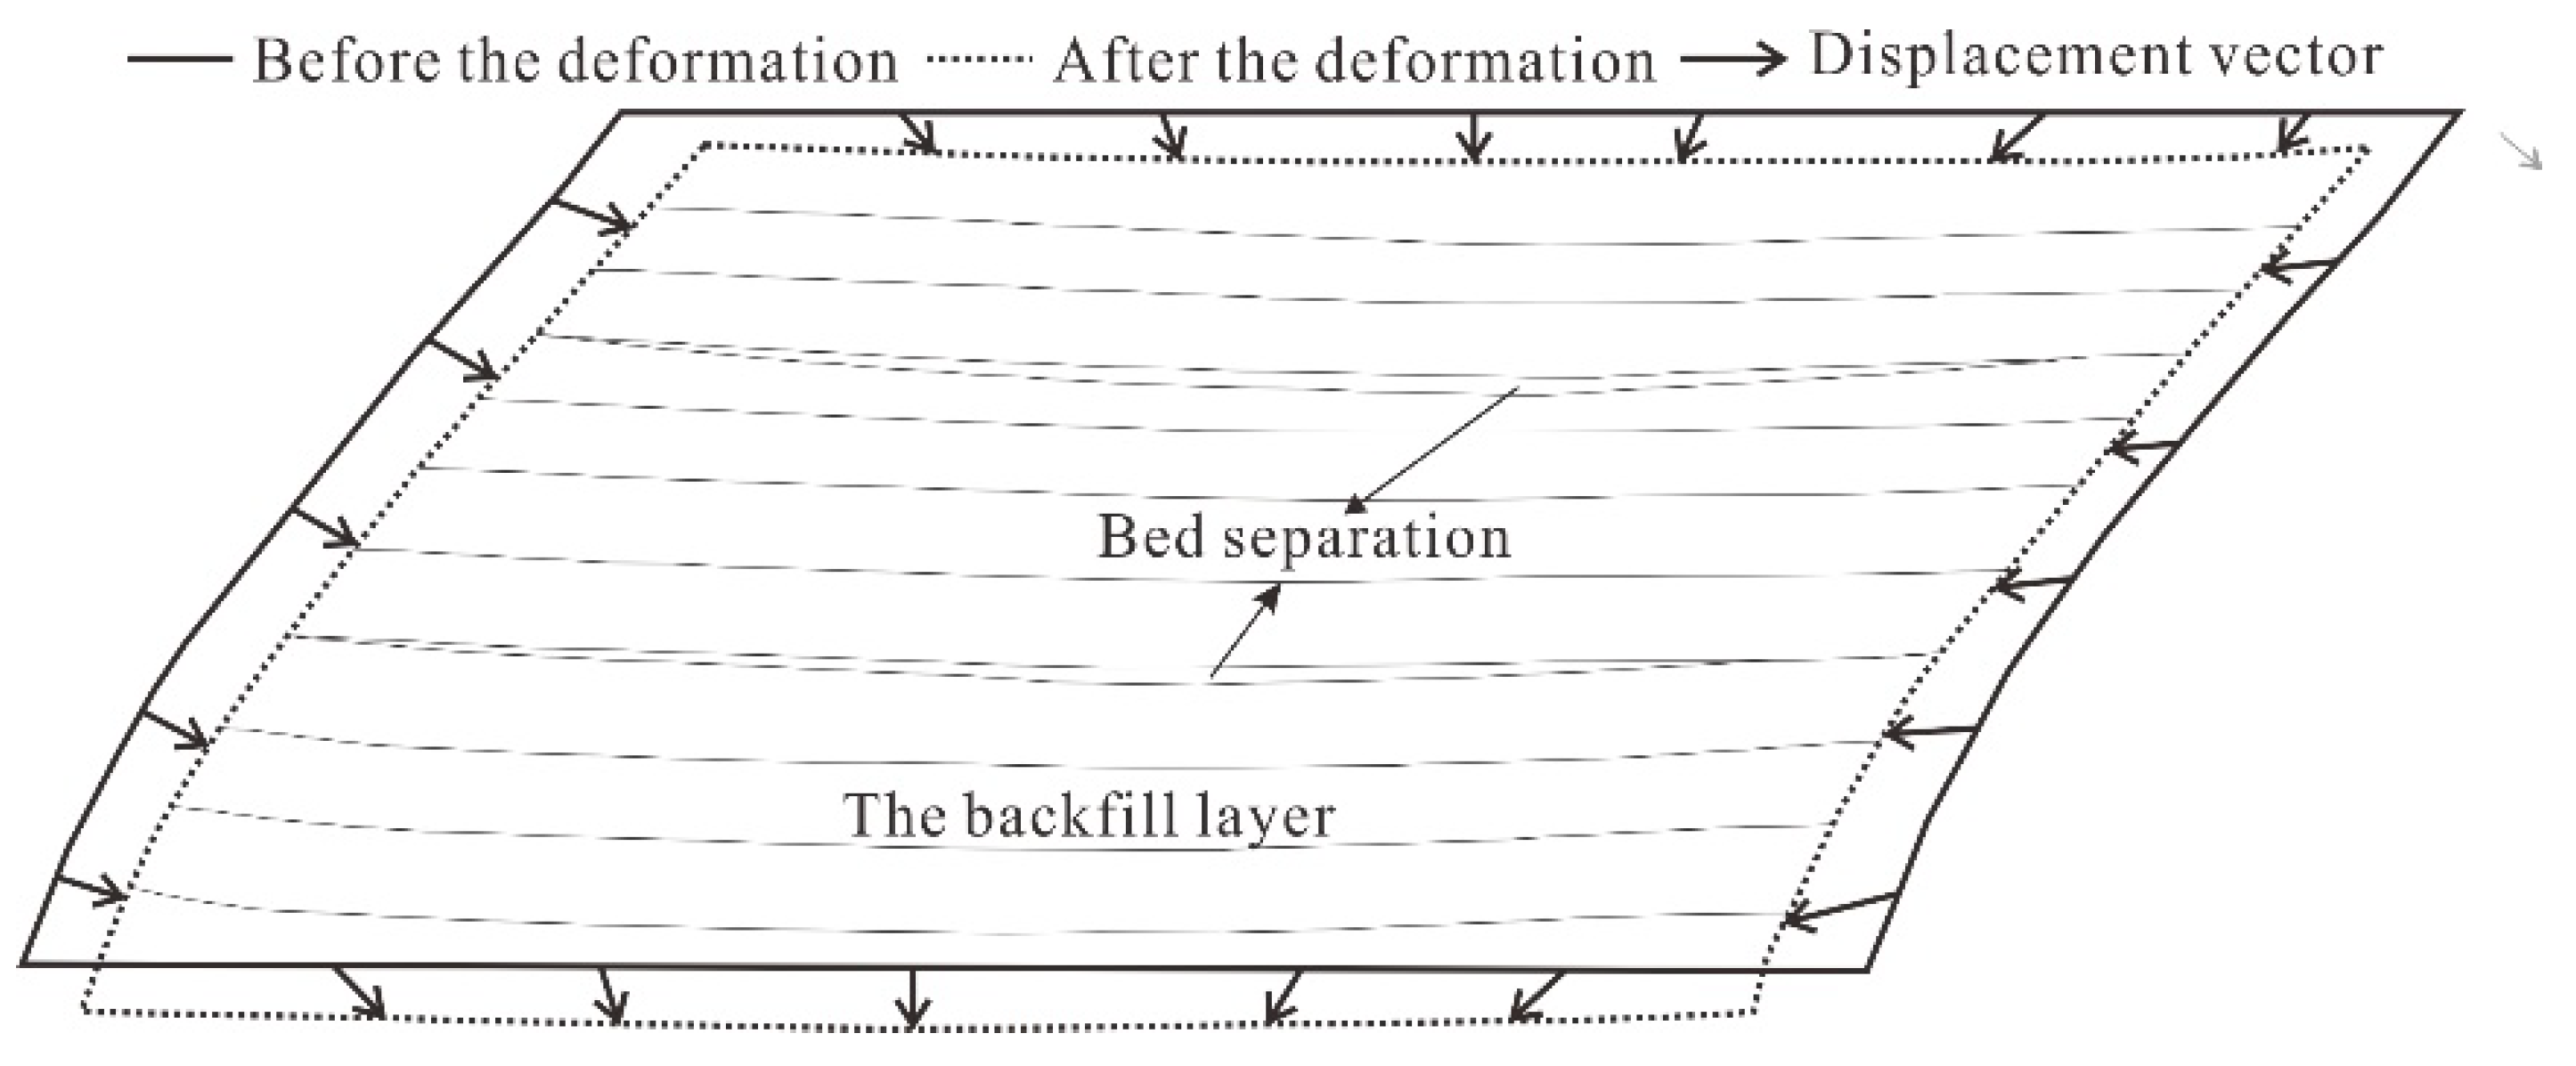
- Based on the displacement monitoring data of the underground backfill, the deformation characteristics of the filling body are summarized. The whole filling body presents obvious subsidence, which is the main cause of ground settlement. With the development of multi-stage mining and filling, bed separation phenomena are found between the filling layers, and the closer to the interior, the more obvious it becomes.
- The subsidence characteristics of the backfill are similar to those at the surface; that is, both the subsidence amount and speed are higher on the hanging wall than that on the footwall. Additionally, the backfill subsidence is slow and gradual, without sudden instability. In terms of the allowable space for deformation, the mass instability of the backfill is difficult. What needs to be considered is the influence of large-scale deformation on the mining and overlying strata, as well as the local deformation near the rock contact zone surrounding the backfill.
Author Contributions
Funding
Institutional Review Board Statement
Informed Consent Statement
Data Availability Statement
Acknowledgments
Conflicts of Interest
References
- Li, G.; Wang, Z.; Ma, F.; Guo, J.; Liu, J.; Song, Y. A case study on deformation failure characteristics of overlying strata and critical mining upper limit in submarine mining. Water 2022, 14, 2465. [Google Scholar] [CrossRef]
- Li, G.; Ma, F.; Guo, J.; Zhao, H. Deformation Characteristics and Control Method of Kilometer-Depth Roadways in a Nickel Mine: A Case Study. Appl. Sci. 2020, 10, 3937. [Google Scholar] [CrossRef]
- Liu, J.; Ma, F.; Li, G.; Guo, J.; Wan, Y.; Song, Y. Evolution Assessment of Mining Subsidence Characteristics Using SBAS and PS Interferometry in Sanshandao Gold Mine, China. Remote Sens. 2022, 14, 290. [Google Scholar] [CrossRef]
- Deng, X.; Zhang, J.; Kang, T.; Han, X. Strata behavior in extra-thick coal seam mining with upward slicing backfilling technology. Int. J. Min. Sci. Technol. 2016, 26, 587–592. [Google Scholar] [CrossRef]
- Tang, Y.; Zheng, J.; Guo, L.; Zhao, Y. Effect of gypsum addition on the mechanical and microstructural performance of sulphide-rich cemented paste backfill. Minerals 2021, 11, 283. [Google Scholar] [CrossRef]
- Ding, K.; Ma, F.; Guo, J.; Zhao, H.; Lu, R.; Liu, F. Investigation of the Mechanism of Roof Caving in the Jinchuan Nickel Mine, China. Rock Mech. Rock Eng. 2018, 51, 1215–1226. [Google Scholar] [CrossRef]
- Du, Q.; Guo, G.; Li, H.; Gong, Y. Spatio-Temporal Evolution Law of Surface Subsidence Basin with Insufficient Exploitation of Deep Coal Resources in Aeolian Sand Area of Western China. Remote Sens. 2022, 14, 2536. [Google Scholar] [CrossRef]
- Usanov, S.V.; Mel’Nik, V.V.; Zamyatin, A.L. Monitoring rock mass transformation under induced movements. J. Min. Sci. 2014, 49, 913–918. [Google Scholar] [CrossRef]
- Herrera, G.; Tomás, R.; Lopez-Sanchez, J.M.; Delgado, J.; Mallorqui, J.J.; Duque, S.; Mulas, J. Advanced D In SAR analysis on mining areas: La Union case study (Murcia, SE Spain). Eng. Geol. 2007, 90, 148–159. [Google Scholar] [CrossRef]
- Unlu, T.; Akcin, H.; Yilmaz, O. An integrated approach for the prediction of subsidence for coal mining basins. Eng. Geol. 2013, 166, 186–203. [Google Scholar] [CrossRef]
- Jianjun, S.; Chunjian, H.; Ping, L.; Junwei, Z.; Deyuan, L.; Minde, J.; Lin, Z.; Jingkai, Z.; Jianying, S. Quantitative prediction of mining subsidence and its impact on the environment. Int. J. Min. Sci. Technol. 2012, 22, 69–73. [Google Scholar] [CrossRef]
- Zhou, D.; Wu, K.; Li, L.; Diao, X.; Kong, X. A new methodology for studying the spreading process of mining subsidence in rock mass and alluvial soil: An example from the Huainan coal mine, China. Bull. Eng. Geol. Environ. 2016, 75, 1067–1087. [Google Scholar] [CrossRef]
- Nicieza, C.G.; Fernandez, M.I.A.; Diaz, A.M.; Vigil, A.E.A. The new three-dimensional subsidence influence function denoted by n-k-g. Int. J. Rock Mech. Min. Sci. 2005, 42, 372–387. [Google Scholar] [CrossRef]
- Díaz-Fernández, M.E.; Álvarez-Fernández, M.I.; Álvarez-Vigil, A.E. Computation of influence functions for automatic mining subsidence prediction. Comput. Geosci. 2010, 14, 83–103. [Google Scholar] [CrossRef]
- Ma, F.; Zhao, H.; Yuan, R.; Guo, J. Ground movement resulting from underground backfill mining in a nickel mine (Gansu Province, China). Nat. Hazards 2015, 77, 1475–1490. [Google Scholar] [CrossRef]
- Dussauge, C.; Grasso, J.R.; Helmstetter, A. Statistical analysis of rockfall volume distributions: Implications for rockfall dynamics. Geophys. Res. Solid Earth 2003, 108, 1–11. [Google Scholar] [CrossRef]
- Ma, F.; Zhao, H.; Zhang, Y.; Guo, J.; Wei, A.; Wu, Z.; Zhang, Y. GPS monitoring and analysis of ground movement and deformation induced by transition from open-pit to underground mining. J. Rock Mech. Geotech. Eng. 2012, 4, 82–87. [Google Scholar] [CrossRef]
- Nan, S.; Li, W.; Guan, W.; Liu, H.; Zhao, H.; Wen, Y.; Yao, J. Research on the Rapid Strengthening Mechanism of Microwave Field-Controlled Gypsum-Cemented Analog Materials. Minerals 2021, 11, 1348. [Google Scholar] [CrossRef]
- Wu, J.; Feng, M.; Chen, Z.; Mao, X.; Han, G.; Wang, Y. Particle size distribution effects on the strength characteristic of cemented paste backfill. Minerals 2018, 8, 322. [Google Scholar] [CrossRef]
- Lu, R.; Ma, F.S.; Guo, J.; Zhao, H.J. Monitoring and analysis of ground subsidence and backfill stress distribution in Jinchuan Mine, China. Curr. Sci. 2018, 115, 1970–1977. [Google Scholar] [CrossRef]
- Yang, X.; Pang, J.; Liu, D.; Liu, Y.; Tian, Y.; Ma, J.; Li, S. Deformation mechanism of roadways in deep soft rock at Hegang Xing’an coalmine. Int. J. Min. Sci. Technol. 2013, 23, 307–312. [Google Scholar] [CrossRef]
- Wang, M.; Guo, G.; Wang, X.; Guo, Y.; Dao, V. Floor heave characteristics and control technology of the roadway driven in deep inclined-strata. Int. J. Min. Sci. Technol. 2015, 25, 267–273. [Google Scholar] [CrossRef]
- Chang, Q.L.; Zhou, H.Q.; Xie, Z.H.; Shen, S.P. Anchoring mechanism and application of hydraulic expansion bolts used in soft rock roadway floor heave control. Int. J. Min. Sci. Technol. 2013, 23, 323–328. [Google Scholar] [CrossRef]
- Zhao, H.; Ma, F.; Zhang, Y.; Guo, J. Monitoring and mechanisms of ground deformation and ground fissures induced by cut-and-fill mining in the Jinchuan Mine 2, China. Environ. Earth Sci. 2013, 68, 1903–1911. [Google Scholar] [CrossRef]
- Haslinda, N.; Sam, C.; Afshin, A.; Zainnuddin, M.D.; Bujang, K.H. Effect of inundation on shear strength characteristics of mudstone backfill. Eng. Geol. 2013, 158, 48–56. [Google Scholar]
- Woo, K.; Eberhardt, E.; Elmo, D.; Stead, D. Empirical investigation and characterization of surface subsidence related to block cave mining. Int. J. Rock Mech. Min. Sci. 2013, 61, 31–42. [Google Scholar] [CrossRef]
- Mohammadali, S.; Apel, D.B.; Hall, R.A. Prediction of mininginduced surface and ground movements at a Canadian diamond mine using an elastoplastic finite element model. Int. J. Rock Mech. Min. Sci. 2017, 100, 73–82. [Google Scholar]
- Uibu, M.; Somelar, P.; Raado, L.; Irha, N.; Hain, T.; Koroljova, A.; Kuusik, R. Oil shale ash based backfilling concrete-strength development, mineral transformations and leachability. Constr. Build. Mater. 2016, 102, 620–630. [Google Scholar] [CrossRef]
- Aldhafeeri, Z.; Fall, M. Time and damage induced changes in the chemical reactivity of cemented paste backfill. J. Environ. Chem. Eng. 2016, 4, 4038–4049. [Google Scholar] [CrossRef]
- Chen, X.; Guo, H.; Zhao, P.; Peng, X.; Wang, S. Numerical modeling of large deformation and nonlinear frictional contact of excavation boundary of deep soft rock tunnel. J. Rock Mech. Geotech. Eng. 2011, 3, 421–428. [Google Scholar]
- Li, G.; Ma, F.; Guo, J.; Zhao, H.; Liu, G. Study on deformation failure mechanism and support technology of deep soft rock roadway. Eng. Geol. 2020, 264, 105262. [Google Scholar] [CrossRef]
- Li, G.; Ma, F.S.; Guo, J.; Zhao, H. Experimental research on deformation failure process of roadway tunnel in fractured rock mass induced by mining excavation. Environ. Earth Sci. 2022, 82, 243. [Google Scholar] [CrossRef]
- Yang, Z.Q. Key technology research on the efficient exploitation and comprehensive utilization of resources in the deep Jinchuan nickel deposit. Engineering 2017, 3, 559–566. [Google Scholar] [CrossRef]
- Li, G.; Ma, F.S.; Guo, J.; Zhao, H. Case study of roadway deformation failure mechanisms: Field investigation and numerical simulation. Energies 2021, 14, 1032. [Google Scholar] [CrossRef]
- Li, G.; Ma, F.; Liu, G.; Zhao, H.; Guo, J. A Strain-Softening Constitutive Model of Heterogeneous Rock Mass Considering Statistical Damage and Its Application in Numerical Modeling of Deep Roadways. Sustainability 2019, 11, 2399. [Google Scholar] [CrossRef]
- Chen, L.; Fan, G.; Zhang, D.; Fan, Z.; Wang, X.; Zhang, W.; Yao, N. Numerical Simulation of Crack Initiation and Propagation Evolution Law of Hydraulic Fracturing Holes in Coal Seams Considering Permeability Anisotropy and Damage. Minerals 2022, 12, 494. [Google Scholar] [CrossRef]


| Type | Density (g·cm−3) | Tensile Strength (MPa) | Compressive Strength (MPa) | Cohesion (MPa) | Internal Friction Angle (°) | Elastic Moduli (GPa) | Poisson’s Ratio |
|---|---|---|---|---|---|---|---|
| Surrounding rock | 2.6 | 12.2 | 152 | 13.5 | 35 | 64 | 0.28 |
| Rich ore | 3.05 | 0.5 | 16.4 | 4.6 | 41.7 | 8.6 | 0.31 |
| Poor ore | 3.02 | 0.5 | 17.2 | 5.2 | 42.2 | 8.8 | 0.22 |
| Backfill | 2 | 0.800 | 9.900 | 0.95 | 38 | 7.28 | 0.32 |
| Mining Step | Year | Field Monitoring (m) | Numerical Simulation (m) | Difference (m) |
|---|---|---|---|---|
| 1 | 2002 | - | 0.016 | - |
| 2 | 2005 | 0.026 | 0.020 | 0.006 |
| 3 | 2012 | 0.415 | 0.256 | 0.159 |
| 4 | 2017 | 0.613 | 0.307 | 0.306 |
| 5 | 2019 | 0.739 | 0.381 | 0.358 |
| 2029 | - | 0.750 | - |
Publisher’s Note: MDPI stays neutral with regard to jurisdictional claims in published maps and institutional affiliations. |
© 2022 by the authors. Licensee MDPI, Basel, Switzerland. This article is an open access article distributed under the terms and conditions of the Creative Commons Attribution (CC BY) license (https://creativecommons.org/licenses/by/4.0/).
Share and Cite
Li, G.; Wan, Y.; Guo, J.; Ma, F.; Zhao, H.; Li, Z. A Case Study on Ground Subsidence and Backfill Deformation Induced by Multi-Stage Filling Mining in a Steeply Inclined Ore Body. Remote Sens. 2022, 14, 4555. https://doi.org/10.3390/rs14184555
Li G, Wan Y, Guo J, Ma F, Zhao H, Li Z. A Case Study on Ground Subsidence and Backfill Deformation Induced by Multi-Stage Filling Mining in a Steeply Inclined Ore Body. Remote Sensing. 2022; 14(18):4555. https://doi.org/10.3390/rs14184555
Chicago/Turabian StyleLi, Guang, Yang Wan, Jie Guo, Fengshan Ma, Haijun Zhao, and Zhiqing Li. 2022. "A Case Study on Ground Subsidence and Backfill Deformation Induced by Multi-Stage Filling Mining in a Steeply Inclined Ore Body" Remote Sensing 14, no. 18: 4555. https://doi.org/10.3390/rs14184555
APA StyleLi, G., Wan, Y., Guo, J., Ma, F., Zhao, H., & Li, Z. (2022). A Case Study on Ground Subsidence and Backfill Deformation Induced by Multi-Stage Filling Mining in a Steeply Inclined Ore Body. Remote Sensing, 14(18), 4555. https://doi.org/10.3390/rs14184555