Article

A Repeater-Type SAR Deceptive Jamming Method Based on Joint Encoding of Amplitude and Phase in the Intra-Pulse and Inter-Pulse

1
Henan Engineering Research Center of Intelligent Technology and Application, Henan University, Kaifeng 475004, China
2
Henan Key Laboratory of Big Data Analysis and Processing, Henan University, Kaifeng 475004, China
3
College of Computer and Information Engineering, Henan University, Kaifeng 475004, China
*
Author to whom correspondence should be addressed.
Remote Sens. 2022, 14(18), 4597; https://doi.org/10.3390/rs14184597
Submission received: 28 July 2022 / Revised: 10 September 2022 / Accepted: 12 September 2022 / Published: 14 September 2022
(This article belongs to the Special Issue SAR-Based Signal Processing and Target Recognition)

Abstract

:
Due to advantages such as low power consumption and high concealment, deceptive jamming against synthetic aperture radar (SAR) has received extensive attention in electronic countermeasures. However, the false targets generated by most of the deceptive jamming methods still have limitations, such as poor controllability and strong regularity. Inspired by the idea of waveform coding, this paper proposed a repeater-type SAR deceptive jamming method through the joint encoding of amplitude and phase in intra-pulse and inter-pulse, which can generate a two-dimensional controllable deceptive jamming effect. Specifically, the proposed method mainly includes two parts, i.e., grouping and encoding. The number of groups determines the number of false targets, and the presence of the phase encoding produces false targets. The amplitude encoding affects the amplitude of the false targets. For the intra-pulse cases, the proposed method first samples the intercepted SAR signal. Meanwhile, the sampling points are grouped in turn. For the inter-pulse cases, the grouped objects are the pulses. Subsequently, the joint encoding of amplitude and phase is performed on each group, which generates jamming signals with deceptive effects. In this paper, the imaging effect of the generated jamming signals is analyzed in detail, and the characteristics of false targets, including numbers, position, and amplitude, are derived. The simulation and experimental results verify the correctness of the theoretical analysis. In addition, the superiority of the proposed method is verified by comparing it with other methods.

Graphical Abstract

1. Introduction

1.1. Background

Synthetic aperture radar (SAR) is an active microwave remote sensing imaging system [1,2,3]. Compared with optical remote sensing, SAR has unique advantages that can work at all times of day and under complex weather conditions and is widely used in various fields, such as environmental remote sensing [4,5,6,7] and military reconnaissance [8,9]. Especially in the military field, SAR has progressed into becoming the core sensor of strategic reconnaissance and battlefield surveillance in modern warfare. Meanwhile, to protect the information of important targets and areas, various jamming technologies against SAR have been paid more and more attention in the field of electronic countermeasures (ECM) [10,11,12].
SAR jamming technology actually prevents the enemy from obtaining effective information from SAR imaging [13]. In general, from the perspective of the jamming effect, SAR jamming can be classified into barrage and deceptive jamming. Barrage jammers increase the noise level of the echo to bury the target of interest by transmitting random noise over a frequency band wider than the SAR bandwidth [14]. Although the implementation of barrage jamming is simple, the power requirements of the jammer are relatively high, which means that it will face an expensive cost budget in actual ECM. Deceptive jamming implants an elaborately designed false scene or target into the SAR image by sending a false target signal with similar characteristics to the real target signal, which affects the interpretation process of the SAR image and achieves the jamming effect of “hard to distinguish real from imitation” [15]. Deceptive jamming, as opposed to barrage jamming, does not require high transmit power and has the advantages of strong concealment and low consumption. In addition, even if the deceptive target is discovered, it is difficult to eliminate by common anti-jamming measures. As a result, the study of deceptive jamming obtains more appealing and promising results for future ECM [16,17].

1.2. Previous Work

In the past few decades, various deceptive jamming methods have been proposed. According to the workflow of jamming implementation, these methods can be classified into direct-type and repeater-type deceptive jamming [18].

1.2.1. Direct-Type Deceptive Jamming

According to the parameter information of the reconnaissance SAR signal, the direct-type deceptive jamming directly generates jamming signals and transmits them to the enemy, which creates false targets in the SAR image. The key to implementation depends on the accuracy of electronic reconnaissance. Reference [19] analyzed the influence of direct-type jamming with different parameter errors on the jamming effect through simulation experiments. Qu et al. developed a reconnaissance equation for SAR satellite reconnaissance, which realized the requirements for grounding the reconnaissance equipment in the reconnaissance of satellite signals [20].
Although direct-type jamming has the advantage of being one-way, it relies heavily on the accuracy of electronic reconnaissance. Meanwhile, the direct-type jamming needs to accurately calculate the position of the SAR flight to transmit the false target jamming signal to the corresponding pulse moment, which is usually difficult to achieve in the environment of high-speed, changing warfare.

1.2.2. Repeater-Type Deceptive Jamming

For repeater-type deceptive jamming, the jammer intercepts the SAR signal in the protected area and applies a specific modulating method to generate the jamming signal. Subsequently, the generated jamming signal is retransmitted back to the SAR device. Compared to direct-type deceptive jamming, repeater-type deceptive jamming is simpler to implement, has lower parameter accuracy requirements, and does not require calculating the radar flight position. Given these benefits, repeater-type deceptive jamming has received a great deal of attention. At present, the main methods include time-delay phase modulation, convolution modulation, frequency diverse array (FDA), and interrupted sampling repeater jamming (ISRJ).
(1) Time-delay phase modulation: The jamming method of time-delay phase modulation is a traditional SAR deceptive jamming method that treats the jammer as a linear time-invariant (LTI) system within a single pulse repetition interval (PRI). After passing through the LTI system, the intercepted SAR is modulated with a time-delay phase to generate false targets in the SAR image. However, it faces two problems. One is to accurately calculate the propagation delay between jammers and false scatterers at each PRI. The other is that it requires a large amount of computation. To overcome these deficiencies, Lin. et al. proposed a fast generation method for SAR deceptive jamming signals based on the inverse Range Doppler (RD) algorithm [21]. Reference [22] proposed a method for segmented modulation. From the frequency-domain, Yang et al. proposed a method of frequency-domain pre-modulation [23]. Reference [24] proposed a frequency-domain three-stage algorithm method. Liu. et.al. proposed an inverse Omega-K algorithm method [25]. Subsequently, Yang et al. proposed a large-scene deceptive jamming method based on the idea of module division [26]. On this basis, Yang et al. proposed a large scene deceptive jamming algorithm based on time-delay and frequency-shift template segmentation [27].
Although the above methods alleviate the insufficiency to a certain extent, a large amount of computational burden and the accurate calculation of the propagation delay are still unresolved problems.
(2) Convolution modulation: Convolution modulation jamming obtains the jamming signal by convolving the pre-designed jamming function and the intercepted SAR signal. Wang et al. first proposed the principle of convolution modulation jamming implementation [28]. Zhou et al. proposed a large-scene deceptive algorithm based on the convolution modulation theorem [29]. However, it was only suitable for spaceborne SAR in broadside mode. Zhao et al. proposed a jamming method that used an electromagnetic model of the target, which could reflect more details such as scatterer changes and shielding effects [30]. However, a lot of computational resources were still required. Tai et al. proposed a parallel convolutional deceptive jamming method [31].
Although SAR deceptive jamming based on convolution modulation does not need to accurately calculate the propagation delay between jammers and false scatterers, constrained to the convolution theorem, the false targets often lag behind the real targets. Meanwhile, a high level of computational complexity is also required, which is difficult to maintain in real-time processing.
(3) FDA: The FDA-based jamming method has small frequency increments between adjacent antenna elements, which produces a transmitted beam pattern related to angle, range, and even time. Zhu et al. first proposed a spaceborne SAR deceptive jamming technology based on the characteristics of FDA [32], which could generate evenly distributed false targets in the SAR image. Bang et al. proposed FDA-based space–time–frequency deceptive jamming against SAR [33]. By controlling the array number and frequency increment of FDA, the false targets could be generated, but the imaging effect of edge false targets was low. Huang et al. proposed a spaceborne scattered-wave, FDA-based SAR deceptive jamming method [34] and analyzed the imaging effect in detail. However, the false targets generated only exist in the range direction. On this basis, Huang et al. applied the FDA-based SAR jamming method to move the deceptive target.
FDA-based SAR deceptive jamming has low computational complexity and can control the number of false targets [35]. However, restricted by equipment, FDA-based SAR deceptive jamming still has the following deficiencies. First, if an excessively large frequency increment is used, additional range ambiguity and Doppler ambiguity will be generated, which results in poor imaging quality in the false targets. Second, the number of false targets depends on the number of FDA array antennas, which will increase the hardware cost and system complexity if a large number of false targets are to be generated. Third, the false target only exists in the range direction and cannot achieve two-dimensional (2D) deceptive jamming.
(4) ISRJ: Based on the working method of sending and receiving time-sharing data, ISRJ has received extensive attention in recent years. Wang et al. first proposed the idea of ISRJ and expounded the mathematical principles [36]. Wu et al. applied ISRJ to SAR for the first time and proposed an implementation scheme for ISRJ in the range and azimuth directions [37]. Subsequently, Zhong et al. proposed an improved ISRJ algorithm, which was based on the digital radio frequency memory (DRFM) technique and could obtain multiple false targets before the real targets [38]. Feng et al. summarized the ISRJ jamming technical framework and analyzed, in detail, the key jamming factors that determine the characteristics of false targets [39]. Sun et al. proposed a jamming method combining phase modulation and ISRJ, but it only simulated one-dimensional (1D) signals [40].
Although ISRJ can produce 2D deceptive jamming effects, the amplitude of false targets is distributed in the shape of a sin c function. In addition, the number of false targets is jointly determined by a variety of parameters, and it is difficult to precisely control the number of false targets [39].
In brief, although the above methods can produce deceptive jamming effects in SAR images, they still have their limitations. Meanwhile, with the continuous development of ECM, some composite methods have been proposed [41,42]. However, most of these jamming methods are a combination of existing jamming methods. Therefore, for enriching the theory of ECM and realizing the protection of sensitive targets, it is of great significance to develop diversified and controllable deceptive jamming methods.

1.3. Main Contributions of This Paper

To overcome the limitations of existing jamming methods, inspired by the idea of waveform coding, this paper proposes a 2D, controllable, diversified SAR deceptive jamming method. The core of the proposed method is to encode the intercepted SAR signal. By applying different encoding forms, diverse deceptive jamming effects can be achieved in the SAR image. Specifically, the intra-pulse coding controls the range direction jamming effect, and the inter-pulse coding controls the azimuth direction jamming effect. In intra-pulse coding cases, the method first samples the intercepted SAR signal and the special grouping of sampling points. Then, amplitude and phase joint encoding is performed for each group separately. The number of false targets is determined by the number of groups, and the joint encoding of phase and amplitude affects the amplitude ratio of the false target to the real target. In the inter-pulse coding case, the principle is similar to that of intra-pulse coding. The difference is that the encoding objects of the inter-pulse are pulse trains. More specifically, the major contributions of this paper can be summarized as.
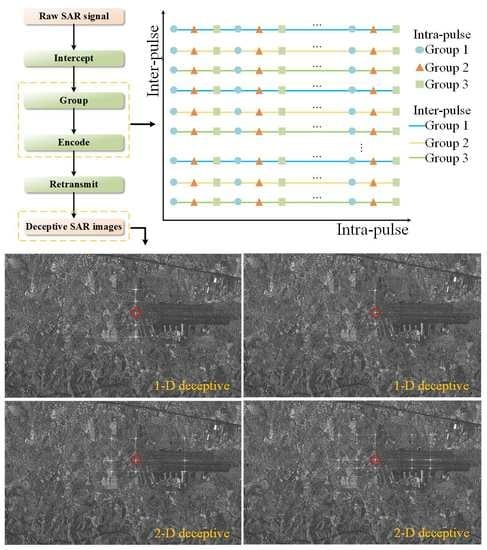
  • A repeater-type deceptive jamming model is established, and a deceptive jamming method through the joint coding of amplitude and phase in intra-pulse and inter-pulse (CAPII) is proposed. The proposed method can generate false targets with different amplitudes and numbers in 2D.
  • The imaging results of the proposed algorithm are analyzed and deduced in detail. Specifically, false target characteristics, including the number, position, and amplitude of the false target, are discussed separately.
  • The feasibility of the proposed method is verified by simulation experiments. Using ISRJ and FDA as a comparative experiment, the superiority of the proposed method is verified.

1.4. Organization of This Paper

The remainder of this article is organized as follows. The model of repeater-type deceptive jamming and methods, including the FDA-based jamming method, ISRG, and the proposed method in this paper, are introduced in Section 2. Section 3 provides a detailed analysis of the imaging effects of the proposed method. The simulation experiments are provided in Section 4. Section 5 discusses the proposed method. Section 6 provides the conclusion.

2. Model and Methods

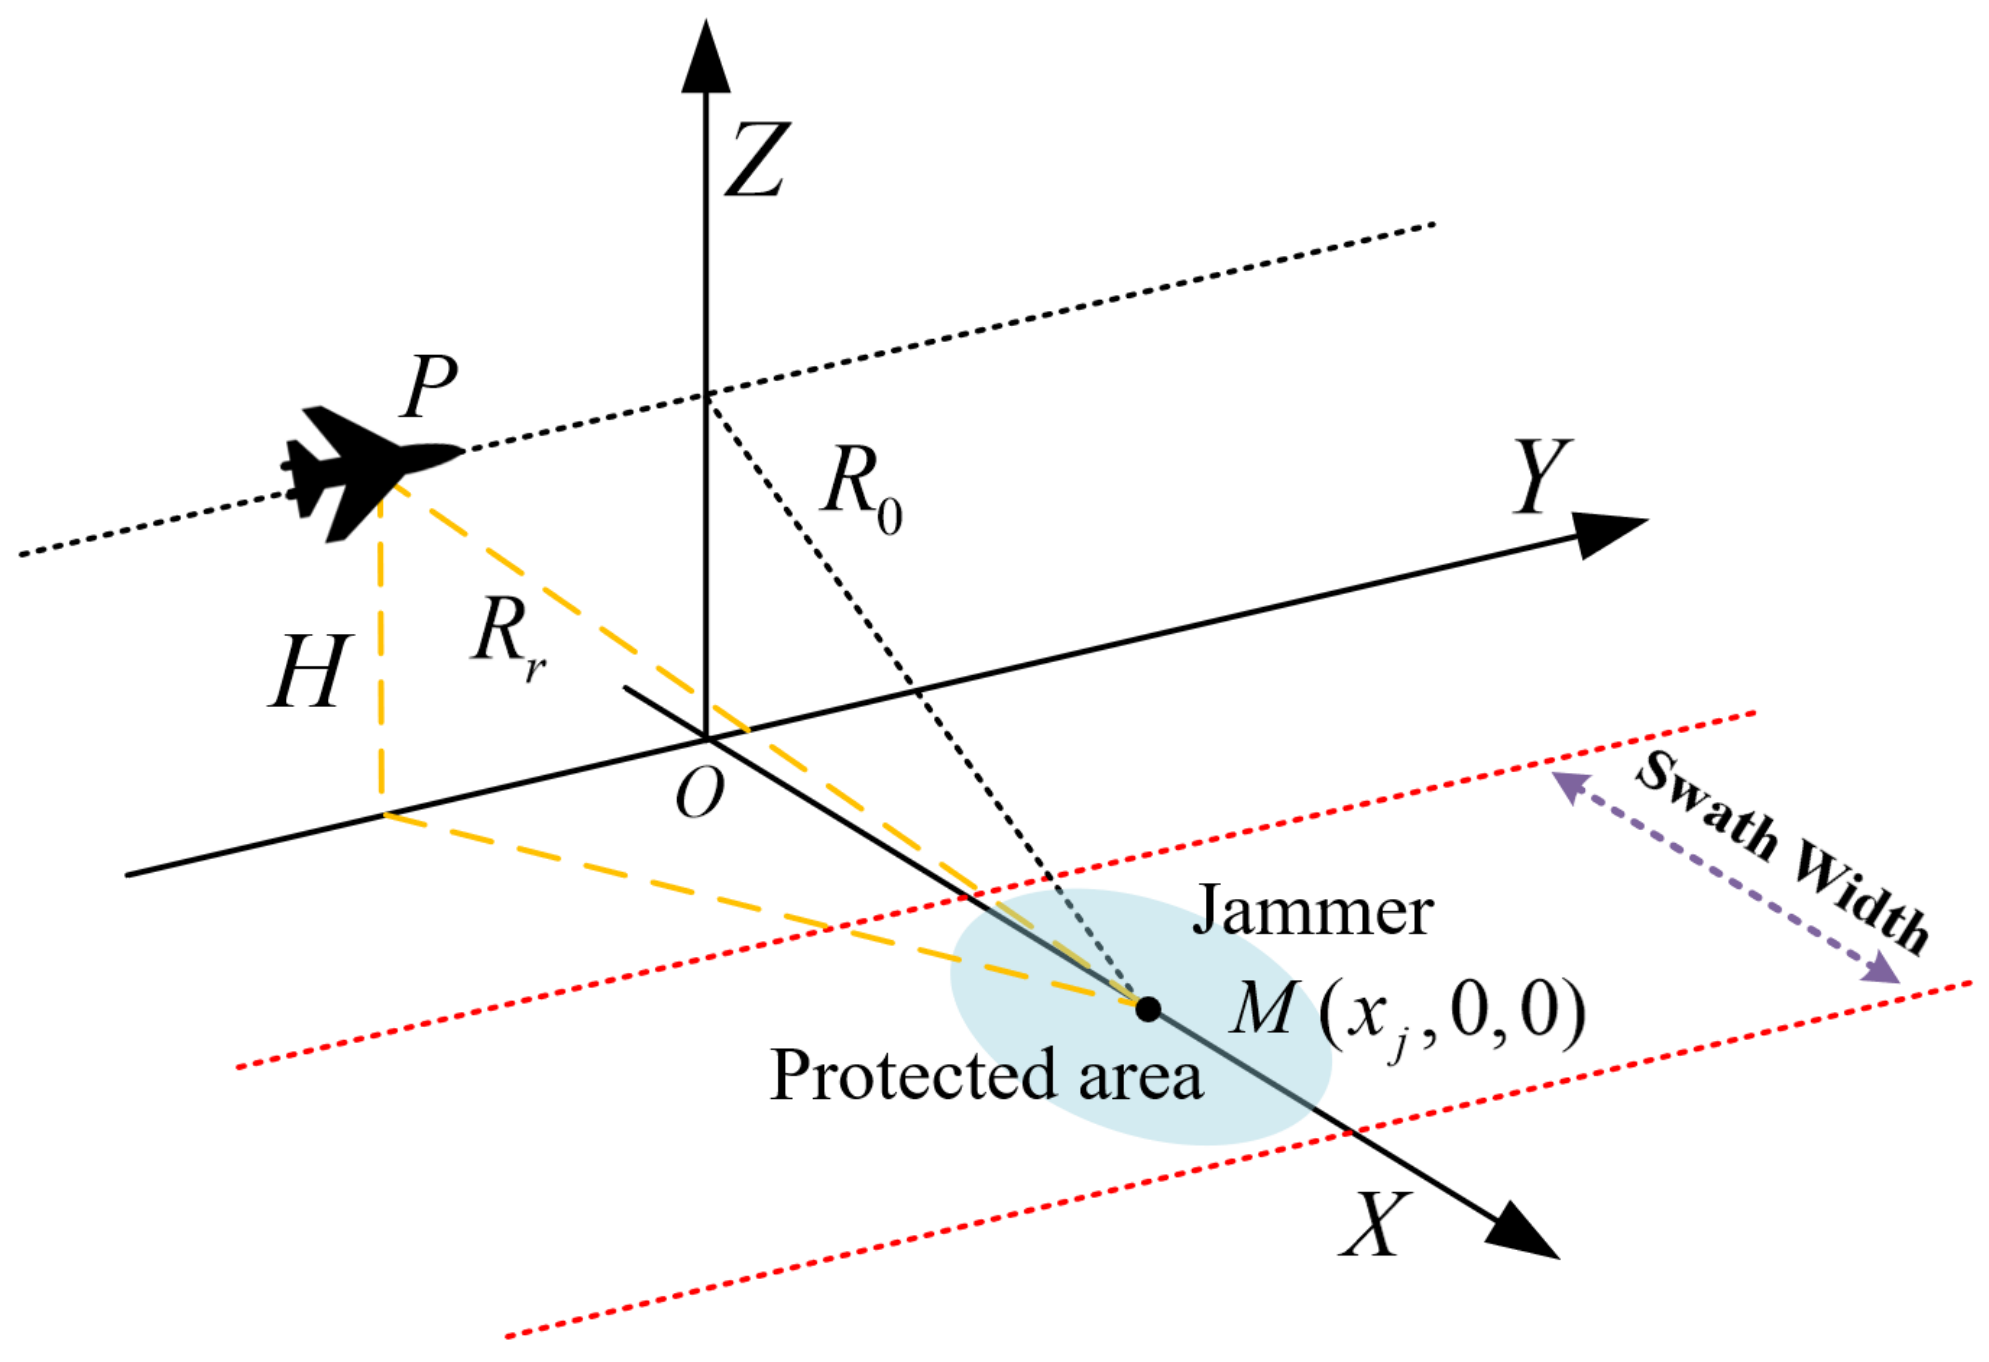
2.1. SAR Jamming Model

Taking Stripmap SAR as an example, when a repeater-type jammer is against a SAR system, the geometric relationship between the SAR, the jammer, the swath, and internal protected targets is shown in Figure 1. Without a loss of generality, point O represents the origin of the coordinates, and H represents the SAR flight height. Assume that the SAR platform is flying at a constant speed, v , along the   Y -direction. P represents SAR platforms. R 0 represents the slant range of the closest approach between the protected scene center and the SAR platform. The jammer is placed at point M x j , 0 ,   0 . The red dashed line represents the swath width. R r represents the instantaneous slant range between the protected scene center and the SAR platform, i.e.,
R r η = x j 2 + v η 2 + H 2 ,
where η stands for azimuth time.
The working mechanism of repeater-type deceptive jamming is based on “intercept–modulate–retransmit“, as shown in Figure 2. The jammer performs a series of operations on the intercepted SAR signal, including amplification, down converter, and analog-to-digital (A/D) converter, to obtain a digital baseband signal. The jammer performs intra-pulse and inter-pulse coding on the digital baseband signals to generate jamming signals. By applying different encoding forms, different jamming effects will be produced in the SAR image. Finally, after digital-to-analog (D/A) converter, upconverter, and gaining control, the jamming signal is retransmitted to the SAR device. The false targets can be generated in the SAR image after the jamming signal is 2D-filtered by SAR.

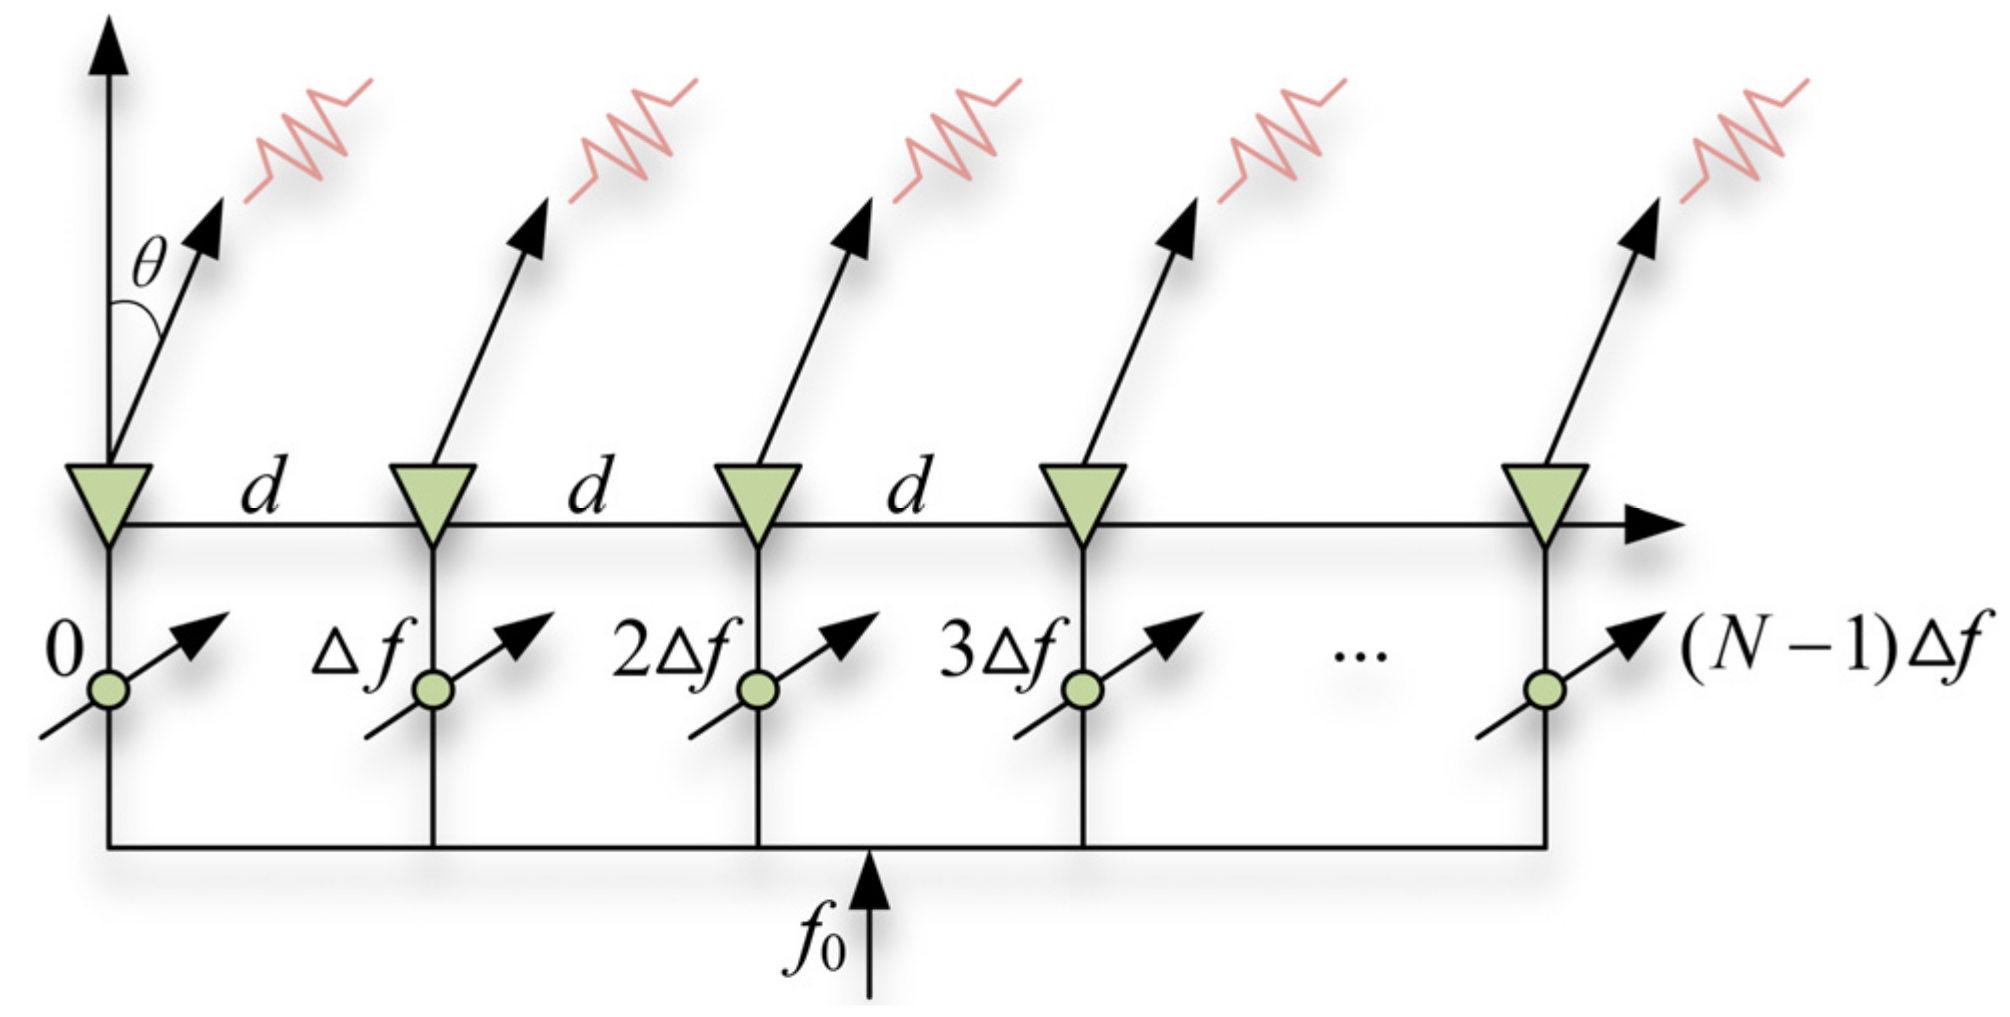
2.2. FDA-Based Deceptive Jamming Method
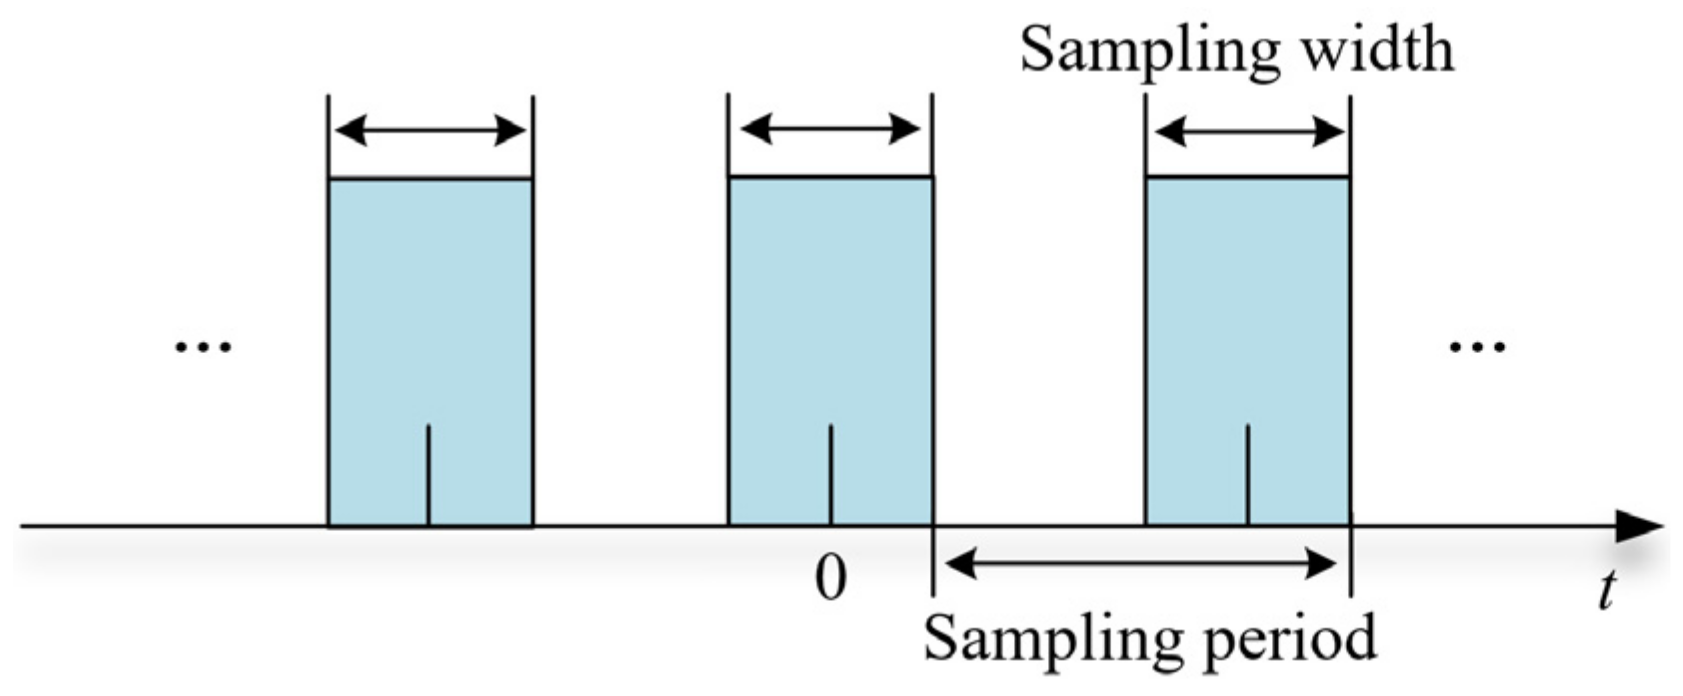
FDA-based SAR deceptive jamming is implemented by retransmitting the intercepted SAR signal through the FDA. The carrier frequencies of the array elements in an FDA radar are slightly distinguished, which can produce a range-angle-dependent beampattern. Therefore, the jamming signal transmitted through the FDA produces false targets in the range direction of the SAR image [38]. Figure 3 shows the signal model of an FDA, where d is the spacing among the array elements. θ is the azimuth angle of the jammer to the boresight of the FDA. N stands for the number of FDA arrays. Δ f represents the carrier frequency increment among the FDA antennas. f 0 represents the carrier frequency of the intercepted SAR signal.
The roundtrip of the SAR signals transmitting through the n -th arrays of the FDA to the SAR receiver can be expressed as
R J n = R r + x j 2 + v η + n 1 d 2 + H 2 ,
where R r represents the instantaneous slant range between the FDA receiving antenna and the SAR. The jamming signal received by the SAR platform can be expressed as
S FDA t r , η = n = 1 N 1 A 0 w r t R J n / c w a η η c exp j 2 π f 0 + n 1 Δ f R J n · exp j 2 π n Δ f exp j π K r t R J n / c 2
where A 0 represents the amplitude modulation coefficient of the jammer. w r is the SAR pulse complex envelope. w a represents the azimuth envelope. η c represents the Doppler center frequency. c is the speed of electromagnetic waves in free space. The η stands for azimuth time, and K r is the chirp rate of the intercepted SAR signal.
SAR deceptive jamming based on FDA, as shown in Figure 3, is equivalent to the superposition of multiple echoes of different carrier frequency components. It is because of carrier frequency difference that false targets appear in the range direction of the SAR image [38].

2.3. ISRG Method

The ISRJ samples a small part of the signal with high fidelity and then retransmits, with sampling and retransmitting working alternately. As shown in Figure 4, the sampling signals in the azimuth and range directions are assumed to be rectangular envelope pulse trains.
The range direction interrupting the sampling pulse signal,   Q 1 t , can be expressed as
Q 1 t = rect t T w 1 n r = + δ t n r T s 1 ,  
where represents the convolution operation. The rect represents the rectangular window function. δ is the impulse function. T w 1 represents the sampling width, and T s 1 represents the sampling period in the range direction. The T w 1 / T s 1 is defined as the range sampling duty cycle.
The azimuth interrupting the sampling pulse signal Q 2 t can be expressed as
Q 2 t = rect t T w 2 n a = + δ t n a T s 2 ,  
where T w 2 represents the pulse width, usually T w 1   <   T w 2 , and T s 2 represents the azimuth sampling period. T w 2 / T s 2 is defined as the azimuth sampling duty cycle. After 2D ISRJ, the jamming signal received by SAR can be expressed as
S ISRG t r , η = w r t r 2 R r / c w a η η c exp j π K r t r 2 R r / c 2 · exp j 4 π f 0 R r / c Q 1 t r Q 2 η .
For S ISRG t r , η , after pulse compression (PC), a 2D deceptive jamming effect can be generated. Meanwhile, as in (6), the jamming effect of ISGR is affected by various factors, such as sampling duty cycle, sampling period, sampling width [39], etc.

2.4. The Proposed Method

Waveform coding technology can change the time-domain SAR waveform at different times with a high degree of freedom [43]. Based on waveform coding technology, this paper proposes a repeater-type SAR deceptive jamming method through the joint coding of amplitude and phase in intra-pulse and inter-pulse, i.e., CAPII, which can achieve a 2D controllable deceptive jamming effect. The core of the CAPII method is to carry out the special encoding of the intercepted SAR signals between the intra-pulse and inter-pulse, which mainly includes the following two aspects. One is to carry out the special grouping of the intercepted SAR signals between the intra-pulse and inter-pulse. The second is to encode different groups. The encoding objects within the pulse are different sampling points, and the encoding objects between pulses are different pulses. In addition, the encodings within and among the pulses are independent of each other and have no sequence.
Figure 5 is a schematic diagram of the principle (taking 3 groups as an example). The solid lines in Figure 5 represent the transmitted pulses by the jammer, where different colors represent different encoding forms. Solid lines of the same color represent that these pulses are encoded in the same form, i.e., the same group in inter-pulse. The markers on the solid line represent different encodings of sample points within the pulse. Similarly, the same marker represents the sample points having the same encoding value, i.e., the same group in intra-pulse. The arrangement of different groups within the inter-pulse and intra-pulse is shown in Figure 5, in which they are alternately arranged.
The jammer is deployed in the protected area, which intercepts the radiated SAR signal, and performs high-speed full-pulse sampling through the D/A converter. Moreover, the sampling rate follows the Nyquist sampling theorem. The intercepted baseband SAR signal can be expressed as
S t = n 1 = + rect t n 1 T r R r t c exp j 2 π f c R r t c · exp j π K r t n 1 T r R r t c 2 ,
where f c is the carrier frequency of the intercepted SAR signal, and T r is the pulse duration time.
Then, intra-pulse and inter-pulse coding are performed on the intercepted baseband SAR signal. Encoding is the core of the CAPII method, and different jamming effects can be obtained by changing encoding forms. For intra-pulse encoding, the encoding object is sampling points, and all pulses are encoded in the same form within the pulse. Firstly, a special grouping of sample points is required. Assuming that the impulse function is adopted for grouping, it can be expressed as
δ t = 1 ,         t = 0 0 ,         t 0 .
Then, amplitude and phase joint encoding are performed separately for each group. It is noteworthy that encoding values are the same within the same group, but different among the different groups, i.e.,
P t = m r = 0 M r 1 l r = δ t l r M r m r R r t c exp j φ m r γ m r ,
where M r represents the number of intra-pulse groups, m r represents the index of different groups in intra-pulse, and l r represents the index of the sample point position. φ m r ϵ π ,   π and γ m r represent the phase and amplitude encoding values of the m r -th group, respectively. The phase encoding values are different for all groups, and the amplitude encoding can be the same or different. By performing grouping and coding for each intercepted pulse, the intra-pulse coding is realized, which produces a deceptive jamming effect in the fast time-domain.
For inter-pulse coding, the coding principle is similar to that of intra-pulse coding, but the object of inter-pulse encoding is the pulse. First, different pulses need to be grouped according to the intercepted SAR signal. Then, amplitude and phase encoding are performed on each group. Regarding inter-pulse grouping and coding principles, the same regulations and limitations apply as in intra-pulse amplitude and phase joint coding. Specifically, the inter-pulse phase and amplitude joint coding principle can be expressed as
Q t = m a = 0 M a 1 l a = rect t l a M a m a T r T r exp j φ m a γ m a ,
where M a represents the number of groupings in the inter-pulse, m a represents the index of different groups within inter-pulse, and l a represents the index of the different pulses.
The jamming signal, after the joint coding of amplitude and phase in the intra-pulse and inter-pulse, can be expressed as
S Jamming = S t P t Q t .
According to (11), the jamming signal is equivalent to modulating the intercepted SAR signal with two jamming terms. Therefore, the major computational complexity of the proposed method is W a · W r , where W a and W r represent the number of pulses in the intercepted SAR signal and the number of sampling points of a single pulse, respectively. Then, the jamming signal is retransmitted through the jammer. After the jamming signal, S Jamming , is sent to the SAR platform, it is sampled in 2D. Here, the working delay of the jammer is ignored. Decomposing the received jamming signal into 2D, i.e., slow time-domain, η , and fast time-domain, t r , it can be expressed as
S U t r , η = rect t r 2 τ T r rect η T s exp j 4 π f c τ · exp j π K r t r 2 τ 2 P t r τ Q η ,
where T s represents synthetic aperture time. The τ is the time delay in the fast time-domain, which can be expressed as
τ = R r η c .
R r η is the instantaneous slant range from the jammer to the SAR platform. After expanding using the Taylor formula, R r η can be expressed as
R r η = x j 2 + v η 2 + H 2 R 0 + v 2 R 0 η 2 .
The P t r and Q η in (12) represent the jamming modulation terms performed by the jammer on the intercepted SAR signal, i.e., the joint coding of the intra-pulse and inter-pulse amplitude and phase. From (9) and (10), the main parameters that affect the jamming modulation terms include the number of groups, phase encoding values, and amplitude encoding values. By controlling these parameters, a variety of deceptive jamming effects can be generated in SAR images.

3. Signal Imaging Process and Analysis

To analyze the performance of the proposed method in this paper, ignoring the coupling between the azimuth and the range directions [41], the echo of the jamming signal can be divided into the range component, S R t r , and the azimuth component, S A η , i.e.,
S R t r = rect t r 2 τ T r exp j π K r t r 2 τ 2 m r = 0 M r 1 l r = + δ t r l r M r m r 2 τ exp j φ m r γ m r S A η = rect η T s exp j π K a η 2 m a = 0 M a 1 l a = + δ η l a M a m a exp j φ m a γ m a ,
where K a represents the azimuth chirp rate, i.e.,
K a = 2 v 2 λ R 0 ,
where λ = c / f c stands for the carrier wavelength.
At present, there are many algorithms for processing the SAR signal, such as the RD algorithm, the chirp scaling algorithm, and the Omega-k algorithm, which were proposed based on different application scenarios. In this paper, the RD algorithm is chosen as the jamming imaging algorithm since the RD algorithm decomposes the echo into the range and the azimuth echo, which is convenient for analysis. Meanwhile, the RD algorithm implements 2D PC in the frequency domain and reaches a high level of integration. Generally, the RD algorithm requires two steps, i.e., range compression and azimuth compression. This section will discuss them separately.

3.1. Range Compression

From the above, the echo components in the range direction are divided into M r groups. In this subsection, for simplicity, each group is analyzed separately, and the values of other groups are set to 0 . As shown in Figure 6, the sum of M r groups, i.e., the range echo components, can be expressed as
S R t r = S R 1 t r + S R 2 t r + S R 3 t r + + S R M r 1 t r ,
where the m r -th group S R m r can be expressed as
S R m r t r = rect t r 2 τ T r exp j π K r t r 2 τ 2 · l r = + δ t r l r M r m r 2 τ exp j φ m r γ m r .
when processing digital signals, the spectrum of the signal is obtained by discrete Fourier transform (FT). For convenience, the digital frequency is represented by the analog frequency, so the spectrum of S R m r t r can be expressed as
S R m r f r = rect f r B r ρ m r exp j π f r 2 K r exp j 4 π f r τ + ρ m r G = 0 1 k = 1 M r 1 rect f r 1 2 β r   G , k 1 4 1 G f sr B r 1 G + 1 β r   G , k + B r / 2 + f sr / 2 + exp j 2 π k m r / M r exp j π f r β r   G , k 2 K r exp j 4 π f r τ ,
where B r is the bandwidth. f sr represents range sampling frequency, and the value of G is 0 or 1 ; this is because the frequency spectrum range that can be observed is f sr / 2 ,     f sr / 2   . When G takes other values, the spectrum component does not fall within f sr / 2 ,     f sr / 2   after shifting to the right or to the left of k f sr / M a , as shown in Figure 7.
ρ m r f r   represents the amplitude and phase encoding terms, i.e.,
ρ m r = exp j φ m r γ m r .
β r G , k is a function introduced for shorthand and can be represented as
β r   G , k = k f sr / M r G f sr .
Thus, the frequency-domain expression of the range echo component, S R t r , can be expressed as
S R f r = S R 1 f r + S R 2 f r + S R 3 f r + + S R M r f r .
To obtain the PC results in the range direction, we use the range frequency domain matched filter, which can be expressed as
H r f r = rect f r B r exp j π f r 2 K r .
According to (22) and (23), the fast time-domain PC result can be deduced as
S out _ R t r = m r = 0 M r 1 ρ m r B r sin c B r t r 2 τ + m r = 0 M r 1 ρ m r G = 0 1 k = 1 M r 1 exp j 2 π m r k M r exp j π β r   G , k 2 K r · 1 G + 1 β r   G , k + B r + f sr 2 · sin c 1 G + 1 β r   G , k + B r + f sr 2 t r + β r   G , k K r 2 τ · exp j 2 π 1 2 β r   G , k + 1 4 1 G f sr B r t r + β r   G , k K r 2 τ .
From (24), after intra-pulse coding, the PC result of the jamming signal in the range direction consists of multiple sin c functions with different amplitude coefficients. This forms the basis for deceptive jamming in the range direction. By adjusting the number, M r , of ρ m r f r , diversified deceptive jamming effects can be generated in the SAR image.

3.2. Azimuth Compression

The azimuth PC is similar to the range direction, which can be regarded as a linear frequency-modulated (LFM) signal with a chirp rate of K a . Similar to Figure 7, the azimuth echo can be split into M a groups.
As is expressed in (19), the azimuth echo component can also be expressed as
S A η = S A 1 η + S A 2 η + S A 3 η + + S A M a 1 η ,
where the m a -th group can be expressed as
S A m a η = rect η T s exp j π K a η 2 m a = + δ η l a M a m a exp j φ m a γ m a .
Through the analysis of (26), the azimuth echo component is constituted by three items, i.e., the quadratic phase term, exp j π K a η 2 ; the impulse function term, δ η l a M a m a ; and the encoding item, exp j φ m a γ m a . Then, the frequency-matched filter is used for PC, which can be expressed as
H a f a = rect f a B a exp j π f a 2 K a ,
where B a represents the Doppler bandwidth. Similar to range direction, the PC result in the azimuth echo, S A η , can be deduced as
S out _ A η = m a = 0 M a 1 ρ m a B a sin c B a η + m a = 0 M a 1 ρ m a L = 0 1 J = 0 M a 1 exp j 2 π m a J M a exp j π β a   L , J 2 K a · 1 L + 1 β a   L , J + B a + f sa 2 · sin c 1 L + 1 β a   L , J + B a + f sa 2 η + β a   L , J K a · exp j 2 π 1 2 β a   L , J + 1 4 1 L f sa B a η + β a   L , J K a ,
where f sa represents the azimuth sampling rate. ρ m a η stands for the phase encoding terms of the m a -th group, i.e.,
ρ m a = exp j φ m a γ m a .
The β a   L , J is also a function introduced for shorthand, which can be represented as
β a   L , J = J f sa / M a L f sa ,
where f sa is the azimuth sampling rate. The value of L is 0 or 1. Similar to the one shown in Figure 6, it is because the azimuth of the frequencies that can be observed is f sa / 2 , f sa / 2   .
From (28), the PC results in the azimuth direction are similar to those in the range direction, which are also composed of multiple sin c functions with different amplitude coefficients. This forms the basis for azimuth deceptive jamming.

3.3. False Target Feature Analysis

3.3.1. The Number of False Targets

Through the analysis of (24) and (28), the following relationship exists between the number of false targets and groups, i.e.,
N r = 2 M r 1 , azimuth   N a = 2 M a 1 , range ,
where N r and N a represent the number of false targets in the range and azimuth, respectively. The total number of false targets can be represented as
N = 2 M r 1 2 M a 1 1 .
From (31) and (32), the number of false targets can be precisely controlled in the range and azimuth directions by the number of groups.

3.3.2. The Position of False Targets

Through the analysis of (24), if G = 0 , the value of β r   G , k is greater than 0. At this time, if the value of β r   G , k is brought into Equation (24). The sin c function will shift left. Relatively, if the value of β r   l , k is less than 0, the sin c function will shift to the right, i.e., the false target moves to the right of the real target. In other words, the value of G determines the position of the false target in the SAR image. G = 0 means the false target is shifted to the left of the real target. G = 1 means the false target is shifted to the right of the real target. In addition, the value of k determines the distance between the false target and the real target, i.e., the offset. If G = 0 , the offset increases with the increase in k . If G = 1 , the offset reduces with the increase in k . In summary, as shown in Figure 8, in the range, the position of false targets can be represented by the values of G and k . From Figure 8, the false targets are evenly distributed on both sides of the real target. Then, the false target at the G , k position can be deduced as
POSR l , k t r = t r 2 τ G α s k α s / M r T r ,  
where α s represents the oversampling rate. To facilitate the verification, the time position represented by (33) is converted into a space position in the SAR image, which can be expressed as
Ω R G , k = X + G α s k α s / M r T r c / 2 ,
where X represents the range direction position of the jammer in the SAR image.
Analogously, by analyzing (28), L = 0 means that the false target is behind the real target, and L   = 1 means that the false target is in front of the real target. The value of J determines the offset between the false target and the real target in azimuth. If L = 0 , the offset increases with the increase in J . If L = 1 , the offset reduces with the increase in J . In summary, in the azimuth, the different false targets can be represented by the values of L and J . Then, in the azimuth, the false target at the L ,   J position, POSA L ,   J η , can also be deduced as
POSA L , J η = η L α s J α s M a T s .
The time position represented by (35) is converted into a space position in the SAR image, which can be expressed as
Ω A L , J = Y + L α s J α s M r T s v ,
where Y represents the azimuth direction position of the jammer in the SAR image.
Figure 8 shows the derivation results of false targets’ positions in the SAR image. Subsequently, according to the values of G ,   k ,   L , and J , the position of the false target in the SAR image can be determined by Formulas (34) and (36). This provides greater flexibility for the implementation of deceptive jamming.

3.3.3. The Amplitude of the False Target

The amplitude of the false target is an important factor in implementing deceptive jamming. According to (24), the main factor affecting the amplitude of false targets is ρ m r . After analyzing (24) and (28), the amplitude of the false target at the G , k , L , J position in logarithmic form can be calculated as
A G , k , L , J = A R G , k · α L , J ,
where α L , J denotes the ratio of the amplitude of the false targets at the L , J position to the amplitude of the false target with the same azimuth position as the jammer. A R G , k represents the amplitude of the false targets at a range position of G , k and can be expressed as
A R G , k = 20 log 10 m r = 0 M r 1 ρ m r B r sin c B r t r 2 τ ,   Same   range   position   as   the   jammer Ψ G , k , others ,
where Ψ G , k can be represented as
Ψ G , k = 20 log 10 1 G + 1 β r   G , k + B r + f sr 2 · sin c 1 G + 1 β r   G , k + B r + f sr 2 t r + β r   G , k K r 2 τ · m r = 0 M r 1 γ m r exp j φ m r exp j 2 π m r k / M r } .
α L , J is classified into two cases; if the false target and the jammer are located in the same azimuth, then its value is 1. Otherwise, the value of α L , J can be expressed as
α L , J = 20 log 10 m a = 0 M a 1 γ m a exp j φ m a exp j 2 π m a J / M a m a = 0 M a 1 γ m a exp j φ m a + 20 log 10 1 L + 1 β a   L , J + B a + f sa / 2 B a .
From (37), the amplitude of the false target at position G , k , l , J can be calculated. In addition, the main factors that affect the amplitude of false targets are γ m a exp j φ m a . The presence of phase encoding creates false targets. The amplitude encoding value affects the amplitude of false targets. Thus, if the phase encoding value is determined, the false targets of different amplitudes will be generated by adjusting the amplitude encoding value.
Based on the above analysis, the number of false targets in the range and azimuth can be controlled by the number of groups. By controlling the amplitude encoding value, the amplitude of the false target can be adjusted. Meanwhile, the positions of the false target in the SAR image were also derived, which provides greater controllability and flexibility for deceptive jamming implementation.

4. Simulation and Results

In this section, point and area target simulations are performed to prove the effectiveness of the theoretical analysis. Meanwhile, to demonstrate the superiority of the proposed method, the FDA-based jamming method [38] and the ISRJ method [43] are selected as comparative experiments. Table 1 shows the main parameters of the simulation.

4.1. Point Target Simulation

The size of the simulation scene is set up as 16 × 10 km in size. The jammer is placed in the center of the scene, i.e., point 5 ,   8   km . The range and azimuth resolutions can be calculated as 2.4983 m and 7.5 m from Table 1.
From the analysis in Section 3.3.1, the number of false targets is controlled by the number of groups. Now, we set the phase encoding value as exp j ϑ π ,   ϑ = 1 m 1 / 6 , where m = 1 ,   2 ,   , M a = M r represents the phase encoding value in the m -th group in the range or azimuth. Taking M a = M r = 2   as an example, the phase encoding values of different groups in the azimuth and range directions are exp j π , exp j 5 / 6 π , and exp j 2 / 3 π . Figure 9 shows the imaging results for different numbers of groups without amplitude encoding.
If the number of intra-pulse groups is two and three; the number of false targets in the range direction can be calculated according to Formula (31), i.e., two and four, which can be seen in Figure 9a,b. This is consistent with the analysis results. Figure 9c shows the simulation results for only inter-pulse encoding, in which the number of false targets also satisfies Formula (31). Figure 9d–f shows the imaging results with intra-pulse and inter-pulse 2D phase encoding. The number of false targets in Figure 9d–f is 8, 14, and 44, respectively, which agrees with Equation (32). Therefore, the accurate control of the number of false targets can be achieved by the number of groups within the intra-pulse and inter-pulse. In addition, the distribution of false targets is consistent with the results derived in Figure 8.
Figure 10a shows the simulation results with only phase encoding ( M r = M a = 3 ). The real target is inside the red circle, i.e., the position of the jammer. To evaluate the false target spatial position and amplitude, four points within the yellow rectangle in Figure 10a were selected for validation. Taking point P 3 as an example, the spatial position of the false target can be calculated with Equations (34) and (36). According to the distribution of false targets in Figure 8, the value of G and L are both equal to 0 at this time for the false target, P 3 . In addition, the values of k and j can both be derived as 1 . Subsequently, the above values are, respectively, input into (34) and (36), which can obtain the theoretical derivation position of the false target. The theoretical derivation and the simulated value of the different false target space locations are shown in Table 2. It can be concluded that the simulated values are basically consistent with the theoretical values.
For ease of analysis, the maximum amplitude value (i.e., peak value) of the false target is selected as the evaluation index to verify the correctness of the amplitude analysis. Since the simulation results of Figure 10a do not perform amplitude encoding, the value of amplitude encoding can be regarded as 1. For point P 1 , its range position is the same as the jammer, and the phase encoding values of intra-pulse and inter-pulse are exp j π , exp j 5 / 6 π , and exp j 2 / 3 π . Therefore, the value of A R G , k is calculated with (38). For point P 2 , its azimuth position is the same as the jammer. Thus, the value of α L , J is 1. The amplitude peak value of different false targets in Figure 10a is also shown in Table 2. It can be seen from Table 2 that the theoretical value and the actual value are basically consistent. Therefore, the analysis of false target amplitude is validated.
The characteristics of the false target, including the number, space position, and amplitude ratio, are analyzed. However, the energy of false targets is always lower. Figure 10b,c show the simulation results for amplitude encoding. Figure 10b is a simulation result of amplitude encoding only in the second group, i.e., the encoding amplitude values are 1, 1.1, and 1 in the range and azimuth directions. Obviously, the amplitude ratio of some false targets is changed. Figure 10c is the simulation result of amplitude encoding for all groups, and the encoding amplitude values are 2.1, 5, and 1.22 in the range and azimuth. At this time, the amplitude ratio of almost all false targets changes. Therefore, the amplitude of the false target is affected by the amplitude encoding value.
To further study the effects of different amplitude encoding, we take point P 3 in Figure 10a as an example, i.e., G = L = 0 and k = J = 1 , and set the amplitude encoding value of the second group within the intra-pulse and inter-pulse to ε 1 , 9 . The amplitude code values for other groups are set to 1. Figure 11 shows the amplitude corresponding to different amplitude encoding values. The blue line represents the theoretical value calculated according to (37), and the red triangle represents the simulated value. Obviously, the simulated value basically agrees with the theoretical value. Therefore, the amplitude of the specific false target can be adjusted by the amplitude coding value. Meanwhile, the amplitude of every false target can also be calculated.
For comparison, the FDA-based jamming and ISRJ are selected. Figure 12a,c show the point target simulation results of the FDA-based jamming [38], where the number of FDA elements is five. Obviously, the FDA-based jamming generates false targets only in the range direction. The point target of the simulation results of ISRJ is shown in Figure 12b,d [43]. From the results, although ISRJ can produce 2D false targets, the energy of the false target gradually decreases with the increase in the distance from the real target. In addition, the false targets generated by the ISRJ method are jointly determined by multiple parameters and are difficult to control. Figure 13a,f show the simulation results of the CAPII method in this paper, where the number of groups is M r = M a = 3 , and the amplitude and phase encoding values are random. Obviously, the CAPII method can not only produce 2D false targets but the amplitude distribution of false targets is also random when amplitude encoding values are random. In particular, Figure 13b,e show the simulation results, where only the second group’s range direction value is set to 0, and the other groups are set to 1. Compared to Figure 12a, two columns of false targets corresponding to k = 2 are hidden. Figure 13c,f show the simulation results, where the second group’s range and azimuth direction value is set to 0, and the other groups are set to 1. Obviously, the two columns of false targets corresponding to k = 2 and the two rows of false targets corresponding to J = 2 are hidden. That is to say that the false targets of the specific group will disappear if the amplitude encoding value of the corresponding group is set to 0. This reduces the regularity of false target distribution to some extent.
In summary, CAPII generates a 2D false target, and the amplitude of the false target can be adjusted by the amplitude encoding value. Particularly, if the amplitude encoding value of a certain group is set to 0, then its corresponding false targets will be hidden. Meanwhile, the number of false targets can be precisely controlled, which provides greater controllability for deceptive jamming implementations. Therefore, compared with the FDA-based method and ISRJ method, the CAPII method has great advantages.

4.2. Area Target Simulation

To further analyze the proposed method, Figure 14 shows the simulation results of the area target. Figure 14c–f are the simulation results of the CAPII method, where all phase encoding is random. Figure 14c is the simulation result of only inter-pulse encoding with M a = 3 , in which the false targets are generated in the azimuth. Meanwhile, the number of false targets satisfies Equation (31). Figure 14d is the simulation result of amplitude encoding where the amplitude encoding value is 0 in the second group. Obviously, the corresponding false target is hidden. Figure 14c shows the simulation results of the joint intra-pulse and inter-pulse coding ( M a = M r = 3 ), which generates a 2D deceptive jamming effect. Simultaneously, the corresponding false targets are hidden. Compared with Figure 14d, the number of false targets in Figure 14f increases significantly. In addition, the false targets of the third group of intra- and inter-pulses are hidden. This reduces the regularity of the distribution of false targets to a certain extent.
Figure 14a shows the area target simulation results of the FDA-based jamming method. The false targets are only generated in the range. Figure 14b shows the area target simulation of the ISRJ method. Although ISRJ can produce 2D false targets, the energy of false energy gradually decreases. Meanwhile, the number of false targets is difficult to control. However, the proposed method, i.e., CAPII, can generate a flexible and controllable 2D deceptive jamming effect. Specifically, the number of false targets can be precisely controlled by the number of groups. The amplitude of the false targets can be modulated by the amplitude encoding value. If the amplitude and phase encoding values are random, the energy of the false targets is randomly distributed. In particular, if the amplitude encoding value of a particular group is 0, its corresponding false targets will be hidden. Therefore, the CAPII method has stronger controllability. The area target simulation experiments fully verify the superiority of the proposed method.

5. Discussion

From the experimental results, it can be seen that the proposed deception jamming method has more flexible and controllable advantages over other methods. However, there are still some problems with the proposed method. For example, the positions of false targets are relatively fixed and are always evenly distributed on both sides of the real targets. In addition, the imaging quality of the false target at the far end is poor. From target identification, uniformly distributed false targets increase the risk of being identified. Therefore, these are problems that we need to further study.

6. Conclusions

With the continuous upgrading of ECM, various jamming technologies for SAR have become a research hotspot. Due to low power consumption and higher concealment, deceptive jamming has attracted more and more attention in the field of ECM. However, the existing deceptive jamming implementation methods are relatively singular. Based on waveform coding theory, this article proposed a repeater-type SAR deceptive jamming method through the joint coding of amplitude and phase in intra-pulse and inter-pulse, which can generate a 2D controllable deceptive jamming effect. The core of the proposed CAPII method is to encode the intercepted SAR signals, and various jamming effects can be achieved by controlling different coding parameters. For intra-pulse coding, the CAPII method first samples the intercepted SAR signal and groups the samples. Second, the joint coding of amplitude and phase is performed for each group respectively. The number of groups determines the number of false targets. The amplitude encoding value affects the energy of false targets. In addition, false target characteristics, including number, position, and amplitude, are analyzed. The simulation results verify the correctness of the theoretical analysis. In addition, FDA-based deceptive jamming and ISRJ were used as comparative methods, which fully demonstrates the superiority of the CAPII method. Therefore, the CAPII method can realize the protection of sensitive targets or areas.
Furthermore, in this paper, we only provided deceptive jamming implementations in stationary target and Stripmap mode. However, the CAPII method is also appropriate for moving targets and other working modes, such as Spotlight SAR, ScanSAR, Tops-SAR, etc.
Our future works are as follows:
  • Realizing the control of the positions of the false targets.
  • Applying the CAPII method to moving targets.
  • Applying the CAPII method to a variety of modes.

Author Contributions

Conceptualization, D.C. and G.S.; Data curation, Z.G.; Formal analysis, G.S. and D.C.; Funding acquisition, G.S. and N.L.; Investigation, G.S., D.C. and Z.L.; Methodology, G.S., D.C. and Z.G.; Project administration, G.S. and N.L.; Resources, N.L.; Software, D.C., Z.L. and Z.G.; Supervision, N.L.; Validation, G.S. and D.C.; Visualization, D.C.; Writing–original draft, G.S. and D.C.; Writing–review and editing, D.C., G.S. and N.L. All authors have read and agreed to the published version of the manuscript.

Funding

This work was supported in part by the National Natural Science Foundation of China under Grants 61871175, in part by Natural Science Foundation of Henan under grant number 222300420115, and in part by the Foundation of Key Laboratory of Radar Imaging and Microwave Photonics, Ministry of Education, under Grant RIMP2020003.

Acknowledgments

The authors would like to thank the anonymous reviewers for their valuable and detailed comments that were crucial to improving the quality of this paper.

Conflicts of Interest

The authors declare no conflict of interest.

References

  1. Reigber, A.; Scheiber, R.; Jager, M.; Prats-Iraola, P.; Hajnsek, I.; Jagdhuber, T.; Papathanassiou, K.P.; Nannini, M.; Aguilera, E.; Baumgartner, S. Very-High-Resolution Airborne Synthetic Aperture Radar Imaging: Signal Processing and Applications. Proc. IEEE 2013, 101, 759–783. [Google Scholar] [CrossRef]
  2. Moreira, A.; Prats-Iraola, P.; Younis, M.; Krieger, G.; Hajnsek, I.; Papathanassiou, K.P. A tutorial on Synthetic Aperture Radar. IEEE Trans. Geosci. Remote Sens. Mag. 2013, 1, 6–43. [Google Scholar] [CrossRef]
  3. Deng, Y.; Yu, W.; Zhang, H.; Wang, W.; Liu, D.; Wang, R. Forthcoming Spaceborne SAR Development. J. Radars 2020, 9, 1–33. [Google Scholar]
  4. Tao, M.; Su, J.; Huang, Y.; Wang, L. Mitigation of Radio Frequency Interference in Synthetic Aperture Radar Data: Current Status and Future Trends. Remote Sens. 2019, 11, 2438. [Google Scholar] [CrossRef]
  5. Huber, S.; Almeida, F.; Villano, M.; Younis, M.; Krieger, G.; Moreira, A. Tandem-L: A Technical Perspective on Future Spaceborne SAR Sensors for Earth Observation. IEEE Trans. Geosci. Remote Sens. 2018, 56, 4792–4807. [Google Scholar] [CrossRef]
  6. Stofan, E.; Evans, D.; Schmullius, C.; Holt, B.; Plaut, J.; Zyl, J.; Wall, S.; Way, J. Overview of results of Spaceborne Imaging Radar-C, X-Band Synthetic Aperture Radar (SIR-C/X-SAR). IEEE Trans. Geosci. Remote Sens. 1995, 33, 817–828. [Google Scholar] [CrossRef]
  7. Li, Z.; Wang, H.; Su, T.; Bao, Z. Generation of wide-swath and high-resolution SAR images from multichannel small spaceborne SAR systems. IEEE Geosci. Remote Sens. Lett. 2005, 2, 82–86. [Google Scholar] [CrossRef]
  8. Ji, P.; Xing, S.; Dai, D.; Pang, B. Deceptive Targets Generation Simulation Against Multichannel SAR. Electronics 2020, 9, 597. [Google Scholar] [CrossRef]
  9. Ji, P.; Dai, D.; Xing, S.; Pang, B. A New Three-Dimension Deceptive Scene Generation against Single-Pass Multibaseline InSAR Based on Multiple Transponders. Sensors 2020, 20, 1053. [Google Scholar] [CrossRef]
  10. Huang, Y.; Zhao, B.; Tao, M.; Chen, Z.; Hong, H. A Review of Synthetic Aperture Radar Anti-Jamming Technique. J. Radars 2020, 9, 89–106. [Google Scholar]
  11. Zhou, F.; Sun, G.; Bai, X.; Bao, Z. A Novel Method for Adaptive SAR Barrage Jamming Suppression. IEEE Geosci. Remote Sens. Lett. 2011, 9, 292–296. [Google Scholar] [CrossRef]
  12. Wang, H.; Jiang, J.; Pu, J.; Wu, Y.; Ran, D. Low Sidelobe Multi-Phase Segmented Modulation Jamming Method Based on Cosine Amplitude Weighting. J. Syst. Eng. Electron. 2021, 43, 3185–3193. [Google Scholar]
  13. Li, Y.; Huang, D.; Xing, S.; Wang, X. A Review of Synthetic Aperture Radar Jamming Technique. J. Radars 2020, 9, 753–764. [Google Scholar]
  14. Huang, L.; Dong, C.; Shen, Z.; Zhao, G. The Influence of Rebound Jamming on SAR GMTI. IEEE Geosci. Remote Sens. Lett. 2015, 12, 399–403. [Google Scholar] [CrossRef]
  15. Chang, X.; Li, Y.; Zhao, Y. An Improved Scattered Wave Deceptive Jamming Method Based on a Moving Jammer Beam Footprint Against a Three-Channel Short-Time SAR GMTI. IEEE Sens. Lett. 2020, 21, 4488–4499. [Google Scholar] [CrossRef]
  16. Zhao, B.; Huang, L.; Li, J.; Liu, M.; Wang, J. Deceptive SAR Jamming Based on 1-bit Sampling and Time-Varying Thresholds. IEEE J. Sel. Top. Appl. Earth Obs. Remote Sens. 2018, 11, 939–950. [Google Scholar] [CrossRef]
  17. Wu, Z.; Xu, H.; Li, J.; Liu, W. Research of 3-D Deceptive Interfering Method for Single-Pass Spaceborne InSAR. IEEE Trans. Aerosp. Electron. Syst. 2015, 51, 2834–2846. [Google Scholar] [CrossRef]
  18. Deng, Y.; Zheng, Y.; Hu, Y. Analysis of Synthetic Aperture Radar Repeater Jamming. J. Electron. Inf. Technol. 2010, 32, 69–74. [Google Scholar] [CrossRef]
  19. Zhang, N.; Kuang, L.; Shen, F.; Wan, Q.; Yang, W. A Jamming Technique against Airborne SAR. In Proceedings of the 2006 CIE International Conference on Radar (RADAR), Guangzhou, China, 16–19 October 2006; pp. 1–3. [Google Scholar]
  20. Qu, W.; Jia, X.; Wu, Y. Modeling and Simulation Analyses of SAR Signal Reconnaissance. J. Stat. Comput. Simul. 2007, 10, 2341–2345. [Google Scholar]
  21. Lin, X.; Liu, P.; Xue, G. Fast Generation of SAR Deceptive Jamming Signal Based on Inverse Range Doppler Algorithm. In Proceedings of the IET International Radar Conference, Xi’an, China, 14–16 April 2013; pp. 1–4. [Google Scholar]
  22. Sun, Q.; Shu, T.; Zhou, S.; Tang, B.; Yu, W. A Novel Jamming Signal Generation Method for Deceptive SAR Jammer. In Proceedings of the IEEE Radar Conference, Cincinnati, OH, USA, 19–23 May 2014; pp. 1174–1178. [Google Scholar]
  23. Sun, Q.; Shu, T.; Yu, K.; Yu, W. Efficient Deceptive Jamming Method of Static and Moving Targets Against SAR. IEEE Sens. J. 2018, 18, 3601–3618. [Google Scholar] [CrossRef]
  24. Liu, Y.; Wang, W.; Pan, X.; Dai, D.; Feng, D. A Frequency-Domain Three-stage Algorithm for Active Deceptive Jamming Against Synthetic Aperture Radar. IET Radar Sonar Navig. 2014, 8, 639–646. [Google Scholar] [CrossRef]
  25. Liu, Y.; Wang, W.; Pan, X.; Fu, Q.; Wang, G. Inverse omega-K algorithm for the electromagnetic deceptive of synthetic aperture radar. IEEE J. Sel. Top. Appl. Earth Obs. Remote Sens. 2016, 9, 3037–3049. [Google Scholar] [CrossRef]
  26. Yang, K.; Ye, W.; Wu, X.; Ma, F.; Li, F. Fast Generation of Deceptive Jamming Signal Against Space-Borne SAR. IEEE J. Sel. Top. Appl. Earth Obs. Remote Sens. 2020, 13, 5580–5596. [Google Scholar] [CrossRef]
  27. Yang, K.; Ye, W.; Ma, F.; Li, G.; Tong, Q. A Large-Scene Deceptive Jamming Method for Space-Borne SAR Based on Time-Delay and Frequency-Shift with Template Segmentation. Remote Sens. 2020, 12, 53. [Google Scholar] [CrossRef]
  28. Wang, S.; Yu, L.; Ni, J.; Zhang, G. A Study on the Active Deceptive Jamming to SAR. Acta Electron. Sin. 2003, 12, 1900–1902. [Google Scholar]
  29. Zhou, F.; Zhao, B.; Tao, M.; Bai, X.; Chen, B.; Sun, G. A Large Scene Deceptive Jamming Method for Space-Borne SAR. IEEE Trans. Geosci. Remote Sens. 2013, 51, 4486–4495. [Google Scholar] [CrossRef]
  30. Zhang, B.; Zhou, F.; Shi, X.; Wu, Q.; Zheng, B. Multiple Targets Deceptive Jamming Against ISAR Using Electromagnetic Properties. IEEE Sens. J. 2015, 15, 2031–2038. [Google Scholar]
  31. Tai, N.; Wang, Y.; Han, H.; Xu, X.; Wang, C.; Zeng, Y.; Wang, L. Deceptive Jamming Against ISAR Based on Convolution and Sub-Nyquist Sampling. IEEE Sens. J. 2020, 20, 1807–1820. [Google Scholar] [CrossRef]
  32. Zhu, Y.; Wang, H.; Zhang, S.; Zheng, Z.; Wang, W. Deceptive Jamming on Space-Borne Sar Using Frequency Diverse Array. In Proceedings of the IGARSS 2018-2018 IEEE International Geoscience and Remote Sensing Symposium, Valencia, Spain, 22–27 July 2018; pp. 605–608. [Google Scholar]
  33. Bang, H.; Wang, W.; Zhang, S.; Liao, Y. FDA-Based Space–Time–Frequency Deceptive Jamming Against SAR Imaging. IEEE Trans. Aerosp. Electron. Syst. 2022, 58, 2127–2140. [Google Scholar] [CrossRef]
  34. Huang, B.; Wang, W.; Zhang, S.; Wang, H.; Gui, R.; Lu, Z. A Novel Approach for Spaceborne SAR Scattered-Wave Deceptive Jamming Using Frequency Diverse Array. IEEE Geosci. Remote Sens. Lett. 2020, 17, 1568–1572. [Google Scholar] [CrossRef]
  35. Huang, L.; Zong, Z.; Zhang, S.; Wang, W. 2-D Moving Target Deceptive Against Multichannel SAR-GMTI Using Frequency Diverse Array. IEEE Geosci. Remote Sens. Lett. 2022, 19, 1–5. [Google Scholar]
  36. Wang, X.; Liu, J.; Zhang, W.; Fu, Q.; Liu, Z.; Xie, X. Mathematical Principle of Intermittent Sampling Repeater Jamming. Sci. Sin. (Technol.) 2006, 8, 891–901. [Google Scholar]
  37. Wu, X.; Bo, Z.; Dai, D.; Wang, X. Azimuth intermittent Sampling Repeater to SAR. J. Signal Process. 2010, 26, 1–6. [Google Scholar]
  38. Li, C.; Su, W.; Gu, H.; Ma, C.; Chen, J. Improved Interrupted Sampling Repeater Jamming based on DRFM. In Proceedings of the 2014 IEEE International Conference on Signal Processing, Communications and Computing (ICSPCC), Guilin, China, 5–8 August 2014; pp. 254–257. [Google Scholar]
  39. Feng, D.; Xu, L.; Pan, X.; Wang, X. Jamming Wideband Radar Using Interrupted-Sampling Repeater. IEEE Trans. Aerosp. Electron. Syst. 2017, 53, 1341–1354. [Google Scholar] [CrossRef]
  40. Sun, J.; Wang, C.; Shi, Q.; Ren, W.; Yao, Z.; Yuan, N. Interrupted Sampling Repeater Signal Based on Phase Modulation. In Proceedings of the International Conference on Microwave and Millimeter Wave Technology (ICMMT), Nanjing, China, 23–26 May 2021; pp. 1–3. [Google Scholar]
  41. Hang, D.; Xing, S.; Li, Y.; Liu, Y.; Xiao, S. Smart Jamming Method Against SAR Based on Multiplication Modulation. Syst. Eng. Electron. 2021, 43, 3160–3168. [Google Scholar]
  42. Sun, G.; Xing, S.; Huang, D.; Li, Y.; Wang, X. Jamming method of intermittent sampling against SAR-GMTI Based on Noise Multiplication Modulation. Syst. Eng. Electron. 2022, 43, 1–14. [Google Scholar]
  43. Jin, G.; Deng, Y.; Wang, W.; Zhang, H.; Long, Y.; Zhang, Y.; Wang, R. On the SAR Imaging Performance Analysis of Alternate Transmitting Mode Based on Waveform Diversity: Theory and Simulation. IEEE Geosci. Remote Sens. Lett. 2020, 17, 1553–1557. [Google Scholar] [CrossRef]
Figure 1. Geometry model of repeater-type jamming.
Remotesensing 14 04597 g001
Figure 2. Working flow chart of a jammer.
Remotesensing 14 04597 g002
Figure 3. Schematic diagram of the FDA transmitter.
Remotesensing 14 04597 g003
Figure 4. Schematic diagram of ISRJ.
Remotesensing 14 04597 g004
Figure 5. Schematic diagram of the proposed method (taking 3 groups as an example).
Remotesensing 14 04597 g005
Figure 6. Range direction echo component split diagram (taking 3 groups as an example).
Remotesensing 14 04597 g006
Figure 7. Schematic diagram of range echo component spectrum.
Remotesensing 14 04597 g007
Figure 8. Derivation schematic diagram of false target position distribution (taking M a = M r = 3 as an example).
Remotesensing 14 04597 g008
Figure 9. Simulation results of point targets with different grouping numbers (without amplitude encoding), where the real target is inside the red circle. Results with only intra-pulse encoding (a) M r = 2 , (b) M r = 3 , and (c) results with only inter-pulse encoding ( M r = 3 ). Results with intra-pulse and inter-pulse encoding (d) M r = M a = 2 , (e) M r = 3 , M a = 2 , and (f) M r = 5 , M a = 3 .
Remotesensing 14 04597 g009
Figure 10. Simulation results of point targets with M r = M a = 3 (The real target is inside the red circle). (a) The results with intra-pulse and inter-pulse encoding without amplitude encoding. (b) The result with amplitude coding values of 1, 0.1, and 1. (c) The result with amplitude coding values of 0.1, 5, and 0.22. (df) The 3D imaging results of (a), (b), and (c), respectively.
Remotesensing 14 04597 g010
Figure 11. The amplitude corresponds to different amplitude encoding values for point P 3 .
Remotesensing 14 04597 g011
Figure 12. Simulation results of point targets with (a) the FDA-based jamming and (b) the ISRJ. (c) and (d) are the 3D imaging results of (a) and (b), respectively.
Remotesensing 14 04597 g012
Figure 13. Point target simulation results of CAPII (the real target is inside the red circle). (a) Results with intra-pulse and inter-pulse encoding without amplitude encoding. (b) The result with amplitude coding values 1, 0, and 1 in the intra-pulse (the amplitude encoding values of inter-pulse are all 1). (c) Result with amplitude coding values 1, 0, and 1 in the intra-pulse and inter-pulse. (df) The 3D imaging results of (ac).
Remotesensing 14 04597 g013
Figure 14. Area target simulation results (the real target is inside the red circle). (a) The results of the FDA-based jamming method. (b) The results of the ISRJ method. (c) The results of CAPII with M a = 3 (encoding value randomly). (d) The results of CAPII with M a = 3 (the amplitude encoding value of the second set is 0). (e) The results of CAPII with M a = M r = 3 (the second set of amplitude encoding values within inter-pulse is set to 0). (f) The results of CAPII with M a = M r = 4 (the third set of amplitude encoding values within the inter-pulse is set to 0).
Remotesensing 14 04597 g014
Table 1. The main parameters of the simulation.
ParameterValue
Carrier frequency5.4 GHz
Pulse width25 us
Bandwidth60 MHz
Pulse repetition frequency1410 Hz
Platform velocity7568.94 m/s
Closest slant range815.9 km
Antenna length15 m
Oversampling   ration   ( α s )1.2
Table 2. Peak value and position of false targets.
Range Position (km)Azimuth Position (km)Amplitude Peak Value (dB)
PointTheoreticalSimulatedTheoreticalSimulatedTheoreticalSimulated
P 1 556.79216.7243−17.19−18.56
P 2 6.4996.67288−14.34−13.22
P 3 3.5013.42809.20799.1023−36.17−38.34
Publisher’s Note: MDPI stays neutral with regard to jurisdictional claims in published maps and institutional affiliations.

