Article

Climate Sensitivity of the Arid Scrublands on the Tibetan Plateau Mediated by Plant Nutrient Traits and Soil Nutrient Availability

1
Hebei Key Laboratory of Environmental Change and Ecological Construction, Hebei Technology Innovation Center for Remote Sensing Identification of Environmental Change, School of Geographical Sciences, Hebei Normal University, Shijiazhuang 050024, China
2
Institute of Environment and Sustainable Development in Agriculture, Chinese Academy of Agricultural Sciences, Beijing 100081, China
3
School of Geographic Sciences, Nantong University, Nantong 226007, China
4
Department of Ecosystem Modelling, Büsgen-Institute, Universität Göttingen, 37077 Göttingen, Germany
5
Department of Geography, Geography and Geology Faculty, Alexandru Ioan Cuza University of Iaşi, 700505-RO Iaşi, Romania
6
Botanical Garden Center for Biological Diversity Conservation in Powsin, Polish Academy of Sciences, 02-973 Warsaw, Poland
7
Department of Botany and Nature Conservation, University of Warmia and Mazury in Olsztyn, Plac Łódzki 1, 10-727 Olsztyn, Poland
8
Department of Botany, Senckenberg Museum of Natural History Görlitz, 02826 Görlitz, Germany
9
International Institute (IHI) Zittau, Technische Universität Dresden, 02763 Zittau, Germany
10
German Centre for Integrative Biodiversity Research (iDiv) Halle-Jena-Leipzig, 04103 Leipzig, Germany
11
Institute of Biology, Theoretical Ecology, Freie Universität Berlin, 14195 Berlin, Germany
12
Berlin-Brandenburg Institute of Advanced Biodiversity Research, 14195 Berlin, Germany
*
Author to whom correspondence should be addressed.
These authors contributed equally to this work.
Remote Sens. 2022, 14(18), 4601; https://doi.org/10.3390/rs14184601
Submission received: 25 July 2022 / Revised: 3 September 2022 / Accepted: 6 September 2022 / Published: 15 September 2022
(This article belongs to the Special Issue Remote Sensing for Climate Change)

Abstract

:

Highlights

What are the main findings?
  • Principal component regressions revealed the climate sensitivity of Tibetan arid desert scrubs.
  • Plant nutrient traits and soil nutrient availability regulate desert scrubs’ climate sensitivity.
What is the implication of the main finding?
  • Scrubs’ sensitivity to temperature is mainly regulated by the nitrogen contents of soils and leaves.
  • Scrubs’ sensitivity to precipitation is affected by the leaf carbon content of dominant species.
  • Neither soil nor plant nutritional properties alone can well explain scrubs’ sensitivity to droughts.

Abstract

Climate models predict the further intensification of global warming in the future. Drylands, as one of the most fragile ecosystems, are vulnerable to changes in temperature, precipitation, and drought extremes. However, it is still unclear how plant traits interact with soil properties to regulate drylands’ responses to seasonal and interannual climate change. The vegetation sensitivity index (VSI) of desert scrubs in the Qaidam Basin (NE Tibetan Plateau) was assessed by summarizing the relative contributions of temperature (SGST), precipitation (SGSP), and drought (temperature vegetation dryness index, STVDI) to the dynamics of the normalized difference vegetation index (NDVI) during plant growing months yearly from 2000 to 2015. Nutrient contents, including carbon, nitrogen, phosphorus, and potassium in topsoils and leaves of plants, were measured for seven types of desert scrub communities at 22 sites in the summer of 2016. Multiple linear and structural equation models were used to reveal how leaf and soil nutrient regimes affect desert scrubs’ sensitivity to climate variability. The results showed that total soil nitrogen (STN) and leaf carbon content (LC), respectively, explained 25.9% and 17.0% of the VSI variance across different scrub communities. Structural equation modeling (SEM) revealed that STN and total soil potassium (STK) mediated desert scrub’s VSI indirectly via SGST (with standardized path strength of −0.35 and +0.32, respectively) while LC indirectly via SGST and SGSP (with standardized path strength of −0.31 and −0.19, respectively). Neither soil nor leave nutrient contents alone could explain the VSI variance across different sites, except for the indirect influences of STN and STK via STVDI (−0.18 and 0.16, respectively). Overall, this study disentangled the relative importance of plant nutrient traits and soil nutrient availability in mediating the climatic sensitivity of desert scrubs in the Tibetan Plateau. Integrating soil nutrient availability with plant functional traits together is recommended to better understand the mechanisms behind dryland dynamics under global climate change.

Graphical Abstract

1. Introduction

Drylands cover approximately 41% of the Earth’s land surface [1] and support more than 38% of the global population [2], although they are sparsely vegetated and with limited productivity. Recently, drylands have been degraded due to ongoing climate change and intensifying human disturbance [3,4]. For example, increased droughts mainly caused by warming are predicted to accelerate the degradation of the Mediterranean drylands under human overexploitation [5]. More than 75% of drylands in developing countries are also likely to expand due to further global warming [6]. Consequently, poverty alleviation will become more challenging in arid undeveloped countries [7]. Therefore, a better understanding of how drylands respond to changes in climate and other potential regulators is urgently needed.
Climate change drives dryland dynamics across different spatial scales, including warming, shifting precipitation regimes, and intensifying droughts. Warming can limit plant growth and survival via increasing evapotranspiration and intensifying water deficit in soils [8,9]. Experimental studies have reported that increased precipitation can improve nutrient availability and facilitate plant growth, development, and reproduction in drylands via enhancing moisture content in topsoils and vice versa [10,11]. Meanwhile, remote-sensing-related technologies help monitor large-scale vegetation dynamics [12]. However, current studies on ecosystem responses to climate change are mainly based on average climate states but usually ignore the effects of climate variability and extremes [13].
Recently, Seddon et al. [14] have proposed a framework to assess the vegetation sensitivity index (VSI) to short-term variability in temperature, precipitation, and radiation (cloud mask) from a global perspective. Such an algorithm has been increasingly applied to reveal the relative importance of different climatic variables in driving the dynamics in vegetation coverage, productivity, and phenology within and across various ecosystems [15,16,17,18]. For example, Li et al. [15] assessed the variability of VSI with altitude gradient in alpine grasslands on the Tibetan Plateau and found that vegetation in higher altitude regions is more sensitive to climate variability than that in lower altitudes. In another study, Yuan et al. [18] found that vegetation in Central Asia was more sensitive to climate variability in spring than other three seasons. These studies have mapped the differential spatiotemporal patterns of alpine and arid vegetation in response to climate variability and greatly enhanced our understanding of the vegetation–climate relationship. However, they failed to provide mechanistic explanations for these patterns from the perspective of plant and soil nutrient properties. Many in situ manipulative experiments have reported that the vegetation response to climate change can be largely influenced by plant functional traits and soil nutrient availability. For example, in a climate simulation study of alpine grasslands, Henn et al. [19] found that alpine plants can adapt to climate change by shaping leaf traits. In a recent meta-analysis, soil nitrogen availability was found to be a determinant of terrestrial ecosystem productivity under changing climates [20]. However, the findings from local in situ experiments are always hard to be directly applied to large-scale ecosystem management. Therefore, it is necessary to combine remote sensing technologies and field observations to gain insights into the mechanisms of how vegetation adapts to changing climate via plant and soil nutritional properties.
Plants can respond specifically and actively to environmental changes rather than only passively withstand external stresses [21]. According to the community functional ecology theories [22,23,24], plant seed germination, seedling growth, and individual development and survival, along with environmental gradients, are mainly regulated by functional traits at species and community levels [25,26,27,28,29,30]. Plant individuals can modify their water requirements by reducing leaf size, stomatal conductance, and photosynthetic rates in response to droughts [3,31,32]. At the community level, plants can alter the C:N:P stoichiometry among organs above- and belowground to offset physical inhibitions caused by warming or cooling [33,34], declined moisture [35,36,37], and changed nutrient availability [38]. For example, Jiang et al. [39] found that warming could substantially enhance N and P mineralization and consequently improve nutrient provision to plants in the Arctic tundra. Recently, Delgado-Baquerizo et al. [40] and Jiao et al. [41] also found that increased aridity, mainly due to warming, could reduce the concentrations of C and N but increase that of P in drylands. Fiedler et al. [42] also found that climate change could indirectly affect the trade-offs and synergies among different ecosystem functions by affecting soil nutrients and plant traits. These studies indicated that ecosystem responses to climate change are complicated and depend on abiotic and biotic factors [43]. Network analyses that include plant functional traits and physical environments together may improve our prediction of ecosystem functional changes across space and over time [44,45,46]. However, our understanding of the interactions of plant functional traits with soil nutrients of high-elevated drylands in response to climate variability is still limited.
In this study, we aimed to improve our understanding of how plant nutrient traits interact with low soil nutrient availability to regulate the sensitivity of desert scrubs in the Qaidam Basin, northeastern Qinghai-Tibetan Plateau, in response to climate variability. Specifically, we have (i) explored the patterns and trends of climate change and desert scrub coverage in the last decade, (ii) examined the differences in climatic sensitivity and its components for different desert scrub communities, and finally, (iii) investigated the networking paths of interactions between plant nutrient traits and soil nutrient availability to the components of desert scrubs’ sensitivity to climate variability across the entire Qaidam Basin.

2. Materials and Methods
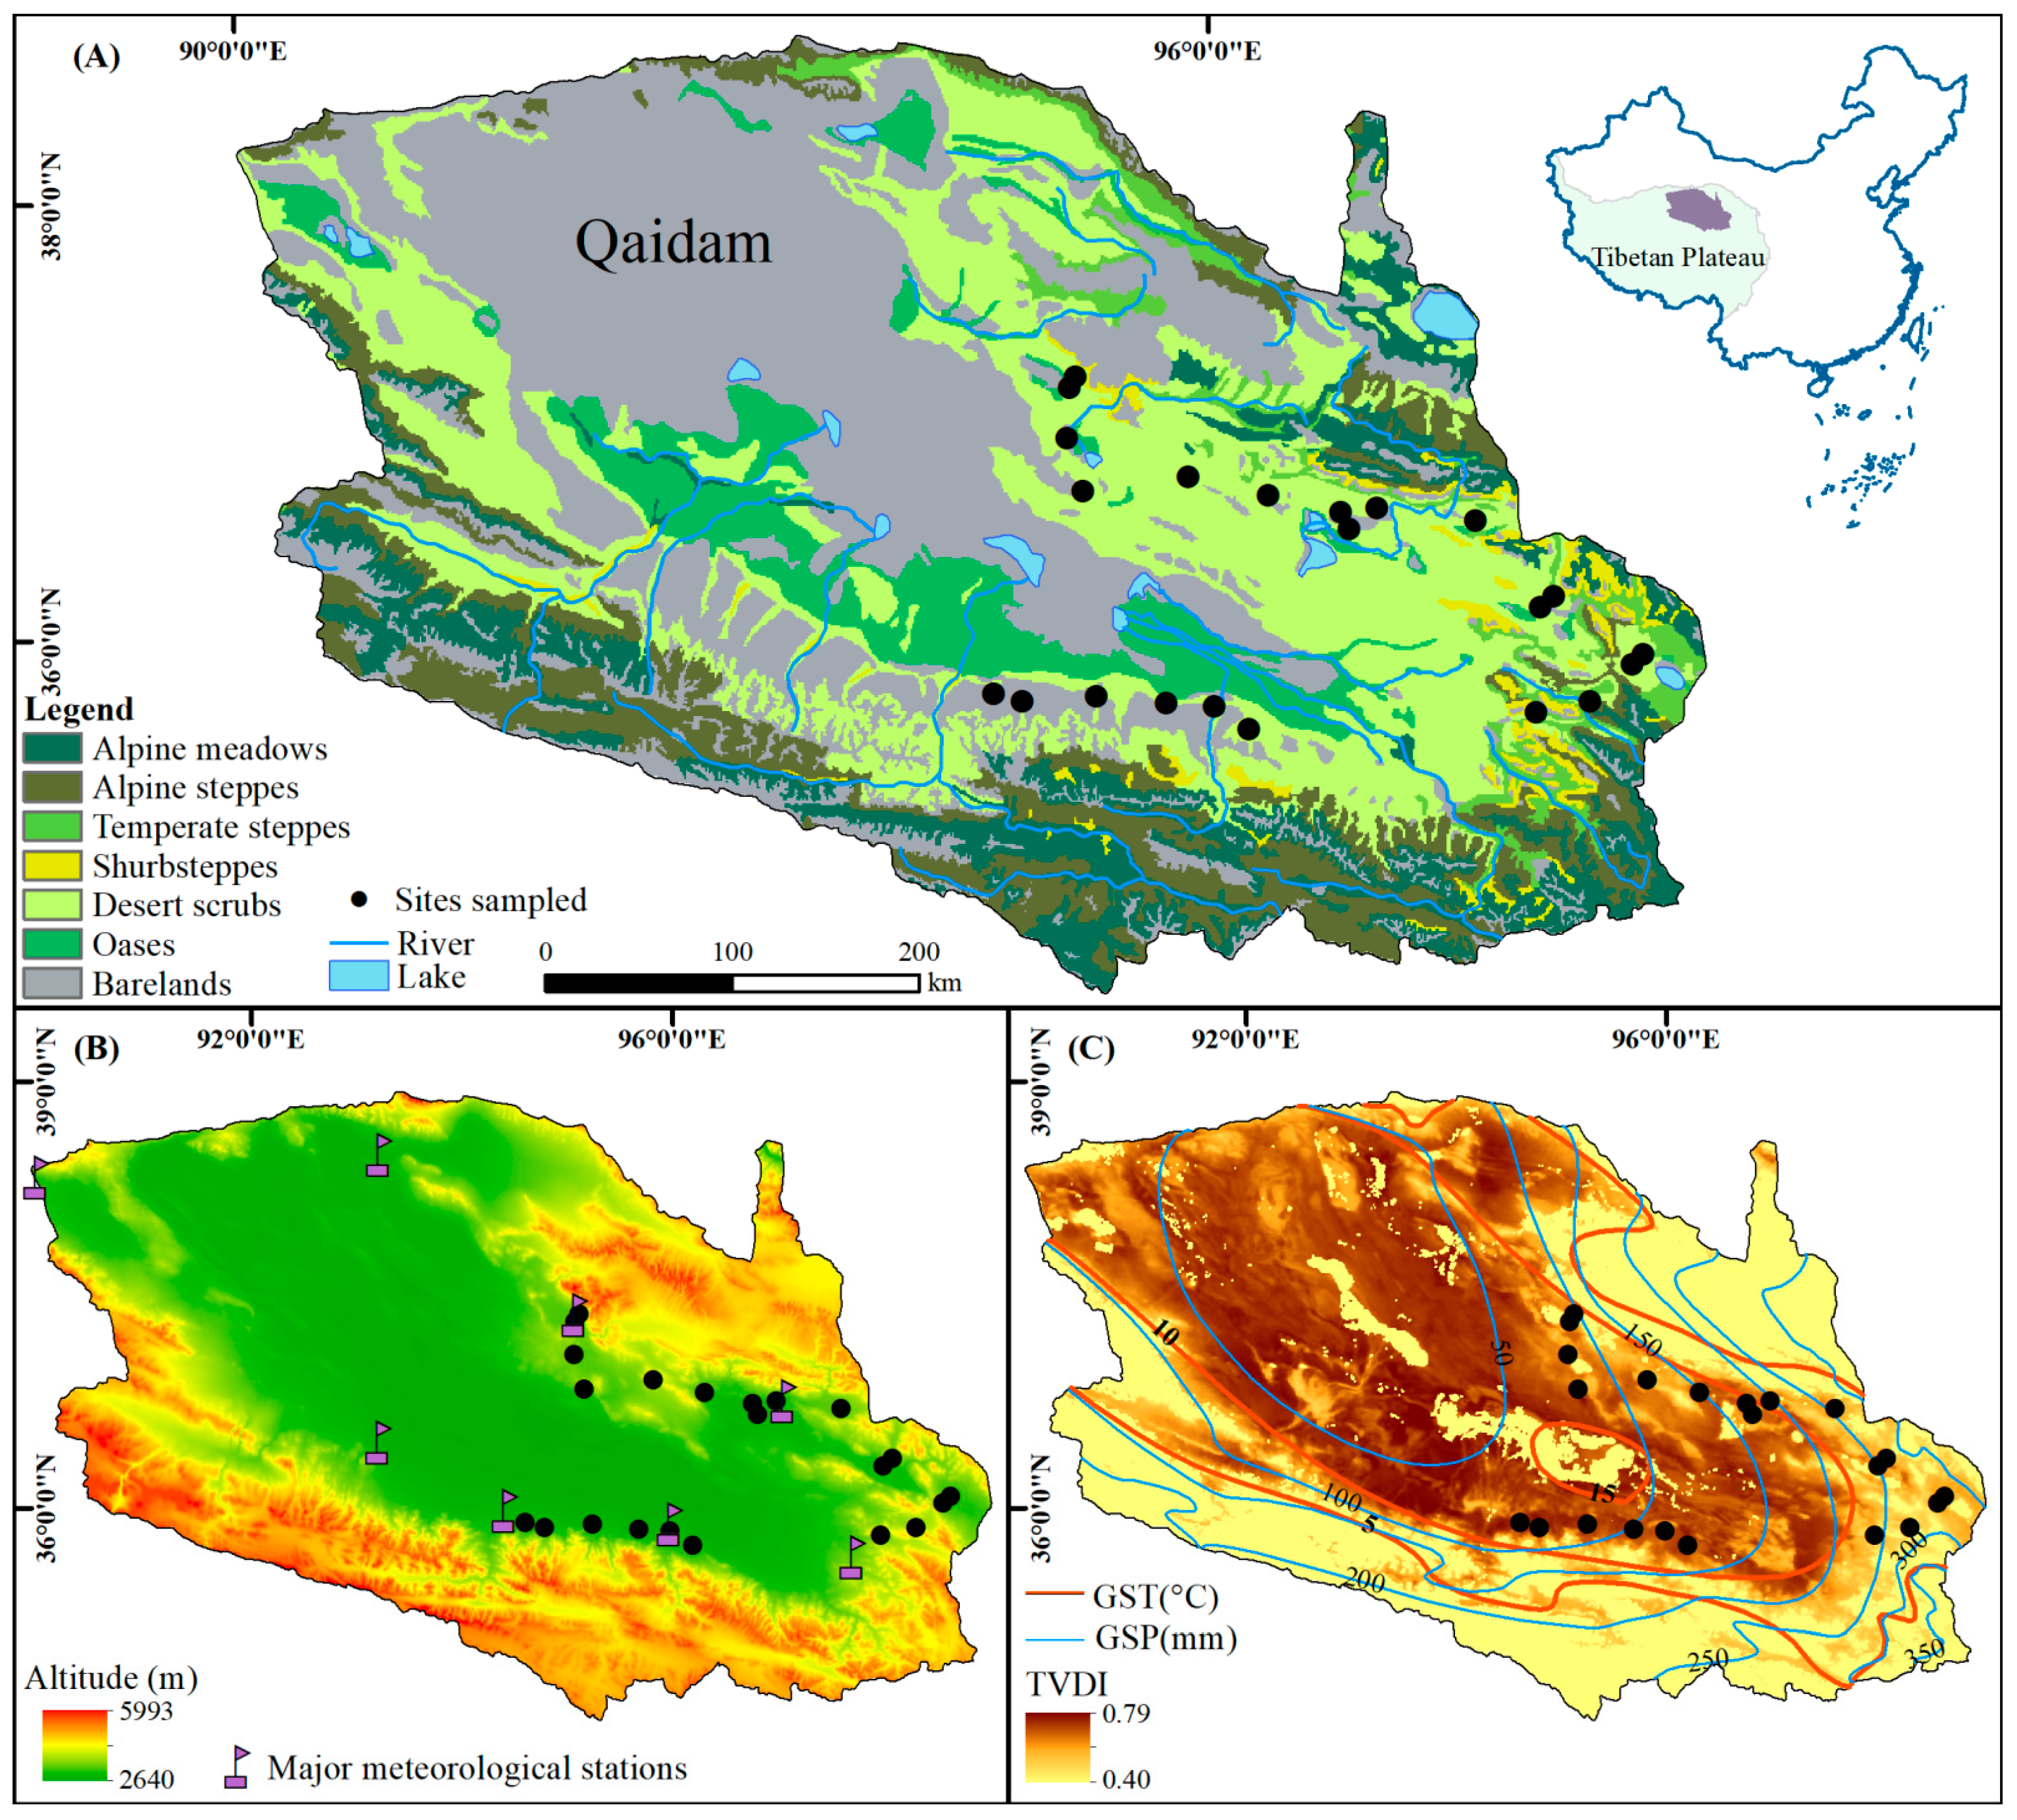
2.1. Study Area

The Qaidam Basin, with elevations ranging from 2640 m to 6000 m, is surrounded by the Kunlun, Qilian, and Altun Mountains and located in the northeastern Qinghai-Tibetan Plateau (90°16′E~99°16′E, 35°00′N~39°20′N, Figure 1). The area is characterized by an alpine arid continental climate, where the mean annual temperature (MAT) is generally below 5 °C and mean annual precipitation (MAP) is less than 200 mm [47]. The air relative humidity is between 30% and 40% throughout the year, while the average yearly sunshine duration can reach 3000 h in the Qaidam Basin. The annual average evaporation in the basin is between 1900 mm and 2600 mm [48]. Soil nutrients and moisture availability are low in desert scrublands in this area [49]. The vegetation has co-evolved with harsh physical conditions and is dominated by scrubs and semi-scrubs, such as Kalidium foliatum, Salsola abrotanoides, and Ephedra sinica [50]. Desert plants sprout in May and defoliate in early October; therefore, this period was usually defined as the plant growing season in recent studies [51].

2.2. Remote Sensing Data Collection and Processing

It is the key to choosing a suitable vegetation index for accurately examining and assessing vegetation dynamics under climate change. Recently, Zhang et al. [50] have evaluated the correlation between different vegetation indices and vegetation cover observed with UAV in the Qaidam Basin. They found that the Normalized Difference Vegetation Index (NDVI) performed much better than other indices such as ratio vegetation index (RVI), difference vegetation index (DVI), modified vegetation index (MVI), modified soil-adjusted vegetation index (MSAVI), and normalized difference greenness index (NDGI)) and normalized difference greenness index (NDGI) in assessing vegetation cover. Therefore, in this study, the NDVI of the Moderate Resolution Imaging Spectroradiometer (MODIS) MOD13Q1 Products was used as a proxy for vegetation productivity of desert scrubs. We downloaded the NDVI data with a temporal resolution of 16 days and spatial one of 250 m for the Qaidam Basin for the period from 2000 to 2015 (https://ladsweb.modaps.eosdis.nasa.gov/, accessed on 1 October 2021). As NDVI is sensitive to soil background information, therefore, we used the Savitzky–Golay filter [52] to smooth the time-series NVDI and eliminate the contaminations caused by clouds, snow, and ice cover, following Li et al. [15]. The pixels whose peak NDVI value was less than 0.05 were classified as extremely sparse vegetation or barren lands. Those pixels were manually excluded from further analyses following the recent study of Yuan et al. [18] in Central Asia. Finally, the peak monthly NDVI generated by maximum value composites [53] was used to describe the sensitivity and its components of desert scrub vegetation in the Qaidam Basin, Qinghai-Tibetan Plateau, to the variability of different climate variables.

2.3. Weather Data Collection and Processing

The monthly data of temperature and precipitation of the main meteorological stations within the Qaidam Basin (Figure 1B) yearly from May to September were downloaded and mapped for the period of 2000 to 2015. Seasonal and inter-annual fluctuations in temperature and precipitation, as well as their extreme values, were clearly shown in the supplementary Figure S1. It makes sense that the weather data from 2000–2015 are sufficient to reflect the climate fluctuations in the region. Therefore, we downloaded monthly temperature and precipitation of 200 meteorological stations located within and around the Qinghai-Tibetan Plateau from the China Meteorological Data Service Centre (http://data.cma.cn/en, accessed on 5 October 2021) for the plant growing seasons (yearly from May to October) between 2000 and 2015. First, the average temperature and sum precipitation during the plant growing seasons (termed as GST and GSP, respectively) were calculated for each station. In addition to monthly weather records, we interpolated GSP and GST into rasters with ANUSPLIN (The software is developed by Australian National University in Australia and the version is 4.3) [54] at a spatial resolution of 250 m to match the remote sensing data (see details below). A digital elevation model (DEM) with a 30 m resolution was used as the covariate, following Li et al. [55], who also confirmed that the interpolated climate rasters matched well the field observations across the northern Tibetan Plateau.
In this study, we used the temperature vegetation dryness index (TVDI) to explore the vegetation-drought relationship as recommended by Sandholt et al. [56] because it combines vegetation greenness (MODIS MOD13A2) and land surface temperature (MOD11A2). TVDI ranges from 0 to 1, with higher values indicating drier soils. We downloaded monthly TVDI data from the National Earth System Science Data Center (http://www.geodata.cn, accessed on 12 October 2021) and resampled it to match the spatial-temporal resolutions of climate and NDVI data. Finally, we used the Mann–Kendall tests [57,58] to examine the trends of GST, GSP, NDVI, and TVDI at the pixel scale between 2000 and 2015 (see more details in Figures S2–S5). The MK test outputs Z-values and slope, with positive and negative slope values representing increasing and decreasing trends. |Z| > 1.96 reaches a significant level (α = 0.05).

2.4. Climatic Sensitivity Index of Desert-Scrubs

In this study, we used NDVI as an agent of desert-scrub coverage to explore its sensitivity to changes in GST, GSP, and TVDI. First, we transformed the time-series NDVI and climate variables into z-score anomalies using each variable’s mean and standard deviation (Equation (1)).
Z = X X ¯ σ
where Z is the standard score, X is the raw data, X ¯ is the mean value of data, and σ is the standard deviation of data. Then, we used a principal component regression (PCR) to determine the relative importance of each climate variable in driving the monthly NDVI dynamic at the pixel scale. Principal components with significant relationships to climatic variables (p < 0.1) were retained for the subsequent VSI calculations.
The climate weights (Wi) were obtained by multiplying the loading scores of each variable with the corresponding PCR coefficients. Here, the weight of each climate variable was also rescaled to be between 0 and 1. Then we detrended each time-series variable and extracted its weight variance. The residuals of the mean-variance relationship between NDVI and climate variables were fitted using a linear-quadratic model, following Seddon et al. [14]. The residuals were normalized between 0 and 100. We take the log10-transformed ratios between NDVI variability and climate variables as the sensitivity metrics (Si). The NDVI logged for one month was used as the fourth variable to explore the time-lag effect of vegetation response to climate variability, following Seddon et al. [14].
VSI = i = 1 3 W i × S i
where VSI is the sum of the product of the weights of each climate variable (Wi) and its sensitivity metrics (Si). We rescaled the VSI between 0 and 100 (unitless), and the larger the value, the more sensitive to climate variability. We constructed a 500 m buffer centered on each sample point. Thus, it makes sense that the specific VSI values of the pixels in the buffer area can serve as repeats for multiple comparisons among different scrub communities. Moreover, we calculated the VSI average of the pixels in the buffer area for each site and used it in multiple linear regressions and structural equation modeling across sites within the study area.

2.5. Plant Nutrient Traits and Soil Nutrient Availability

According to the 1:1,000,000 China Vegetation Atlas, which is available at the Resource and Environmental Science Data Center, Chinese Academy of Sciences (http://www.resdc.cn/data.aspx?DATAID=122, accessed on 1 May 2016), our field observations in 2016 at 22 sites covered seven main types of desert scrubs within the Qaidam Basin (Table 1). Plant nutrient traits and soil nutrient properties were measured to examine their potential regulating effects on the desert scrubs’ sensitivity to climate variability.
We laid five 5 m × 5 m sample squares evenly along the diagonal in a relatively homogeneous area of 250 m × 250 m at each site, where the plant community was intact and undisturbed by human activities while the proportion of desert scrub plants was higher than 90% in the total vegetation cover. Healthy leaves were collected from at least five mature individuals for each scrub/semi-scrub species in each quadrat. Plant leaves were stored in a separate bag for each species during the field campaign and then dried at 70 °C for 48 h in the lab to a constant weight. Before chemical analyses, all dried leaves were grounded into fine powder through a 0.15 mm sieve and kept in brown glass bottles. Leaf total P (LTP, g kg−1) and K (LTK, g kg−1), respectively, were determined by Mo-Sb colorimetric method and flame spectrophotometer [59].
We randomly sampled three profiles of the 0–50 cm depth at each site, about a half kilogram for each sample. Soil samples were air-dried and sieved through a 100-mesh sieve to remove root fractions and gravel. Then, soils were grounded into fine powders and stored in brown glasses before chemical analyses [60]. Total soil and leaf nitrogen (STN and LTN, g kg−1) were determined by Kjeldahl method. Total soil and leaf phosphorus (STP and LTP, g kg−1) were measured with the Mo-Sb anti-spectrophotometry method, while total soil and leaf Kalium (STK and LTK, g kg−1) with the flame photometry method. Soil organic carbon (SOC, g kg−1) and leaf carbon (LC, g kg−1) were determined by the potassium dichromate oxidation–ferrous sulfate titrimetric method.

2.6. Plant Functional Trait Diversity

Our plant nutrient traits referred to the contents of N, P, K, and C in leaves (LTN, LTP, LTK, and LC) for all species sampled (Table 1). We calculated community-weighted means (CWMs) to describe the regulating effects of plant nutrient trait diversity on desert scrubs’ sensitivity to climate variability (see Equations (2) and (3)). CWMs are essential for understanding community reorganization in response to environmental filtering [61] and are widely recommended and used in plant functional ecology research [62].
C W M j = i = 1 n P i j T i j
where Pij is the relative cover of species i in sample site j; Tij is the mean of trait values of species i in sample site j; CWMj is the community-weighted mean of traits of each species in sample site j.

2.7. Statistical Analyses

First, with the Mann–Kendall test [57,58], we examined the trends of GST, GSP, TVDI, and NDVI between 2000 and 2015 at the pixel scale. Moreover, we extracted the yearly value and trends of GST, GSP, TVDI, and NDVI based on each site’s geographical coordinate records at the pixels where we performed field surveys. Thus, we compared the medians of climate and vegetation variables and their trends among the seven types of desert scrubs (see more details in Figures S2–S5).
Second, we calculated the VSI of 2000–2015 based on principal component regressions and used a red–green–blue (RGB) composition map to show the relative contribution of GST, GSP, and TVDI to the climatic sensitivity of desert scrubs at the pixel scale. We also extracted the VSI and its components to each site and examined the difference in them at the community level with the Wilcoxon test [63].
Next, we divided the data into three groups: VSI as the response variable and leaf traits (LTN, LTP, LTK, LC) and soil attributes (STN, STP, STK, SOC) as potential explanatory variables. We examined the normality of the data containing response and predictor variables and normalized these data in R using a scale function (see Equation (1)). Moreover, we examined the correlation between the responders and predictors using the corrplot package (version 0.92) [64] in R. The multivariate linear model was applied to investigate the main effects of leaf and soil nutrient attributes on the variation of VSI. In this step, we also determined the multicollinearity of each factor based on the variance inflation factor (VIF) [65]. Thus, the relative importance of each explanatory can be disentangled as the fraction of the variance VSI explained in the best-fitted model.
Finally, structural equation modeling (SEM) [66] was used to explore how vegetation traits and soil nutrients drive changes in VSI using the lavaan package (version 0.6.1) [67]. Stepwise backward selections were used to remove the least significant term until the best-fitted model was picked out. All statistical analyses were performed in R (The software is developed by R Core Team in Austria and the version is 4.1.1) [68], and maps were generated with ArcGIS (The software is developed by the Environment System Research Institute in America and the version is 10.2) [69].

3. Results

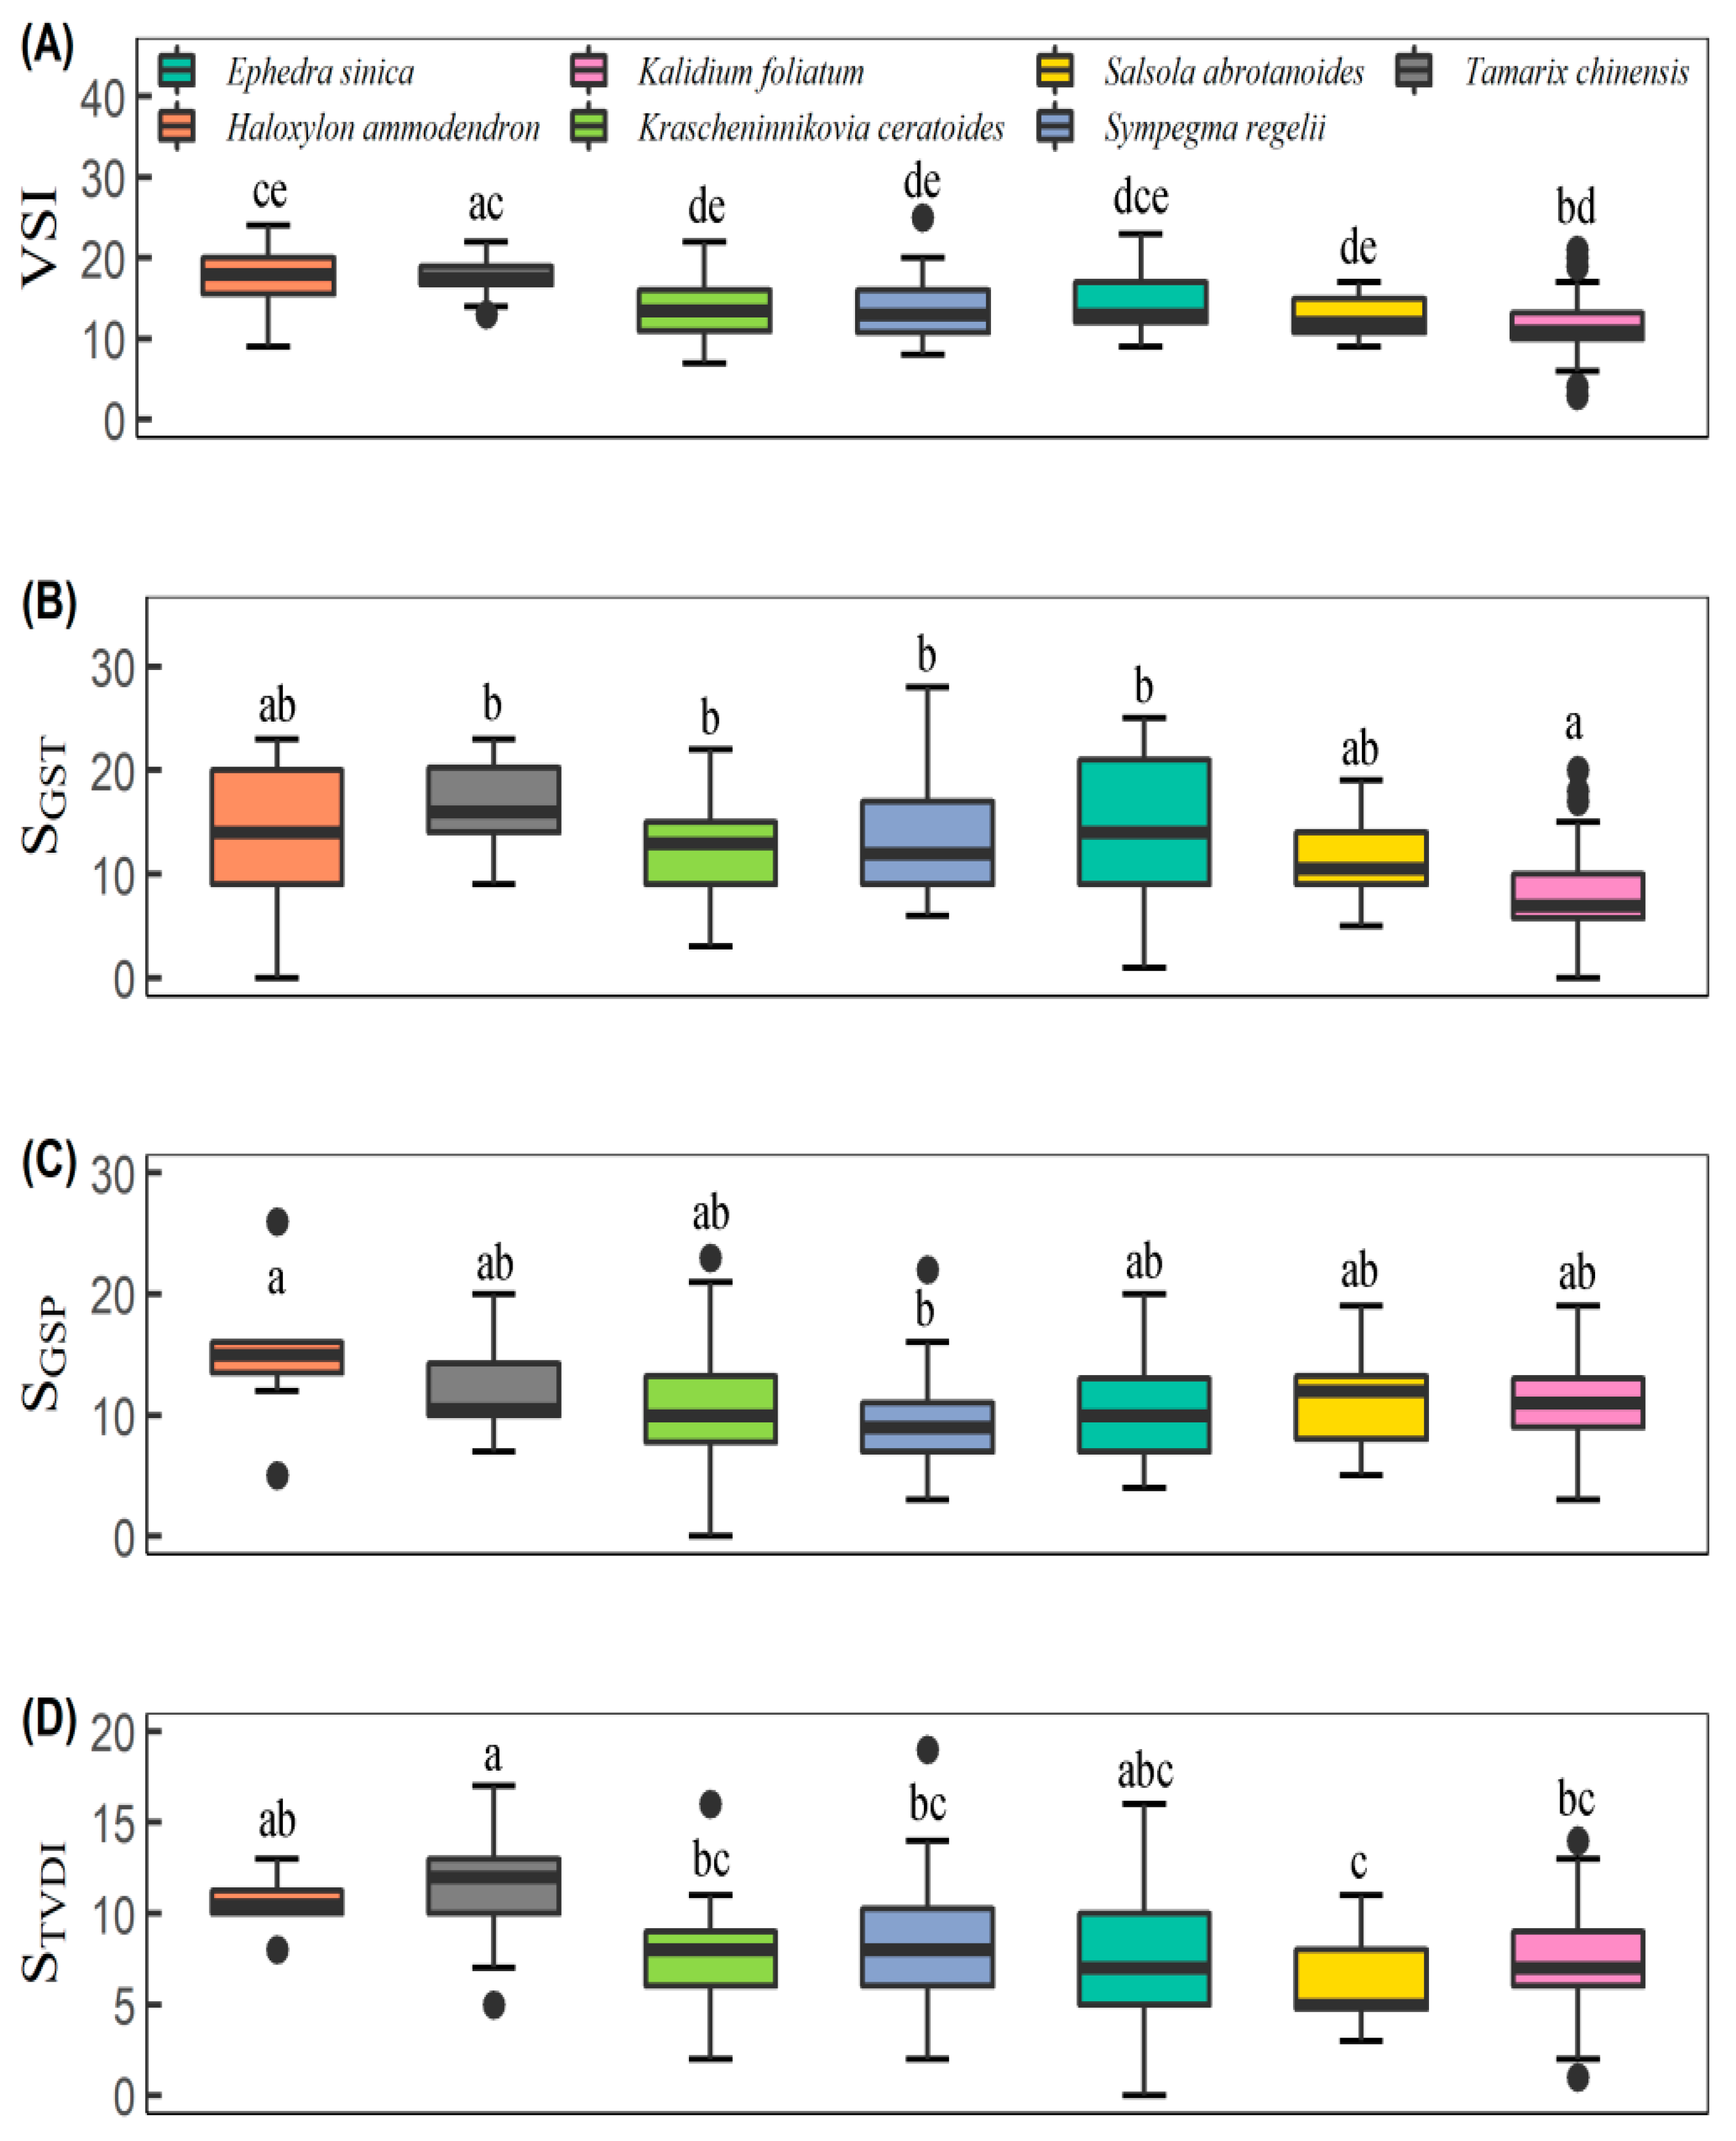
3.1. Vegetation Sensitivity Index and Its Contributors

The overall VSI of desert scrubs is low (15.0) and distributed unevenly across the Qaidam Basin. The VSI was greater than 30 at only 1.18% pixels scattered near the foothills and riverbanks (Figure 1A and Figure 2A, Table 2). The relative contribution of each climatic variable also varies heterogeneously across space. Specifically, in the western and northeastern areas, vegetation is more sensitive to changes in GSP. However, the desert scrubs in the southern and northern areas were mainly affected by temperature dynamics. In the eastern part, desert scrubs were jointly controlled by GSP and TVDI (Figure 2B). Moreover, the desert scrubs in the central region were driven by GST and TVDI together.
Communities dominated by Haloxylon ammodendron and Tamarix chinensis were more sensitive to climate variability than others (Figure 3A). The climatic weights vary among desert-scrub types. Communities dominated by Tamarix chinensis were more sensitive to GST than others (Figure 3B), while communities dominated by Haloxylon ammodendron were more vulnerable to GSP (Figure 3C). In response to changes in TVDI, communities dominated by Tamarix chinensis were slightly more vulnerable than those dominated by Haloxylon ammodendron. However, both communities were more sensitive than other desert scrub communities across the Qaidam Basin (Figure 3D).

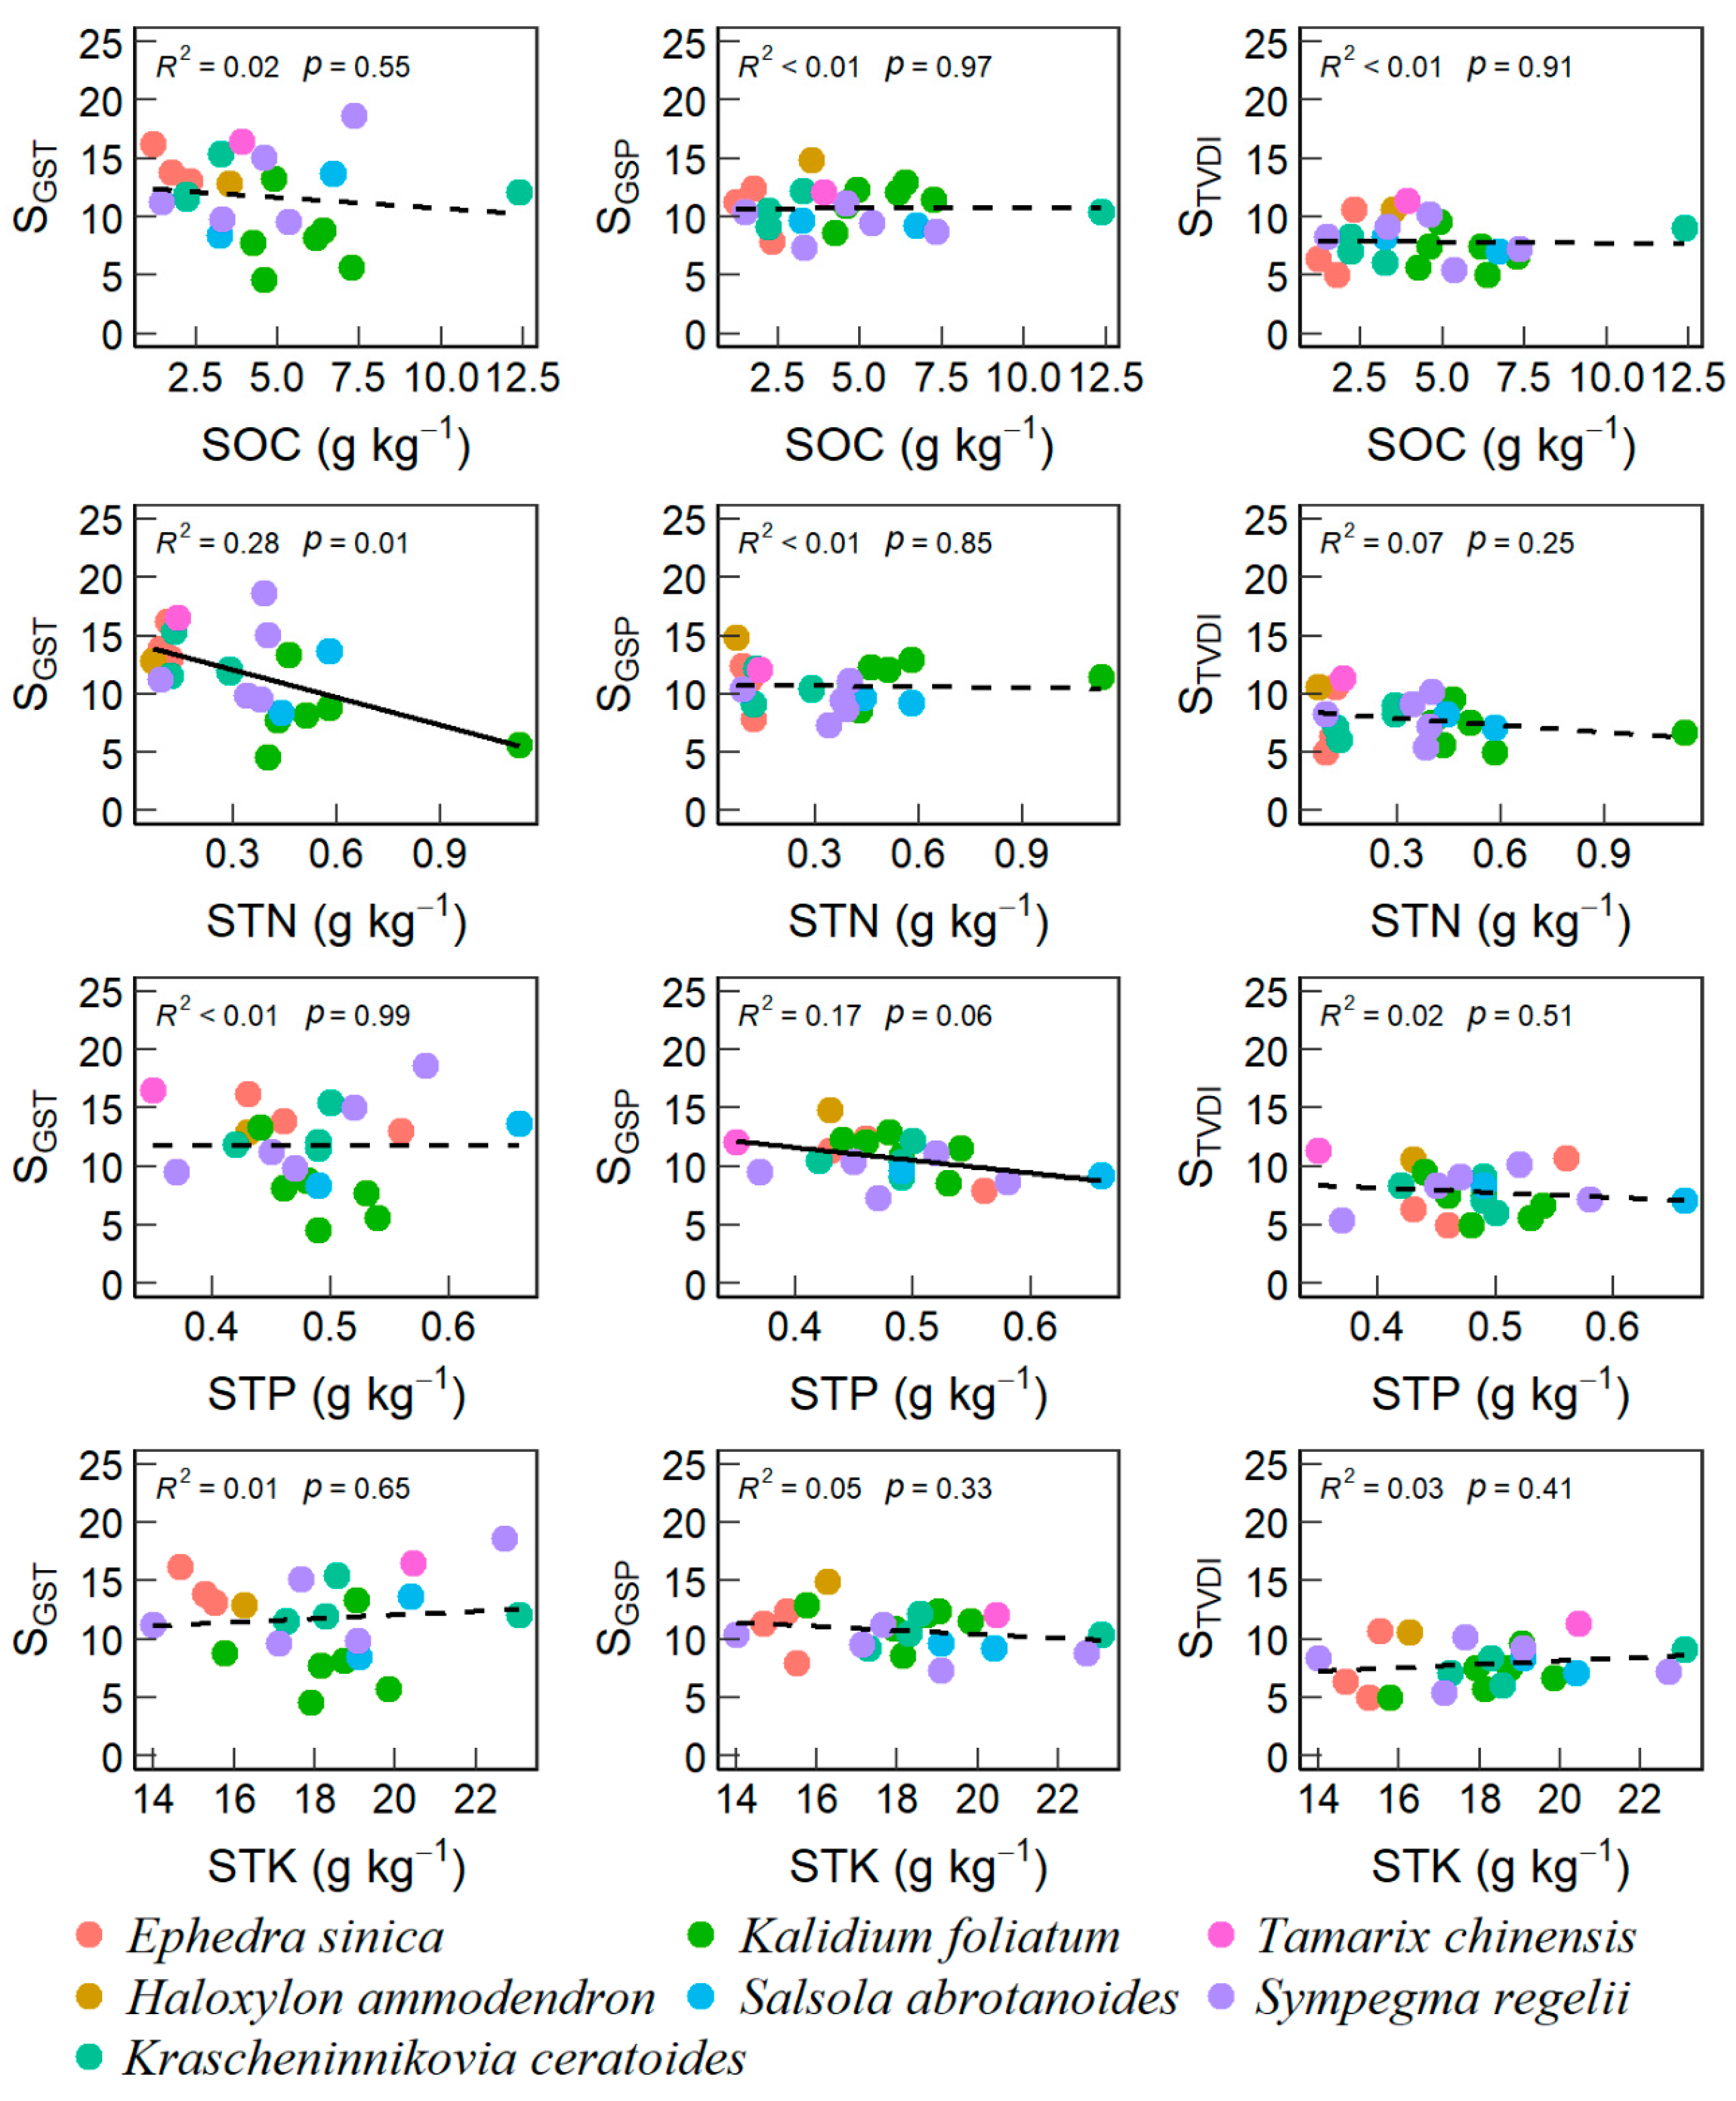
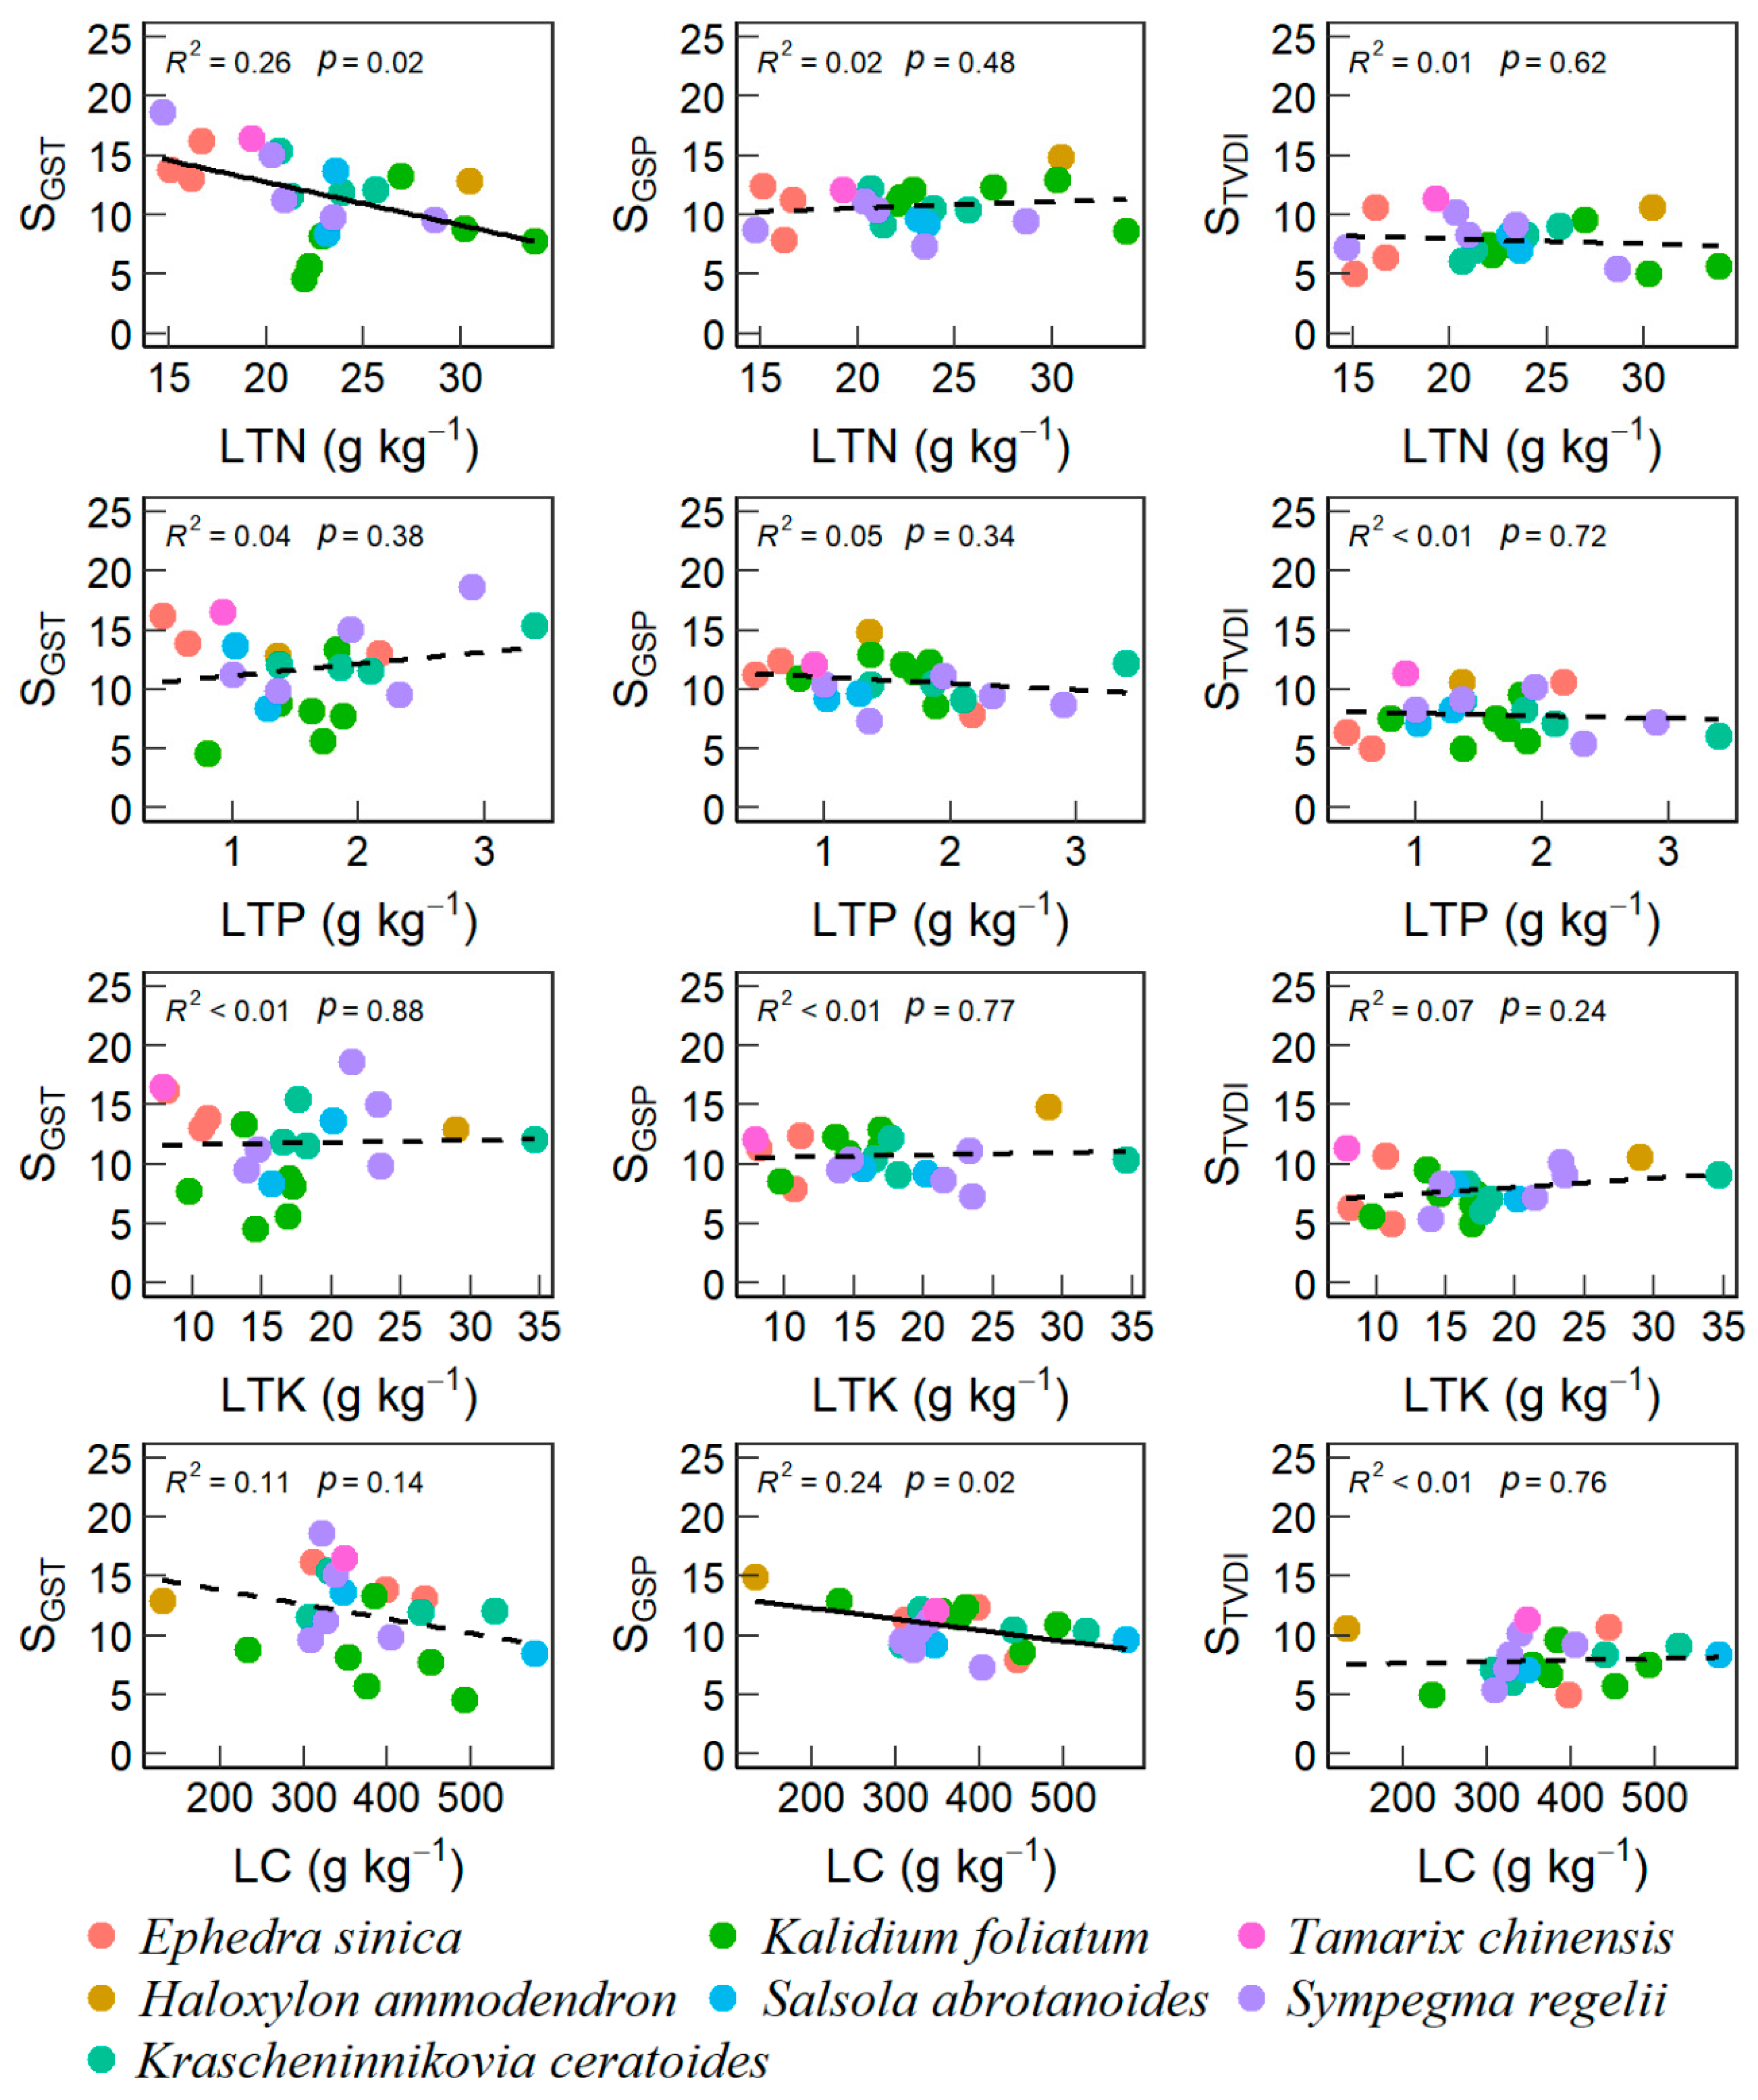
3.2. Effects of Soil and Plant Properties on VSI

We found that VSI strongly correlated with the weights of GST (SGST, r = 0.81) and droughts (STVDI, r = 0.65, Figure S6). SGST was negatively correlated with STN (r = −0.53) and LTN (r = −0.51). The weight of GSP (SGSP) was negatively correlated with LC (r = −0.49). Moreover, SOC had strong correlations with SGST (r = −0.53), STK (r = 0.74), LTK (r = 0.59), and STN (r = −0.48), respectively. Across different dominant species of the 22 sites surveyed in this study, we only found that SGST declined linearly with increasing STN and LTN (Figure 4 and Figure 5) while SGSP declined linearly with increasing STP and LC (Figure 4 and Figure 5).
However, we also found differential responses, linear, U-shaped, and unimodal, for different top-dominant species along the soil and foliar nutrient gradients (Figures S7 and S8). When examining the relationships of sensitivity components with soil nutrients, we only found that the SGST of Kalidium foliatum and STVDI of Sympegma regelii had unimodal relationships with SOC and STP, respectively, at a marginal significance level (p < 0.1, Figure S7). When examining the relationships of sensitivity components with foliar nutrimental traits, we found a significant unimodal relationship between STVDI and LC for Sympegma Regeli (p < 0.05, Figure S8), a marginally positive linear relationship between SGSP and LTK for Kalidium foliatum (p < 0.1, Figure S8), a significant unimodal relationship between SGSP and LTN for Kalidium foliatum, and a marginally positive linear relationship between SGST and LTP for Krascheninnikovia ceratoides (p < 0.1, Figure S8).
STN and LC explained 42.9% of the variance in VSI across different desert scrubs (p < 0.05, Table 3). SGST was significantly affected by STN and LC, which accounted for 49.0% of the variance in SGST (p < 0.01, Table 3). In addition to STN and LC, LTN and STK affected SGST marginally, respectively, to explain 9.11% and 7.62% of the variance in SGST (p = 0.053 and 0.073, respectively, Table 3). SGSP was affected by LC and STP marginally, with 14.0% and 18.9% of its variance explained by LC and STP (p < 0.1, Table 3). Neither soil nutrients nor plant leaf traits influenced STVDI in this study (p > 0.05, Table 3).

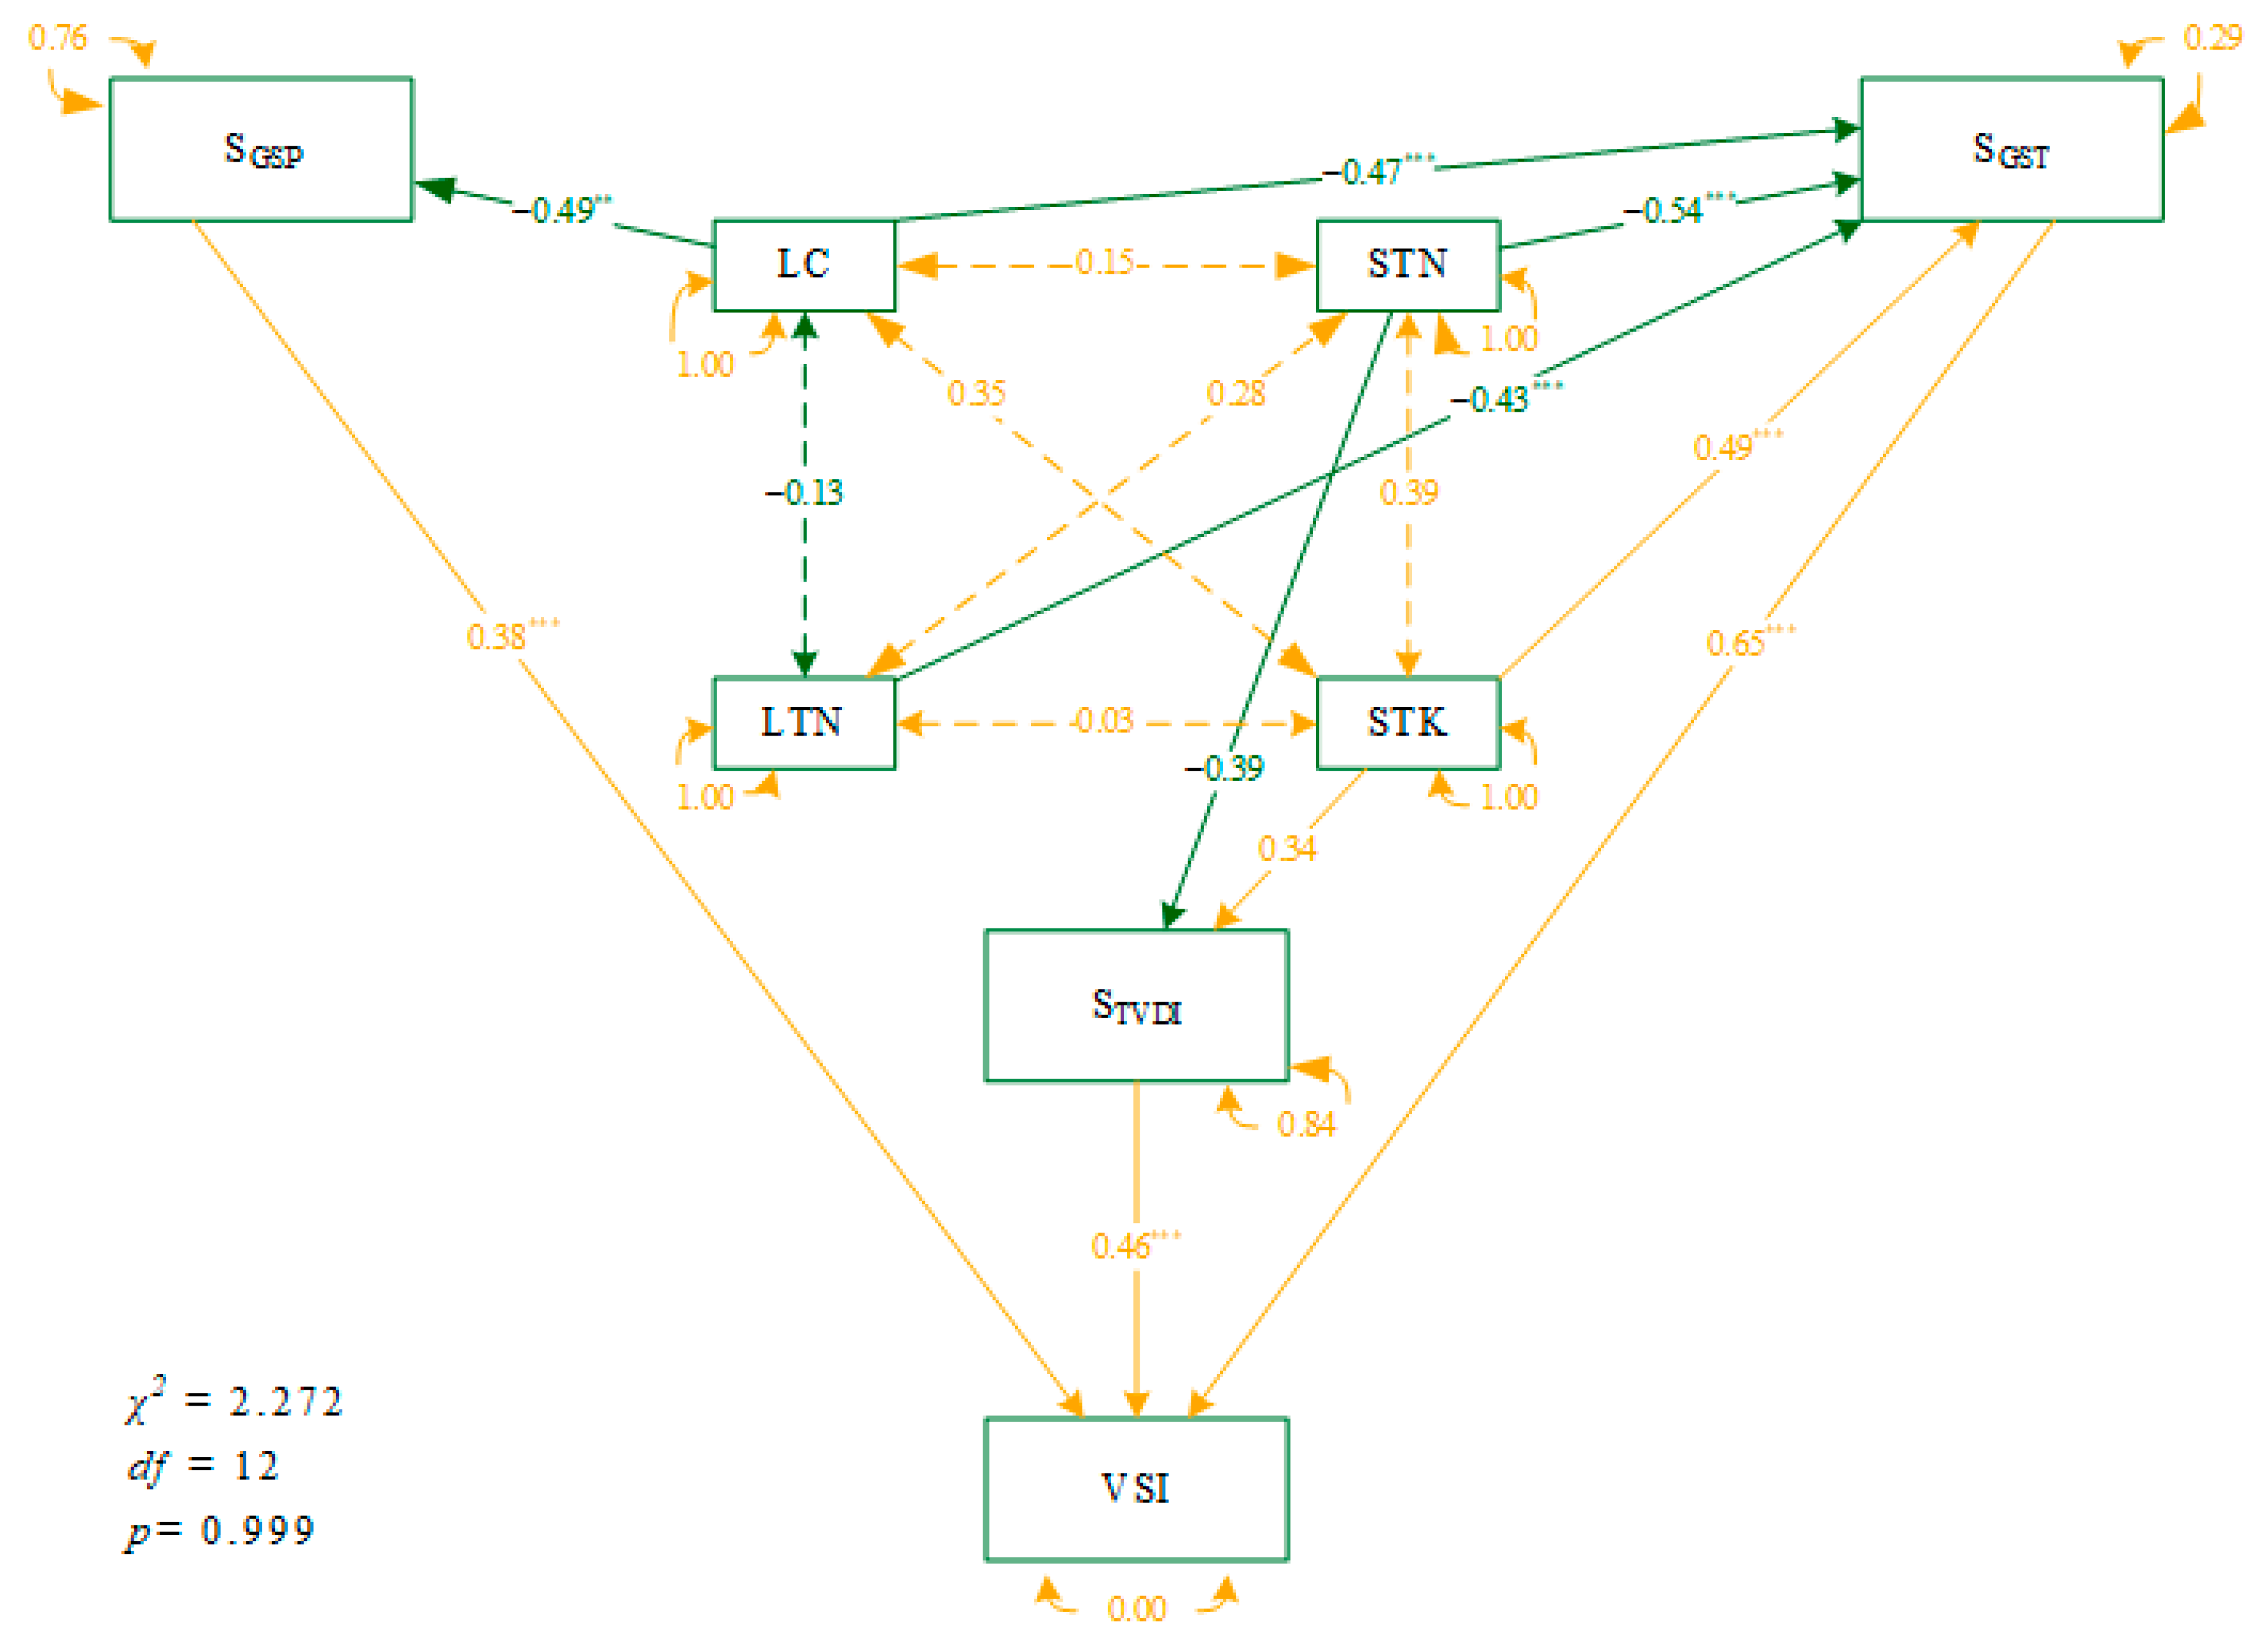
3.3. Causal Network of Plant Traits and Soil Nutrients to VSI under Climate Variability

Structural equation modeling revealed the causal networking paths among plant and soil nutrient traits and climate weights to the sensitivity of desert scrubs across the Qaidam Basin (Figure 6). STN, LC, and LTN had direct adverse effects on SGST. In contrast, STK had a significant positive effect on SGST. LC had direct adverse effects on SGSP, accounting for about 24% of its total variance. STN had direct adverse effects on STVDI, while STK had a significant positive effect on STVDI. However, STN and STK accounted for only 16% of the variance in STVDI.

4. Discussion

4.1. Climate Sensitivity among Different Desert Scrubs

In this study, we mapped the climate sensitivity of desert scrubs in the Qaidam Basin using principal component regressions (Figure 2). We found that the climatic sensitivity of desert scrubs in this study was not high as expected. However, this finding is consistent with Seddon et al. [14] and Yuan et al. [18], and they found that arid deserts across the globe and Central Asia, respectively, were not as sensitive to climate dynamics. This phenomenon may have resulted from the strong memory effect of desert plants (Figure S9). The vegetation memory effect generally refers to the fact that previous environmental conditions can strongly influence the current ecosystem [70]. Ogle et al. [71] quantified ecological memory in vegetation and ecosystem processes in arid and semi-arid regions and found when the vegetation’s memory effects were considered, 18–28% more of the variance in a given responsible variable could be explained. Seddon et al. [14] also found such a strong memory effect in global drylands’ sensitivity to climate change. Moreover, the low climatic sensitivity of desert scrubs in the Qaidam Basin was also likely due to the relatively slow warming during the last decade (Figure S2), a rate of only 0.06 °C per decade. This finding was also confirmed by Easterling and Wehner [72] that at the beginning of the 21st century, there would be a 10- to 20-year warming hiatus. Overall, the stable climatic conditions may be another explanation for the low climate sensitivity of desert scrubs in the Qaidam Basin.
Although the desert scrubs were not sensitive as expected to climate change, we also found high species-dependency for the seven community types involved in this study. Specifically, we found that scrub communities with tall plant individuals, such as Tamarix chinensis communities and Haloxylon ammodendron communities, were more sensitive to climate change (Figure 3). Similarly, Zhu et al. [73] have found that northern China’s trees and tall shrubs are more vulnerable to climate change. This is because taller plants have predictably wider water-conducting conduits, so they are more vulnerable to conduction-blocking embolisms [74]. Therefore, the response of different plant communities to climate change is influenced by the functional traits evolved to adapt to long-term environmental changes. However, vegetation also reacts and adjusts positively to environmental stresses [21]. Environmental-vegetation interactions have shaped scrub communities with different tolerance, and the response of these scrub communities to climate variability varies widely in the Qaidam Basin. The environmental filtering hypothesis predicts that, excluding biotic interactions, only the species that have already evolved with specific functional or phenotypic traits for survival, such as tolerance or avoidance of dryland plants to extreme water deficits [21,75]. This might be the reason for the differences in the relative weight of temperature (SGST), precipitation (SGSP), and drought (STVDI) found among the top-dominant species (Figure 3).

4.2. Desert-Scrubs’ VSI Correlated with Soil and Leaf Nutrients

Warming is one of the important drivers for community structural and functional changes in drylands. Here, we found that STN, STK, LTN, and LC were closely related to the SGST of vegetation (Table 3) and together explained more than 65% of the variance in SGST (Table 3). This might be because warming can enhance soil microorganism activities, promote SOM decomposition and N mineralization, and thereby increase the supply and availability of soil nutrients [76,77,78]. In addition to STN and STK, warming can also enhance the activity and supply of K ions in soil solution [79].
In addition to soil nutrients, we also found that SGST generally declined with increasing LTN and LC (Figure 5), indicating a high photosynthetic rate with high LTN and LC can mitigate the negative effects of warming. LTN and LC are usually used to descript the photosynthetic activity under manipulated stresses in experimental studies [80,81]. Our findings were partly consistent with Li et al. [15] that high-elevated grasslands have greater SGST than those in low-elevations on the Tibetan Plateau. Dryland plants can increase leaf photosynthetic enzymes by enhancing LTN to promote photosynthetic rate and water use efficiency [82,83,84]. Moreover, our findings confirmed that the relationships of sensitivity climatic components with soil and foliar nutrients varied among different top-dominant species (Figures S7 and S8), likely due to species niche overlapping and differentiation.
Water availability is the main limiting factor for desert vegetation, and we found that STP and LC were the main factors affecting vegetation SGSP, explaining 18.8% and 13.96% of the variation in SGSP, respectively. P is an important element that affects vegetation growth, development, and metabolism; however, it can be readily combined with Ca2+ in arid soils and then is hard to be uptaken by plants. Pulsed precipitation in drylands can influence P transport, transformation, and availability through biochemical processes that control organophosphorus mineralization [85,86]. This might be the reason for the declining SGSP with increasing STP (Figure 4) in our study.
LC is closely related to the photosynthesis of vegetation. Under drought conditions, vegetation reduces its water loss by decreasing leaf area and lowering light saturation point, which results in impaired ATP synthesis and reduced carboxylase activity, resulting in impaired leaf photosynthesis and thus reduced LC fixation [87]. Pulsed precipitation can briefly mitigate vegetation drought conditions and provide good moisture conditions for vegetation photosynthesis, thus increasing LC accumulation. This is why we also found that SGSP declined with increasing LC content across different species (Figure S8). In addition, we also found that the LC of the seven arid scrub species was concentrated in the 300–400 g kg−1 interval, which may imply the coexistence of species has evolved with overlapped niches to successfully survive in the Qaidam Basin, Qinghai-Tibetan Plateau.
It is worthy to note that neither soil nor plant nutritional properties alone can well explain the variance in STVDI, which describes the availability of soil moisture, in other words, the combining effects of temperature and precipitation. In this study, we found that STVDI could be associated with STN and STK at the same time (Figure 6). Both STN and STK could explain 16% of the variance in STVDI across different species and sites. Soil water deficit caused by decoupling temperature and precipitation can limit soil microbial activity and slow down soil N mineralization [88]. Moreover, a drying environment with high temperatures and limited precipitation can also exacerbate the volatilization of gaseous N and lead to high evaporative demand [89], which in turn reduces the availability of STN [90]. Dry conditions can enhance soil inorganic N content [91]; however, they are hardly taken up by plants due to diffusion limitations [92]. The uptake of potassium by vegetation is dependent on soil moisture [93]; soil water deficit reduces soil potassium release capacity and availability [94] and inhibits soil potassium mobility, limiting potassium uptake by vegetation.

4.3. The Networks of Direct and Indirect Environmental Influences on VSI

The response of vegetation to climate change is characterized by the integrated effect of multiple factors and processes, forming complex and specific climate-species relationships [95,96]. In this study, we found that soil and foliar nutrient properties affect the scrub communities’ climate sensitivity by regulating different climate sensitivity components. Even more, such regulating effects are dependent on the spatial scale, across sites, or for a given species. Finally, we found that the effect of soil nutrient effectiveness on VSI was greater compared to leaf nutrient effectiveness. The path strength of STK and STN on SGST were greater than that of LC and LTN (Figure 6), and the explanatory power of STK and STN on the variance in SGST (37.52%) was greater than that of LC and LTN (28.17%, Table 3). Soil nutrients provide indispensable nutrients for the growth and development of vegetation, and the decoupling of soil nutrient cycles due to climate warming may negatively affect dryland ecosystem services [40]. We should pay attention to the role of soil nutrients in drylands to maintain ecosystem stability. Therefore, in the future, the dependent and combining effects of biotic and abiotic factors on vegetation’s sensitivity and vulnerability should be well examined and disentangled.

4.4. Limitations and Future Work

In this study, we integrated remote sensing data and field measurements together to investigate the mechanisms behind desert scrub’s sensitivity to climate change in the Qaidam Basin, Qinghai-Plateau. However, there are still several uncertainties in this study. First, there might be a scaling-mismatch problem between remote sensing data and field measurements. Indeed, NDVI can be used to reflect the information on all vegetation in the whole region. Limited by budgets, only dominant desert scrub plants were sampled and measured for functional traits. Herbaceous plants were not fully considered in field observations. This may affect the accuracy of CWMs of plant functional traits and lead to some bias in the interpretation of community climate sensitivity. In further studies, both scrubs and herbaceous plants should be well considered because they have differential strategies to adapt to changes in physical circumstances.
In addition, this study only considered several soil nutrients and failed to take into account the effects of microorganisms and trace elements in soils. A recent review suggests that soil microbes dominate soil life activities by mediating nutrient cycling, decomposing organic matter, inhibiting plant diseases, influencing soil structure, and maintaining vegetation productivity, are major drivers of soil ecosystem change, and have game-changing potential in restoring soil function [97]. Moreover, soil trace elements are directly involved in the metabolic activities of organisms and influence the growth and development of vegetation, and have received increasing attention globally [98]. Therefore, future studies should also integrate the effects of multiple factors to obtain a more comprehensive understanding of the vegetation–climate relationship.

5. Conclusions

This study assessed and disentangled the sensitivity and its components of desert scrubs to climate variability with the time series of NDVI and weather data at the large scale crossing the Qaidam Basin. The regulatory mechanisms of plant and soil functional/nutrimental traits behind the desert scrub’s climate sensitivity were investigated and compared among multiple communities dominated by different plant species. The results confirmed that the sensitivity of vegetation to temperature change was mainly regulated by the contents of leaf carbon and nitrogen as well as soil nitrogen and potassium. In contrast, the sensitivity of vegetation to precipitation change was regulated by the contents of leaf carbon and soil total nitrogen. Neither soil nutrients nor plant foliar traits alone can well explain scrubs’ sensitivity to droughts. Plant foliar traits and soil nutrient properties indirectly regulate the different components of vegetation’s climate sensitivity. Due to harsh physical circumstances in the Qaidam Basin and limited available funds, a scaling-mismatch problem might still exist between remote-sensing data and field measurements in this study. Anyway, this study combined soil and plant functional traits together to provide a new perspective to investigate the mechanisms behind desert vegetation dynamics under climate change when assessed with large-scale remote-sensing data. These findings also highlighted the necessity to make management and conservation strategies specifically according to the different factors that regulate the vegetation–climate relationship among different plant communities.

Supplementary Materials

The following supporting information can be downloaded at: https://www.mdpi.com/article/10.3390/rs14184601/s1.

Author Contributions

J.W. and H.C. conceived ideas and designed field protocols. B.C., J.W. and M.L. collected data. B.C. and H.C. performed chemical analyses. J.W. and B.C. analyzed data, prepared figures, and led the writing. M.L., S.F., M.C.M., A.N., K.W., B.T. and H.C. interpreted the results. All authors have read and agreed to the published version of the manuscript.

Funding

This research was jointly supported by the Second Tibetan Plateau Scientific Expedition and Research (STEP, 2019QZKK1002), the Innovation Talent Exchange of Foreign Expert Program under the Belt and Road Initiative (DL2021056001L), the Key Project of the Hebei Normal University (L2021Z05) and the National Natural Sciences Foundation of China (41877448 and 40971118).

Acknowledgments

J.W. had been funded with a two-year scholarship from January 2017 to April 2019 by the Alexander von Humboldt Foundation in Germany. J.W. has been supported by the Young Talent Scientist Program of the Chinese Academy of Agricultural Sciences since December 2019. S.F. was funded by the Deutsche Forschungsgemeinschaft (DFG, project number 192626868–SFB 990/2-3). We appreciated the valuable comments and suggestions given by Ben Niu and Zhipeng Wang, and Yun Jäschke on the first draft of this manuscript.

Conflicts of Interest

The authors declare that they have no known competing financial interests or personal relationships that could have influenced the work reported in this paper.

References

  1. Reynolds, J.F.; Smith, D.M.; Lambin, E.F.; Turner, B.L., 2nd; Mortimore, M.; Batterbury, S.P.; Downing, T.E.; Dowlatabadi, H.; Fernandez, R.J.; Herrick, J.E.; et al. Global desertification: Building a science for dryland development. Science 2007, 316, 847–851. [Google Scholar] [CrossRef] [PubMed]
  2. Millennium Ecosystem Assessment. Ecosystems and Human Well-Being: Wetlands and Water; Island Press: Washington, DC, USA, 2005; Volume 5. [Google Scholar]
  3. Berdugo, M.; Delgado-Baquerizo, M.; Soliveres, S.; Hernandez-Clemente, R.; Zhao, Y.; Gaitan, J.J.; Gross, N.; Saiz, H.; Maire, V.; Lehmann, A.; et al. Global ecosystem thresholds driven by aridity. Science 2020, 367, 787–790. [Google Scholar] [CrossRef] [PubMed]
  4. Huang, J.; Li, Y.; Fu, C.; Chen, F.; Fu, Q.; Dai, A.; Shinoda, M.; Ma, Z.; Guo, W.; Li, Z.; et al. Dryland climate change: Recent progress and challenges. Rev. Geophys. 2017, 55, 719–778. [Google Scholar] [CrossRef]
  5. Vicente-Serrano, S.M.; Zouber, A.; Lasanta, T.; Pueyo, Y. Dryness is accelerating degradation of vulnerable shrublands in semiarid Mediterranean environments. Ecol. Monogr. 2012, 82, 407–428. [Google Scholar] [CrossRef]
  6. Huang, J.P.; Yu, H.P.; Guan, X.D.; Wang, G.Y.; Guo, R.X. Accelerated dryland expansion under climate change. Nat. Clim. Chang. 2016, 6, 166–171. [Google Scholar] [CrossRef]
  7. Barbier, E.B.; Hochard, J.P. Land degradation and poverty. Nat. Sustain. 2018, 1, 623–631. [Google Scholar] [CrossRef]
  8. Tietjen, B.; Schlaepfer, D.R.; Bradford, J.B.; Lauenroth, W.K.; Hall, S.A.; Duniway, M.C.; Hochstrasser, T.; Jia, G.; Munson, S.M.; Pyke, D.A.; et al. Climate change-induced vegetation shifts lead to more ecological droughts despite projected rainfall increases in many global temperate drylands. Glob. Chang. Biol. 2017, 23, 2743–2754. [Google Scholar] [CrossRef]
  9. Hantson, S.; Huxman, T.E.; Kimball, S.; Randerson, J.T.; Goulden, M.L. Warming as a driver of vegetation loss in the Sonoran desert of California. J. Geophys. Res.-Biogeo. 2021, 126, e2020JG005942. [Google Scholar] [CrossRef]
  10. Gherardi, L.A.; Sala, O.E. Effect of interannual precipitation variability on dryland productivity: A global synthesis. Glob. Chang. Biol. 2019, 25, 269–276. [Google Scholar] [CrossRef]
  11. Hoover, D.L.; Pfennigwerth, A.A.; Duniway, M.C. Drought resistance and resilience: The role of soil moisture-plant interactions and legacies in a dryland ecosystem. J. Ecol. 2021, 109, 3280–3294. [Google Scholar] [CrossRef]
  12. Pettorelli, N.; Laurance, W.F.; O’Brien, T.G.; Wegmann, M.; Nagendra, H.; Turner, W. Satellite remote sensing for applied ecologists: Opportunities and challenges. J. Appl. Ecol. 2014, 51, 839–848. [Google Scholar] [CrossRef]
  13. Thomas, C.D.; Cameron, A.; Green, R.E.; Bakkenes, M.; Beaumont, L.J.; Collingham, Y.C.; Erasmus, B.F.; De Siqueira, M.F.; Grainger, A.; Hannah, L.; et al. Extinction risk from climate change. Nature 2004, 427, 145–148. [Google Scholar] [CrossRef] [PubMed]
  14. Seddon, A.W.; Macias-Fauria, M.; Long, P.R.; Benz, D.; Willis, K.J. Sensitivity of global terrestrial ecosystems to climate variability. Nature 2016, 531, 229–232. [Google Scholar] [CrossRef]
  15. Li, L.; Zhang, Y.; Wu, J.; Li, S.; Zhang, B.; Zu, J.; Zhang, H.; Ding, M.; Paudel, B. Increasing sensitivity of alpine grasslands to climate variability along an elevational gradient on the Qinghai-Tibet plateau. Sci. Total Environ. 2019, 678, 21–29. [Google Scholar] [CrossRef] [PubMed]
  16. Li, M.; Wu, J.S.; Song, C.Q.; He, Y.T.; Niu, B.; Fu, G.; Tarolli, P.; Tietjen, B.; Zhang, X.Z. Temporal variability of precipitation and biomass of alpine grasslands on the northern tibetan plateau. Remote Sens. 2019, 11, 360. [Google Scholar] [CrossRef]
  17. Yao, Y.; Wang, X.; Li, Y.; Wang, T.; Shen, M.; Du, M.; He, H.; Li, Y.; Luo, W.; Ma, M.; et al. Spatiotemporal pattern of gross primary productivity and its covariation with climate in China over the last thirty years. Glob. Chang. Biol. 2018, 24, 184–196. [Google Scholar] [CrossRef]
  18. Yuan, Y.; Bao, A.; Liu, T.; Zheng, G.; Jiang, L.; Guo, H.; Jiang, P.; Yu, T.; de Maeyer, P. Assessing vegetation stability to climate variability in central Asia. J. Environ. Manag. 2021, 298, 113330. [Google Scholar] [CrossRef]
  19. Henn, J.J.; Buzzard, V.; Enquist, B.J.; Halbritter, A.H.; Klanderud, K.; Maitner, B.S.; Michaletz, S.T.; Potsch, C.; Seltzer, L.; Telford, R.J.; et al. Intraspecific trait variation and phenotypic plasticity mediate alpine plant species response to climate change. Front. Plant Sci. 2018, 9, 1548. [Google Scholar] [CrossRef]
  20. Liu, Y.; Men, M.; Peng, Z.; Houx, J.H., 3rd; Peng, Y. Nitrogen availability determines ecosystem productivity in response to climate warming. Ecology 2022, e3823. [Google Scholar] [CrossRef]
  21. Palmquist, K.A.; Schlaepfer, D.R.; Renne, R.R.; Torbit, S.C.; Doherty, K.E.; Remington, T.E.; Watson, G.; Bradford, J.B.; Lauenroth, W.K. Divergent climate change effects on widespread dryland plant communities driven by climatic and ecohydrological gradients. Glob. Chang. Biol. 2021, 27, 5169–5185. [Google Scholar] [CrossRef]
  22. Violle, C.; Navas, M.L.; Vile, D.; Kazakou, E.; Fortunel, C.; Hummel, I.; Garnier, E. Let the concept of trait be functional! Oikos 2007, 116, 882–892. [Google Scholar] [CrossRef]
  23. McGill, B.J.; Enquist, B.J.; Weiher, E.; Westoby, M. Rebuilding community ecology from functional traits. Trends Ecol. Evol. 2006, 21, 178–185. [Google Scholar] [CrossRef] [PubMed]
  24. Kearney, M.; Porter, W.P. Ecologists have already started rebuilding community ecology from functional traits. Trends Ecol. Evol. 2006, 21, 481–482; author reply 482–483. [Google Scholar] [CrossRef]
  25. Bruelheide, H.; Dengler, J.; Purschke, O.; Lenoir, J.; Jimenez-Alfaro, B.; Hennekens, S.M.; Botta-Dukat, Z.; Chytry, M.; Field, R.; Jansen, F.; et al. Global trait-environment relationships of plant communities. Nat. Ecol. Evol. 2018, 2, 1906–1917. [Google Scholar] [CrossRef]
  26. De Bello, F.; Lepš, J.A.N.; Sebastià, M.-T. Predictive value of plant traits to grazing along a climatic gradient in the Mediterranean. J. Appl. Ecol. 2005, 42, 824–833. [Google Scholar] [CrossRef]
  27. Guo, X.; Liu, H.; Ngosong, C.; Li, B.; Wang, Q.; Zhou, W.; Nie, M. Response of plant functional traits to nitrogen enrichment under climate change: A meta-analysis. Sci. Total Environ. 2022, 834, 155379. [Google Scholar] [CrossRef]
  28. Midolo, G.; Kuss, P.; Wellstein, C. Land use and water availability drive community-level plant functional diversity of grasslands along a temperature gradient in the Swiss Alps. Sci. Total Environ. 2021, 764, 142888. [Google Scholar] [CrossRef]
  29. Prieto, I.; Roumet, C.; Cardinael, R.; Dupraz, C.; Jourdan, C.; Kim, J.H.; Maeght, J.L.; Mao, Z.; Pierret, A.; Portillo, N.; et al. Root functional parameters along a land-use gradient: Evidence of a community-level economics spectrum. J. Ecol. 2015, 103, 361–373. [Google Scholar] [CrossRef]
  30. Wang, H.; Wang, R.; Harrison, S.P.; Prentice, I.C. Leaf morphological traits as adaptations to multiple climate gradients. J. Ecol. 2022, 110, 1344–1355. [Google Scholar] [CrossRef]
  31. Balachowski, J.A.; Volaire, F.A. Implications of plant functional traits and drought survival strategies for ecological restoration. J. Appl. Ecol. 2018, 55, 631–640. [Google Scholar] [CrossRef]
  32. Lian, X.; Piao, S.L.; Chen, A.P.; Huntingford, C.; Fu, B.J.; Li, L.Z.X.; Huang, J.P.; Sheffield, J.; Berg, A.M.; Keenan, T.F.; et al. Multifaceted characteristics of dryland aridity changes in a warming world. Nat. Rev. Earth Environ. 2021, 2, 232–250. [Google Scholar] [CrossRef]
  33. Woods, H.A.; Makino, W.; Cotner, J.B.; Hobbie, S.E.; Harrison, J.F.; Acharya, K.; Elser, J.J. Temperature and the chemical composition of poikilothermic organisms. Funct. Ecol. 2003, 17, 237–245. [Google Scholar] [CrossRef]
  34. Zhang, Q.; Zhou, J.; Li, X.; Yang, Z.; Zheng, Y.; Wang, J.; Lin, W.; Xie, J.; Chen, Y.; Yang, Y. Are the combined effects of warming and drought on foliar c:N:P:K stoichiometry in a subtropical forest greater than their individual effects? For. Ecol. Manag. 2019, 448, 256–266. [Google Scholar] [CrossRef]
  35. Sun, Y.; Liao, J.H.; Zou, X.M.; Xu, X.; Yang, J.Y.; Chen, H.Y.H.; Ruan, H.H. Coherent responses of terrestrial c:N stoichiometry to drought across plants, soil, and microorganisms in forests and grasslands. Agric. For. Meteorol. 2020, 292–293, 108104. [Google Scholar] [CrossRef]
  36. Niu, D.; Zhang, C.; Ma, P.; Fu, H.; Elser, J.J. Responses of leaf c:N:P stoichiometry to water supply in the desert shrub Zygophyllum xanthoxylum. Plant Biol. 2019, 21, 82–88. [Google Scholar] [CrossRef]
  37. Castellanos, A.E.; Llano-Sotelo, J.M.; Machado-Encinas, L.I.; Lopez-Pina, J.E.; Romo-Leon, J.R.; Sardans, J.; Penuelas, J. Foliar c, n, and p stoichiometry characterize successful plant ecological strategies in the Sonoran desert. Plant Ecol. 2018, 219, 775–788. [Google Scholar] [CrossRef]
  38. Huang, J.; Wang, P.; Niu, Y.; Yu, H.; Ma, F.; Xiao, G.; Xu, X. Changes in c:N:P stoichiometry modify n and p conservation strategies of a desert steppe species Glycyrrhiza uralensis. Sci. Rep. 2018, 8, 12668. [Google Scholar] [CrossRef]
  39. Jiang, Y.Y.; Rocha, A.V.; Rastetter, E.B.; Shaver, G.R.; Mishra, U.; Zhuang, Q.L.; Kwiatkowski, B.L. C-n-p interactions control climate driven changes in regional patterns of c storage on the north slope of Alaska. Landsc. Ecol. 2016, 31, 195–213. [Google Scholar] [CrossRef]
  40. Delgado-Baquerizo, M.; Maestre, F.T.; Gallardo, A.; Bowker, M.A.; Wallenstein, M.D.; Quero, J.L.; Ochoa, V.; Gozalo, B.; Garcia-Gomez, M.; Soliveres, S.; et al. Decoupling of soil nutrient cycles as a function of aridity in global drylands. Nature 2013, 502, 672–676. [Google Scholar] [CrossRef]
  41. Jiao, F.; Shi, X.R.; Han, F.P.; Yuan, Z.Y. Increasing aridity, temperature and soil pH induce soil c-n-p imbalance in grasslands. Sci. Rep. 2016, 6, 19601. [Google Scholar] [CrossRef] [PubMed]
  42. Fiedler, S.; Monteiro, J.A.F.; Hulvey, K.B.; Standish, R.J.; Perring, M.P.; Tietjen, B. Global change shifts trade-offs among ecosystem functions in woodlands restored for multifunctionality. J. Appl. Ecol. 2021, 58, 1705–1717. [Google Scholar] [CrossRef]
  43. Jäschke, Y.; Heberling, G.; Wesche, K. Environmental controls override grazing effects on plant functional traits in Tibetan rangelands. Funct. Ecol. 2020, 34, 747–760. [Google Scholar] [CrossRef]
  44. Gross, N.; Bagousse-Pinguet, Y.L.; Liancourt, P.; Berdugo, M.; Gotelli, N.J.; Maestre, F.T. Functional trait diversity maximizes ecosystem multifunctionality. Nat. Ecol. Evol. 2017, 1, 132. [Google Scholar] [CrossRef] [PubMed]
  45. He, N.; Li, Y.; Liu, C.; Xu, L.; Li, M.; Zhang, J.; He, J.; Tang, Z.; Han, X.; Ye, Q.; et al. Plant trait networks: Improved resolution of the dimensionality of adaptation. Trends Ecol. Evol. 2020, 35, 908–918. [Google Scholar] [CrossRef] [PubMed]
  46. He, N.; Liu, C.; Piao, S.; Sack, L.; Xu, L.; Luo, Y.; He, J.; Han, X.; Zhou, G.; Zhou, X.; et al. Ecosystem traits linking functional traits to macroecology. Trends Ecol. Evol. 2019, 34, 200–210. [Google Scholar] [CrossRef]
  47. Jin, X.M.; Liu, J.T.; Wang, S.T.; Xia, W. Vegetation dynamics and their response to groundwater and climate variables in Qaidam basin, China. Int. J. Remote Sens. 2016, 37, 710–728. [Google Scholar] [CrossRef]
  48. Han, J.J.; Wang, J.P.; Chen, L.; Xiang, J.Y.; Ling, Z.Y.; Li, Q.K.; Wang, E.L. Driving factors of desertification in Qaidam basin, China: An 18-year analysis using the geographic detector model. Ecol. Indic. 2021, 124, 107404. [Google Scholar] [CrossRef]
  49. Shi, X.; Yu, D.; Warner, E.; Pan, X.; Petersen, G.; Gong, Z.; Weindorf, D. Soil database of 1:1,000,000 digital soil survey and reference system of the Chinese genetic soil classification system. Soil Surv. Horiz. 2004, 45, 129–136. [Google Scholar] [CrossRef]
  50. Zhang, S.Q.; Chen, H.; Fu, Y.; Niu, H.H.; Yang, Y.; Zhang, B.X. Fractional vegetation cover estimation of different vegetation types in the Qaidam basin. Sustainability 2019, 11, 864. [Google Scholar] [CrossRef]
  51. Fu, Y.; Chen, H.; Niu, H.H.; Zhang, S.Q.; Yang, Y. Spatial and temporal variation of vegetation phenology and its response to climate changes in Qaidam basin from 2000 to 2015. J. Geogr. Sci. 2018, 28, 400–414. [Google Scholar] [CrossRef] [Green Version]
  52. Savitzky, A.; Golay, M.J. Smoothing and differentiation of data by simplified least squares procedures. Anal. Chem. 1964, 36, 1627–1639. [Google Scholar] [CrossRef]
  53. Holben, B.N. Characteristics of maximum-value composite images from temporal AVHRR data. Int. J. Remote Sens. 1986, 7, 1417–1434. [Google Scholar] [CrossRef]
  54. Hutchinson, M. ANUSPLIN, version 4.3; Centre for Resource and Environmental Studies, The Australian National University: Canberra, Australia, 2004. [Google Scholar]
  55. Li, M.; Wu, J.S.; He, Y.T.; Wu, L.; Niu, B.; Song, M.H.; Zhang, X.Z. Dimensionality of grassland stability shifts along with altitudes on the Tibetan plateau. Agric. For. Meteorol. 2020, 291, 108080. [Google Scholar] [CrossRef]
  56. Sandholt, I.; Rasmussen, K.; Andersen, J. A simple interpretation of the surface temperature/vegetation index space for assessment of surface moisture status. Remote Sens. Environ. 2002, 79, 213–224. [Google Scholar] [CrossRef]
  57. Kendall, M.G. Rank Correlation Methods, 4th ed.; Charles Grifin: London, UK, 1975. [Google Scholar]
  58. Mann, H.B. Nonparametric tests against trend. Econometrica 1945, 13, 245–259. [Google Scholar] [CrossRef]
  59. Akhtar, K.; Wang, W.Y.; Ren, G.X.; Khan, A.; Feng, Y.Z.; Yang, G.H. Changes in soil enzymes, soil properties, and maize crop productivity under wheat straw mulching in Guanzhong, China. Soil Till. Res. 2018, 182, 94–102. [Google Scholar] [CrossRef]
  60. Wu, J.S.; Song, M.H.; Ma, W.L.; Zhang, X.Z.; Shen, Z.X.; Tarolli, P.; Wurst, S.; Shi, P.L.; Ratzmann, G.; Feng, Y.F.; et al. Plant and soil’s δ n-15 are regulated by climate, soil nutrients, and species diversity in alpine grasslands on the northern Tibetan plateau. Agric. Ecosyst. Environ. 2019, 281, 111–123. [Google Scholar] [CrossRef]
  61. Gauzere, P.; Doulcier, G.; Devictor, V.; Kefi, S. A framework for estimating species-specific contributions to community indicators. Ecol. Indic. 2019, 99, 74–82. [Google Scholar] [CrossRef]
  62. Violle, C.; Reich, P.B.; Pacala, S.W.; Enquist, B.J.; Kattge, J. The emergence and promise of functional biogeography. Proc. Natl. Acad. Sci. USA 2014, 111, 13690–13696. [Google Scholar] [CrossRef]
  63. Wilcoxon, F. Individual comparisons by ranking methods. In Breakthroughs in Statistics; Springer: Berlin/Heidelberg, Germany, 1992; pp. 196–202. [Google Scholar]
  64. Wei, T.; Simko, V. R Package “Corrplot”: Visualization of a Correlation Matrix (Version 0.92). 2021. Available online: https://github.com/taiyun/corrplot (accessed on 26 February 2022).
  65. Niu, W.; Chen, H.; Wu, J. Soil moisture and soluble salt content dominate changes in foliar delta(13)c and delta(15)n of desert communities in the Qaidam basin, Qinghai-Tibetan plateau. Front. Plant Sci. 2021, 12, 675817. [Google Scholar] [CrossRef]
  66. Wu, J.; Li, M.; Fiedler, S.; Ma, W.; Wang, X.; Zhang, X.; Tietjen, B. Impacts of grazing exclusion on productivity partitioning along regional plant diversity and climatic gradients in Tibetan alpine grasslands. J. Environ. Manag. 2019, 231, 635–645. [Google Scholar] [CrossRef]
  67. Rosseel, Y. Lavaan: An R package for structural equation modeling. J. Stat. Softw. 2012, 48, 1–36. [Google Scholar] [CrossRef]
  68. R Core Team. R: A Language and Environment for Statistical Computing; R Foundation for Statistical Computing: Vienna, Austria, 2021. [Google Scholar]
  69. ESRI. ArcGIS Desktop: Release 10.2; Environmental Systems Research Institute: Redlands, CA, USA, 2014. [Google Scholar]
  70. Kusch, E.; Davy, R.; Seddon, A.W.R. Vegetation-memory effects and their association with vegetation resilience in global drylands. J. Ecol. 2022, 110, 1561–1574. [Google Scholar] [CrossRef]
  71. Ogle, K.; Barber, J.J.; Barron-Gafford, G.A.; Bentley, L.P.; Young, J.M.; Huxman, T.E.; Loik, M.E.; Tissue, D.T. Quantifying ecological memory in plant and ecosystem processes. Ecol. Lett. 2015, 18, 221–235. [Google Scholar] [CrossRef] [PubMed]
  72. Easterling, D.R.; Wehner, M.F. Is the climate warming or cooling? Geophys. Res. Lett. 2009, 36. [Google Scholar] [CrossRef]
  73. Zhu, Y.K.; Zhang, J.T.; Zhang, Y.Q.; Qin, S.G.; Shao, Y.Y.; Gao, Y. Responses of vegetation to climatic variations in the desert region of northern China. Catena 2019, 175, 27–36. [Google Scholar] [CrossRef]
  74. Olson, M.E.; Soriano, D.; Rosell, J.A.; Anfodillo, T.; Donoghue, M.J.; Edwards, E.J.; Leon-Gomez, C.; Dawson, T.; Camarero Martinez, J.J.; Castorena, M.; et al. Plant height and hydraulic vulnerability to drought and cold. Proc. Natl. Acad. Sci. USA 2018, 115, 7551–7556. [Google Scholar] [CrossRef]
  75. Kraft, N.J.B.; Adler, P.B.; Godoy, O.; James, E.C.; Fuller, S.; Levine, J.M. Community assembly, coexistence and the environmental filtering metaphor. Funct. Ecol. 2015, 29, 592–599. [Google Scholar] [CrossRef]
  76. Aerts, R.; Chapin, F.S. The mineral nutrition of wild plants revisited: A re-evaluation of processes and patterns. In Advances in Ecological Research; Fitter, A.H., Raffaelli, D.G., Eds.; Academic Press: Cambridge, MA, USA, 2000; Volume 30, pp. 1–67. [Google Scholar]
  77. Hobbie, S.E.; Nadelhoffer, K.J.; Hogberg, P. A synthesis: The role of nutrients as constraints on carbon balances in boreal and arctic regions. Plant Soil 2002, 242, 163–170. [Google Scholar] [CrossRef]
  78. Kirschbaum, M.U.F. The temperature-dependence of soil organic-matter decomposition, and the effect of global warming on soil organic-c storage. Soil Biol. Biochem. 1995, 27, 753–760. [Google Scholar] [CrossRef]
  79. Sparks, D.L.; Liebhardt, W.C. Temperature effects on potassium exchange and selectivity in Delaware soils. Soil Sci. 1982, 133, 10–17. [Google Scholar] [CrossRef]
  80. Lewis, J.D.; Lucash, M.; Olszyk, D.M.; Tingey, D.T. Relationships between needle nitrogen concentration and photosynthetic responses of douglas-fir seedlings to elevated CO2 and temperature. New Phytol. 2004, 162, 355–364. [Google Scholar] [CrossRef]
  81. Berry, J.; Bjorkman, O. Photosynthetic response and adaptation to temperature in higher plants. Annu. Rev. Plant Physiol. 1980, 31, 491–543. [Google Scholar] [CrossRef]
  82. Field, C. The photosynthesis-nitrogen relationship in wild plants. In On the Economy of Form and Function; Cambridge University Press: Cambridge, UK, 1986. [Google Scholar]
  83. Wright, I.J.; Reich, P.B.; Westoby, M. Strategy shifts in leaf physiology, structure and nutrient content between species of high- and low-rainfall and high- and low-nutrient habitats. Funct. Ecol. 2001, 15, 423–434. [Google Scholar] [CrossRef]
  84. Wright, I.J.; Reich, P.B.; Cornelissen, J.H.; Falster, D.S.; Garnier, E.; Hikosaka, K.; Lamont, B.B.; Lee, W.; Oleksyn, J.; Osada, N.; et al. Assessing the generality of global leaf trait relationships. New Phytol. 2005, 166, 485–496. [Google Scholar] [CrossRef]
  85. Blackwell, M.S.A.; Brookes, R.C.; de la Fuente-Martinez, N.; Gordon, H.; Murray, P.J.; Snars, K.E.; Williams, J.K.; Bol, R.; Haygarth, P.M. Chapter 1—Phosphorus solubilization and potential transfer to surface waters from the soil microbial biomass following drying–rewetting and freezing–thawing. In Advances in Agronomy; Sparks, D.L., Ed.; Elsevier: Amsterdam, The Netherlands, 2010; Volume 106, pp. 1–35. [Google Scholar]
  86. Wang, R.Z.; Creamer, C.A.; Wang, X.; He, P.; Xu, Z.W.; Jiang, Y. The effects of a 9-year nitrogen and water addition on soil aggregate phosphorus and sulfur availability in a semi-arid grassland. Ecol. Indic. 2016, 61, 806–814. [Google Scholar] [CrossRef]
  87. Farooqui, A.; Pillai, S.K.; Agnihotri, D.; Khan, S.; Tewari, R.; Shukla, S.K.; Ali, S.; Trivedi, A.; Pandita, S.K.; Kumar, K.; et al. Impact of climate on the evolution of vegetation in tectonically active Karewa basin, Kashmir Himalayas. J. Earth Syst. Sci. 2021, 130, 93. [Google Scholar] [CrossRef]
  88. Li, Z.; Tian, D.; Wang, B.; Wang, J.; Wang, S.; Chen, H.Y.H.; Xu, X.; Wang, C.; He, N.; Niu, S. Microbes drive global soil nitrogen mineralization and availability. Glob. Chang. Biol. 2019, 25, 1078–1088. [Google Scholar] [CrossRef] [PubMed]
  89. Trenberth, K.E.; Dai, A.G.; van der Schrier, G.; Jones, P.D.; Barichivich, J.; Briffa, K.R.; Sheffield, J. Global warming and changes in drought. Nat. Clim. Chang. 2014, 4, 17–22. [Google Scholar] [CrossRef]
  90. Brenner, D.L.; Amundson, R.; Baisden, W.T.; Kendall, C.; Harden, J. Soil n and n-15 variation with time in a California annual grassland ecosystem. Geochim. Cosmochim. Acta 2001, 65, 4171–4186. [Google Scholar] [CrossRef]
  91. Evans, S.E.; Burke, I.C. Carbon and Nitrogen Decoupling Under an 11-Year Drought in the Shortgrass Steppe. Ecosystems 2013, 16, 704–705. [Google Scholar] [CrossRef]
  92. Körner, C.; Kèorner, C. Alpine Plant Life: Functional Plant Ecology of High Mountain Ecosystems; Springer: Berlin/Heidelberg, Germany, 1999. [Google Scholar]
  93. Kuchenbuch, R.; Claassen, N.; Jungk, A. Potassium availability in relation to soil moisture. Plant Soil 1986, 95, 233–243. [Google Scholar] [CrossRef]
  94. Bargagli, R.; Brown, D.H.; Nelli, L. Metal biomonitoring with mosses: Procedures for correcting for soil contamination. Environ. Pollut. 1995, 89, 169–175. [Google Scholar] [CrossRef]
  95. Mahlstein, I.; Daniel, J.S.; Solomon, S. Pace of shifts in climate regions increases with global temperature. Nat. Clim. Chang. 2013, 3, 739–743. [Google Scholar] [CrossRef]
  96. Moles, A.T.; Perkins, S.E.; Laffan, S.W.; Flores-Moreno, H.; Awasthy, M.; Tindall, M.L.; Sack, L.; Pitman, A.; Kattge, J.; Aarssen, L.W.; et al. Which is a better predictor of plant traits: Temperature or precipitation? J. Veg. Sci. 2014, 25, 1167–1180. [Google Scholar] [CrossRef]
  97. Coban, O.; de Deyn, G.B.; van der Ploeg, M. Soil microbiota as game-changers in restoration of degraded lands. Science 2022, 375, abe0725. [Google Scholar] [CrossRef]
  98. Watanabe, T.; Broadley, M.R.; Jansen, S.; White, P.J.; Takada, J.; Satake, K.; Takamatsu, T.; Tuah, S.J.; Osaki, M. Evolutionary control of leaf element composition in plants. New Phytol. 2007, 174, 516–523. [Google Scholar] [CrossRef]
Figure 1. Vegetation (A), elevation and major meteorological stations (B), climate (C), and site locations (black dots) in the Qaidam Basin, Qinghai-Tibetan Plateau. In Panel C, GST and GSP refer to the average temperature and sum precipitation during the plant growing season, respectively, from May to October during 2000–2015. TVDI means the temperature vegetation dryness index.
Remotesensing 14 04601 g001
Figure 2. Vegetation Sensitivity Index (VSI, (A)) and its contributions (B) from the temperature and precipitation during the plant growing season (GST and GSP, respectively, in red and blue) and temperature vegetation dryness index (TVDI, in green).
Remotesensing 14 04601 g002
Figure 3. Comparisons of VSI (A) and its climatic weights among desert scrub communities. Panels (BD) displayed the weights of mean temperature and sum precipitation during the plant growing season (noted as SGST and SGSP, respectively) as well as the temperature vegetation dryness index (STVDI). Different lowercase letters indicate significant differences among species.
Remotesensing 14 04601 g003
Figure 4. Trends of vegetation sensitivity index and its contributions with soil nutrients.
Remotesensing 14 04601 g004
Figure 5. Trends of vegetation sensitivity index and its contributions with leaf nutrients.
Remotesensing 14 04601 g005
Figure 6. Structural equation modeling reveals the direct and indirect effects of leaf traits and soil properties on VSI and its components of desert scrubs across the Qaidam Basin. Notes are the same as in Table 1. The orange and dark-green lines represent the positive and negative influences, respectively. The difference significant at the 0.001 and 0.01 levels were indicated with *** and **, respectively.
Remotesensing 14 04601 g006
Table 1. Locations, the most dominant species and their relative coverage (DSC), climate conditions, soil properties, and plant nutrient traits at each site sampled in 2016 across the Qaidam Basin. GST and GSP refer to the average temperature and precipitation during the plant growing season. Soil properties included the contents of organic carbon (SOC), total nitrogen (STN), total phosphorus (STP), and total potassium (STK) of topsoils at the 0–50 cm depth. Plant nutrient traits were the community weighted means (CWMs) of leaf carbon (LC), total nitrogen (LTN), total phosphorus (LTP), and total potassium (LTK) in the leaves of all plants at each sampling site.
SiteLong (°E)Lat. (°N)Alt. (m)Dominant Species DSC (%)GST
(°C)
GSP
(mm)
SOC
(g kg−1)
STN
(g kg−1)
STK
(g kg−1)
STP
(g kg−1)
LC
(g kg−1)
LTN
(g kg−1)
LTP
(g kg−1)
LTK
(g kg−1)
Site195.09136.3462890Sympegma regelii53.016.4661.480.0914.000.45326.6020.951.0014.72
Site295.26736.3252970Ephedra sinica65.015.8721.210.1114.670.43311.3616.670.458.16
Site395.70336.3812850Ephedra sinica48.016.8731.760.0915.270.46397.4015.090.6511.13
Site496.12636.3782765Tamarix chinensis100.017.3793.910.1420.460.35348.0019.250.927.88
Site596.41336.3822855Krascheninnikovia ceratoides50.016.7922.200.1217.290.49307.2021.282.1018.18
Site696.63036.2932850Haloxylon ammodendron100.016.41013.520.0716.270.43132.0030.451.3628.97
Site798.32936.4693320Kalidium foliatum80.012.22243.230.4419.090.49576.0023.101.2815.68
Site898.64836.5363530Kalidium foliatum59.010.42646.160.5118.740.46353.5122.871.6317.19
Site998.88336.7233175Kalidium foliatum100.012.32617.261.1319.840.54375.0022.201.7216.88
Site1098.94736.7733070Kalidium foliatum65.013.12574.250.4318.140.53451.5033.841.889.71
Site1198.31236.9622945Sympegma regelii27.014.52144.580.4017.650.52338.6820.311.9423.31
Site1298.39037.0173130Kalidium foliatum61.013.02364.580.4017.920.49492.6621.990.8014.55
Site1397.88637.3443205Salsola abrotanoides56.012.82226.380.5815.770.48233.3330.241.3716.91
Site1497.28437.3662970Sympegma regelii70.014.61725.350.3817.120.37307.8028.652.3313.93
Site1597.12737.2582860Krascheninnikovia ceratoides56.016.31462.200.2918.290.42440.0023.901.8616.50
Site1697.06837.3332905Kalidium foliatum83.3315.81494.900.4619.040.44384.0026.951.8313.69
Site1796.62337.3842980Sympegma regelii60.0015.71263.300.3419.080.47403.8023.421.3623.54
Site1896.13537.4403620Salsola abrotanoides66.6711.21356.710.5820.400.66346.6723.571.0220.15
Site1995.39537.8553310Sympegma regelii40.0013.1917.330.3922.710.58321.6014.702.9021.44
Site2095.36437.8003190Krascheninnikovia ceratoides100.0013.88512.380.2923.090.49528.0025.671.3734.63
Site2195.38137.5653185Krascheninnikovia ceratoides50.0014.1823.250.1318.560.50330.0020.653.4017.60
Site2295.50637.3283035Ephedra sinica40.0015.3762.310.1215.520.56444.6016.192.1710.66
Table 2. Vegetation Sensitivity Index (VSI) among different desert scrub communities across the Qaidam Basin.
Haloxylon ammodendron
(%)
Tamarix chinensis
(%)
Krascheninnikovia ceratoides
(%)
Sympegma regelii
(%)
Ephedra sinica
(%)
Salsola abrotanoides
(%)
Kalidium foliatum
(%)
Others
(%)
Total
(%)
VSI ≤ 103.241.104.570.320.694.070.832.4517.32
10 < VSI ≤ 208.006.9616.641.392.8820.705.467.8870.27
20 < VSI ≤ 300.961.282.780.160.413.640.801.0911.23
VSI > 300.090.100.360.010.040.400.060.111.18
Table 3. Main effects of soil nutrient availability and plant nutrient traits on vegetation sensitivity index (VSI) of desert scrubs across the Qaidam Basin. Abbreviations were the same as in Table 1. d.f., the degree of freedom; F, variance ratio; p, significance level; η2, Eta squared, the percentage of sum squares explained. The difference significant at the 0.01 and 0.05 levels were labeled with ** and *, respectively.
Predictord.f.VSI, R2 = 0.57SGST, R2 = 0.74SGSP, R2 = 0.45STVDI, R2 = 0.21
Fpη2 (%)Fpη2 (%)Fpη2 (%)Fpη2 (%)
SOC10.290.5970.980.890.3621.800.000.9700.010.010.9100.07
STN17.740.016 *25.8814.870.002 **29.900.070.7950.301.540.2368.34
STP10.140.7100.482.010.1804.044.430.05518.880.090.7640.51
STK11.310.2734.393.790.0737.621.940.1888.251.820.2009.83
LTN11.350.2664.534.530.0539.110.040.8500.160.000.9630.01
LTP10.000.9460.021.110.3112.230.080.7880.320.450.5162.41
LTK10.960.3453.220.050.8310.100.630.4432.671.570.2328.50
LC15.090.042 *17.029.480.009 **19.063.270.09413.960.020.9030.08
Publisher’s Note: MDPI stays neutral with regard to jurisdictional claims in published maps and institutional affiliations.

