Abstract
The severity of wildfires is increasing and has driven increases in nighttime fire activity. Enhanced capability to detect the active burning regions of wildfires at night could significantly improve the effectiveness of wildfire management operations. Potassium line emission in the NIR near 770 nm is a signature of active burning. We test the use of multi-band imaging from an aircraft at night to distinguish a wood-burning fire from artificial light sources. We find that a simple ratio of the signals in two broad bands, one including 770 nm, effectively discriminates the fire from artificial light sources. This offers the possibility of nighttime fire detection with high spatial resolution using silicon sensors sensitive in the NIR.
1. Introduction
Wildfires are increasing in severity and socioeconomic impact. In 2020, more than 50,000 wildfires were recorded within the United States that burned a total of more than 10 million acres [1]. Nighttime fire activity is increasing even more rapidly than daytime activity, as a result of hotter and drier nights [2]. In 2003–2020, nighttime fire activity increased by 40–50% [2]. This subsequently decreases the usual nighttime barriers to fire propagation and promotes fire spread leading to larger fires. Large fires have the strongest nighttime activity [3]. The increase in nighttime fire activity has impacted wildfire suppression. Nighttime mitigation operations are increasingly common, enabled by the availability of night flying aircraft [4]. Innovations in capabilities to detect wildfires at night, particularly the most actively burning regions, could significantly improve the effectiveness of wildfire management operations. This could have a major impact on the lives of people living in fire-prone areas.
At typical wildfire temperatures, the fire radiative power (FRP) is dominated by emission in the mid-wave infrared (IR) band (MWIR) of 3.5–5 μm. This band is typically used for monitoring of fires from space [5] (for a recent review see [6]). These products have typical ground resolution from hundreds of meters (e.g., 375 m from the Visible Infrared Imaging Radiometer Suite or VIIRS [7]). Such resolutions are much larger than the typical (∼2 m) transverse dimension of fire fronts [8,9]. This hinders accurate derivation of fire properties for the active/flaming regions of a fire; the FRP from a pixel containing a small flaming region can equal that of a pixel with smoldering over a large area [10].
In contrast, radiation in the visible/NIR is robustly associated with flaming and the most active regions of wildfire. This can be understood because generation of visible/NIR photons requires more energy than IR photons. Visible/NIR light is produced when the fire combustion products (soot and complete-oxidized gases) absorb enough energy during combustion to excite the component atoms to energy levels that lead to emission of visible light [11,12]. Combined use of visible band or Day-And-Night Band (DNB covering 400–900 nm) and NIR from VIIRS can improve the detection of fires and characterize the fire phase and combustion efficiency at night [10].
With broad-band visible light alone, it can be difficult to distinguish burning from non-burning material. Vodacek et al. [13] proposed use of line emission from flaming regions for wildfire detection, specifically a doublet of lines from potassium. Figure 1 shows a spectrum of flaming wood. The flame spectrum is dominated by emission from a doublet from potassium (K) at wavelengths of 766.5 nm and 768.9 nm in the near-infrared (NIR). Potassium constitutes up to 7% of vegetation by mass, therefore is present at significant concentrations in wildfire fuel. The line is excited in active flaming regions and not in smoldering regions or by reflection of sunlight. The 768.9 nm line lies near an Oxygen (O2) absorption feature which reduces the signal by up to 60% for high-altitude or space-based observations. The 766.5 nm line is attenuated only by the O2 continuum and not significantly affected.
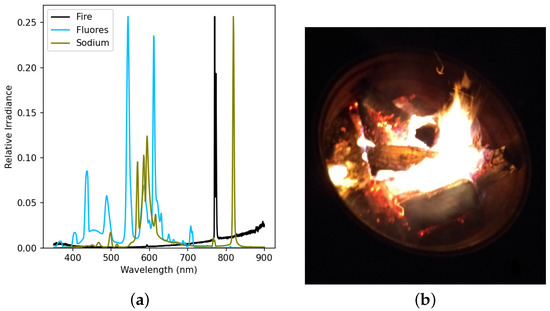
Figure 1.
(a) Visible/NIR spectrum of a wood-burning fire. The black line indicates the wood fire spectrum and shows strong line emission from potassium near 770 nm. The spectra of two common artificial light sources are shown for comparison. The olive curve shows the spectrum from a high-pressure sodium lamp. The light blue curve shows the spectrum of a fluorescent lamp. The fire spectrum was measured with an Ocean Optics Flame S-VIS-NIR-ES spectrometer. (b) Wood-burning fire showing flaming.
Use of the VIS-NIR is advantageous because silicon-based sensors can be used. The tremendous investment by industry in silicon detectors for VIS-NIR imaging has led to the availability of sensors with high pixel count (up to tens of megapixels) and very low readout noise (of a few electrons or even a fraction of an electron). The high pixel count enables coverage of wide fields of view with good angular resolution; this translates to coverage of wide ground swaths with good ground resolution. The low readout noise leads to high sensitivity in low-light conditions. Modern complementary metal–oxide–semiconductor (CMOS) sensors are designed to operate well at room temperature. Hence, they do not require cooling, unlike most SWIR and MWIR sensors. Recent sensor development targeted for night-time surveillance has led to improvements in the sensor quantum efficiency in the NIR band containing the potassium line.
High contrast versus background is key to fire identification. The low level of solar radiation in the MWIR band is a important factor enabling detection of fire signatures in that band [14]. Solar radiation is strong in the NIR band near the potassium line. Moreover, vegetation has high reflectance in the NIR, longward of the red edge at ∼700 nm [15] increasing the background during daylight. Previous efforts on use of the potassium line have focused on the daytime, when fires are most active [13,14,16,17]. The metrics used to identify fire are the “K emission index” which is the ratio of radiance at the potassium line (770 nm) to that in a proximal band (780 nm) [13] and the “advanced K band difference” which is a normalized difference between a narrow band containing the potassium line and nearby background bands [14]. The strong background of reflected light from vegetation near the potassium line may confound these metrics by inducing strong correlations between the radiances in the NIR bands near the potassium line [14].
Here, we propose to use observations of the potassium line to detect the flaming regions of fires at night, motivated by the recent increase in nighttime fire activity. This reduces the background due to solar radiation reflected by vegetation by a factor of more than even with a full moon. The predominant background is then artificial lighting. While wildfires do often burn in remote areas, the vast majority (84%) of wildfires in the US are started by humans [18]. These ignitions occur mainly at road networks, the wildland–urban interface, and boundaries between agricultural and forested areas. While these areas can have low population density, there is still infrastructure present, and it is important to discriminate fire from artificial lights to eliminate false positives in fire detection. Furthermore, fires at the wildland–urban interface cause the greatest loss of life and property destruction and are also the most difficult to fight [19].
Fortunately, the predominant artificial lighting sources do not produce strong emission near the potassium line, including sources that produce light via burning such as propane flames [20]. This may enable the use of relatively broad spectral bands for fire identification. Broad band two-dimensional imaging can be accomplished with much simpler instrumentation than the push-broom spectrometers used for most previous results on potassium line fire detection [13,14,16,17]. Imaging with narrow band filters has also been suggested [13,21] and used [22]. However, only interference filters achieve the very narrow bandpasses desired. Interference depends on the path length traveled by light through the filter material. The path length depends on the angle of incidence, therefore a constant bandpass can be maintained for interference filters only over a limited field of view [23]. Colored glass filters are an alternative that can produce passbands that remain constant over wide fields of view. However, the passbands are generally much wider than can be achieved with interference filters.
To achieve potassium line detections at night, we propose the use of multi-band, wide-field, two-dimensional imaging. The key question is whether relatively broad filter bands, on the order of 90 nm full width at half maximum, are effective in distinguishing fire from artificial light sources present at night. To address this question, we built a four-camera system providing quasi-simultaneous images in four filter bands and flew it on an aircraft over an urban environment including a small, wood-burning fire. In the following, we describe the camera system with an emphasis on the filter selection, acquisition and processing of the images from the flight, and the effectiveness of the system for fire detection. We conclude that the system effective in discriminating fire from artificial light sources. We discuss potential avenues for improvements and applications of multi-band imaging for fire detection at night.
2. Methods
2.1. Camera System and Filter Selection
We built a camera system containing four cameras with different filters selected to enable discrimination between the light generated by fire versus by artificial sources. We selected short focal-length lenses providing wide fields of view to maximize the ground area coverage. DMK 33UX290 Cameras from The Imaging Source, LLC, were used. These cameras employ the Sony IMX290LLR monochrome sensor which is a back-illuminated CMOS sensor sensitive to visible and NIR light. The pixel technology offers high light collection efficiency and low noise making the sensor sensitive in low light environments. Each IMX290 contains a 1920 × 1080 array of 2.9 μm square pixels. The cameras use a USB interface. We used the Imaging Source software development kit and wrote software to run the four cameras. The image acquisitions were not simultaneous, with a delay of up to 4 s between capture of the first and last images in a set of four. This will be improved in a future iteration of the instrument. Tamron 13FM04IR lenses were used. The 13FM04IR provides good light collection with an f-number of 1.2 and good transmission in the visible and NIR. The lenses have a focal length of 4 mm which when used with the IMX290 sensor provides a field of view of .
It is important that the camera system filters provide constant bandpass across the full field of view. We used StablEDGE®filters from Midwest Optical Systems, Inc (Palatine, IL, USA), that incorporate absorptive filter glass to provide a stable bandpass even for large incidence angles. This minimizes the wavelength shift across the camera field of view. The filter bands were chosen to enable discrimination between the spectra of fire and artificial light sources as shown in Figure 1. The band passes of our selected filters are shown in Figure 2. The MidOpt BP735 filter was chosen to provide high transmission at the potassium lines while minimizing the transmission at the 809 nm sodium line produced by high-pressure sodium lamps that are used extensively in street and other outdoor lighting. The BP635, BP540, and BP470 filters were selected to capture the visible-band emission of fluorescent, high-pressure sodium, and LED lamps. The BP540 and BP635 are paired with SP700 filters to block non-zero response of those filters in the NIR. Hereafter, we refer to those as the BP540 and BP635 images for brevity.
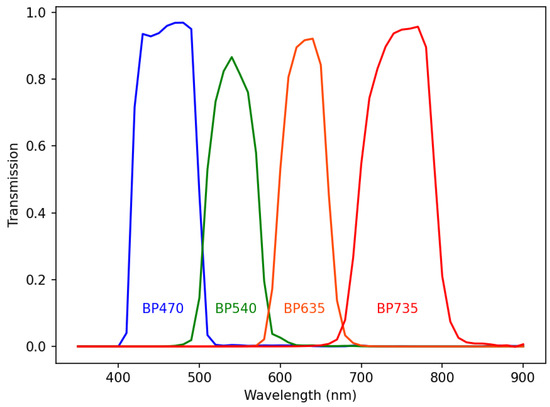
Figure 2.
Transmission curves of the filters selected for VIS/NIR imaging. The filter bands were chosen to enable discrimination between the fire spectrum shown in Figure 1 and artificial light sources.
2.2. Image Acquisition and Processing
The camera system was mounted in a Bonanza aircraft. The cameras view the ground through a 5-inch diameter hole in the passenger section of the aircraft. The aircraft was flown by Schnell and the camera system operated by Tammes. The aircraft was flown over Iowa City, Iowa, USA, which provided a variety of artificial lights. A wood-burning fire was set in a 0.9 m diameter fire pit as shown in Figure 1. The wood was mainly Ash. The fire pit was located in a residential neighborhood (“Lucas Farms”) within Iowa City.
The data analysed here consist of one set of four images obtained while the aircraft was close to directly overhead of the fire pit. An exposure time of 20 milliseconds was used for all four cameras to limit blurring due to aircraft motion. Images were taken in 12-bit mode and all image pixel values were well below saturation. The aircraft was an altitude of 776 m in nearly level flight at a speed of 54.5 m s−1. The pixel size on the ground was 0.56 m and the aircraft motion during each exposure was 1.09 m.
The camera were rotated at different multiples of 90° within the assembly to allow for cable access and there was off-axis vignetting, particularly for the two cameras with two filters. This reduced the useful extent of the overlapping regions. We analyzed a field of view of 900 × 600 pixels where all cameras had good response. To align the images, we manually selected and estimated the centroids of compact, stationary light sources common to the BP635 image and at least one other image. We then used the ProjectiveTransform and warp routines in the Sci-Kit image transform module to perform a projective transformation on the image coordinates to align the other images to the BP635 image while maintaining the original range of pixel values. This corrected for the lack of simultaneity in image capture and differences in the camera pointing direction, rotation, and lens focal length. Figure 3 shows a false color image created using the BP735, BP635, and BP540 images. The image alignment appears to be accurate.
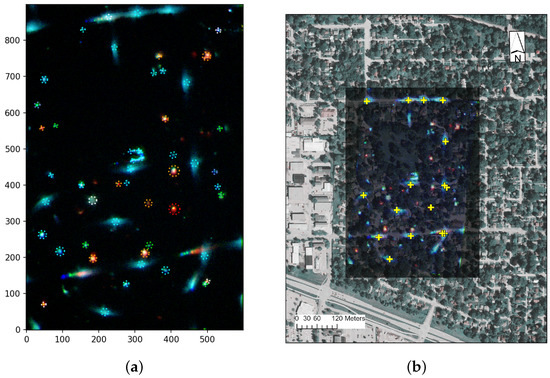
Figure 3.
(a) False-color image created using three of the four filter bands. Red represents the BP735 filter, green is BP635, and blue is BP540. The circles indicate the selected light sources and regions used to extract the signal for each source. The fire is at (410,334) and appears yellow-orange. The surrounding circle is red. The axes indicate pixel position after image alignment. (b) Overlay of night false color image on a daytime 2021 USDA National Agriculture Imagery Program 4-band aerial photograph. Yellow crosses are the GPS positions of street lamps used for georeferencing.
2.3. Geolocation and Ground Validation
After alignment, we geolocated the combined image. To do this, we identified street lights in the images that are marked with yellow crosses in panel (b) of Figure 3. We measured the GPS coordinates of the street lamps to use as georeferencing fixed points [24]. We then overlaid the night image with a daytime image as shown in the figure. The accuracy of the alignment is demonstrated by the good registration between features visible in both the night and day images. The accuracy is limited by the size of the light pools under the street lights.
Geolocation enabled ground validation based on a subsequent in-person survey of the neighborhood covered in the images. The position of the fire marked with a red circle in Figure 3 matches the measured coordinates of the fire. The other light sources were identified as artificial light sources of various types used in residential settings. We note that there are a few cases where the blue/green/red components appear to be shifted. These occur along the streets near the top and bottom of the image. There are no stationary sources at these locations; they are likely moving automobiles with the spatial shifts arising because the different images were not obtained simultaneously.
3. Results
We manually selected a variety of different types of light sources as marked on Figure 3a with dotted circles. For the compact light sources, we defined circular regions that fully capture the source. For extended sources, mainly the upwards reflection of street lights, we used circles that capture the brightest part. The regions have radii of at least 5.4 pixels.
We extracted the pixel values within each region for each filter image. The signal for each source for each filter was calculated by finding the average pixel value and then subtracting the background level. We used nine background regions, each with a radius of 18.3 pixels, placed in dark areas spread across the image to define the background level for each filter. The variations in the background levels have a standard deviation of 1.2% of the median signal level for the BP540 image and less than 0.6% for the other filters.
To analyze the spectral variations between the sources, we use ratios of the signal in different filter bands. Specifically, we use the ratio (BP735/BP635) of the signal in the BP735 image to that in the BP635 image and the ratio (BP470/BP540) of signal in the BP470 image to that in the BP540 image. We calculate errors on the signal levels and hence the ratios from the signal Poisson statistics and including the uncertainty in the background level.
Figure 4 panel a shows the distribution of band ratios for the various light sources. The wood-burning fire is marked with a red circle. The fire has the highest BP735/BP635 ratio which lies significantly above all of the other light sources. This is due to the strong emission at the potassium line.
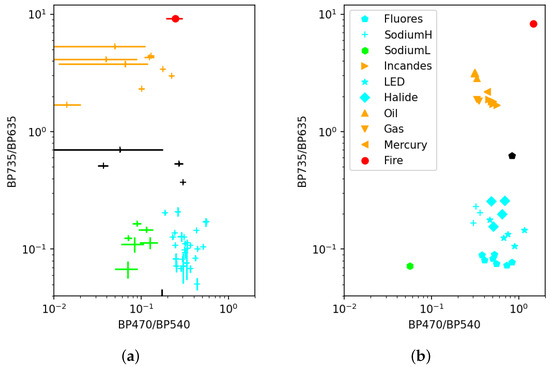
Figure 4.
(a) Scatter plot of band ratios from measurements for light sources selected in Figure 3. The fire is denoted as a red circle and is well separated from the other light sources. The symbol colors indicate approximate grouping of the sources on the diagram. The same colors are used in Figure 3 for the dotted circles that enclose the corresponding light sources. Black is used for sources not assigned to a group. Note that both axes use logarithmic scales. (b) Band ratios using spectra of artificial light sources from [20]. The symbol shapes indicate the light source type from [20] as indicated in the legend. The red circle is the band ratio calculated from the fire spectrum in Figure 1. The fire is well separated from the artificial light sources.
The light sources appear to form into groups in the band ratio diagram. The symbol colors in Figure 4 indicate our preliminary manually assigned groupings. To enable some initial classification of the light sources, the circles used to mark the sources in the RGB image in Figure 3 use the same colors. Some light sources are not included in groups; these are black in Figure 4 and with white circles in Figure 3. The street lights present all fall into the cyan group. They are LED street lights, in the ATB0 series from American Electric Lighting. One street light (at 229, 865) lies out of the grouping and appears to contaminated by lights from a nearby automobile.
For comparison, we calculated band ratios for artificial light sources using the spectra in [20] and including both the filter transmission and sensor quantum efficiency. These are shown in panel b of Figure 4. The fire is well separated from all of the artificial light sources. The BP735 has 8% transmission at 809 nm, but this appears to be low enough to adequately suppress the sodium line produced by high-pressure sodium lamps based on the clear separation in panel b of Figure 4. The value of the BP735/BP635 ratio for the fire is very similar to that in the flight data.
The artificial light sources are colored using the same scheme as for the flight data. The orange cluster contains incandescent, quart halogen, mercury vapor, liquid oil, and pressurized gas lamps. The cyan cluster contains fluorescent, high-pressure sodium, white LED, and metal halide lamps. One fluorescent lamp spectrum lies above the cyan cluster. Low-pressure sodium is the lime-colored hexagon. The BP470/BP540 ratio for many of the sources, including the fire, is lower in the flight data. There are also small shifts in the BP735/BP635 ratios. The spectra are measured using direct light, while the aircraft camera sees mainly reflected light. This may account for the shifts in the band ratios between the two plots.
4. Discussion
We conclude that multiband VIS/NIR imaging can be effective for the detection of fire in the flaming phase. The fire spectrum is sufficiently different from that of artificial light sources that it can be robustly identified even with the very crude spectral information provided by a few relatively broad bands. Indeed, use of only two bands, the BP735 and BP635 appears to provide good discrimination.
The low mass, volume, and power required for the VIS/NIR multi-band imaging system makes it feasible to fly on an unmanned aerial system (UAS). One potential application would be to employ a VIS/NIR imager on a High-Altitude Long-Endurance (HALE) UAS to provide information on active burning in wildfires to assist in fire management. For example, the Swift HALE can fly 5 kg payloads at an altitude of 20 km for 30 days or more at a speed of 25 m s−1 [25]. The high altitude, in the “upper Class E” airspace, avoids interference with fire suppression aircraft enabling continuous monitoring. The VIS/NIR imager can be accommodated on a HALE-UAS due to its low mass (2 kg), compact size (5000 cm3), and low power consumption (22 W). The HALE-UAS payload constraints would preclude flight of an IR imaging system with significantly larger mass, volume, and power requirements.
The VIS/NIR imager also offers significantly higher pixel counts than typical in IR imaging systems. The ground pixel size should be matched to the fire depth, the dimension of the flaming regions transverse to the fire line, which is typically about 2–3 m [8,9]. We adopt a ground resolution of 2 m. Use of a high-pixel-count sensor would enable coverage of a wide ground swath. E.g., the Sony IMX264 has 5.1 megapixels arranged as 2464 × 2056 that would allow coverage of a 4.9 km wide swath with 2 m pixels. At a speed of 25 m/s, an area of 440 km2 could be covered in one hour of flight. Hence, even large fires, such as the 2022 Hermit’s Peak fire in New Mexico, USA, could be covered in a single night. Smaller fires or selected areas of larger fires could be covered in the one or two hours before dawn, providing up-to-date maps of the flaming regions.
To be useful in guiding fire suppression activities, the VIS/NIR imager data must be accessed and processed in near real time. This would require real-time telemetry from the UAS. Combined with an on-board GPS and attitude and heading reference system, it would then be possible to provide georeferenced maps of active burning fronts. This would enable activities such as hot spotting to suppress the most active regions of the fire and could help maintain the safety of fire camps during the night.
Further study is required on the effect of clouds and smoke on detection of the potassium line from fires. Clouds can prevent fire detection in nearly all VIS/IR bands. The first step in MWIR fire detection algorithms is usually removal of pixels marked as cloudy. Addition of visible light to IR fire detection may actually offer some advantage as fire light can transmit through thin clouds. Fire can be detected in thin cloud conditions at night by combining the VIIRS DNB and IR data [26]. Smoke particles can more strongly attenuate radiation at 770 nm than at 4 μm, which needs to be further studied in the context of fire detection. However, our experience with VIIRS DNB at night has clearly shown that the smoke impact on fire light transmission is minimal for detecting flaming fires [10]. The reason is that the flaming fires at the fire front typically emit far fewer smoke particles than the smoldering fires behind the fire front. Flaming often occurs above the surface, on the top of the canopy, where oxygen (O2) supply is more sufficient making it easier for flaming to occur. As a result, flaming often occurs above the surface smoke layer. Once covered by smoke, flaming is quickly suppressed and changes to smoldering. Therefore, while smoke particles may affect the light radiative transfer, the impact is not as great as one would think if the fire light were under the thick smoke plume; in such conditions, the supply of O2 is reduced and smoldering occurs. We also note that [17] presents a clear detection of the potassium line from a completely smoke-covered pixel.
Beyond our main focus on fire light detection, we also wish to use such instruments to explore the possible use of low light optical/NIR remote sensing for environmental studies. Potential applications including mapping the growth of urban areas [27], monitoring the impact of natural disasters and conflicts on human activity, and measuring particulate matter air quality [28]. Classification of different types of artificial lights is key to such studies. Wang et al. [28] showed the modern artificial light spectrum has avoided the water vapor absorption lines (for the sake of energy efficiency), and hence, measuring light intensity over cities can be used to study surface particulate matter air quality at night, as long as the fire pixel detection and classification of bulb types can be made, which shows promise in this concept paper. In the future, we plan to further develop our methodology for light source classification. We will obtain ground spectra of selected light sources and identify their type for comparison with the band ratios measured in flight. We will test more sophisticated classification techniques such as discriminant analysis [20].
Author Contributions
Conceptualization, P.K. and J.W.; methodology, P.K. and J.W.; software, S.T., C.M.P. and P.K.; validation, S.T. and P.K.; formal analysis, P.K.; investigation, S.T., T.S., C.H.R., C.M.P. and M.Z.; writing—original draft preparation, P.K.; writing—review and editing, J.W., M.L., C.A.F. and C.M.P.; visualization, P.K. and M.L.; funding acquisition, P.K., J.W. and T.S. All authors have read and agreed to the published version of the manuscript.
Funding
This study was supported in part by Public-Private Partnership (P3) program of the University of Iowa, the NASA’s Terra, Aqua, and SNPP program (grant 80NNSC21L1976), and by NASA’s Modeling and Analysis Program (MAP, grant 80NSSC21K1494). M.Z. acknowledges the support of Future Investigators in NASA Earth and Space Science and Technology (FINESST) program (grant 80NSSC21K1628).
Data Availability Statement
The raw camera images and the code used for processing them is available upon request from the authors.
Acknowledgments
We thank Paul Roe of MidAmerican Energy Company for providing information regarding the street lights in our images. We thank three anonymous reviewers for comments that helped improve the manuscript.
Conflicts of Interest
The authors declare no conflict of interest. The funders had no role in the design of the study; in the collection, analyses, or interpretation of data; in the writing of the manuscript; or in the decision to publish the results.
Abbreviations
The following abbreviations are used in this manuscript:
| CMOS | Complementary Metal–Oxide–Semiconductor |
| DNB | Day-And-Night Band |
| FRP | Fire Radiative Power |
| GOES-R | Geostationary Operational Environmental Satellites—R |
| MODIS | Moderate Resolution Imaging Spectroradiometer |
| MWIR | Mid Wave Infra-Red band |
| NIR | Near Infra-Red |
| UAS | Unmanned Aerial System |
| VIIRS | Visible Infrared Imaging Radiometer Suite |
References
- Congressional Research Service, Wildfire Statistics. Available online: https://sgp.fas.org/crs/misc/IF10244.pdf (accessed on 10 September 2022).
- Balch, J.K.; Abatzoglou, J.T.; Joseph, M.B.; Koontz, M.J.; Mahood, A.l.; McGlinchy, J.; Cattau, M.E.; Williams, A.P. Warming weakens the night-time barrier to global fire. Nature 2022, 602, 442–448. [Google Scholar] [CrossRef] [PubMed]
- Freeborn, P.H.; Jolly, W.M.; Cochrane, M.A.; Roberts, G. Large wildfire driven increases in nighttime fire activity observed across CONUS from 2003–2020. Remote Sens. Environ. 2022, 268, 112777. [Google Scholar] [CrossRef]
- California Department of Forestry and Fire Protection, Caldor Fire incident update for 9/02/2021. Available online: https://www.fire.ca.gov/incidents/2021/8/14/caldor-fire/updates/353bafcd-3f3c-42f1-ad50-644a81cd1b5c/ (accessed on 10 September 2022).
- Dozier, J. A method for satellite identification of surface temperature fields of subpixel resolution. Remote Sens. Environ. 1981, 11, 221–229. [Google Scholar] [CrossRef]
- Wooster, M.J.; Roberts, G.J.; Giglio, L.; Roy, D.P.; Freeborn, P.H.; Boschetti, L.; Justice, C.; Ichoku, C.; Schroeder, W.; Davies, D.; et al. Satellite remote sensing of active fires: History and current status, applications and future requirements. Remote Sens. Environ. 2021, 267, 112694. [Google Scholar] [CrossRef]
- Schroeder, W.; Oliva, P.; Giglio, L.; Csiszar, I.A. The New VIIRS 375m active fire detection data product: Algorithm description and initial assessment. Remote Sens. Environ. 2020, 143, 85–96. [Google Scholar] [CrossRef]
- Alexander, M.E. Calculating and interpreting forest fire intensities. Can. J. Bot. 1982, 60, 349–357. [Google Scholar] [CrossRef]
- Rossi, L.; Molinier, T.; Pieri, A.; Akhloufi, M.; Tison, Y.; Bosseur, F. Measurement of the geometric characteristics of a fire front by stereovision techniques on field experiments. Meas. Sci. Technol. 2011, 2011, 125504. [Google Scholar] [CrossRef]
- Wang, J.; Roudini, S.; Hyer, E.J.; Xu, X.; Zhou, M.; Castro Garcia, L.; Reid, J.S.; Peterson, D.; Da Silva, A. Detecting nighttime fire combustion phase by hybrid application of visible and infrared radiation from Suomi NPP VIIRS. Remote Sens. Environ. 2020, 237, 111466. [Google Scholar] [CrossRef]
- Rein, G. Smouldering combustion phenomena in science and technology. Int. Rev. Chem. Eng. 2009, 1, 3–18. [Google Scholar]
- Torero, J.L.; Gerhard, J.I.; Martins, M.F.; Zanoni, M.A.B.; Rashwan, T.L.; Brown, J.K. Processes defining smouldering combustion: Integrated review and synthesis. Prog. Energy Combust. Sci. 2020, 81, 100869. [Google Scholar] [CrossRef]
- Vodacek, A.; Kremens, R.L.; Fordham, A.J.; VanGorden, S.C.; Luisi, D.; Schott, J.R. Remote optical detection of biomass burning using a potassium emission signature. Int. J. Remote Sens. 2002, 23, 2721–2726. [Google Scholar] [CrossRef]
- Amici, S.; Piscini, A. Exploring PRISMA Scene for Fire Detection: Case Study of 2019 Bushfires in Ben Halls Gap National Park, NSW, Australia. Remote Sens. 2021, 13, 1410. [Google Scholar] [CrossRef]
- Lillesaeter, O. Spectral reflectance of partly transmitting leaves: Laboratory measurements and mathematical modeling. Remote Sens. Environ. 1982, 12, 247–254. [Google Scholar] [CrossRef]
- Ononye, A.; Vodacek, A.; Kremens, R. Fire temperature retrieval using constrained spectral unmixing and emissivity estimation. In Algorithms and Technologies for Multispectral, Hyperspectral, and Ultraspectral Imagery XI; SPIE: Orlando, FL, USA, 2005. [Google Scholar] [CrossRef]
- Amici, S.; Wooster, M.J.; Piscini, A. Multi-resolution spectral analysis of wildfire potassium emission signatures using laboratory, airborne and spaceborne remote sensing. Remote Sens. Environ. 2011, 115, 1811–1823. [Google Scholar] [CrossRef]
- Balch, J.K.; Bradley, B.A.; Abatzoglou, J.T.; Nagy, R.C.; Fusco, E.J.; Mahood, A.L. Human-started wildfires expand the fire niche across the United States. Proc. Natl. Acad. Sci. USA 2017, 114, 2946–2951. [Google Scholar] [CrossRef] [PubMed]
- Radeloff, V.C.; Herlmers, D.P.; Kramer, H.A.; Mockrin, M.H.; Alexandre, P.M.; Bar-Massada, A.; Bustic, V.; Hawbacker, T.J.; Martinuzzi, S.; Syphard, A.D.; et al. Rapid growth of the US wildland-urban interface raises wildfire risk. Proc. Natl. Acad. Sci. USA 2018, 115, 3314–3319. [Google Scholar] [CrossRef]
- Elvidge, C.D.; Keitih, D.M.; Tuttle, B.T.; Baugh, K.E. Spectral Identification of Lighting Type and Character. Sensors 2010, 10, 3961–3988. [Google Scholar] [CrossRef]
- Cogan, D.; Griffith, D.J.; Magidimisha, E.; van Zyl, R. Flight hardware verification and validation of the K-line fire sensor payload on ZACube-2. Proc. SPIE 2019, 11043, 110431A. [Google Scholar]
- Magidimisha, E.; Griffith, D.J. Remote optical observations of actively burning biomass fires using potassium line spectral emission. Proc. SPIE 2016, 10036, 1003611. [Google Scholar]
- Lerner, R.M. Limitations in the Use of Dielectric Interference Filters in Wide Angle Optical Receivers. Appl. Opt. 1971, 10, 1914–1918. [Google Scholar] [CrossRef]
- Schwind, P.; Storch, T. Georeferencing Urban Nighttime Lights Imagery Using Street Network Maps. Remote Sens. 2022, 14, 2671. [Google Scholar] [CrossRef]
- NASA Small Business Innovation Research/Small Business Tech Transfer, Swift Ultra Long Endurance (SULE) Unmanned Air Vehicle (UAV), Phase 2E. Available online: https://techport.nasa.gov/view/103097 (accessed on 1 July 2022).
- Polivka, T.; Wang, J.; Ellison, L.; Hyer, E.; Ichoku, C. Improving Nocturnal Fire Detection with the VIIRS Day-Night Band. IEEE Trans. Geosci. Remote Sens. 2016, 9, 5503–5519. [Google Scholar] [CrossRef]
- Levin, N.; Kybac, C.C.M.; Zhange, Q.; Sánchez de Miguelf, A.; Románh, M.O.; Lii, X.; Portnovj, B.A.; Molthank, A.L.; Jechowc, A.; Miller, S.D.; et al. Remote sensing of night lights: A review and an outlook for the future. Remote Sens. Environ. 2020, 237, 111433. [Google Scholar] [CrossRef]
- Wang, J.; Aegerter, C.; Xu, X.; Szykman, J.J. Potential application of VIIRS Day/Night Band for monitoring nighttime surface PM2.5 air quality from space. Atmos. Environ. 2016, 124, 55–63. [Google Scholar] [CrossRef]


Publisher’s Note: MDPI stays neutral with regard to jurisdictional claims in published maps and institutional affiliations. |
© 2022 by the authors. Licensee MDPI, Basel, Switzerland. This article is an open access article distributed under the terms and conditions of the Creative Commons Attribution (CC BY) license (https://creativecommons.org/licenses/by/4.0/).