Towards an Improved Large-Scale Gridded Population Dataset: A Pan-European Study on the Integration of 3D Settlement Data into Population Modelling
Abstract
:1. Introduction
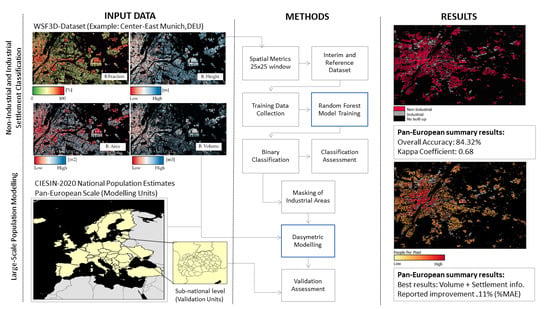
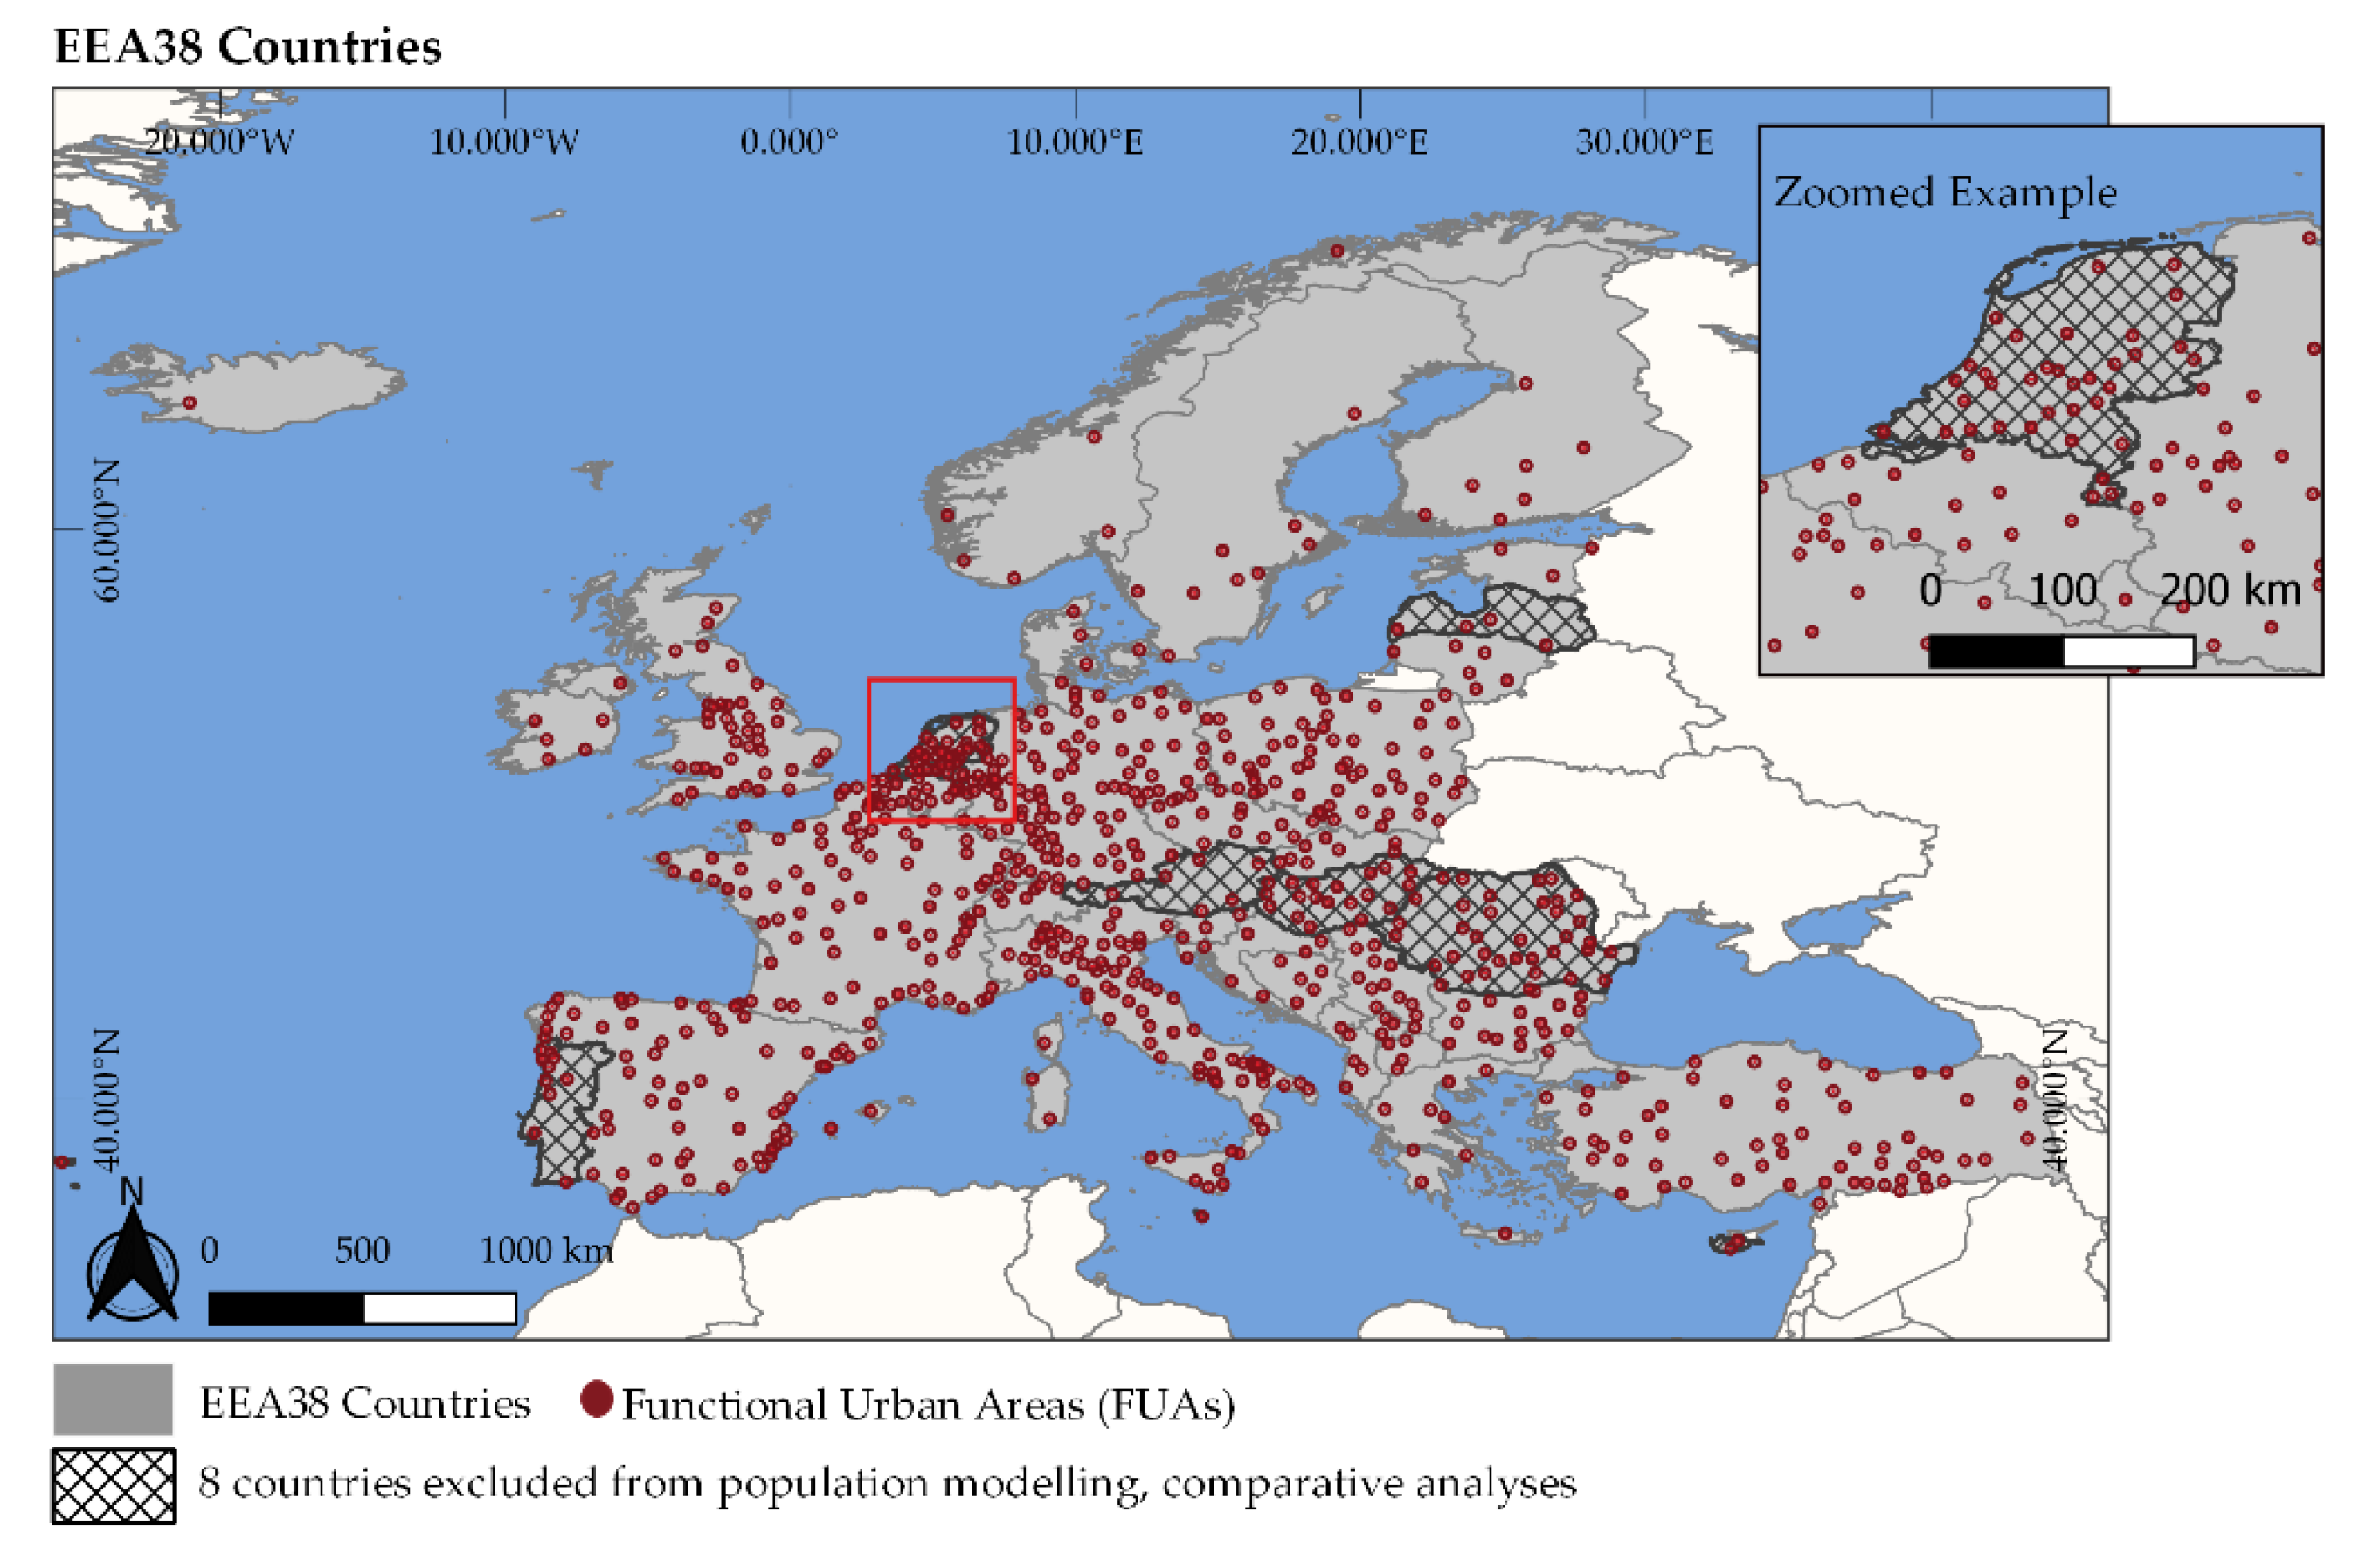
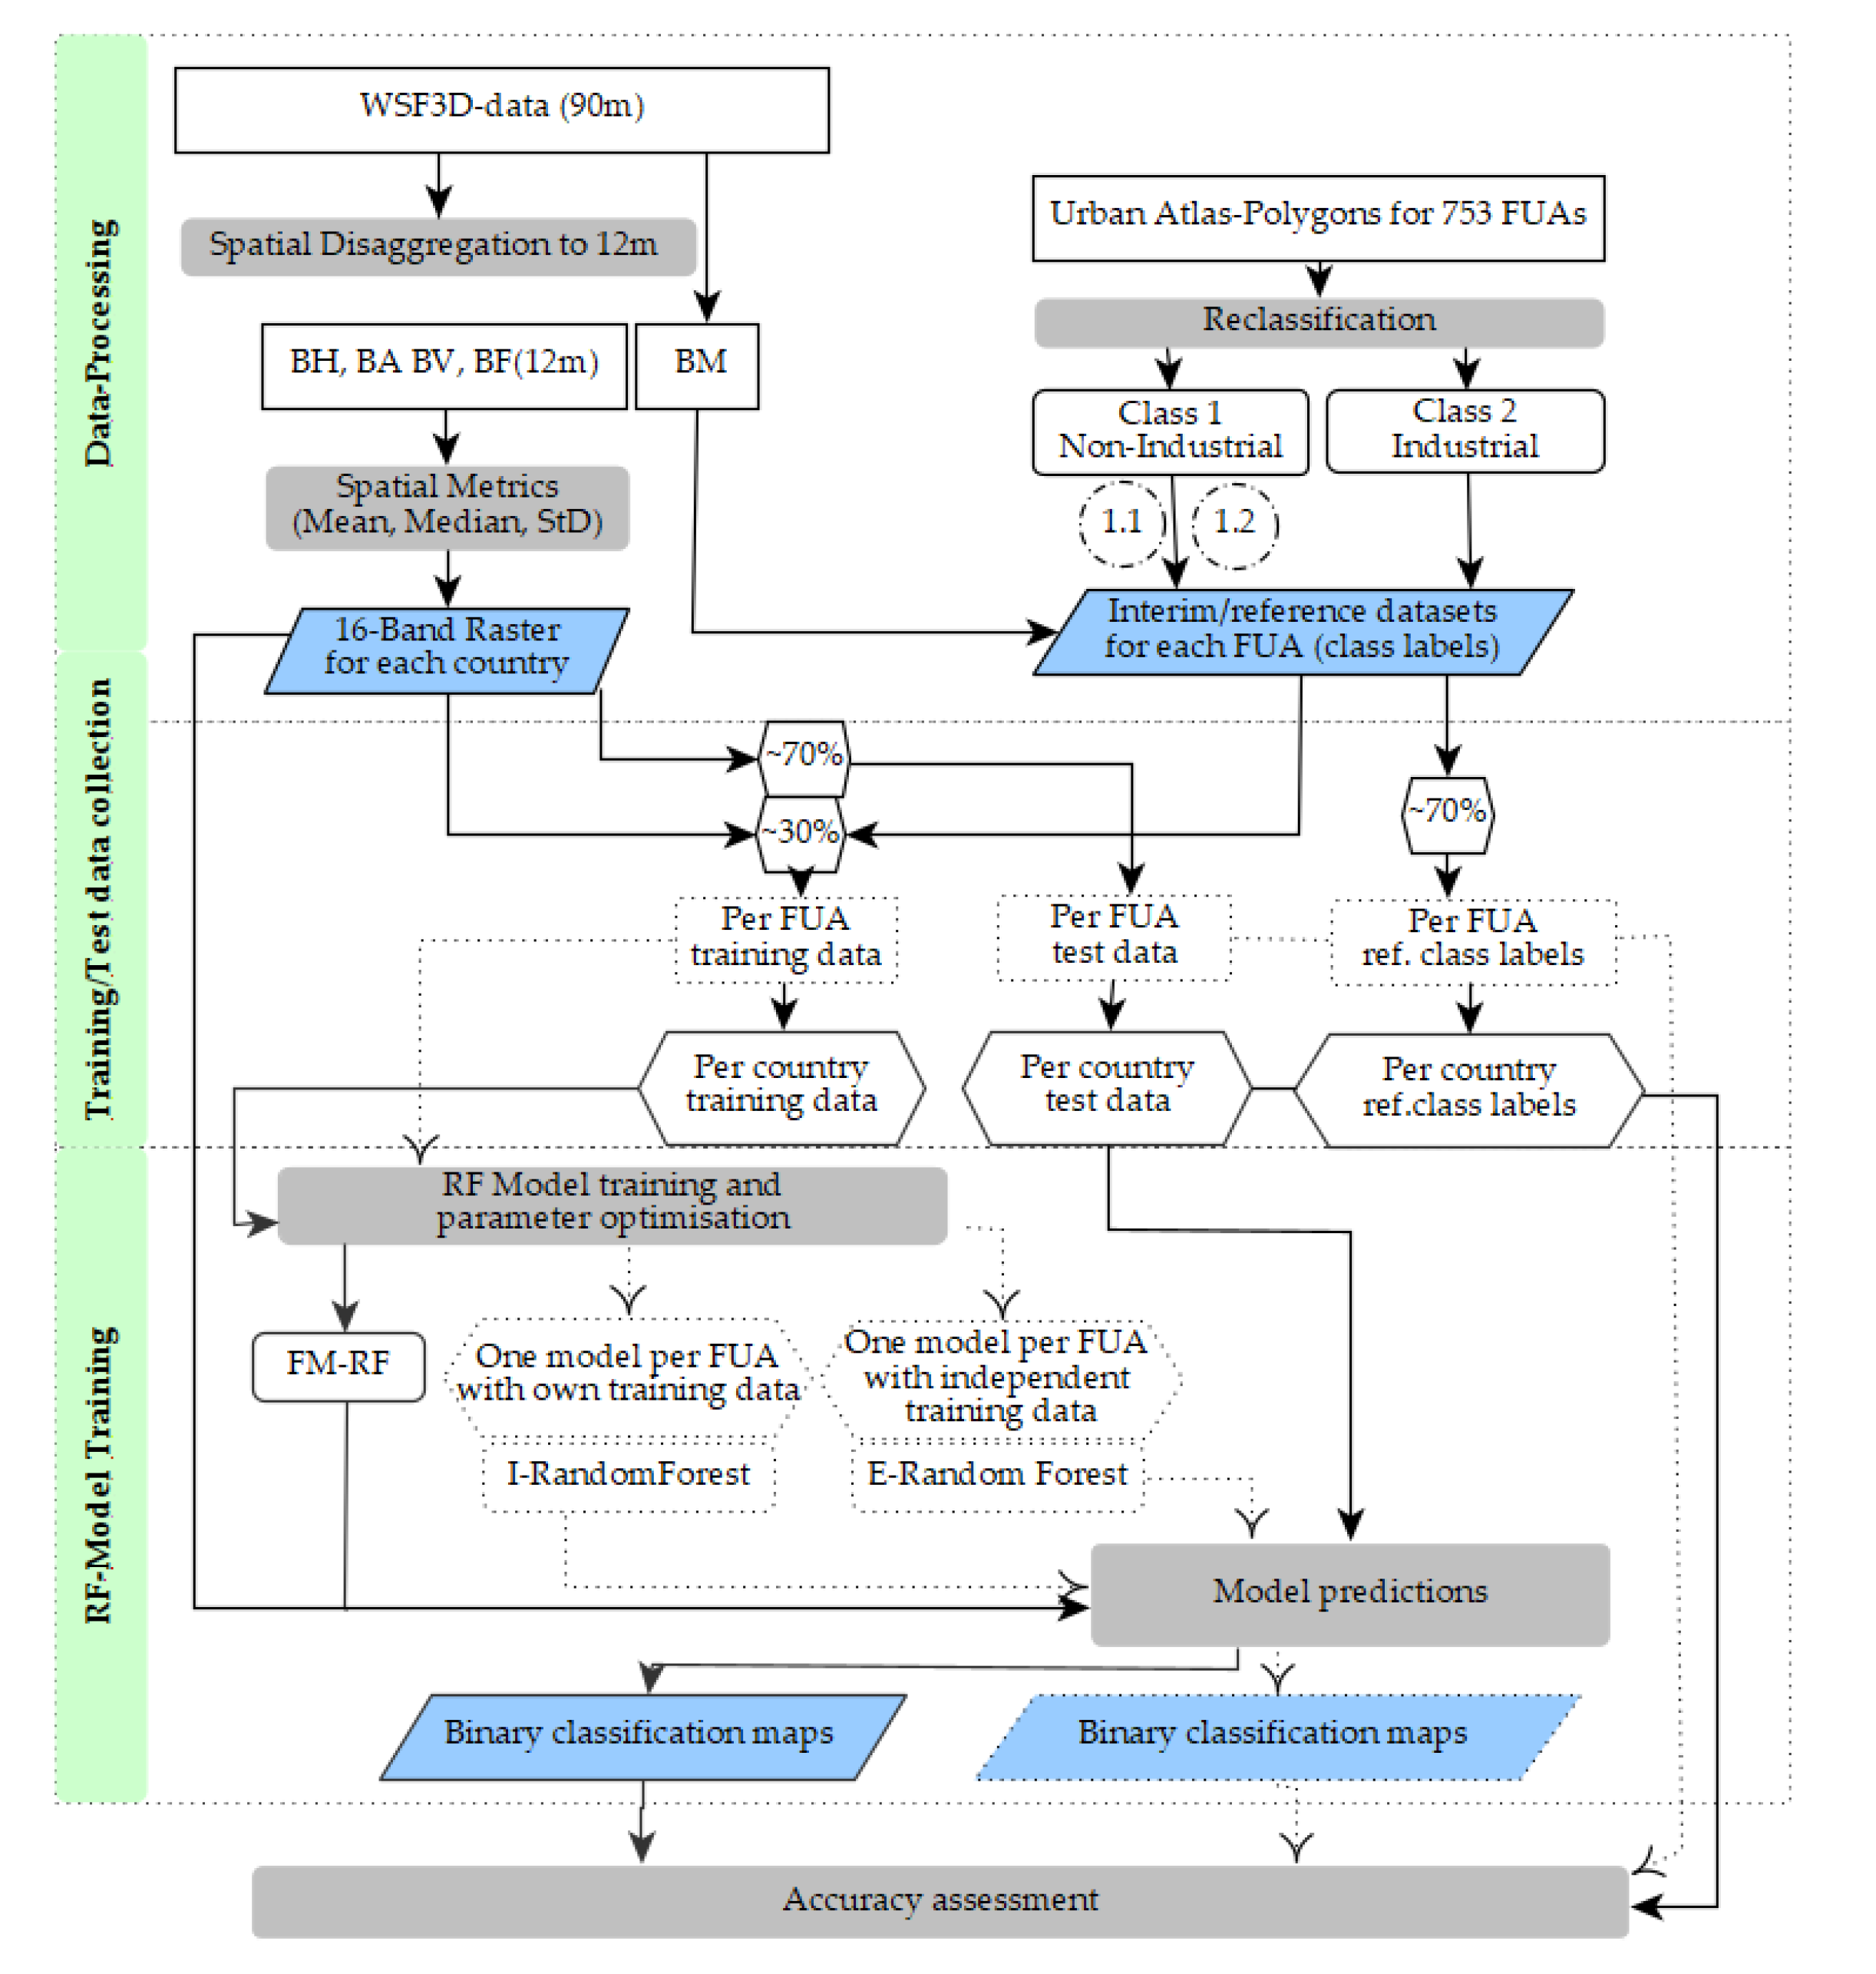
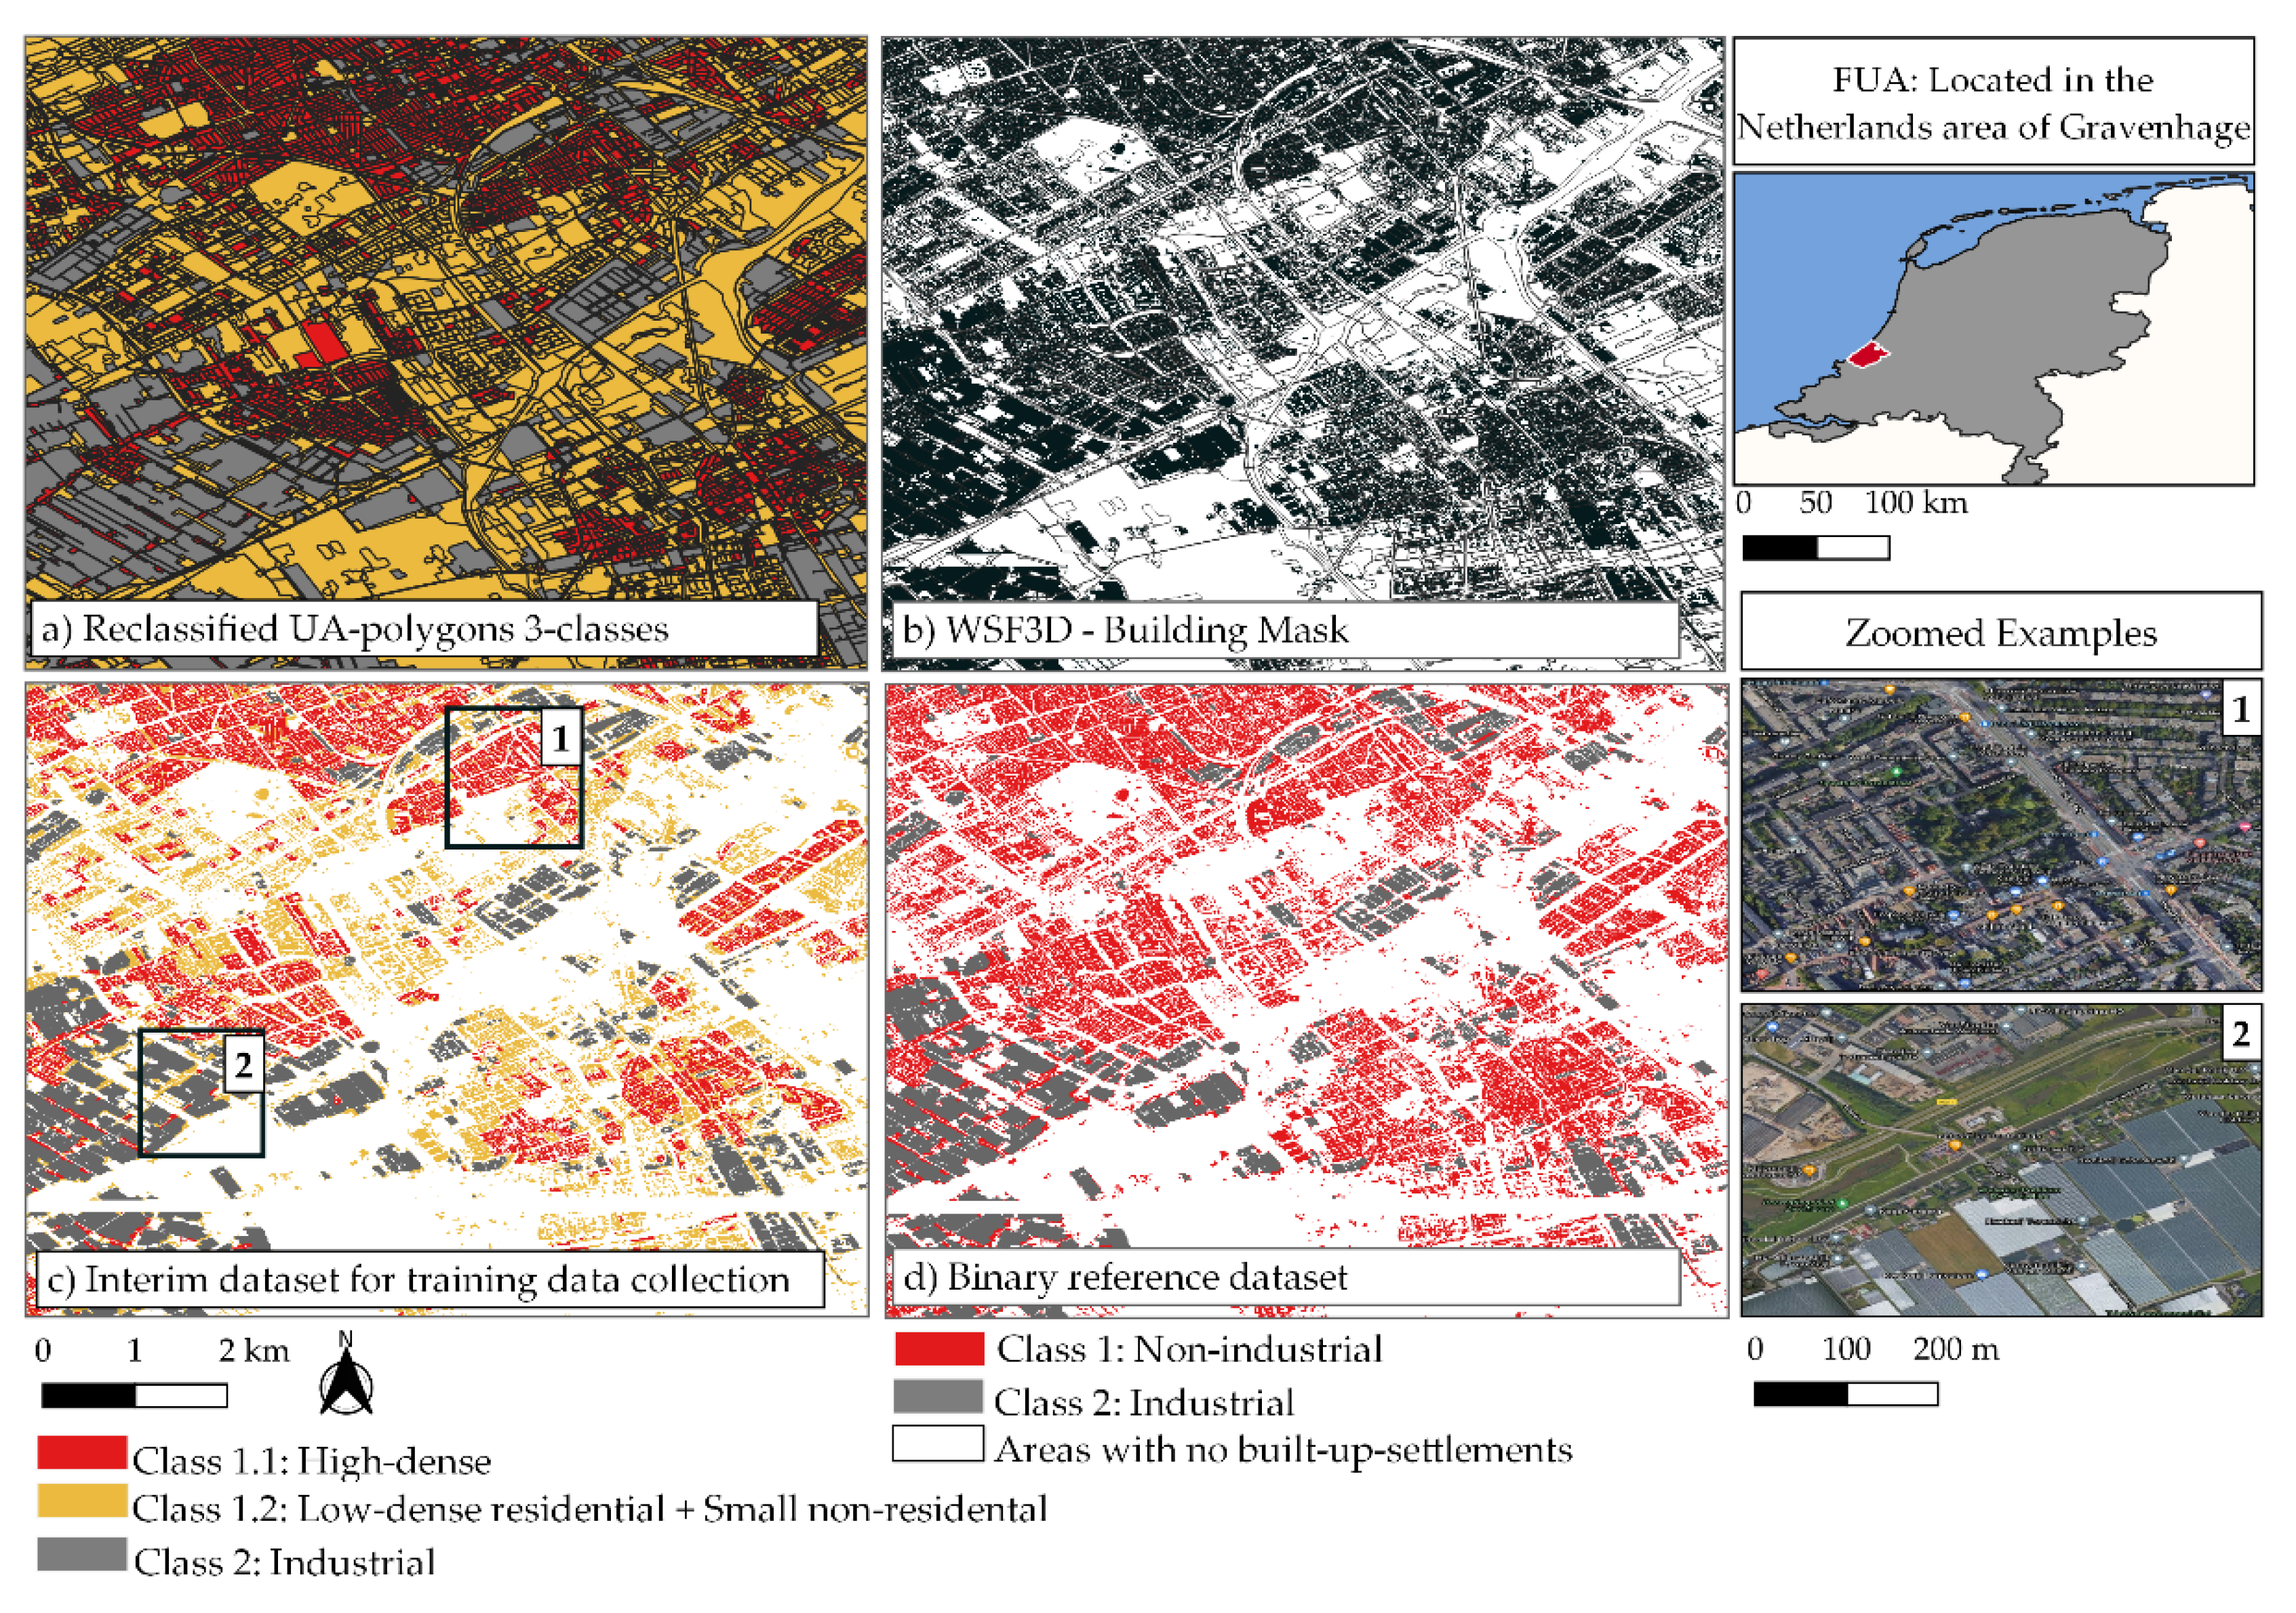
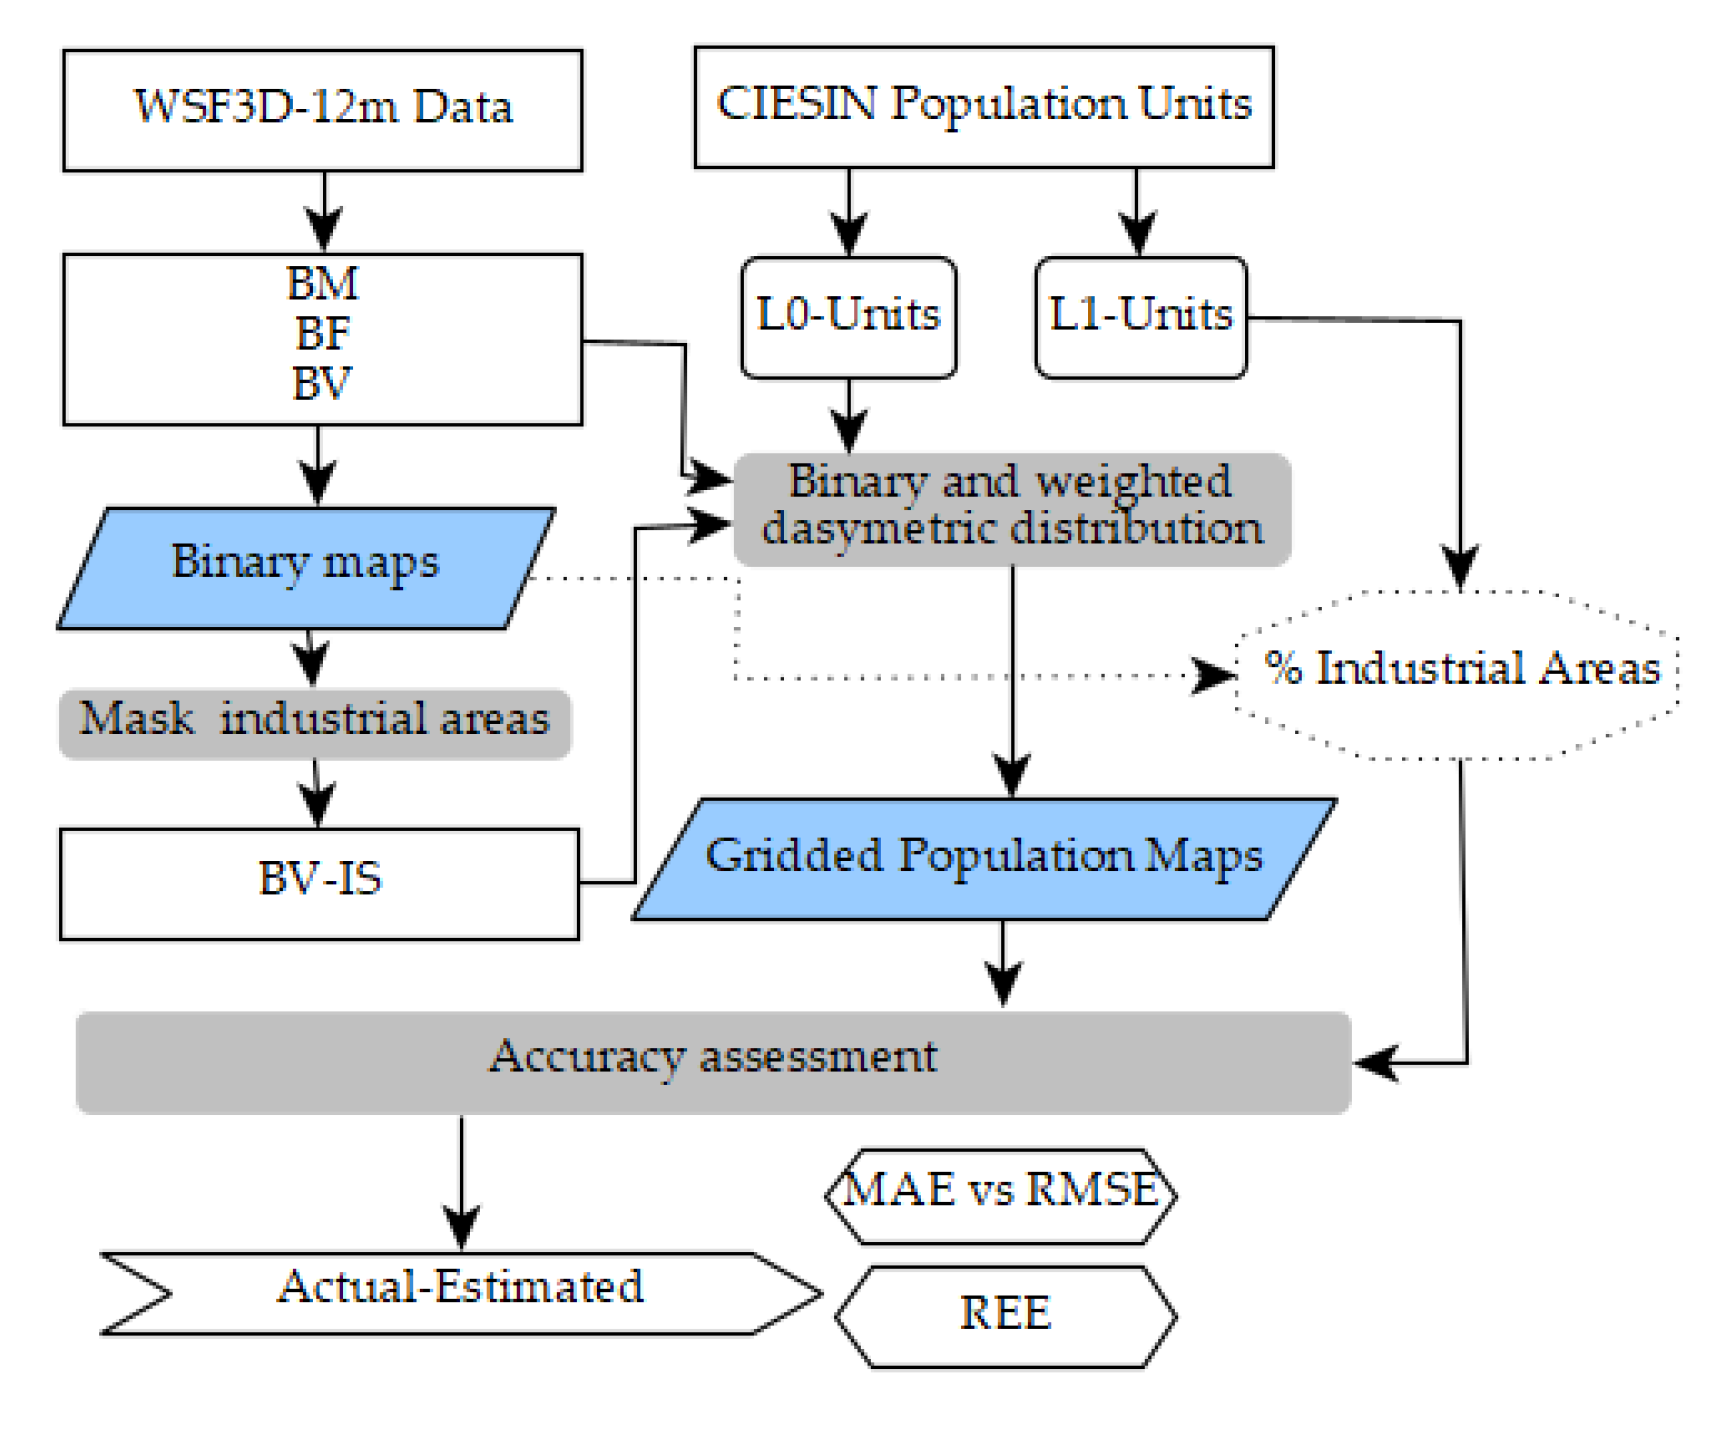
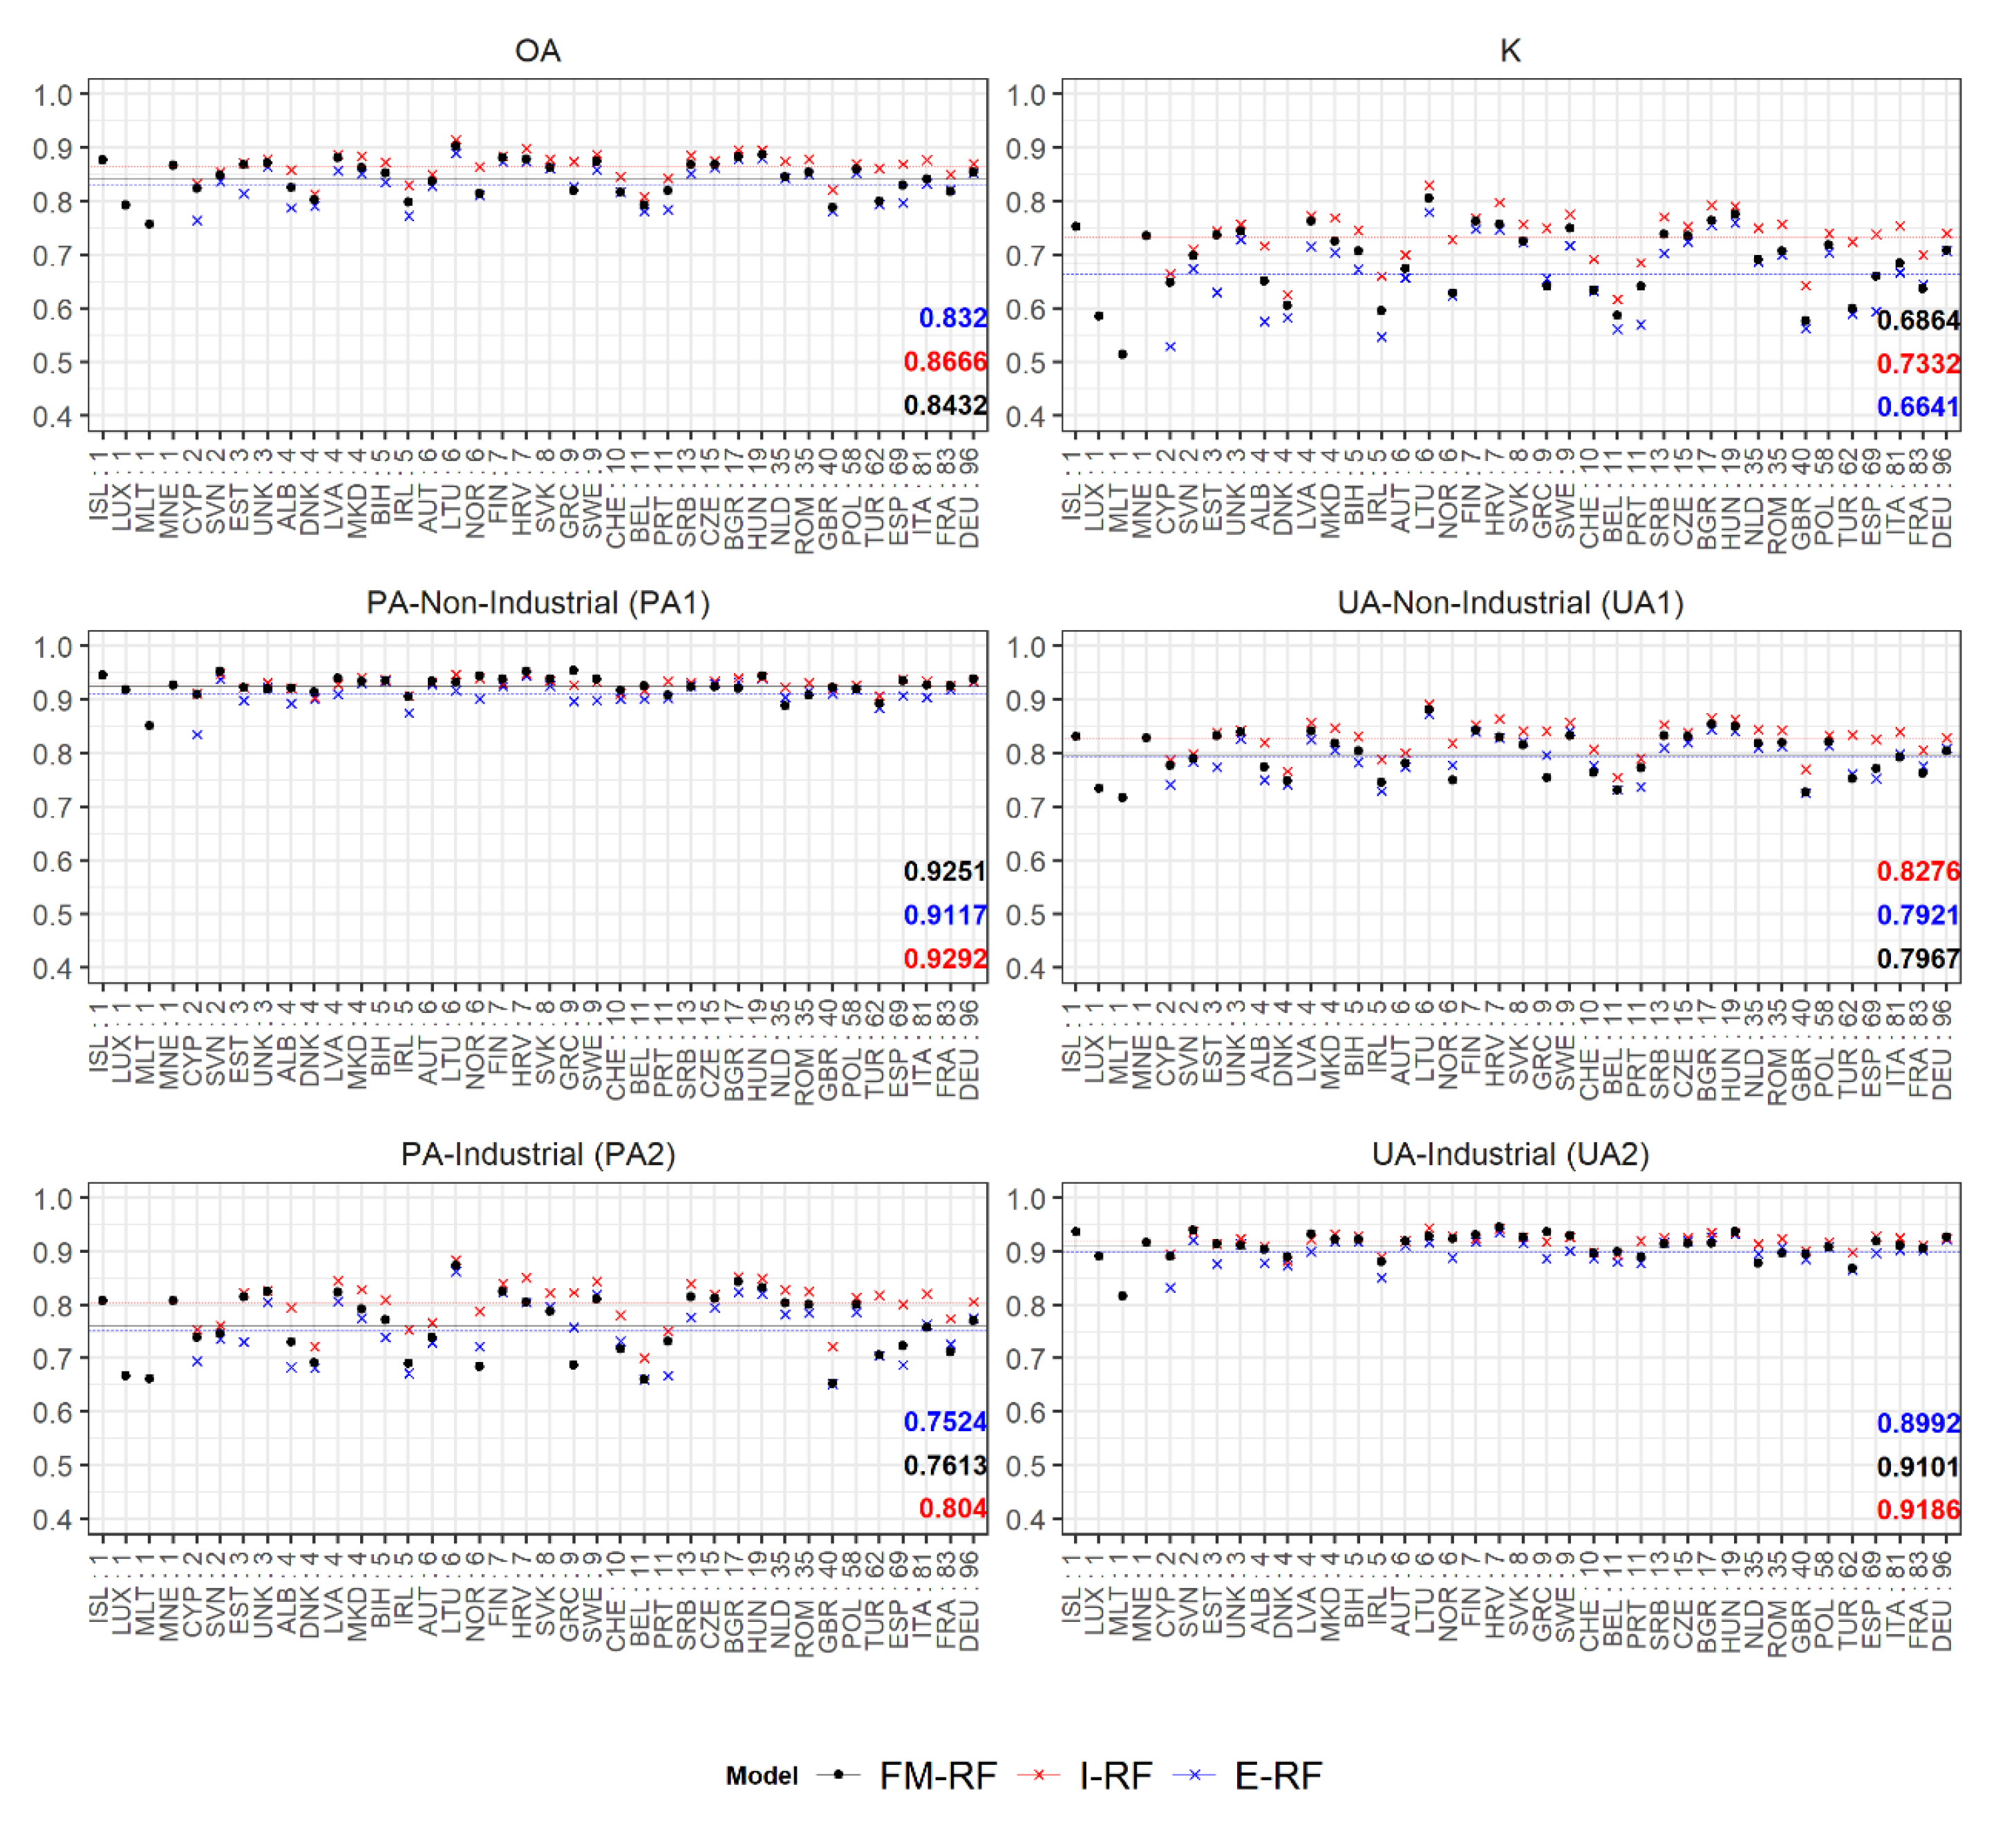
- In the first step, we investigate if the WSF3D dataset can be used to effectively identify and eliminate large industrial/commercial areas from the built-up environment, which in the past have been reported as major sources of under/overestimation errors in population modelling. To this end, we present a methodology that combines a Random Forest algorithm with a set of spatial metrics derived solely from the WSF3D dataset to predict the “Industrial” versus “Non-Industrial” class of built-up settlements across 38 countries located in Europe. Reference datasets to collect training data and validate our classification results are produced using the Urban Atlas 2018 dataset. Overall, the main objectives of this part of the research are to build an automatic classification model for each country, and to produce binary classification maps that can be used to refine population distribution datasets.
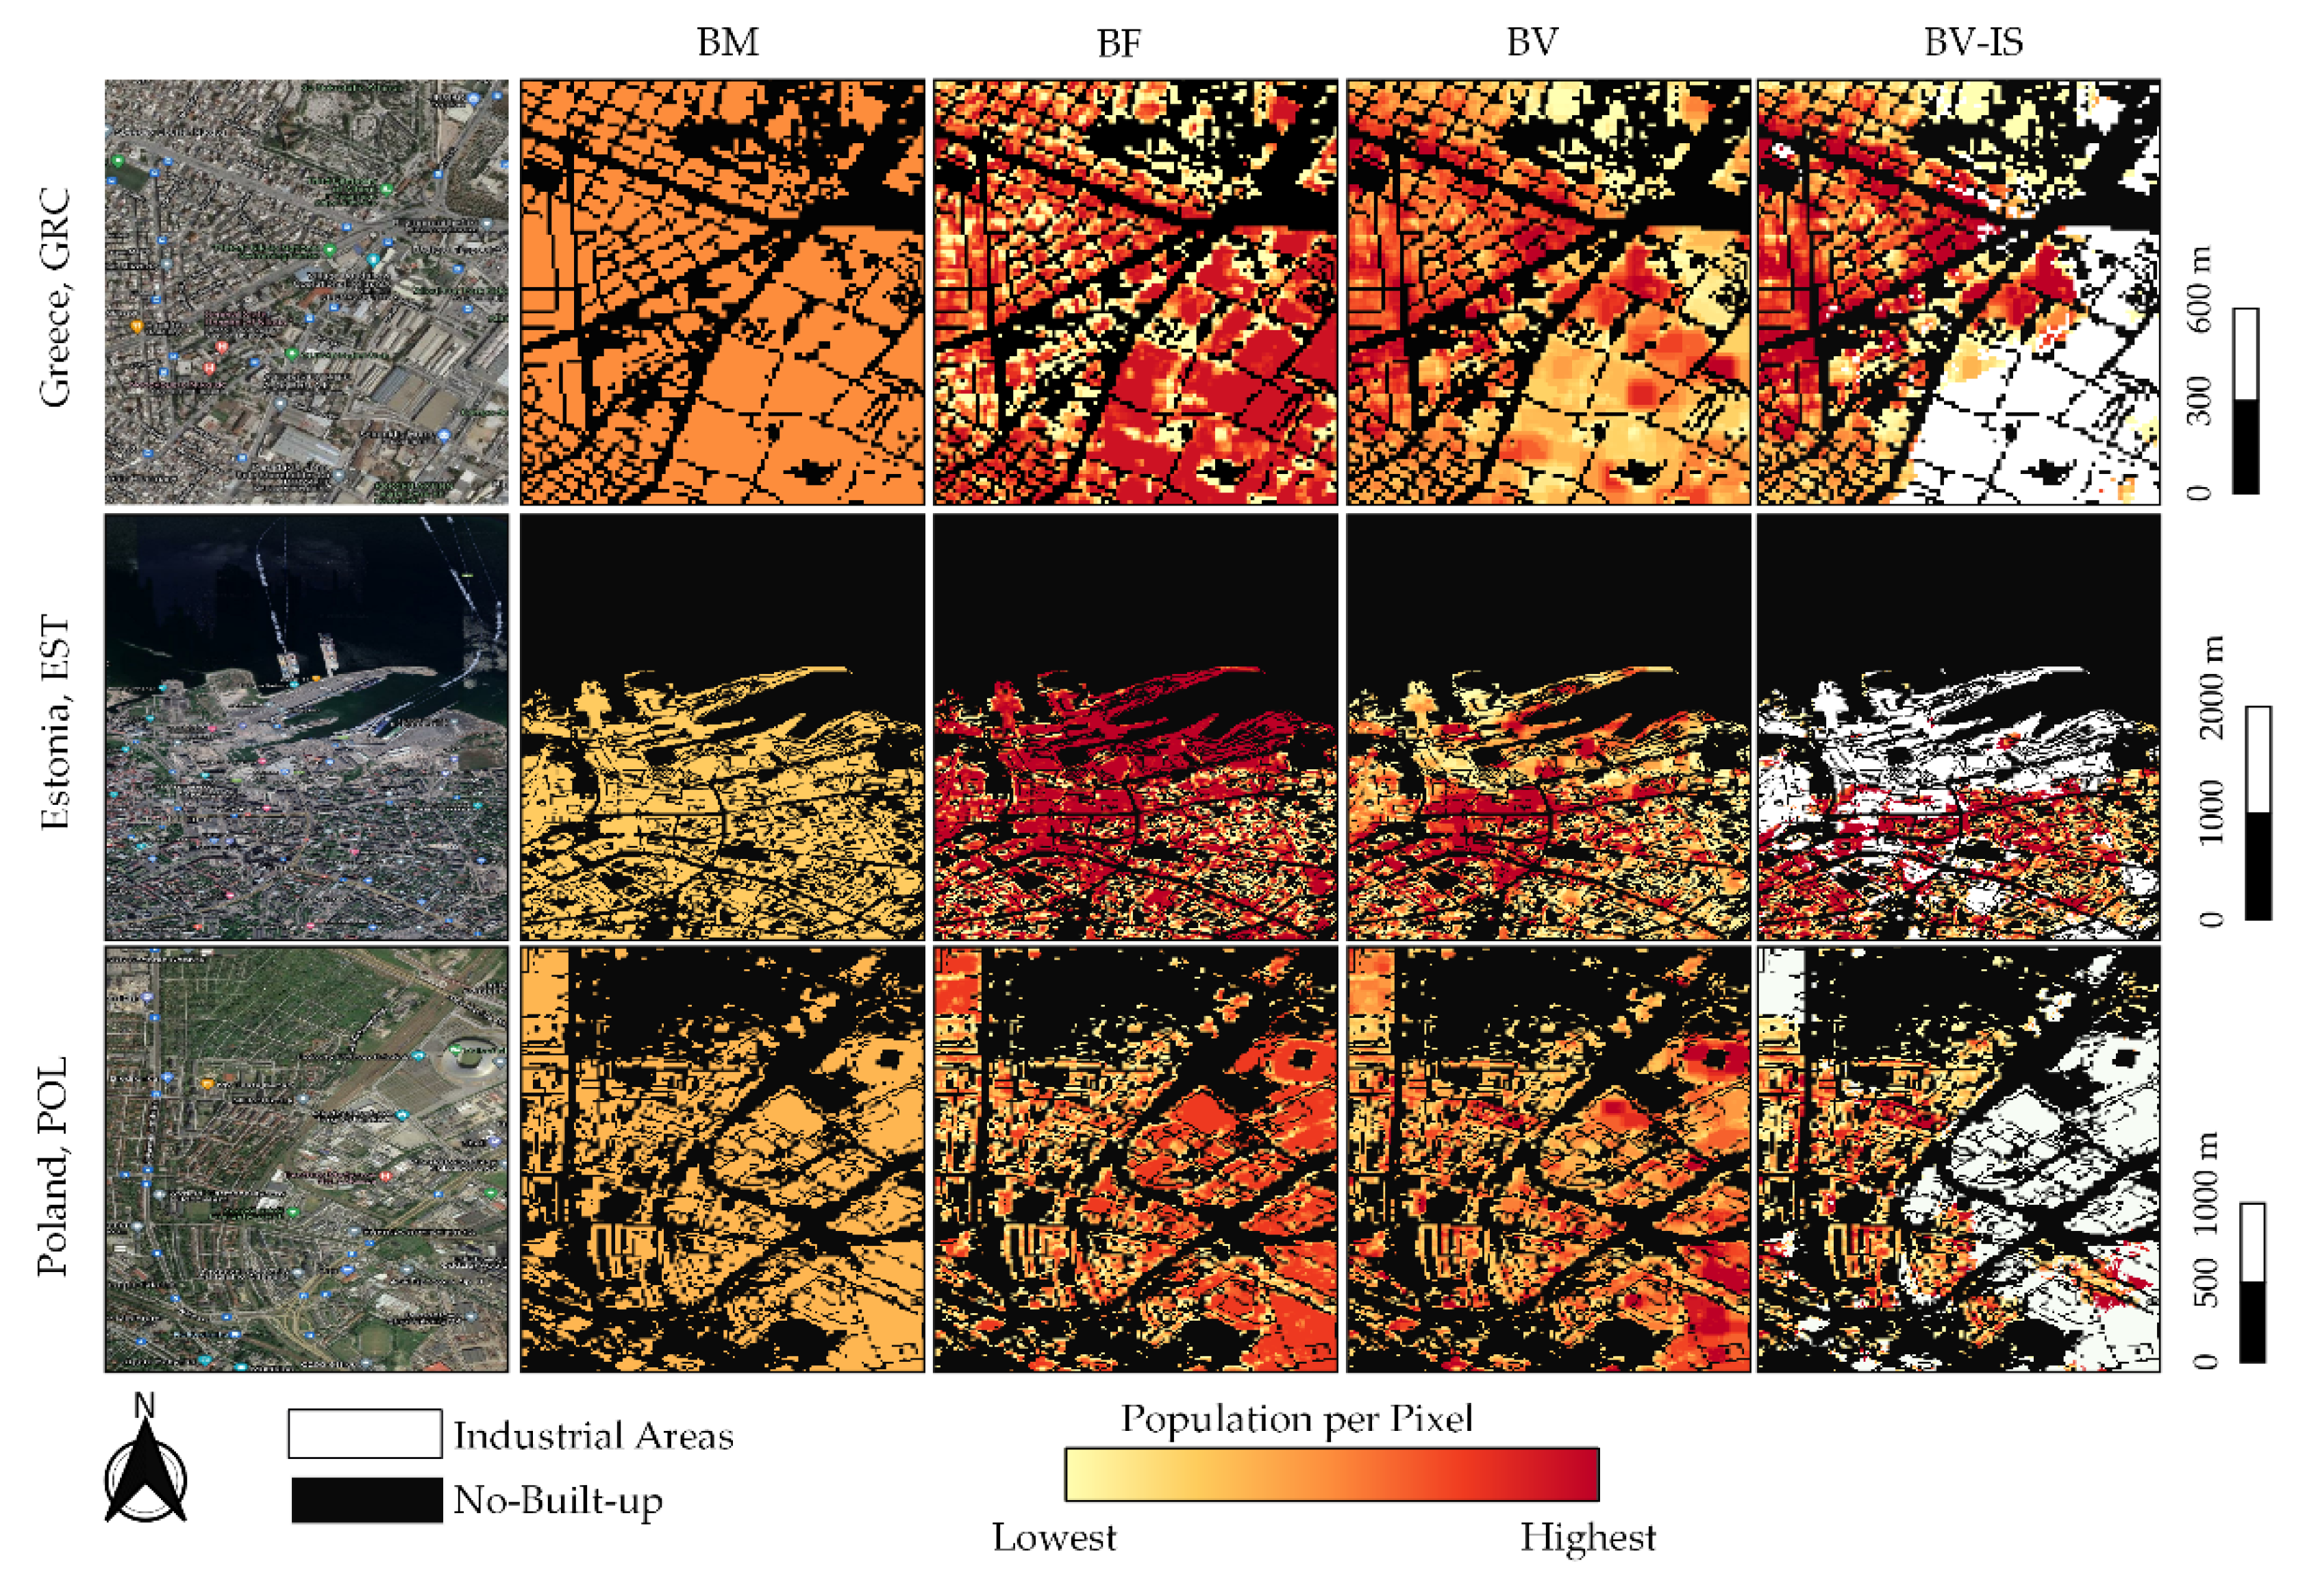
- In the second step, we evaluate the accuracy of population distribution maps produced on the basis of the new WSF3D data and the integration of information on industrial/non-industrial land use from step 1. For this assessment, we specifically employ the information of the WSF3D building fraction (BF) and building volume (BV) layers, downscaled to 12 m (see Section 2.2), to generate population distribution maps using a weighted dasymetric mapping approach together with 2020 census-derived population data. We then compared the outcomes to the results achieved with a binary settlement mask as input. Overall, the main objectives of this part of the research are to investigate if improvements can be gained from the inclusion of settlement information related to the use and/or volume of building structures, and to assess under which circumstances these improvements are more significative, and how they correlate with the quality of our classification maps.
2. Materials and Methods
2.1. Study Area
2.2. World Settlement Footprint 3D Dataset
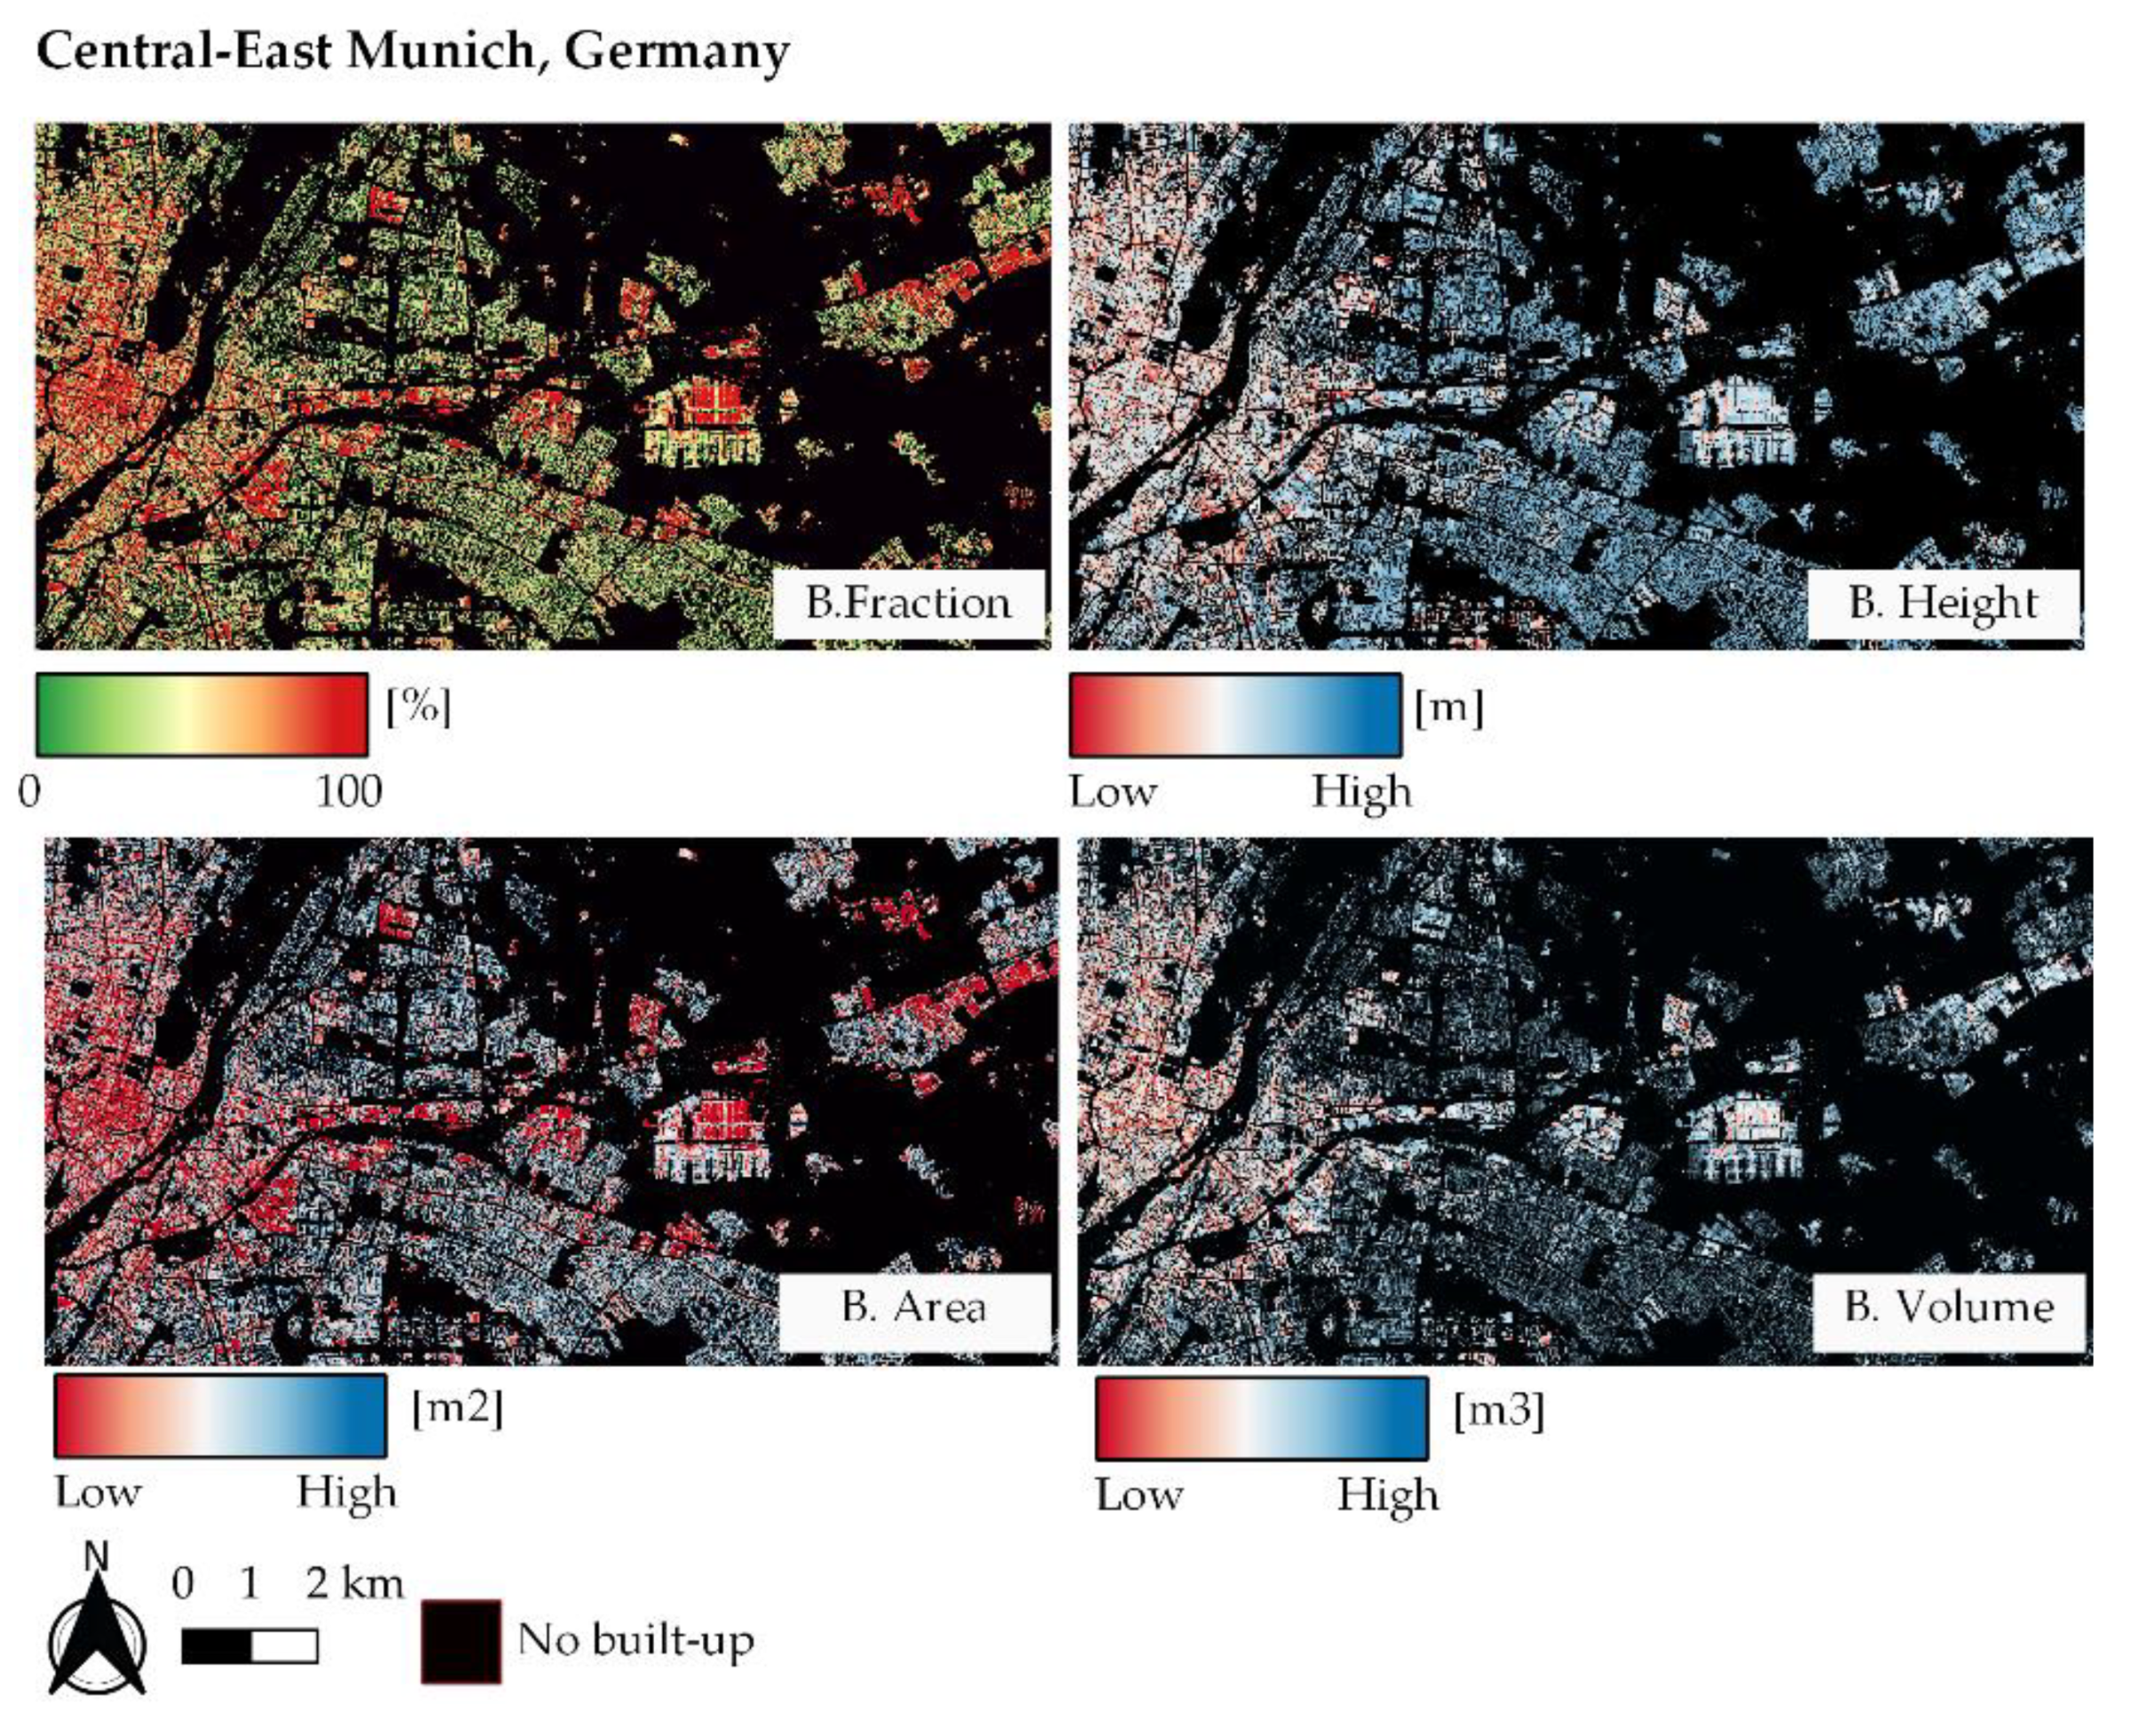
- Building Height (BH): The 12 m BH layer represents a spatial disaggregation of the standard 90 m WSF3D BH layer, which was derived by measuring the height variations of vertical edges related to building edges (BE) in the 12 m TDX-DEM within the settlement areas defined by the WSF-Imp layer. The height is reported in meters (m) in the final product.
- Building Fraction (BF): This layer was produced by quantifying the built-up coverage at 12 m derived from the joint analysis of the WSF-Imp, TDX-AMP and BE. The values in the final product range from 0–100, measured in percentage.
- Building Area (BA): This layer was derived by multiplying the BF times the area of each ~12 m grid cell (~144 m2 at the equator). The area is reported in square meters (m2) in the final product.
- Building Volume (BV): This layer was derived by multiplying the BH with the area of the 12 m pixels. The total volume is expressed in cubic meters (m3) in the final product.
- Building Mask (BM): This layer represents the binary version of the BF layer, where all pixels PIS > 0 have been converted to values of 1.
2.3. European Urban Atlas Datazset
2.4. Population Data and Administrative Boundaries for 2020
2.5. Industrial and Non-Industrial Classification of Built-Up Settlements Using Random Forest
2.5.1. Derivation of Spatial Metrics
2.5.2. Interim and Reference Datasets
2.5.3. Automatic Training Data Collection
2.5.4. Model Training
2.5.5. Quantitative Accuracy Assessment
2.6. Population Modelling and Comparative Analyses
2.6.1. Top-Down Dasymetric Modelling
2.6.2. Quantitative Accuracy Assessment
- (i)
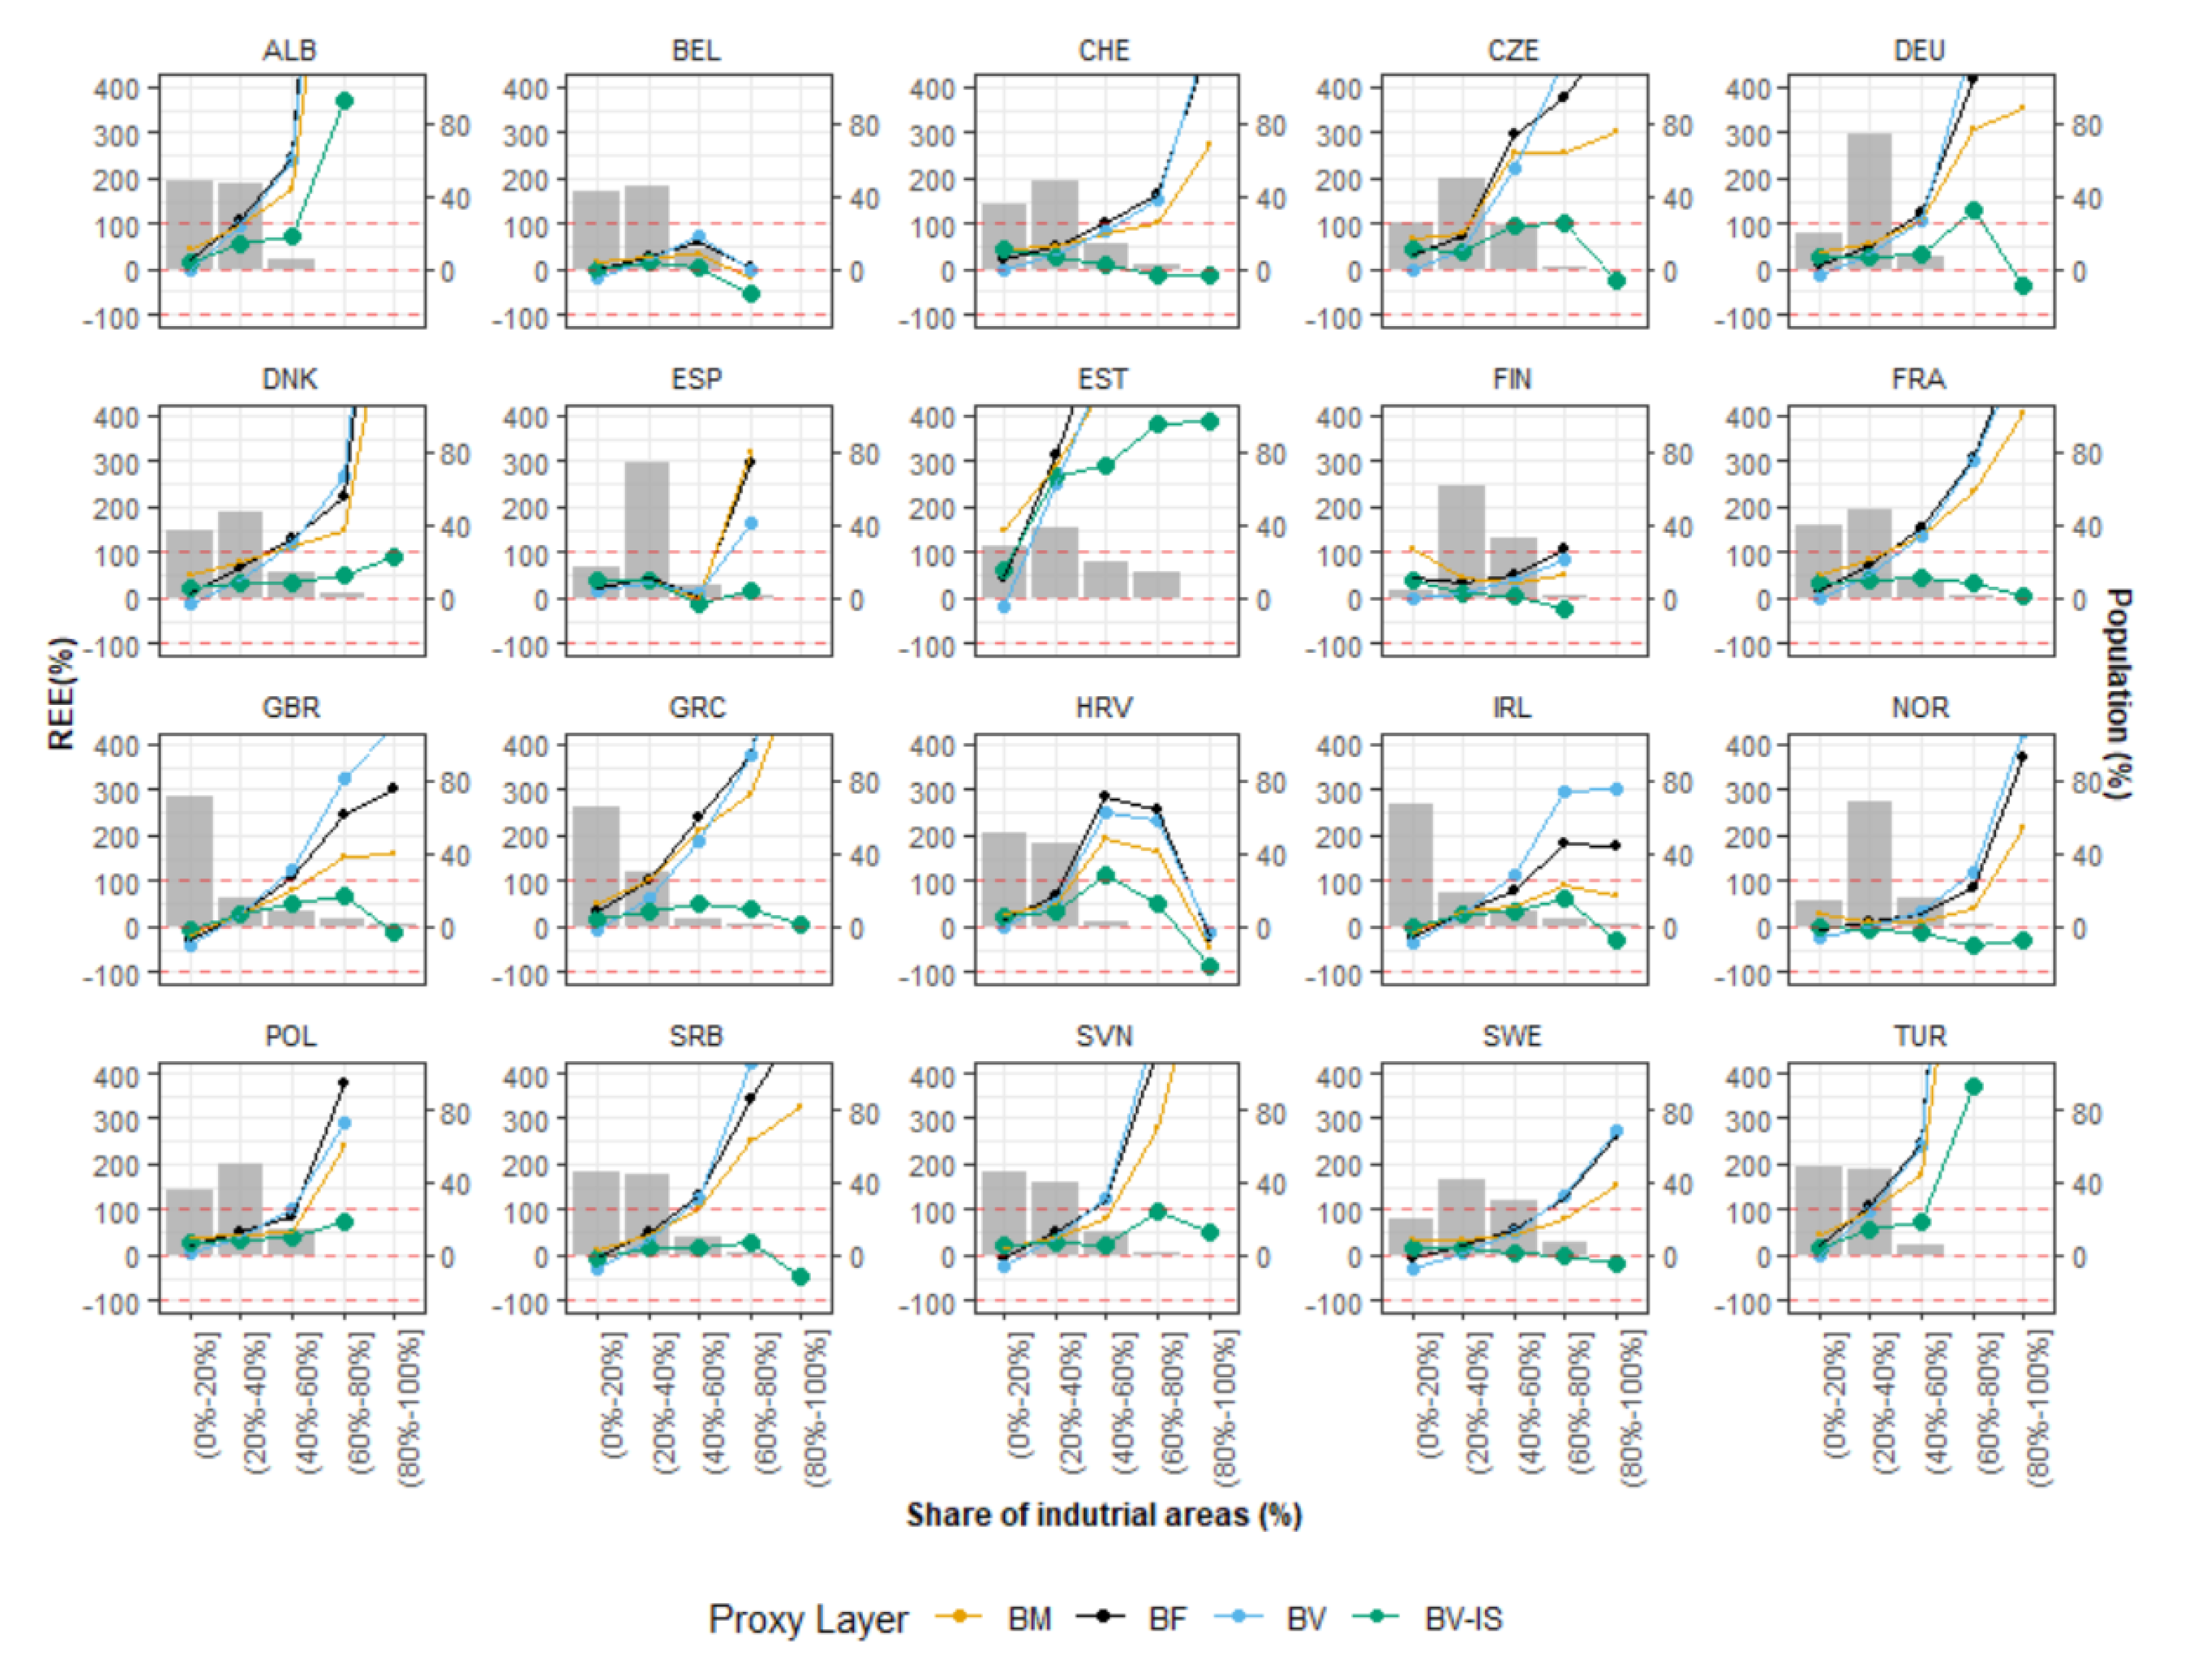
- Firstly, for each country we calculated the proportion of industrial areas found within the L1 units according to the final binary classification maps. For all L1 units with the same amount of industrial presence, we then calculated the average REE produced by each gridded population map.
- (ii)
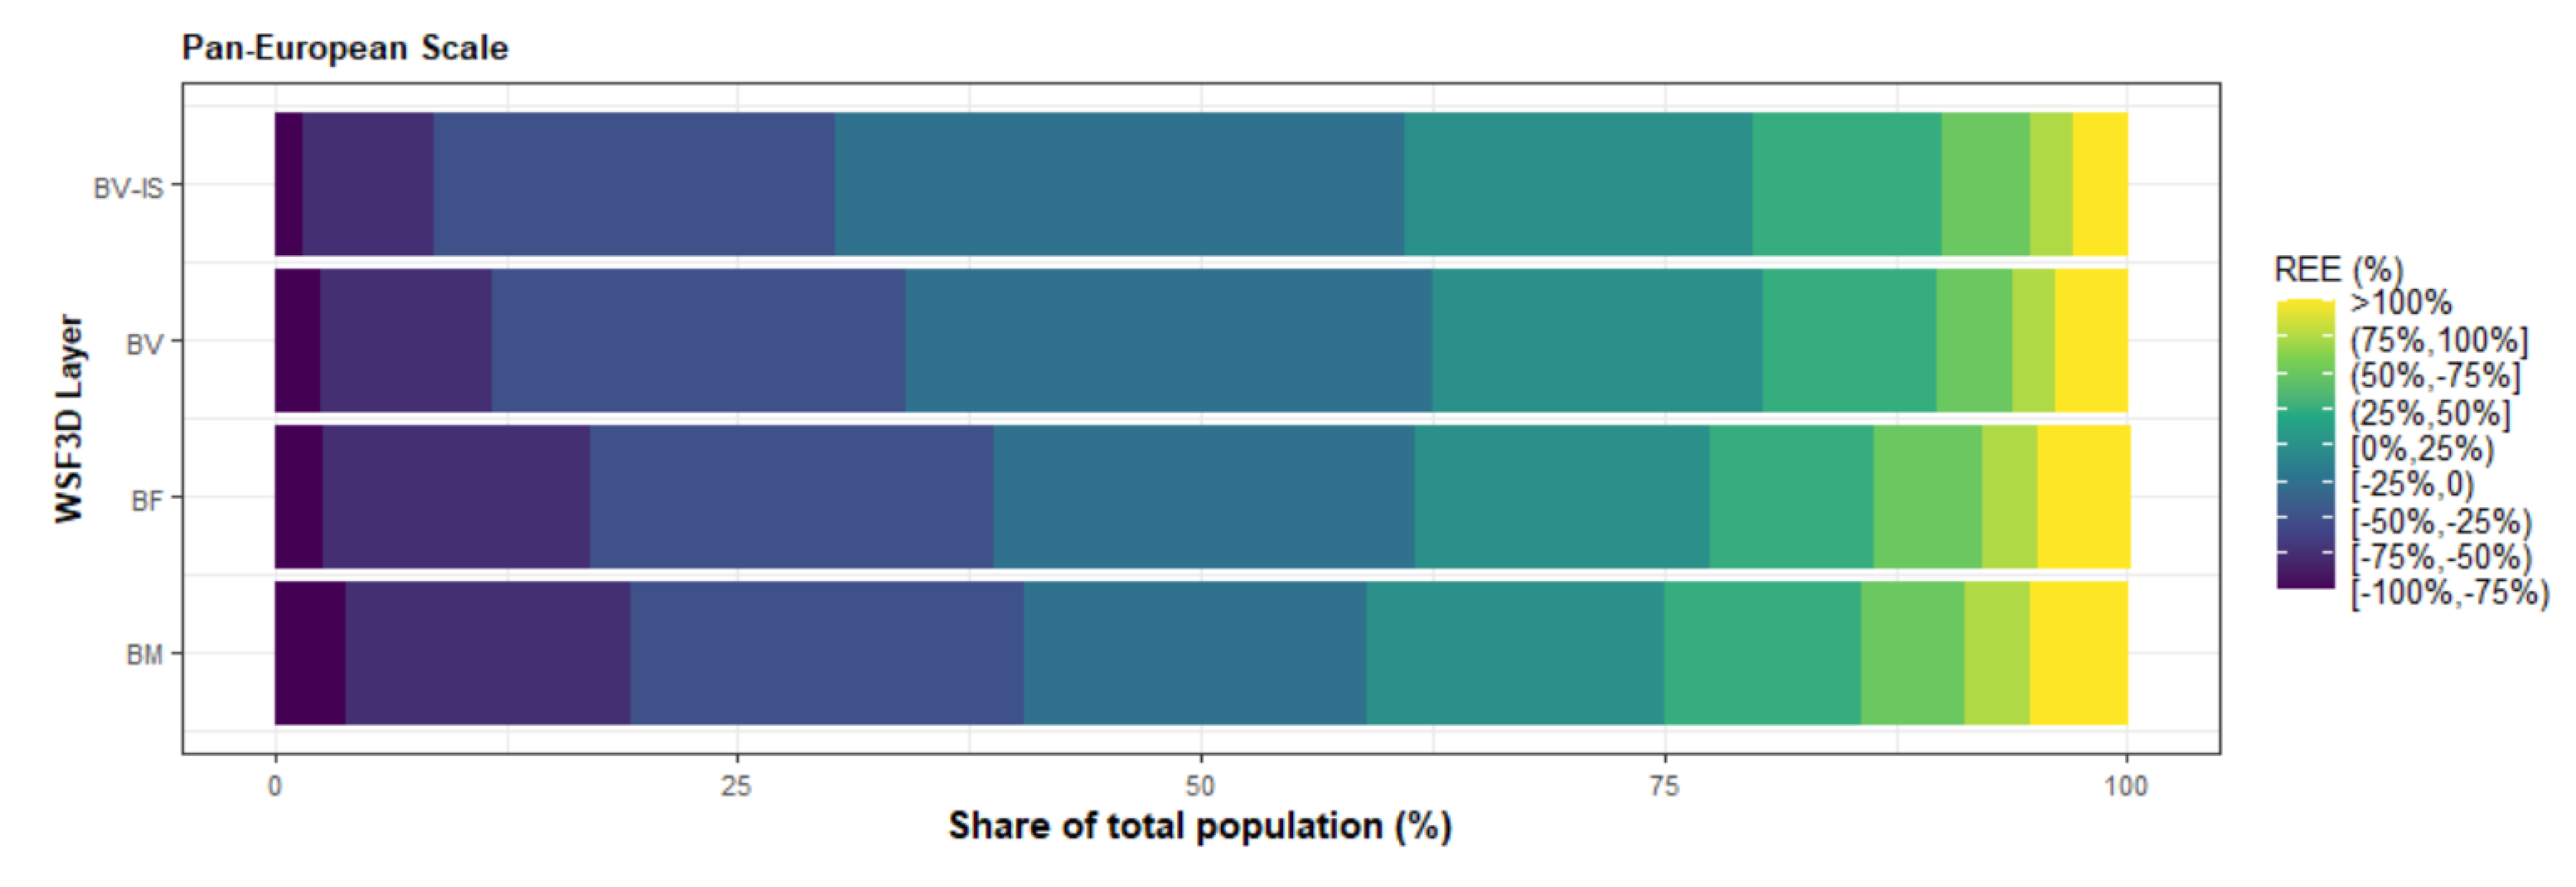
- Secondly, similar to [48], we grouped the L1 units into REE ranges of 25% according to the results produced by each gridded population map. For each country, we then calculated the percentage of each countries’ total population found in these units.
3. Results
3.1. Industrial and Non-Industrial Binary Classification Maps
3.2. Population Modelling: Output Gridded Population Maps
3.3. Population Modelling: Quantitative Comparative Analyses
4. Discussion
4.1. Industrial and Non-Industrial Classification of Built-Up Settlements Using Random Forest
- WSF3D: The quality and accuracy of the WSF3D in terms of settlement detection (building mask-BM) and the final derived spatial metrics, played a fundamental role in the final accuracies reported in this research. A thorough inspection of the classified maps revealed that in areas identified as “industrial” by the reference datasets, many pixels representing actual green areas or parking lots were detected as built-up in the BM layer. Considering their low spatial metrics, the FM-RF then predicted these pixels as “non-industrial” leading to errors of omission in the industrial class, and errors of commission in the non-industrial class as summarized in Figure 10. In this context, from the average 25% errors of omission reported at the Pan-European level for the industrial class (100–75%, PA2 = 25%), it was found that approximately 15% of the errors came from confusing class 2 for class 1.1, and 10% for class 1.2 (see Table 3) during the prediction process. While the classification of these pixels as “non-industrial” could be in reality “thematically correct”, for the purpose of population modelling the presence of these pixels are detrimental, as population counts are allocated within these areas. Therefore, to potentially reduce the misclassification caused by the false detection of settlement pixels, future research should explore improving the final BM layer by integrating thresholds in the BF layer (Section 2.2). Similarly, the integration of additional post-classification steps should also be considered, such as employing a broader number of window sizes for the extraction of spatial metrics as carried out in [56], or by reclassifying the pixels according to their RF-class probability as carried out in [67].
- Automatic training data collection: Unlike some local-scale research where a manual collection of training samples allows for a visual qualitative assessment of the training data [48], in this research we relied on an automatic procedure that did not include performing any sort of quality control over the training datasets. In correlation with our previous point, in a few cases, this lack of assessment resulted in poorly heterogenous training samples among classes, which without a doubt lead to some misclassification errors. For example, by evaluating the training data of a FUA in Ireland that shows large differences between classes (see Figure 9), it was possible to observe that the pixels values for class 1.1 “High-dense residential” and class 2: “Industrial” were similar across the bands corresponding to the BA, BF, BH and BV as represented in Figure 16. Within the selected FUA, this homogeneity led to errors of omission in the “non-industrial” class close to 20%, which meant that many pixels were erroneously classified as “industrial”. In this framework, while the errors of omission in the non-industrial class at the Pan-European scale are considered low (Figure 10), these misclassification errors had repercussions on the final population datasets, as seen by the results of Figure 14. Therefore, while a manual collection of training samples within the extent of our study area would have translated into a time-consuming task, further research should focus on the implementation of automatic intra-class separability analyses like the one presented in [83], with the objective to produce more significative training datasets.
- Equal number of training samples per FUA, per class: With the aim of producing robust comparative analyses within a country, in this research, an equal sample size was kept among all FUAs so that the I-RF and E-RF models were trained under similar conditions. In this framework, while the less represented class for some FUAs would reach close to 30% of the total available built-up pixels, in many cases less than 5% of the available pixels per class were used for training. This under-representation, coupled with the limitation mentioned on our previous point, affected the classification accuracy, especially in areas with a high inter-class diversity. In light of this, to improve the classification accuracy, future research should consider the inclusion of additional re-sampling steps. Here, post-classification approaches such as the one presented in [48] could become beneficial, where resampling is carried out using the RF class probabilities to concentrate in areas with high model-uncertainty.
4.2. Population Modelling
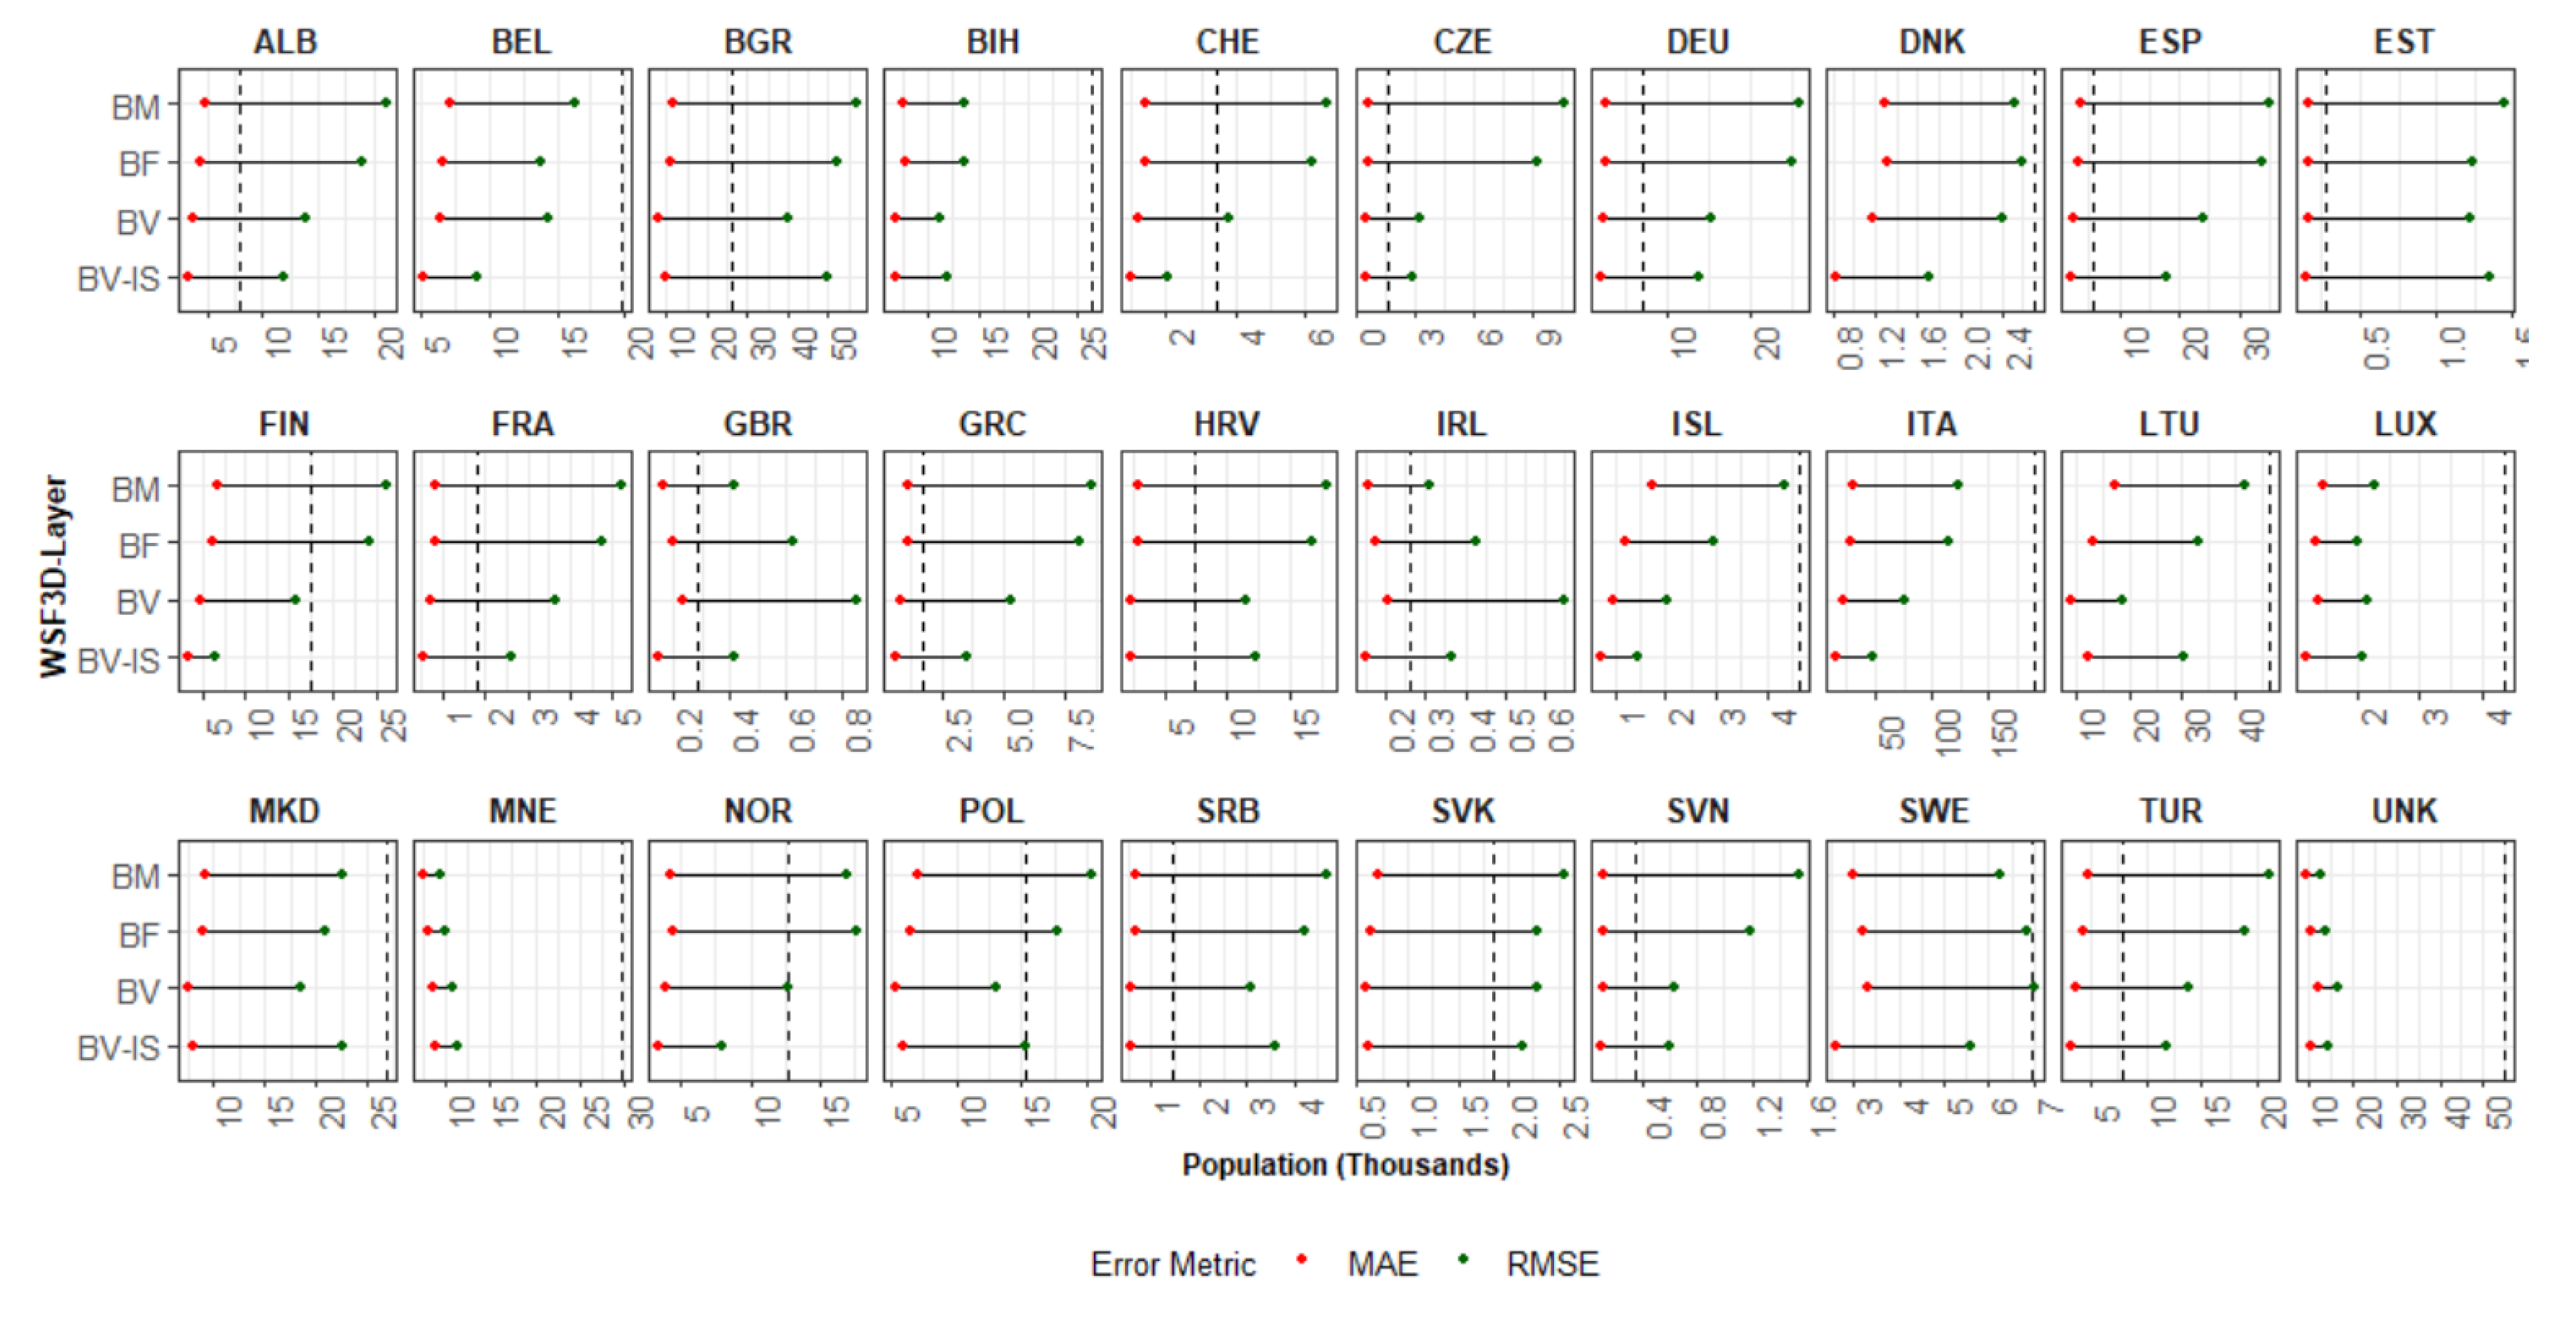
- Weighted approaches perform better than binary approaches: As already demonstrated in many other studies [13,14,43,44], weighted dasymetric approaches produce higher accuracies than binary dasymetric approaches. First of all, as observed in Figure 11, from a qualitative point of view, the output population maps produced with the “density” layers (BF, BV and BV-IS) show a higher spatial correlation with the underlying rural-urban gradient in comparison to those produced with the binary layer (BM). The results of the quantitative assessment, further confirm that the spatial representations of the population distribution are not only more “realistic”, but also more accurate, as all “density” layers consistently reported better aggregated statistics (%MAE, MAE and RMSE values) compared with the binary layer. On this note, however, it is worth noticing, that at level of validation units (REE), the BM proxy layer is capable to outperform the results of the “density” layers, especially in areas with a large share of industrial areas (see Figure 14). This makes sense if one considers that the “density” layers (BF and BV) amplify the errors of overestimation in these areas, by erroneously allocating more population due to their weighting value.
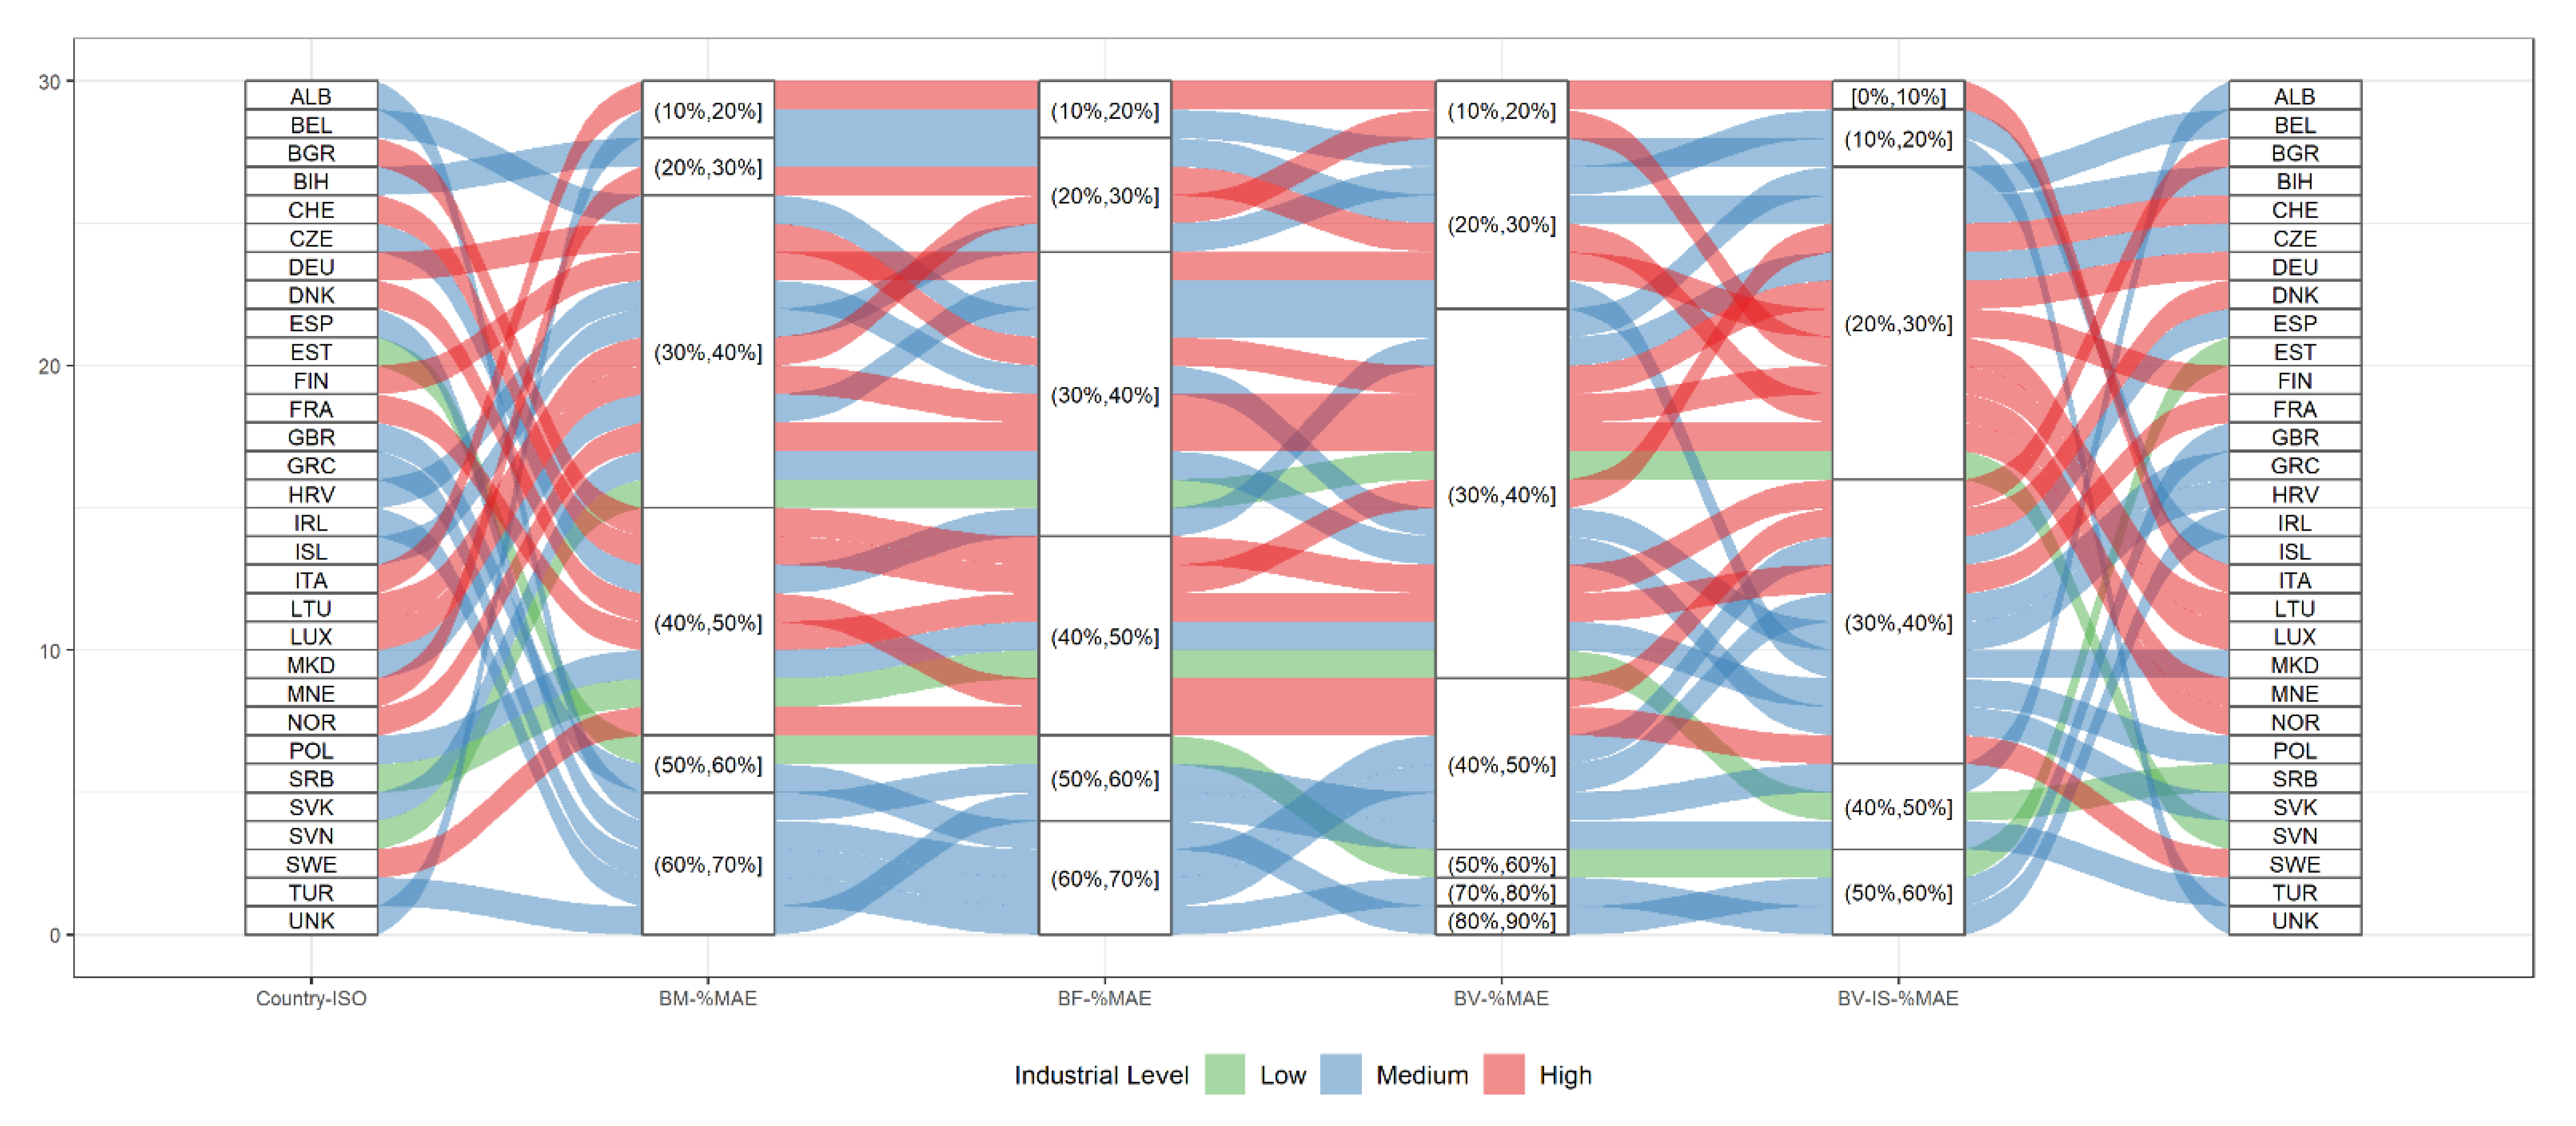
- Building volume and settlement use information improve population estimates: Comparable to the conclusions reached in local- and national-scale studies [31,48,50], the inclusion of volume and settlement use information derived from the WSF3D dataset produced by far the best estimation accuracies across the majority of the countries. First, according to the results presented in Table 4 and Figure 12, the BV-IS proxy layer produced improvements over the BM, BF and BV proxy layers that reached %MAE values up to 30%. These were more frequently present in countries with “High” industrial coverage, where large errors were remarkably reduced as observed from Figure 14. Second, as observed in Figure 13, the BV-IS proxy layer remarkably reduced the differences between the MAE and RMSE metrics. This was, once again, correlated to the fact that large errors of overestimations were drastically reduced by the proxy layer, especially in areas with a high share of industrial land cover (Figure 14). In this context, the inclusion of settlement use information played a major role, as it allowed the BV-IS proxy layer to produce systematically more stable results across all countries, and across all validation units, while REE errors remained between −50% and 100% with the BV-IS layer for most countries, the BM, BF and BV proxy layers produced variable results that reached overestimations in the rage of 500% or even higher (close to 4500% for EST). Accordingly, at the Pan-European scale, the BV-IS proxy layer estimated a larger proportion of the total population with errors in ±25% in comparison to BM add BF proxy layer, which according to pre-established rankings of accuracy [79], can be considered as “accurately” estimated.
- The input and validation units influence accuracy results: It is important to note that the maps evaluated in this research have been produced with the coarser administrative population units for each country (national scale). In some countries, where the BV-IS did not report the same systematic improvements compared to the other proxy layer, this characteristic might have influenced the accuracy results. For example, in the case of ALB, EST and TUR (Figure 14), many validation units that reported high coverage in industrial areas still reported large errors of overestimation with the BV-IS layer. This is, because even when industrial areas were successfully identified, the very low population counts of the validation units (sometimes less than 100) were difficult to match from a national-scale disaggregation. In this context, it can be expected for maps produced with the highest level of administrative units to be more accurate than the maps presented here. This assumption is supported by the large amount of research that has already proven that population maps produced with the finest administrative units produces the most accurate population maps [14,31,48,80]. However, considering that this only affected a few countries, also indicates that BV-IS proxy layer is capable to produce more accurate population maps than the rest of the proxy layers, when high-resolution input population data is not available.
- The relative effectiveness of the BV-IS proxy layer is heavily dependent on the quality of the classified maps: While the BV-IS produced consistently great improvement of the BM and BF proxy layers, in a few cases the performance of the proxy layer was improved by the BM and BV proxy layers, respectively. For example, as observed from Figure 14, in the majority countries the BV proxy layer produced better results than the BV-IS layer in validation units with industrial share below 20% (or 80% non-industrial). In these units, errors of were ~50% higher (mostly overestimations) with the BV-IS layer, which suggest that a number of non-industrial built-up settlements pixels were erroneously removed, causing an allocation of a larger population in the remaining pixels. In this context, as expressed in the previous section, these results correlate to the difficulties of accurately classifying built-up settlements pixels in complex urbans settings, where high-rise buildings are mixed with industrial areas. Here, improvements in the classification process should then reflect in improvements in the population distribution.
5. Conclusions
Author Contributions
Funding
Institutional Review Board Statement
Informed Consent Statement
Data Availability Statement
Acknowledgments
Conflicts of Interest
References
- Ehrlich, D.; Freire, S.; Melchiorri, M.; Kemper, T. Open and Consistent Geospatial Data on Population Density, Built-Up and Settlements to Analyse Human Presence, Societal Impact and Sustainability: A Review of GHSL Applications. Sustainability 2021, 13, 7851. [Google Scholar] [CrossRef]
- Ehrlich, D.; Kemper, T.; Pesaresi, M.; Corbane, C. Built-up area and population density: Two Essential Societal Variables to address climate hazard impact. Environ. Sci. Policy 2018, 90, 73–82. [Google Scholar] [CrossRef]
- Tuholske, C.; Gaughan, A.; Sorichetta, A.; de Sherbinin, A.; Bucherie, A.; Hultquist, C.; Stevens, F.; Kruczkiewicz, A.; Huyck, C.; Yetman, G. Implications for Tracking SDG Indicator Metrics with Gridded Population Data. Sustainability 2021, 13, 7329. [Google Scholar] [CrossRef]
- Huang, B.; Wang, J. Big spatial data for urban and environmental sustainability. Geo-spatial Inf. Sci. 2020, 23, 125–140. [Google Scholar] [CrossRef]
- Estoque, R. A Review of the Sustainability Concept and the State of SDG Monitoring Using Remote Sensing. Remote Sens. 2020, 12, 1770. [Google Scholar] [CrossRef]
- Avtar, R.; Aggarwal, R.; Kharrazi, A.; Kumar, P.; Kurniawan, T.A. Utilizing geospatial information to implement SDGs and monitor their Progress. Environ. Monit. Assess. 2019, 192, 35. [Google Scholar] [CrossRef] [PubMed]
- Kavvada, A.; Metternicht, G.; Kerblat, F.; Mudau, N.; Haldorson, M.; Laldaparsad, S.; Friedl, L.; Held, A.; Chuvieco, E. Towards delivering on the Sustainable Development Goals using Earth observations. Remote Sens. Environ. 2020, 247, 111930. [Google Scholar] [CrossRef]
- Doxsey-Whitfield, E.; MacManus, K.; Adamo, S.B.; Pistolesi, L.; Squires, J.; Borkovska, O.; Baptista, S.R. Taking Advantage of the Improved Availability of Census Data: A First Look at the Gridded Population of the World, Version 4. Pap. Appl. Geogr. 2015, 1, 226–234. [Google Scholar] [CrossRef]
- Freire, S.; MacManus, K.; Pesaresi, M.; Doxsey-Whitfield, E.; Mills, J. Development of new open and free multi-temporal global population grids at 250 m resolution. In Proceedings of the 19th AGILE Conference on Geographic Information Science, Helsinki, Finland, 14–17 June 2016. [Google Scholar]
- Bhaduri, B.; Bright, E.; Coleman, P.; Urban, M.L. LandScan USA: A high-resolution geospatial and temporal modeling approach for population distribution and dynamics. GeoJournal 2007, 69, 103–117. [Google Scholar] [CrossRef]
- Dobson, J.E.; Bright, E.A.; Coleman, P.R.; Durfee, R.C.; Worley, B.A. LandScan: A global population database for estimating populations at risk. Photogramm. Eng. Remote Sens. 2000, 66, 849–857. [Google Scholar] [CrossRef]
- Stevens, F.R.; Gaughan, A.E.; Linard, C.; Tatem, A.J. Disaggregating Census Data for Population Mapping Using Random Forests with Remotely-Sensed and Ancillary Data. PLoS ONE 2015, 10, e0107042. [Google Scholar] [CrossRef] [PubMed] [Green Version]
- Palacios-Lopez, D.; Bachofer, F.; Esch, T.; Marconcini, M.; MacManus, K.; Sorichetta, A.; Zeidler, J.; Dech, S.; Tatem, A.; Reinartz, P. High-Resolution Gridded Population Datasets: Exploring the Capabilities of the World Settlement Footprint 2019 Imperviousness Layer for the African Continent. Remote. Sens. 2021, 13, 1142. [Google Scholar] [CrossRef]
- Palacios-Lopez, D.; Bachofer, F.; Esch, T.; Heldens, W.; Hirner, A.; Marconcini, M.; Sorichetta, A.; Zeidler, J.; Kuenzer, C.; Dech, S.; et al. New Perspectives for Mapping Global Population Distribution Using World Settlement Footprint Products. Sustainability 2019, 11, 6056. [Google Scholar] [CrossRef] [Green Version]
- Tiecke, T.G.; Liu, X.; Zhang, A.; Gros, A.; Li, N.; Yetman, G.; Kilic, T.; Murray, S.; Blankespoor, B.; Prydz, E.B.; et al. Mapping the World Population One Building at a Time. arXiv Prepr. 2017, arXiv:1712.05839. [Google Scholar] [CrossRef]
- Allen, C.; Smith, M.; Rabiee, M.; Dahmm, H. A review of scientific advancements in datasets derived from big data for monitoring the Sustainable Development Goals. Sustain. Sci. 2021, 16, 1701–1716. [Google Scholar] [CrossRef]
- Top-Down Estimation Modelling: Constrained vs Unconstrained. Available online: https://www.worldpop.org/methods/top_down_constrained_vs_unconstrained (accessed on 8 August 2021).
- Su, M.-D.; Lin, M.-C.; Hsieh, H.-I.; Tsai, B.-W.; Lin, C.-H. Multi-layer multi-class dasymetric mapping to estimate population distribution. Sci. Total Environ. 2010, 408, 4807–4816. [Google Scholar] [CrossRef]
- Leyk, S.; Gaughan, A.E.; Adamo, S.B.; de Sherbinin, A.; Balk, D.; Freire, S.; Rose, A.; Stevens, F.R.; Blankespoor, B.; Frye, C.; et al. The spatial allocation of population: A review of large-scale gridded population data products and their fitness for use. Earth Syst. Sci. Data 2019, 11, 1385–1409. [Google Scholar] [CrossRef] [Green Version]
- Giuliani, G.; Petri, E.; Interwies, E.; Vysna, V.; Guigoz, Y.; Ray, N.; Dickie, I. Modelling Accessibility to Urban Green Areas Using Open Earth Observations Data: A Novel Approach to Support the Urban SDG in Four European Cities. Remote. Sens. 2021, 13, 422. [Google Scholar] [CrossRef]
- Deng, H.; Zhang, K.; Wang, F.; Dang, A. Compact or disperse? Evolution patterns and coupling of urban land expansion and population distribution evolution of major cities in China, 1998–2018. Habitat Int. 2021, 108, 102324. [Google Scholar] [CrossRef]
- Maroko, A.; Maantay, J.; Machado, R.P.P.; Barrozo, L.V. Improving Population Mapping and Exposure Assessment: Three-Dimensional Dasymetric Disaggregation in New York City and São Paulo, Brazil. Pap. Appl. Geogr. 2019, 5, 45–57. [Google Scholar] [CrossRef]
- Tellman, B.; Sullivan, J.A.; Kuhn, C.; Kettner, A.J.; Doyle, C.S.; Brakenridge, G.R.; Erickson, T.A.; Slayback, D.A. Satellite imaging reveals increased proportion of population exposed to floods. Nature 2021, 596, 80–86. [Google Scholar] [CrossRef]
- Maas, P.; Iyer, S.; Gros, A.; Park, W.; McGorman, L.; Nayak, C.; Dow, P.A. Facebook Disaster Maps: Aggregate Insights for Crisis Response & Recovery. In Proceedings of the 16th ISCRAM Conference, Valencia, Spain, 19–22 May 2019. [Google Scholar]
- Fries, B.; Guerra, C.A.; García, G.A.; Wu, S.L.; Smith, J.M.; Oyono, J.N.M.; Donfack, O.T.; Nfumu, J.O.O.; Hay, S.I.; Smith, D.L.; et al. Measuring the accuracy of gridded human population density surfaces: A case study in Bioko Island, Equatorial Guinea. PLoS ONE 2021, 16, e0248646. [Google Scholar] [CrossRef]
- Kellenberger, B.; Vargas-Muñoz, J.E.; Tuia, D.; Daudt, R.C.; Schindler, K.; Whelan, T.T.; Ayo, B.; Ofli, F.; Imran, M. Mapping Vulnerable Populations with AI. arXiv Prepr. 2021, arXiv:14123. [Google Scholar]
- Mohanty, M.P.; Simonovic, S.P. Understanding dynamics of population flood exposure in Canada with multiple high-resolution population datasets. Sci. Total Environ. 2020, 759, 143559. [Google Scholar] [CrossRef]
- Rader, B.; Astley, C.M.; Sewalk, K.; Delamater, P.L.; Cordiano, K.; Wronski, L.; Rivera, J.M.; Hallberg, K.; Pera, M.F.; Cantor, J. Spatial Accessibility Modeling of Vaccine Deserts as Barriers to Controlling SARS-CoV-2. medRxiv 2021. [Google Scholar] [CrossRef]
- Gong, S.; Gao, Y.; Zhang, F.; Mu, L.; Kang, C.; Liu, Y. Evaluating healthcare resource inequality in Beijing, China based on an improved spatial accessibility measurement. Trans. GIS 2021, 25, 1504–1521. [Google Scholar] [CrossRef]
- POPGRID Data Collaborative. Available online: https://www.popgrid.org/ (accessed on 1 June 2021).
- Rubinyi, S.; Blankespoor, B.; Hall, J.W. The utility of built environment geospatial data for high-resolution dasymetric global population modeling. Comput. Environ. Urban Syst. 2021, 86, 101594. [Google Scholar] [CrossRef]
- Nieves, J.J.; Bondarenko, M.; Kerr, D.; Ves, N.; Yetman, G.; Sinha, P.; Clarke, D.J.; Sorichetta, A.; Stevens, F.R.; Gaughan, A.E.; et al. Measuring the contribution of built-settlement data to global population mapping. Soc. Sci. Humanit. Open 2021, 3, 100102. [Google Scholar] [CrossRef]
- Esch, T.; Heldens, W.; Hirner, A.; Keil, M.; Marconcini, M.; Roth, A.; Zeidler, J.; Dech, S.; Strano, E. Breaking new ground in mapping human settlements from space—The Global Urban Footprint. ISPRS J. Photogramm. Remote Sens. 2017, 134, 30–42. [Google Scholar] [CrossRef] [Green Version]
- World Settlement Footprint -Where Do Humans Live. Available online: https://www.dlr.de/blogs/en/all-blog-posts/world-settlement-footprint-where-do-humans-live.aspx (accessed on 8 August 2021).
- Marconcini, M.; Metz-Marconcini, A.; Üreyen, S.; Palacios-Lopez, D.; Hanke, W.; Bachofer, F.; Zeidler, J.; Esch, T.; Gorelick, N.; Kakarla, A.; et al. Outlining where humans live, the World Settlement Footprint 2015. Sci. Data 2020, 7, 1–14. [Google Scholar] [CrossRef]
- Pesaresi, M.; Ehrlich, D.; Ferri, S.; Florczyk, A.J.; Freire, S.; Halkia, M.; Julea, A.; Kemper, T.; Soille, P.; Syrris, V. Operating procedure for the production of the Global Human Settlement Layer from Landsat data of the epochs 1975, 1990, 2000, and 2014. Publ. Off. Eur. Union 2016. [Google Scholar] [CrossRef]
- Nieves, J.J.; Sorichetta, A.; Linard, C.; Bondarenko, M.; Steele, J.E.; Stevens, F.R.; Gaughan, A.E.; Carioli, A.; Clarke, D.J.; Esch, T.; et al. Annually modelling built-settlements between remotely-sensed observations using relative changes in subnational populations and lights at night. Comput. Environ. Urban Syst. 2020, 80, 101444. [Google Scholar] [CrossRef]
- Nieves, J.J.; Bondarenko, M.; Sorichetta, A.; Steele, J.E.; Kerr, D.; Carioli, A.; Stevens, F.R.; Gaughan, A.E.; Tatem, A.J. Predicting Near-Future Built-Settlement Expansion Using Relative Changes in Small Area Populations. Remote. Sens. 2020, 12, 1545. [Google Scholar] [CrossRef]
- Building Footprints. Available online: https://www.maxar.com/products/building-footprints (accessed on 8 August 2021).
- Heris, M.; Foks, N.; Bagstad, K.; Troy, A. A National Dataset of Rasterized Building Footprints for the US; US Geological Survey: Reston, VA, USA, 2020. [Google Scholar] [CrossRef]
- Sirko, W.; Kashubin, S.; Ritter, M.; Annkah, A.; Bouchareb, Y.S.E.; Dauphin, Y.; Keysers, D.; Neumann, M.; Cisse, M.; Quinn, J. Continental-Scale Building Detection from High Resolution Satellite Imagery. arXiv Prepr. 2021, arXiv:2107.12283. [Google Scholar]
- Freire, S.; Kemper, T.; Pesaresi, M.; Florczyk, A.; Syrris, V. Combining GHSL and GPW to improve global population mapping. IEEE Int. Geosci. Remote Sens. Symp. 2015, 2541–2543. [Google Scholar] [CrossRef]
- Stevens, F.R.; Gaughan, A.E.; Nieves, J.J.; King, A.; Sorichetta, A.; Linard, C.; Tatem, A.J. Comparisons of two global built area land cover datasets in methods to disaggregate human population in eleven countries from the global South. Int. J. Digit. Earth 2019, 13, 78–100. [Google Scholar] [CrossRef]
- Reed, F.J.; Gaughan, A.E.; Stevens, F.R.; Yetman, G.; Sorichetta, A.; Tatem, A.J. Gridded Population Maps Informed by Different Built Settlement Products. Data 2018, 3, 33. [Google Scholar] [CrossRef] [Green Version]
- Thomson, D.; Gaughan, A.; Stevens, F.; Yetman, G.; Elias, P.; Chen, R. Evaluating the Accuracy of Gridded Population Estimates in Slums: A Case Study in Nigeria and Kenya. Urban Sci. 2021, 5, 48. [Google Scholar] [CrossRef]
- Ural, S.; Hussain, E.; Shan, J. Building population mapping with aerial imagery and GIS data. Int. J. Appl. Earth Obs. Geoinf. 2011, 13, 841–852. [Google Scholar] [CrossRef]
- Shang, S.; Du, S.; Du, S.; Zhu, S. Estimating building-scale population using multi-source spatial data. Cities 2020, 111, 103002. [Google Scholar] [CrossRef]
- Schug, F.; Frantz, D.; van der Linden, S.; Hostert, P. Gridded population mapping for Germany based on building density, height and type from Earth Observation data using census disaggregation and bottom-up estimates. PLoS ONE 2021, 16, e0249044. [Google Scholar] [CrossRef] [PubMed]
- Huang, X.; Wang, C.; Li, Z.; Ning, H. A 100 m population grid in the CONUS by disaggregating census data with open-source Microsoft building footprints. Big Earth Data 2020, 5, 112–133. [Google Scholar] [CrossRef]
- Biljecki, F.; Ohori, K.A.; LeDoux, H.; Peters, R.; Stoter, J. Population Estimation Using a 3D City Model: A Multi-Scale Country-Wide Study in the Netherlands. PLoS ONE 2016, 11, e0156808. [Google Scholar] [CrossRef]
- Grippa, T.; Linard, C.; Lennert, M.; Georganos, S.; Mboga, N.; VanHuysse, S.; Gadiaga, A.; Wolff, E. Improving Urban Population Distribution Models with Very-High Resolution Satellite Information. Data 2019, 4, 13. [Google Scholar] [CrossRef] [Green Version]
- Du, S.; Zhang, F.; Zhang, X. Semantic classification of urban buildings combining VHR image and GIS data: An improved random forest approach. ISPRS J. Photogramm. Remote Sens. 2015, 105, 107–119. [Google Scholar] [CrossRef]
- Stéphane, D.; Laurence, D.; Raffaele, G.; Valérie, A.; Eloise, R. Land cover maps of Antananarivo (capital of Madagascar) produced by processing multisource satellite imagery and geospatial reference data. Data Brief 2020, 31, 105952. [Google Scholar] [CrossRef]
- Zhang, W.; Li, W.; Zhang, C.; Hanink, D.M.; Li, X.; Wang, W. Parcel-based urban land use classification in megacity using airborne LiDAR, high resolution orthoimagery, and Google Street View. Comput. Environ. Urban Syst. 2017, 64, 215–228. [Google Scholar] [CrossRef] [Green Version]
- Ma, L. Discrimination of residential and industrial buildings using LiDAR data and an effective spatial-neighbor algorithm in a typical urban industrial park. Eur. J. Remote. Sens. 2015, 48, 1–15. [Google Scholar] [CrossRef] [Green Version]
- Jochem, W.C.; Leasure, D.R.; Pannell, O.; Chamberlain, H.R.; Jones, P.; Tatem, A.J. Classifying settlement types from multi-scale spatial patterns of building footprints. Environ. Plan. B Urban Anal. City Sci. 2020, 48, 1161–1179. [Google Scholar] [CrossRef]
- Lloyd, C.T.; Sturrock, H.J.W.; Leasure, D.R.; Jochem, W.c.; Lázár, A.N.; Tatem, A.J. Using GIS and Machine Learning to Classify Residential Status of Urban Buildings in Low and Middle Income Settings. Remote Sens. 2020, 12, 3847. [Google Scholar] [CrossRef]
- Esch, T.; Brzoska, E.; Dech, S.; Leutner, B.; Palacios-Lopez, D.; Metz-Marconcini, A.; Marconcini, M.; Roth, A.; Zeidler, J. World Settlement Footprint 3D—A first three-dimensional survey of the global building stock. Remote Sens. Environ. 2022, 270, 112877. [Google Scholar] [CrossRef]
- Esch, T.; Zeidler, J.; Palacios-Lopez, D.; Marconcini, M.; Roth, A.; Mönks, M.; Leutner, B.; Brzoska, E.; Metz-Marconcini, A.; Bachofer, F.; et al. Towards a Large-Scale 3D Modeling of the Built Environment—Joint Analysis of TanDEM-X, Sentinel-2 and Open Street Map Data. Remote Sens. 2020, 12, 2391. [Google Scholar] [CrossRef]
- Marconcini, M.; Metz-Marconcini, A.; Zeidler, J.; Esch, T. Urban monitoring in support of sustainable cities. In Proceedings of the 2015 Joint Urban Remote Sensisn Event (JURSE), Lausanne, Switzerland, 30 March–1 April 2015; IEEE: Piscataway, NJ, USA, 2015. [Google Scholar]
- The View from Space—How Cities Are Growing. Available online: https://www.dlr.de/content/en/articles/news/2021/04/20211111_the-view-from-space-how-cities-are-growing.html (accessed on 25 November 2021).
- Silva, F.B.; LaValle, C.; Koomen, E. A procedure to obtain a refined European land use/cover map. J. Land Use Sci. 2013, 8, 255–283. [Google Scholar] [CrossRef]
- Copernicus Land Monitoring Service. Available online: https://land.copernicus.eu/local/urban-atlas/urban-atlas-2018 (accessed on 28 July 2021).
- Center of International Earth Science Information Network (CIESIN). Documentation for the Gridded Population of the World (GPWv4.0) (Version 4); CIESIN: Palisades, NY, USA, 2015. [Google Scholar]
- Freire, S.; Schiavina, M.; Florczyk, A.J.; MacManus, K.; Pesaresi, M.; Corbane, C.; Borkovska, O.; Mills, J.; Pistolesi, L.; Squires, J.; et al. Enhanced data and methods for improving open and free global population grids: Putting ‘leaving no one behind’ into practice. Int. J. Digit. Earth 2018, 13, 61–77. [Google Scholar] [CrossRef] [Green Version]
- Hernandez, I.E.R.; Shi, W. A Random Forests classification method for urban land-use mapping integrating spatial metrics and texture analysis. Int. J. Remote Sens. 2017, 39, 1175–1198. [Google Scholar] [CrossRef]
- Grippa, T.; Georganos, S.; Zarougui, S.; Bognounou, P.; Diboulo, E.; Forget, Y.; Lennert, M.; VanHuysse, S.; Mboga, N.; Wolff, E. Mapping Urban Land Use at Street Block Level Using OpenStreetMap, Remote Sensing Data, and Spatial Metrics. ISPRS Int. J. Geo-Inf. 2018, 7, 246. [Google Scholar] [CrossRef] [Green Version]
- Zhang, X.M.; He, G.J.; Peng, Y.; Long, T.F. Spectral-spatial multi-feature classification of remote sensing big data based on a random forest classifier for land cover mapping. Clust. Comput. 2017, 20, 2311–2321. [Google Scholar] [CrossRef]
- Herold, M.; Couclelis, H.; Clarke, K.C. The role of spatial metrics in the analysis and modeling of urban land use change. Comput. Environ. Urban Syst. 2005, 29, 369–399. [Google Scholar] [CrossRef]
- Rodriguez-Galiano, V.F.; Ghimire, B.; Rogan, J.; Chica-Olmo, M.; Rigol-Sanchez, J.P. An assessment of the effectiveness of a random forest classifier for land-cover classification. ISPRS J. Photogramm. Remote Sens. 2012, 67, 93–104. [Google Scholar] [CrossRef]
- Pal, M. Random forest classifier for remote sensing classification. Int. J. Remote Sens. 2005, 26, 217–222. [Google Scholar] [CrossRef]
- European Union-Copernicus Land Monitoring Service. Mapping Guide for a European Urban Atlas 2016. Available online: https://land.copernicus.eu/user-corner/technical-library/urban-atlas-mapping-guide (accessed on 6 December 2021).
- Khryashchev, V.V.; Pavlov, V.A.; Priorov, A.; Ostrovskaya, A.A. Deep learning for region detection in high-resolution aerial images. In Proceedings of the 2018 IEEE East-West Design & Test Symposium (EWDTS), Kazan, Russia, 4–17 September 2018. [Google Scholar]
- Leinenkugel, P.; Deck, R.; Huth, J.; Ottinger, M.; Mack, B. The Potential of Open Geodata for Automated Large-Scale Land Use and Land Cover Classification. Remote Sens. 2019, 11, 2249. [Google Scholar] [CrossRef] [Green Version]
- Scikit-Learn: Machine learning in Python. Available online: https://scikit-learn.org/stable/index.html (accessed on 29 June 2021).
- Ploton, P.; Mortier, F.; Réjou-Méchain, M.; Barbier, N.; Picard, N.; Rossi, V.; Dormann, C.; Cornu, G.; Viennois, G.; Bayol, N.; et al. Spatial validation reveals poor predictive performance of large-scale ecological mapping models. Nat. Commun. 2020, 11, 1–11. [Google Scholar] [CrossRef]
- Jin, S.; Su, Y.; Gao, S.; Hu, T.; Liu, J.; Guo, Q. The Transferability of Random Forest in Canopy Height Estimation from Multi-Source Remote Sensing Data. Remote Sens. 2018, 10, 1183. [Google Scholar] [CrossRef] [Green Version]
- Orynbaikyzy, A.; Gessner, U.; Conrad, C. Spatial Transferability of Random Forest Models for Crop Type Classification using Sentinel-1 and Sentinel-2. Remote Sens. 2022. under review. [Google Scholar]
- Bai, Z.; Wang, J.; Wang, M.; Gao, M.; Sun, J. Accuracy Assessment of Multi-Source Gridded Population Distribution Datasets in China. Sustainability 2018, 10, 1363. [Google Scholar] [CrossRef] [Green Version]
- Hay, S.I.; Noor, A.M.; Nelson, A.; Tatem, A.J. The accuracy of human population maps for public health application. Trop. Med. Int. Heal. 2005, 10, 1073–1086. [Google Scholar] [CrossRef]
- Cicchetti, D.V. Guidelines, criteria, and rules of thumb for evaluating normed and standardized assessment instruments in psychology. Psychol. Assess. 1994, 6, 284–290. [Google Scholar] [CrossRef]
- Meyer, H.; Pebesma, E. Predicting into unknown space? Estimating the area of applicability of spatial prediction models. Methods Ecol. Evol. 2021, 12, 1620–1633. [Google Scholar] [CrossRef]
- Wicaksono, P.; Aryaguna, P.A. Analyses of inter-class spectral separability and classification accuracy of benthic habitat mapping using multispectral image. Remote Sens. Appl. Soc. Environ. 2020, 19, 100335. [Google Scholar] [CrossRef]





| Country Name | ISO | No. FUAs | Country Name | ISO | No. FUAs | Country Name | ISO | No. FUAs | Country Name | ISO | No. FUAs |
|---|---|---|---|---|---|---|---|---|---|---|---|
| Albania | ALB | 4 | Spain | ESP | 69 | Italy | ITA | 81 | Portugal | PRT | 11 |
| Austria | AUT | 6 | Estonia | EST | 3 | Lithuania | LTU | 6 | Romania | ROM | 35 |
| Belgium | BEL | 11 | France | FRA | 83 | Luxembourg | LUX | 1 | Serbia | SRB | 13 |
| Bulgaria | BGR | 17 | Finland | FIN | 7 | Latvia | LVA | 4 | Slovakia | SVK | 8 |
| Bos. and Her | BIH | 5 | Un. King | GBR | 40 | Macedonia | MKD | 4 | Slovenia | SVN | 2 |
| Switzerland | CHE | 10 | Greece | GRC | 9 | Malta | MLT | 1 | Sweden | SWE | 9 |
| Cyprus | CYP | 2 | Croatia | HRV | 7 | Montenegro | MNE | 1 | Turkey | TUR | 62 |
| Czechia | CZE | 15 | Hungry | HUN | 19 | Netherlands | NLD | 35 | Kosovo | UNK | 3 |
| Germany | DEU | 96 | Ireland | IRL | 5 | Norway | NOR | 6 | Total | 753 | |
| Denmark | DNK | 4 | Island | ISL | 1 | Poland | POL | 58 |
| ISO Code | Census Year | UN2020 Estimation | L1-unit/Count | ISO Code | Census Year | UN2020 Estimation | L1-Unit/Count |
|---|---|---|---|---|---|---|---|
| ALB | 2011 | 2,935,145 | 3/365 | IRL | 2011 | 4,874,291 | 4/18,488 |
| BEL | 2014 | 11,634,330 | 4/589 | ISL | 2010 | 342,140 | 2/73 |
| BGR | 2011 | 6,884,343 | 2/263 | ITA | 2011 | 59,741,323 | 3/317 |
| BIH | 2013 | 3,758,147 | 3/141 | LTU | 2011 | 2,794,897 | 2/60 |
| CHE | 2010 | 8,654,270 | 3/2514 | LUX | 2011 | 605,110 | 4/139 |
| CZE | 2011 | 10,573,292 | 3/6249 | MKD | 2010 | 2,088,374 | 2/78 |
| DEU | 2011 | 80,392,210 | 3/11,185 | MNE | 2011 | 625,837 | 1/21 |
| DNK | 2010 | 5,775,633 | 3/2135 | NOR | 2011 | 5,490,394 | 2/429 |
| ESP | 2011 | 43,931,099 | 3/7931 | POL | 2011 | 38,407,264 | 4/2500 |
| EST | 2011 | 1,295,158 | 3/4587 | SRB | 2011 | 6,641,618 | 5/4616 |
| FIN | 2011 | 5,554,886 | 2/320 | SVN | 2010 | 2,075,010 | 3/5969 |
| FRA | 2009 | 65,720,028 | 5/36,602 | SWE | 2010 | 10,120,395 | 3/14,605 |
| GRB | 2011 | 66,700,124 | 6/232,296 | TUR | 2010 | 82,255,778 | 2/957 |
| GRC | 2011 | 10,825,409 | 5/6121 | UNK | 2011 | 2,031,895 | 1/37 |
| HRV | 2011 | 4,162,498 | 2/556 |
| Class | Major Classes | Urban Atlas Codes | Sub-Classes |
|---|---|---|---|
| 1 | Non-industrial | 111: 11100 | 1.1 High-dense residential |
| 112: 11210, 11220, 11230, 11240 113: 11300 121: 12100 (area < 10 km2) 122: 12210, 12220, 122230 131: All 141: All Level 1: 2, 3, 4, 5 | 1.2 Low-dense residential + Small non-residential | ||
| 2 | Industrial | 121: 12100 (area >= 10 km2) 122: 12300, 12400 |
| %MAE | %MAE | ||||||||||||
|---|---|---|---|---|---|---|---|---|---|---|---|---|---|
| ISO | Av. Pop | BM | BF | BV | BV-IS | Ind. Level | ISO | Av. Pop | BM | BF | BV | BV-IS | Ind. Level |
| ALB | 7869.02 | 60.70 | 55.33 | 46.05 | 41.69 | Medium | IRL | 263.65 | 60.11 | 67.03 | 78.43 | 56.92 | Medium |
| BEL | 19,752.68 | 36.12 | 33.74 | 32.54 | 26.22 | Medium | ISL | 4623.53 | 37.57 | 26.31 | 20.54 | 15.52 | Medium |
| BGR | 26,077.06 | 45.39 | 41.73 | 31.26 | 37.49 | High | ITA | 189,654.99 | 16.15 | 14.88 | 11.66 | 8.47 | High |
| BIH | 26,465.83 | 28.11 | 29.17 | 25.18 | 25.73 | Medium | LTU | 46,581.63 | 36.93 | 28.26 | 19.54 | 26.15 | High |
| CHE | 3441.06 | 40.27 | 41.39 | 34.75 | 27.43 | High | LUX | 4353.32 | 33.76 | 30.88 | 31.64 | 27.73 | High |
| CZE | 1691.46 | 40.51 | 37.58 | 30.38 | 28.89 | Medium | MKD | 26,774.03 | 34.19 | 33.11 | 28.21 | 30.07 | Medium |
| DEU | 7119.40 | 37.36 | 36.23 | 31.83 | 28.37 | High | MNE | 29,801.81 | 25.08 | 26.65 | 28.77 | 29.48 | High |
| DNK | 2701.42 | 48.01 | 48.48 | 44.02 | 30.86 | High | NOR | 12,768.36 | 33.59 | 35.39 | 30.85 | 26.99 | High |
| ESP | 5541.96 | 43.52 | 44.25 | 34.08 | 28.03 | High | POL | 15,362.91 | 46.61 | 42.87 | 34.47 | 38.88 | Medium |
| EST | 282.35 | 57.59 | 56.7 | 54.8 | 54.00 | Low | SRB | 1438.83 | 47.41 | 44.94 | 38.23 | 40.78 | Low |
| FIN | 17,359.02 | 39.55 | 36.38 | 28.03 | 20.06 | High | SVK | 1857.59 | 37.6 | 34.04 | 31.38 | 33.00 | Medium |
| FRA | 1795.43 | 46.83 | 45.49 | 39.69 | 30.55 | High | SVN | 347.63 | 35.14 | 36.1 | 36.22 | 28.86 | Low |
| GBR | 287.13 | 56.55 | 67.25 | 80.13 | 51.63 | Medium | SWE | 6931.78 | 43.24 | 46.25 | 47.66 | 37.80 | High |
| GRC | 1768.57 | 68.37 | 64.44 | 47.77 | 35.11 | Medium | TUR | 7869.02 | 60.7 | 55.33 | 46.05 | 41.69 | Medium |
| HRV | 7486.51 | 39.3 | 39.28 | 32.76 | 30.90 | Medium | UNK | 54,918.53 | 17.45 | 18.78 | 22.08 | 19.55 | Medium |
Publisher’s Note: MDPI stays neutral with regard to jurisdictional claims in published maps and institutional affiliations. |
© 2022 by the authors. Licensee MDPI, Basel, Switzerland. This article is an open access article distributed under the terms and conditions of the Creative Commons Attribution (CC BY) license (https://creativecommons.org/licenses/by/4.0/).
Share and Cite
Palacios-Lopez, D.; Esch, T.; MacManus, K.; Marconcini, M.; Sorichetta, A.; Yetman, G.; Zeidler, J.; Dech, S.; Tatem, A.J.; Reinartz, P. Towards an Improved Large-Scale Gridded Population Dataset: A Pan-European Study on the Integration of 3D Settlement Data into Population Modelling. Remote Sens. 2022, 14, 325. https://doi.org/10.3390/rs14020325
Palacios-Lopez D, Esch T, MacManus K, Marconcini M, Sorichetta A, Yetman G, Zeidler J, Dech S, Tatem AJ, Reinartz P. Towards an Improved Large-Scale Gridded Population Dataset: A Pan-European Study on the Integration of 3D Settlement Data into Population Modelling. Remote Sensing. 2022; 14(2):325. https://doi.org/10.3390/rs14020325
Chicago/Turabian StylePalacios-Lopez, Daniela, Thomas Esch, Kytt MacManus, Mattia Marconcini, Alessandro Sorichetta, Greg Yetman, Julian Zeidler, Stefan Dech, Andrew J. Tatem, and Peter Reinartz. 2022. "Towards an Improved Large-Scale Gridded Population Dataset: A Pan-European Study on the Integration of 3D Settlement Data into Population Modelling" Remote Sensing 14, no. 2: 325. https://doi.org/10.3390/rs14020325
APA StylePalacios-Lopez, D., Esch, T., MacManus, K., Marconcini, M., Sorichetta, A., Yetman, G., Zeidler, J., Dech, S., Tatem, A. J., & Reinartz, P. (2022). Towards an Improved Large-Scale Gridded Population Dataset: A Pan-European Study on the Integration of 3D Settlement Data into Population Modelling. Remote Sensing, 14(2), 325. https://doi.org/10.3390/rs14020325


