Abstract
The proliferation of massive polarimetric Synthetic Aperture Radar (SAR) data helps promote the development of SAR image interpretation. Due to the advantages of powerful feature extraction capability and strong adaptability for different tasks, deep learning has been adopted in the work of SAR image interpretation and has achieved good results. However, most deep learning methods only employ single-polarization SAR images and ignore the water features embedded in multi-polarization SAR images. To fully exploit the dual-polarization SAR data and multi-scale features of SAR images, an effective flood detection method for SAR images is proposed in this paper. In the proposed flood detection method, a powerful Multi-Scale Deeplab (MS-Deeplab) model is constructed based on the dual-channel MobileNetV2 backbone and the classic DeeplabV3+ architecture to improve the ability of water feature extraction in SAR images. Firstly, the dual-channel feature extraction backbone based on the lightweight MobileNetV2 separately trains the dual-polarization SAR images, and the obtained training parameters are merged with the linear weighting to fuse dual-polarization water features. Given the multi-scale space information in SAR images, then, a multi-scale feature fusion module is introduced to effectively utilize multi-layer features and contextual information, which enhances the representation of water features. Finally, a joint loss function is constructed based on cross-entropy and a dice coefficient to deal with the imbalanced categorical distribution in the training dataset. The experimental results on the time series of Sentinel-1A SAR images show that the proposed method for flood detection has a strong ability to locate water boundaries and tiny water bodies in complex scenes. In terms of quantitative assessment, MS-Deeplab can achieve a better performance compared with other mainstream semantic segmentation models, including PSPNet, Unet and the original DeeplabV3+ model, with a 3.27% intersection over union (IoU) and 1.69% pixel accuracy (PA) improvement than the original DeeplabV3+ model.
1. Introduction
Floods and secondary disasters caused by persistent heavy precipitation weather not only bring huge economic loss but also pose serious threats to people’s lives every year. Extreme climate changes under the control of unstable monsoon circulation have led to frequent flooding in recent years, which triggers a series of urban flooding, flash floods, and river breaches [1,2].
In the era of big data for earth observation, massive amounts of satellite data show great promise for real-time flood mapping. Without field investigation, satellite-based Synthetic Aperture Radar (SAR) sensors can obtain a wide range of disaster situations in a short time [3]. Especially, the Sentinel-1 data, which has a short revisit cycle and can be downloaded online for free, has greatly promoted the application of SAR images in disaster monitoring [4]. Flood disasters are often accompanied by cloudy and rainy weather, in which case SAR sensors can also provide thorough surface observation in comparison with traditional optical sensors [5]. Thus, it is of significant importance to use SAR images for real-time monitoring and disaster assessment of floods [6,7,8].
The segmentation algorithm is an effective method for automatic interpretation of SAR images. Traditional image segmentation algorithms based on thresholding, clustering, level set and edge detection can extract targets quickly. However, meeting the requirements of disaster assessment is difficult since they are vulnerable to the inherent coherent speckle noise of SAR images and the complex environment [9,10]. Traditional segmentation algorithms try to use a certain fixed mapping relationship to divide the categories of pixels in SAR images. Nevertheless, in order to deal with the inherent speckle noise in SAR images, many parameters in traditional algorithms need to be modified repeatedly, which leads to the lack of flexibility of these algorithms. With the continuous development of deep learning technology and GPU hardware, deep learning has been applied to SAR image segmentation tasks in more and more studies in recent years.
By virtue of its powerful feature learning ability, Convolutional Neural Network (CNN) has achieved promising results in tasks such as semantic segmentation and target detection of SAR images [11,12,13]. Due to the multi-layer structure, CNN can automatically extract multi-level image features. The shallow layers are able to capture more intuitive image features, while the deep layers can extract more abstract features. The multi-layer features in SAR images extracted by convolutional layers are helpful for water segmentation and object classification [14]. In [15], CNN is employed to segment water bodies in different scenarios: mountain lakes, plain lakes, wide rivers and narrow rivers, and experimental results show that the performance of CNN is much better than traditional algorithms such as OTSU and SVM. Representative deep learning models for segmentation, including U-Net, Fully Convolutional Network (FCN) and High Resolution Network, are also utilized to perform water segmentation [16]. In [17], H-A- polarimetric decomposition is integrated with FCN to exploit the polarimetric information in PolSAR images. The salient issue of SAR image flood detection is the accurate localization and maintenance of water boundaries. However, when current CNNs are directly applied to complex SAR image segmentation, it is easy to cause edge blurring and visual degradation of segmentation results [18]. In order to effectively preserve the edge structure of the water body, the conditional random field model is adopted in the U-Net [18]. Meanwhile, the extraction of multi-scale features is an important approach to improving the accuracy of edge location. In [19], the multi-scale joint prediction was introduced into DeeplabV3+, which could not only achieve accurate identification of water body details but also improve the generalizability of the model. To overcome the inherent limitation that the convolution operation in CNN cannot access the global information of the image [20,21], Long Short-Term Memory (LSTM) and Recurrent Neural Network (RNN) have also been introduced for SAR image detection and segmentation [22,23]. These methods improve the capability of contextual information retrieval by learning long-range spatial dependencies to some extent but greatly increases the complexity of models and the difficulty of training. In addition, most related studies ignore the structural features of water embedded in multi-polarization (cross-polarization and co-polarization) SAR images [24]. Due to the influence of other dark surfaces (such as asphalt roads) and radar shadows in SAR images, flood detection from single-polarization SAR images is difficult. However, multi-polarization SAR images can provide more information about water body properties. Furthermore, rough water surfaces may be blanketed in copolarization SAR data, whereas cross-polarization SAR data can still provide water evidence [25]. In [17], H-A- polarimetric decomposition is integrated with FCN to exploit the polarimetric information in PolSAR images, with an overall accuracy rate of up to 95%. The segmentation accuracy is improved by the polarimetric decomposition of PolSAR images, but polarimetric decomposition instead of direct application of multi-polarization SAR data increases the complexity of the detection process. As far as flood detection in SAR images, multi-polarization features and more contextual information are both required to guide the prediction of local water pixels in the case of complex scenes. Thus, it is still a challenge to develop a network that can efficiently exploit the structure features of water embedded in multi-polarization SAR data.
According to the above-mentioned analysis, this study aims to develop a deep learning method to improve the accuracy of flood detection in dual-polarization SAR images. Firstly, the SAR-BM3D algorithm based on the nonlocal approach is used for speckle noise suppression. Meanwhile, two-level image enhancement operation is adopted to further improve the identifiability of targets in SAR images. Then, multi-scale Deeplab (MS-Deeplab) for flood detection in dual-polarization SAR images is constructed based on a lightweight MobileNetV2 backbone and the classic DeeplabV3+. In MS-Deeplab, the dual-channel backbone is designed to train dual-polarization SAR images, and a multi-scale feature fusion module is introduced in the backbone to concatenate the multi-layer features of SAR images. Last but not least, a joint loss function based on cross-entropy and a dice coefficient is constructed to improve the generalization ability of the model. Finally, the final flood detection results are obtained by the difference method for time series of SAR images. In summary, the main contributions of this paper are as follows:
- An improved MS-Deeplab is proposed for flood detection in dual-polarization (VV and VH polarization) SAR images. The novel MS-Deeplab model can directly make full use of dual-polarization characteristics of water to realize the accurate detection of a flood.
- A dual-channel backbone based on MobileNetV2 is designed to fuse dual-polarization information of SAR images. The dual-polarization (VV and VH polarization) SAR images are separately trained by the dual-channel backbone, and the training parameters obtained from two channels are weight fused to compensate for the limitations of feature extraction from single-polarization data, which is helpful to enhance the structural features of water bodies.
- A more effective multi-scale feature fusion module is introduced to concatenate multi-layer features in the backbone and enrich the representation ability of water features. Under the guidance of more contextual information, the ambiguities of local prediction can be resolved to accurately segment the water body pixels.
- A joint loss function is constructed based on cross-entropy and a dice coefficient to deal with data imbalance, which can reduce the risk of overfitting caused by a large range of background pixels.
The remainder of this paper is organized as follows. In Section 2, related work in this paper, including MobileNetV2 and DeeplabV3+, is briefly introduced. In Section 3, the research data are presented. In Section 4, the flood detection method is proposed in detail. The experimental results based on time series of SAR images are presented in Section 5. The discussion of experimental results is provided in Section 6. Finally, the whole paper is concluded in Section 7.
2. Related Work
During the past few years, water body segmentation in SAR images based on CNNs has achieved great success. Recently, the representative models of segmentation benchmarks are FCN, U-Net and Deeplab series. In Deeplab series, DeeplabV3+ can pay attention to more contextual information in the huge remote sensing background due to the atrous convolution. Meanwhile, the result of segmentation can be refined by the improved decoder in DeeplabV3+, which is helpful in accurately locating the boundary of water bodies. Thus, an improved MS-Deeplab model is constructed for flood detection based on the framework of DeeplabV3+ in this paper. Considering the efficiency of MobileNetV2 during feature extraction, the lightweight MobileNetV2 is used as the backbone for water feature extraction. In this section, related works, including MobileNetV2 and DeeplabV3+, are briefly reviewed as below.
2.1. MobileNetV2
The lightweight MobileNetV2 network is an efficient and powerful feature extractor for real-time operation. Depth-wise separable convolution and the inverted residual with a linear bottleneck are both adopted in MobileNetV2 [26], which can reduce the number of parameters and speed up the convergence rate while retaining the accuracy. Therefore, for large amounts of SAR data, MobileNetV2 can quickly and accurately extract water features. In comparison with a standard convolution, a depth-wise separable convolution is factorized into a depth-wise convolution and a point-wise convolution. In the depth-wise separable convolution, the depth-wise convolution performs lightweight filtering with a single convolutional filter for per input channel, while a point-wise convolution builds new features by computing linear combinations of channels. As shown in Figure 1, the residual block with a linear bottleneck in MobileNetV2 consists of a convolutional layer, a depth-wise separable convolutional layer and another convolutional layer. If the stride of the depth-wise separable convolution in the residual block is set to 1, the input feature map is no longer down-sampled, and the input and output of the block are added element by element. The benefit from the above operation is that the computation complexity of MobileNetV2 is drastically reduced.
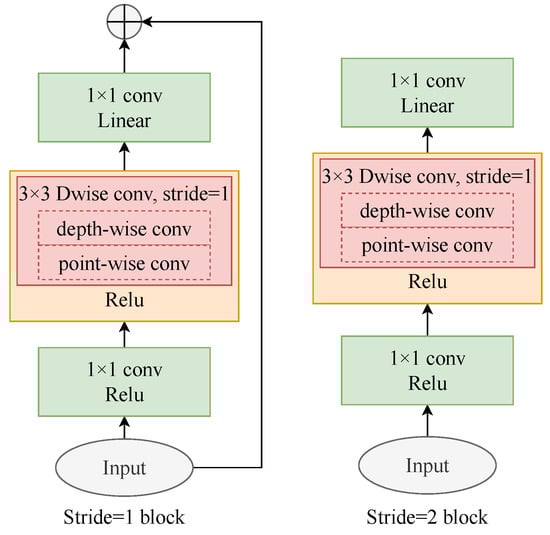
Figure 1.
The schematic diagram of residual blocks with a linear bottleneck in MobileNetV2. ⊕ denotes element-wise addition, and Dwise conv represents depth-wise separable convolution.
As shown in Table 1, for the fragmented SAR image patches of 512 × 512 pixels, the MobileNetV2 backbone adopted in this paper is composed of a convolution layer and 16 residual bottleneck layers. In each line of Table 1, the same layer is repeated n times, c denotes the output channels of each operator, s denotes the stride of the first layer in each operator and the stride of the other layers in each bottleneck is set to 1. Finally, the size of output feature map is 32 × 32 pixels in our experiment.

Table 1.
The structure of MobileNetV2 used in this paper.
2.2. DeeplabV3+
The Deeplab series is one the most effective segmentation models, and DeeplabV3+ is honored as a new peak in the field of image segmentation. Compared with the previous version of Deeplab series, a simple yet effective decoder module is introduced to gradually recover the spatial information captured by the backbone and refine the segmentation results. The Atrous Spatial Pyramid Pooling (ASPP) module is also introduced in the encoding–decoding structure of DeeplabV3+ to obtain image feature information of more scales. Recently, DeeplabV3+ has been widely used in remote sensing image segmentation such as water extraction and ship image segmentation, apart from natural scene segmentation [27,28].
The schematic diagram of DeeplabV3+ is presented in Figure 2 [29]. The encoder–decoder structure of DeeplabV3+ has shown great prospects in various computer vision tasks [30,31]. In the encoder module shown in Figure 2, a Deep Convolutional Neural Network (DCNN) gradually down-samples feature maps and captures complex semantic features. Additionally, ASPP at the end of the encoder probes convolutional features at different scales. During the upsampling process of the decoder module, a 3 × 3 convolutional layer is adopted to refine the semantic features.
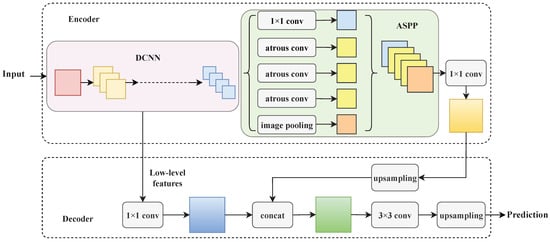
Figure 2.
The schematic diagram of DeeplabV3+.
Compared with the traditional linear model, ASPP at the end of the backbone expands the receptive field of the convolutional kernel by adopting parallel atrous convolution with different dilation rates [32]. Assuming a convolution kernel w, for each location i, the output feature map y is given as follows:
where x represents the input feature map, r denotes the expansion rate. Thus, the encoder module in DeeplabV3+ is able to learn richer semantic information, which is helpful in capturing the contextual information in large-scene SAR images.
In order to reduce the loss of spatial information in the backbone, shallow features of the DCNN are fused with the output of the encoder in DeeplabV3+. As shown in Figure 2, the feature maps captured by the encoder are divided into two parts. One part is the output of ASPP, and the other part is low-level features from DCNN. In the decoder module, the two parts are concatenated to enhance detailed features and spatial information. In this paper, the DCNN is replaced with the lightweight MobileNetV2 to extract water features accurately and quickly.
3. Materials
3.1. Study Data and Area
In this paper, Sentinel-1A Ground Range Detected (GRD) products provided by the Scientific Data Hub of the European Space Agency (ESA) are used to validate the effectiveness and reliability of the proposed method. Sentinel1 data products are made available systematically and can be downloaded from the Alaska Satellite Facility (https://search.asf.alaska.edu/, accessed on 3 March 2022 ). Sentinel-1A is an active microwave remote sensing satellite, launched by ESA in April 2014. The Sentinel-1 constellation offers a continuity of wide area coverage, achieving higher resolution and global coverage over landmasses. The C-band SAR instrument operating at a center frequency of 5.405 GHz supports operation in dual polarization implemented through one transmit chain (switchable to H or V) and two parallel receive chains for H and V polarization.
The study areas are related to the regions near the Anyang River and Xinxiang City, Henan Province, China. Anyang, located in the north of Henan province and lying at the junction of Henan, Shanxi and Hebei provinces, is one of the eight ancient capitals of China, a national famous historical and cultural city, as well as an excellent tourist city of China. It is really worthy of its reputation for being an imperial capital 3000 years ago. Xinxiang, the political, economic, cultural and traffic center of Northern Henan province, has often suffered from floods throughout history due to the low-lying terrain. On 20 July 2021, Henan suffered a large-scale extreme heavy rainfall, leading to a serious flood disaster. In view of the important geographical locations of Anyang and Xinxiang and the huge impact on flood disasters, parts of the two cities are selected as the study areas in this paper. Image locations of the study areas are shown in Figure 3, and the SAR image information is presented in Table 2.
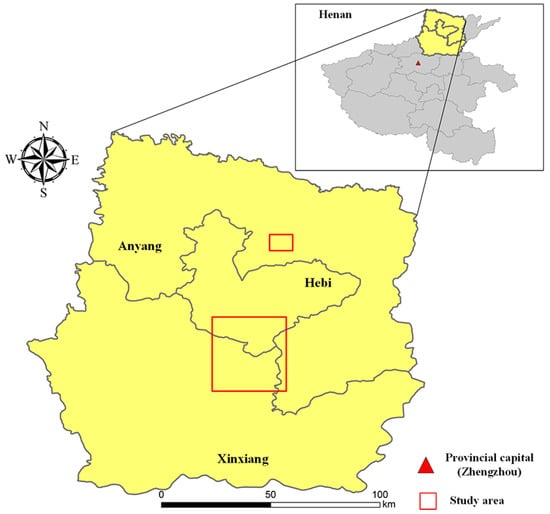
Figure 3.
Locations of study areas.
Table 2.
Parameters of the Sentinel-1A SAR image used in the experiment.
3.2. SAR Image Pre-Processing
The Sentinel-1A data were firstly pre-processed on the Sentinel Application Platform software provided by ESA. The pre-processing of dual-polarization SAR images mainly consists of: (1) Orbit file application, (2) image alignment, (3) radiometric calibration, (4) geocoding.
In order to reduce the brightness differences of time series of SAR images acquired at different times, a brightness equalization operation is adopted as follows:
where x represents the amplitude before image correction, y represents the amplitude after image correction, N is the number of scenes of the time series SAR images, mean(·) denotes the amplitude average of a SAR image, and represents the amplitude of the ith scene image.
Then, the speckle noise suppression and image enhancement are performed to improve the accuracy of subsequent segmentation. Due to the coherent imaging mechanism of SAR, coherent speckle noise inevitably exists in SAR images, which is manifested by the presence of randomly scattered bright pixels in the homogeneous regions. Thus, the backscattering coefficient of the object cannot be correctly reflected in SAR images, and the fine structure of the SAR image is easy to be covered. In addition, the areas with low contrast in SAR images may seriously affect interpretation and readability [33].
In order to reduce the interference of speckle, the SAR-BM3D algorithm is performed in the pre-processing of SAR images. Based on the nonlocal approach and wavelet domain shrinkage, SAR-BM3D algorithm consists of two main steps [34]. As shown in Figure 4, in the first step, a basic estimation , and the statistics are generated for the subsequent Wiener filtering. Then, the actual despeckling is carried out in the second step based on the estimated results generated by the first step. Both steps are carried out by the following operations: grouping, collaborative filtering and aggregation. In the implementation process, there exist some differences between the two steps.
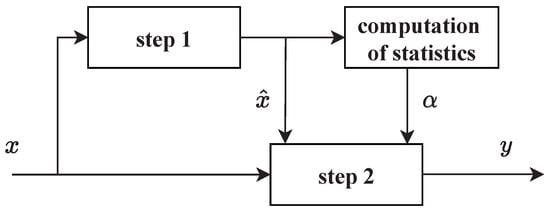
Figure 4.
The schematic diagram of the SAR-BM3D algorithm. x denotes the input image, and y denotes the filtered image.
For the first step, in the grouping operation, the most similar target blocks in the L-look SAR image are clustered into a 3D stack according to the following distance criterion [33]
where d denotes the similarity, and and represent the block centered on s and t, respectively, represents the amplitude, and k is used to scan the block. The collaborative filtering of the clustered 3D stack is carried out by wavelet shrinkage and inverse wavelet shrinkage. In the aggregation operation, all filtered blocks are returned to their original positions through a weighted average.
For the second step, the blocks are located based on the pilot generated in the first step. Each clustered 3D stack undergoes wavelet shrinkage, Wiener filtering, and inverse transform. Finally, the aggregation operation is the same as that in the first step.
Finally, a two-level image enhancement operation is introduced for analysis convenience. As shown in Figure 5, the histogram equalization and logarithmic transformation are both adopted to improve the contrast of filtered SAR images in the two-level image enhancement operation. Since an SAR image is generally dark overall, the components of its histogram are mostly concentered on the low side of the image amplitude. The histogram equalization operation can extend the histogram of SAR images and effectively enhance the image contrast by redistributing the image element values [35]. In order to further enhance the details of the water region and the edges with lower gray values that are easily obscured, the image amplitude is extended again by logarithmic transformation. The two-level image enhancement operation in this paper, based on histogram equalization and logarithmic transformation, is beneficial to improve the accuracy of subsequent SAR image detail and edge interpretation to a certain extent.
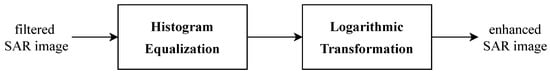
Figure 5.
The two-level image enhancement operation.
3.3. Generation of Dataset
The flood detection training dataset is generated based on Sentinel-1A VV and VH polarization SAR images. In order to obtain the comprehensive and accurate ground truth, the SAR images are labeled manually according to Google Earth on the Labelme software. Then, both training SAR images and the ground truth are cropped into a common size of 512 × 512 pixels.
The testing dataset is generated based on the time series of Sentinel-1A SAR images related to the regions near Anyang River and Xinxiang City. The sizes of SAR images for Anyang River and Xinxiang City are 2048 × 1024 pixels and 5120 × 5120 pixels, and all of the testing SAR images are also cropped into a common size of 512 × 512 pixels.
4. Methodology
4.1. Overview
The flowchart of the proposed flood detection method is presented in Figure 6. After the data acquisition and SAR image pre-processing, the dual-polarization Sentinel-1A SAR images are fed into the proposed MS-Deeplab model. The proposed MS-Deeplab model is mainly divided into four parts. In the part of the encoder, a dual-channel backbone (MobileNetV2) is constructed to extract water features from dual-polarization SAR images. In the second part, a multi-scale feature fusion module is introduced to concatenate multi-level feature maps, which is able to obtain richer semantic information and more contextual information. In part of the decoder, the aggregated feature maps from the output of the encoder and the multi-scale feature fusion module are subjected to convolution and upsampling operations to refine the water segmentation results. Subsequently, a joint loss function is obtained by comparing the ground truth and the prediction results. Finally, based on the water extraction results, the flood detection results for time series of SAR images of study areas can be obtained by the difference method.
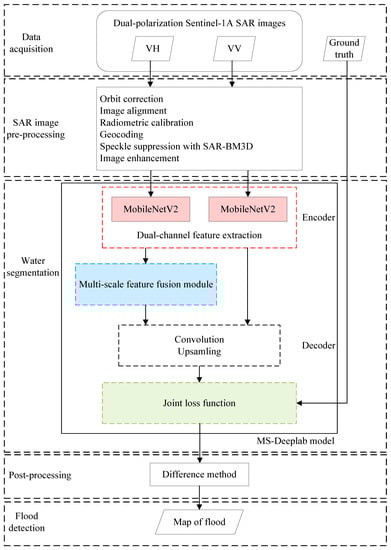
Figure 6.
The flowchart of the proposed flood detection method.
4.2. The Proposed MS-Deeplab Model
As a new peak in the field of semantic segmentation, the encoding–decoding architecture in DeeplabV3+ can extract spatial information and refine segmentation results when recovering semantic features. However, the original DeeplabV3+ model is designed to process close-range images and natural scene segmentation and is not suitable to directly segment SAR images. SAR images contain less information than color images, and color features are one of the primary features for discriminating objects [36]. Furthermore, blurred edges and low contrast make it difficult to detect floods directly in SAR images.
In large-scene SAR images, extensive connected water bodies and isolated tiny water bodies exist together, and the boundaries of flooded areas are usually blurred. These characteristics put higher requirements on the detection accuracy and applicability of the segmentation model. Combining the dual-polarization features of SAR data and the multi-scale water features in large-scene SAR images, MS-Deeplab based on the DeeplabV3+ architecture is constructed to be applicable to flood detection in SAR images in this work. Firstly, the dual-channel feature extraction backbone (MobileNetV2) is constructed to capture the features of dual-polarization SAR images, and the model parameters of VH-polarization channel and VV-polarization channel are weight-fused to enhance the structural characteristics of water areas. Then, a multi-scale feature fusion module is introduced to fuse the output of the encoder with the multi-layer features of the backbone in the channel dimension. Finally, a joint loss function based on cross-entropy loss and dice loss is constructed to improve the generalization performance of the model. The schematic diagram of the proposed MS-Deeplab model is shown in Figure 7.
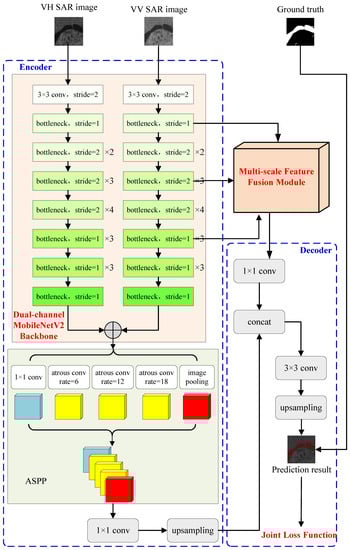
Figure 7.
The schematic diagram of the proposed MS-Deeplab model.
4.2.1. Dual-Channel Feature Extraction Backbone
Considering the lack of color information in SAR images, in the encoder module, the lightweight MobileNetV2 network is adopted as the backbone to extract the limited features from SAR images. The depth-wise separable convolution and the inverted residual in the MobileNetV2 structure can speed up the convergence rate while retaining the high-dimensional features. Additionally, in order to maintain small-scale water bodies in SAR images, down-sampling is implemented only three times after the first convolutional layer in the backbone.
Usually, only single-polarization SAR data are used in previous studies based on deep learning [24]. This ignores the different characteristics of co-polarization and cross-polarization in SAR images and easily leads to the incomplete extraction of complex waters. Compared with single-polarization SAR data, multi-polarization SAR images contain richer target features since the backscatter coefficient of the target is a function of the radar frequency, polarization mode, etc. [37]. Rough water surface may be covered in co-polarization SAR images, while water features can still be revealed in cross-polarization SAR images [38]. In addition, shallow water is hard to segment due to the albedo of the underlying substrate and the mixed spectral response from the water, and other dark surfaces, such as asphalt roads and radar shadows caused by tall buildings and trees, are major obstructions of accurate flood detection [39,40]. In such case, it is difficult to accurately detect floods with single-polarization SAR data, while the rich water features in multi-polarization SAR data are helpful in reducing detection errors. Therefore, a dual-channel feature extraction backbone is constructed in the model in order to improve the ability to capture water features from dual-polarization SAR data. Dual-polarization (VV, VH) SAR images are separately trained by the dual-channel backbone, and the parameters are merged with the linear weighting as follows:
where and represent the two channel parameters, and m and n denote weighted values. In this work, m and n are both set to 0.5. This operation makes the best use of the dual-polarization information and enhances the structural characteristics of water areas.
4.2.2. Multi-Scale Feature Fusion
CNNs are constructed by stacking convolutional and pooling layers, and each layer of CNNs can contribute to image understanding [31]. The features of objects consisting of only low-level features are clustered in the shallower layers of the network, while the features of objects with high-level features are clustered in the deeper layers. In a CNN, deep feature maps containing more semantic information help in category prediction, and shallow feature maps containing more image spatial information help in the generation of fine boundaries. Thus, multi-scale features can obtain different scales of the targets, which should be highly considered in many computer vision tasks [41,42]. However, the model generally has difficulty in reaching a balance between classification accuracy and edge localization as the depth of the network increases. Due to the loss of some feature information, a single output feature map can lead to the missing detection of tiny water bodies in large-scene SAR images with water areas of different sizes. Although ASPP in the original DeeplabV3+ can obtain features at different scales with atrous convolution from the last convolutional layer, it cannot make effective use of shallow features and loses the continuity of features due to the grid effect. Since the low-level feature spectrum (high-resolution) is conducive to generating fine boundaries while the high-level feature spectrum (low-resolution) is conducive to category prediction, an effective multi-scale feature fusion module is introduced into the backbone to further expand the feature space of the proposed MS-Deeplab model. A schematic diagram of the multi-scale feature fusion module introduced in this paper is shown in Figure 8.
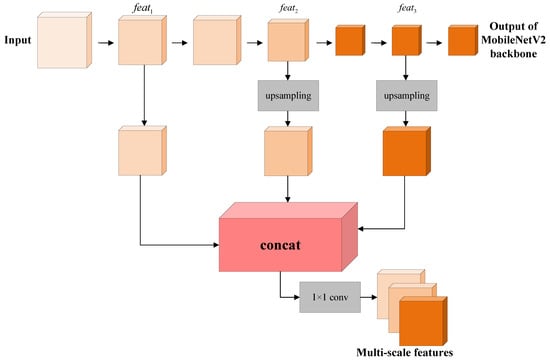
Figure 8.
The schematic diagram of multi-scale feature fusion module.
Compared with the single output of the linear model, multi-scale feature output of the backbone can compensate for the low resolution of high-level features. In the multi-scale feature fusion module shown in Figure 8, feature maps (, , ) from three layers are concatenated together to generate a combined feature that contains richer and more discriminative water features, and multi-scale water features obtained by connecting the features of multiple convolutional layers can enhance the representation ability of MS-Deeplab. By fusing the features of different depths in the backbone, both high-dimensional features and low-dimensional features are taken advantage of to obtain a larger range of contextual information. The series of operations are beneficial to accurately detect water bodies of different scales. Here, the three feature maps are 1/2, 1/4, 1/16 times the input SAR image, respectively. In this module, no operations are performed on ,and and from two deeper layers are upsampled by a factor of two and eight, respectively, to obtain the same scale as . Then, , and are concatenated in the channel dimension by the concat operation. Subsequently, a convolution operation is performed after the concat operation to reduce the number of channels. The obtained multi-scale features can be used in the subsequent decoder to improve the accuracy of the prediction. The ambiguities of local pixel prediction can be resolved under the guidance of contextual information from multi-scale features. Meanwhile, larger-scale feature maps in shallow layers are helpful for the localization of fine boundaries and the segmentation of small water bodies. As a result, the multi-scale feature fusion module shown in Figure 8 can accurately segment the high-dimensional semantics while making full use of the low-dimensional details and texture information.
4.2.3. Joint Loss Function
In order to deal with the imbalanced categorical distribution in the training dataset and improve the generalization ability of the proposed model, a joint loss function is constructed based on cross-entropy loss and dice loss in this work.
In the semantic segmentation task, cross-entropy loss refers to the contrast between the ground truth and the prediction of pixels [43], which is defined as:
where N represents the number of pixels, denotes the ground truth of a pixel, and denotes the prediction of a pixel. Since the pixel-wise error is calculated equally for each pixel, cross-entropy loss may lead to the over-representation of a larger background and reduce the generalization performance of the model.
Dice loss is used to evaluate the similarity between two samples based on the dice coefficient, which is defined as:
where X represents the ground truth, and Y represents the prediction. In the binary classification task, assuming that 0 represents the background and 1 represents the target, pays more attention to the target if , which can weaken the class imbalance [44].
Considering that water segmentation in SAR images is a task with highly imbalanced classes, where there are far more background pixels than water pixels, the joint loss function L in this paper is constructed by
5. Results
In this section, Level-1 GRD products in VV and VH channels are used to test the performance of the proposed method. Figure 9 and Figure 10 present the tested time series of Sentinel-1A images related to the regions near Anyang River and Xinxiang City in Henan Province, China. It can be seen that the edges of the flood area in the two tested regions are both blurred. The complex terrain features of tested regions present a great challenge for detecting the water bodies accurately.
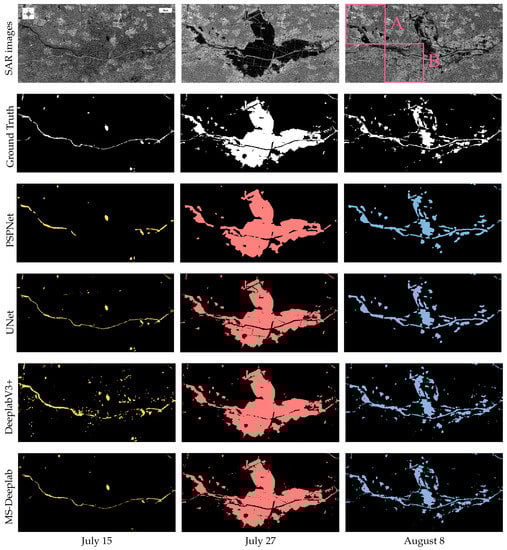
Figure 9.
Time series of SAR images and segmentation results of the area near Anyang River. The first row is the time series of SAR images. The second row is the ground truth. The third row is the segmentation results generated by PSPNet. The fourth row is the segmentation results generated by UNet. The fifth row is the segmentation results generated by DeeplabV3+. The sixth row is the segmentation results generated by the proposed MS-Deeplab model.
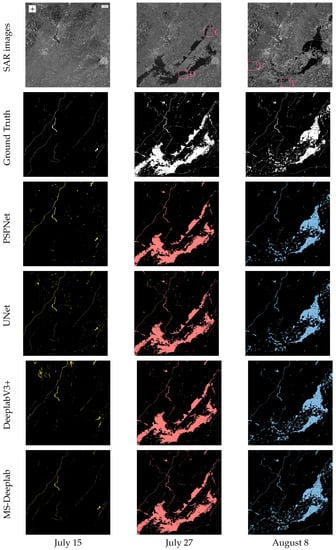
Figure 10.
Time series of SAR images and segmentation results of the area near Xinxiang City. The first row is the time series of SAR images. The second row is the ground truth. The third row is the segmentation results generated by PSPNet. The fourth row is the segmentation results generated by UNet. The fifth row is the segmentation results generated by DeeplabV3+. The sixth row is the segmentation results generated by the proposed MS-Deeplab model.
The proposed MS-Deeplab model in this paper and other mainstream deep learning methods, including PSPNet [45], UNet [46] and original DeeplabV3+, are used to extract the water bodies before and after the flood. All of these models adopt MobileNetV2 as the backbone. The experiments are carried out based on PyTorch Library, accelerated by Tesla A100 GPU in this work. In order to avoid the impact of hyper-parameters on the experimental results, hyper-parameters in the proposed MS-Deeplab model and other models are configured uniformly as follows: initial learning rate , batch size 5, epoch 300 and optimizer Adam.
The segmentation results generated by different methods are presented in Figure 9 and Figure 10. For a 512 × 512 pixel SAR image, the inferring time of the proposed MS-Deeplab mode is 26 ms on 2060 MAX-Q GPU. The segmentation results on 15 July show that only strip rivers and lakes are detected in the two regions. On 27 July, after the rainstorm, the detection results directly reflect that the rainstorm caused large areas to be submerged. After several days, most of the floods in the affected areas have faded, and the flood situation has stabilized, but relatively dense isolated water bodies can still be detected. As shown in Figure 9 and Figure 10, the proposed MS-Deeplab model can not only locate the water bodies but also maintain the weak edges of complex water bodies better overall.
In order to further verify the effectiveness and accuracy of the proposed method, six typical regions enclosed by red rectangles in Figure 9 and Figure 10 are enlarged in Figure 11. The segmentation results of six typical regions A-F generated by the proposed MS-Deeplab model and other mainstream deep learning methods are also enlarged in Figure 11. The first column is the SAR images, and the second column is ground truth, where white represents the water body and black represents the background. The water bodies in six selected representative SAR images are all complex. As shown in Figure 11, there exist blurred boundaries, tiny water bodies and isolated land, which greatly increases the difficulty of water body detection. Comparing the ground truth with the detection results generated by various methods, PSPNet has poor adaptability to complex scenes. It not only misses many isolated tiny water bodies but also fails to detect the background pixels in the water bodies. Compared with PSPNet, UNet improves the detection ability of tiny water bodies but is less resistant to interference in complex scenes. Though DeeplabV3+ has improved the detection accuracy in comparison with the former two, it is poor at maintaining strip water bodies. It can be seen that the boundaries of the water bodies detected by the proposed method are accurately maintained even in blurred water bodies. In addition, MS-Deeplab is more sensitive to tiny and strip waters and is less susceptible to interference in complex scenes. Comparing the experimental results in Figure 11, the water bodies detected by MS-Deeplab become closer to the ground truth since the proposed MS-Deeplab model can make better use of contextual information and multi-scale feature maps. Further, for regions A-F, the comparison between the ground truth and the results generated by MS-Deeplab is presented in Figure 12 to better visualize its successes and possible errors. As shown in Figure 12, MS-Deeplab can accurately detect both large-scale water bodies and isolated water bodies and is less sensitive to noise in the water area. However, due to the complexity of the land cover and imaging characteristics of SAR images, such as edge blur, radar shadow and interference of other dark surfaces, there are still some deviations in the segmentation results generated by MS-Deeplab, especially in ambiguous areas. The improvement of detection accuracy is still worthy of research and investigation in the future.
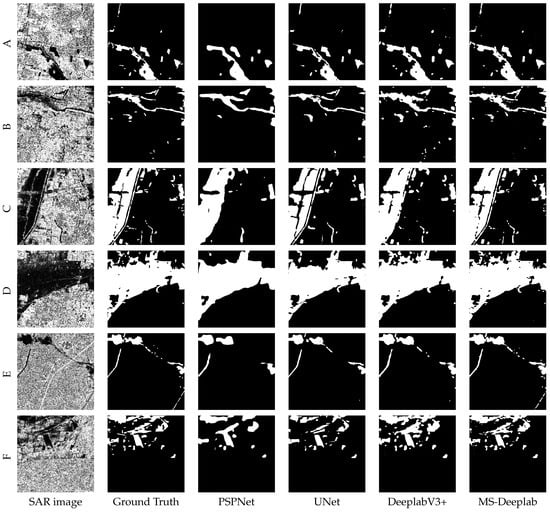
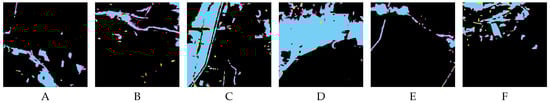
Figure 12.
The comparison between the ground truth of regions (A–F), and the results generated by MS-Deeplab. Yellow denotes omission errors, red denotes commission errors and blue denotes correctly classified water bodies.
Based on the confusion matrix shown in Table 3, the intersection over union (IoU) and the pixel accuracy (PA) are both adopted to quantitatively evaluate the performance of the proposed method in this section, which are calculated by
where true positive (TP) indicates the number of water body pixels that are correctly predicted, false negative (FN) indicates the number of water body pixels that are incorrectly predicted as background, false positive (FP) indicates the number of background pixels that are incorrectly predicted as water body, and true negative (TN) indicates the number of background pixels that are correctly predicted. For the six typical regions, the IoU and PA of segmentation results generated by different methods are shown in Table 4. It can be seen that MS-Deeplab achieves the highest accuracy, with an average IoU score of 86.33% and an average PA score of 95.72%, i.e., the proposed MS-Deeplab model is effective and robust in these complex scenes.
Table 3.
The confusion matrix.
Table 4.
Evaluation of segmentation results by different methods.
Based on the segmentation results generated by MS-Depplab in Figure 9 and Figure 10, the more intuitive flood change results obtained with the difference method are represented in Figure 13. Then, the flood situation in the area near the two cities is obtained by overlaying the flood change detection results with SAR images. On both sides of the Anyang River, large areas of farmland and villages were flooded on 27 July. In the area near Xinxiang City, several towns along the Weihe River basin were seriously affected by rainstorms. Among them, Huaxian County, Weihui and Xinxiang were the heavy disaster areas. Even when the flood situation had been stable on 8 August, most of the urban areas in Huaxian County were still flooded. The analysis results show that the MS-Deeplab model proposed in this paper is a powerful method in SAR flood mapping.
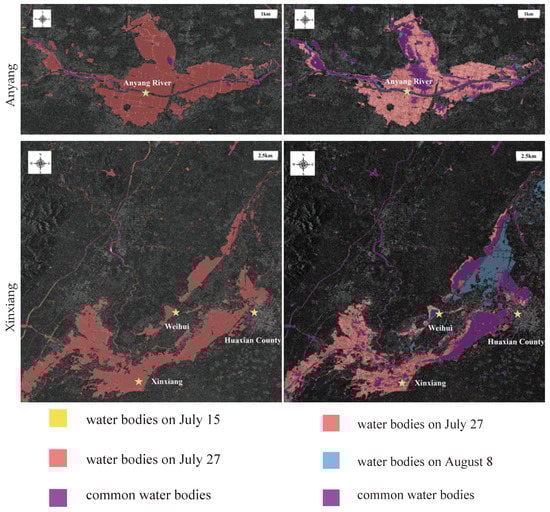
Figure 13.
The color-coded maps of flood detection results. The first column shows the change maps between 15 July and 27 July. The second column shows the change maps between 15 July and 8 August.
6. Discussion
In this work, an MS-Deeplab model is proposed to study the flood detection in dual-polarization SRA images. In the proposed MS-Deeplab model, the dual-polarization SAR images are directly exploited in the dual-channel MobileNetV2 backbone, and the information on VV and VH polarization can be quickly and efficiently extracted to enhance water features. Meanwhile, the multi-scale feature fusion module concatenates multi-layer features of backbone to expand the feature space and obtain the contextual information. Furthermore, the joint loss function is introduced to handle the class imbalance in the training set. The experimental results indicate that the proposed MS-Deeplab is an effective model for water body detection in SAR images and, even in complex scenes, benefit from all of the three key points.
Of course, there are still limitations and shortcomings in this work. On the one hand, some errors still exist in the experimental results. The problem is mainly caused by the influence of other dark surfaces and radar shadows in SAR images, as well as the complexity of land cover. For example, in urban areas, the dark surfaces (such as asphalt roads) and radar shadows caused by tall buildings will be misclassified as water bodies. Furthermore, rough water surfaces and shallow waters in SAR images will be blanketed. On the other hand, real-time detection is also a key point in SAR image interpretation. As polarimetric SAR images tend to be massive and have high resolution, higher requirements are placed on the efficiency of detection. In future work, further research will be continued to improve the accuracy of segmentation in more complex environments. Moreover, model compression, including model pruning and knowledge distillation, will be considered to improve the efficiency of the detection algorithm.
7. Conclusions
In this paper, a flood detection method is proposed based on the constructed MS-Deeplab model. The proposed MS-Deeplab model introduces the dual-channel feature extraction backbone and the multi-scale feature fusion module to improve the accuracy of water segmentation. The dual-channel feature extraction backbone can make full use of dual-polarization information of SAR images to compensate for the limitations of feature extraction from single-polarization data. The multi-scale feature fusion module can construct high-resolution feature maps by concatenating multi-layer feature maps to improve the capacity to capture contextual information and detailed features of large-scene SAR images. Therefore, the architecture of MS-Deeplab greatly improves the ability of feature extraction and contextual information fusion. Additionally, the proposed MS-Deeplab model is able to cope with imbalanced water and background to some extent by constructing a joint loss function based on cross-entropy loss and dice loss. The experimental results show that MS-Deeplab can not only improve the pixel accuracy but also improve the boundary accuracy even in complex scenes in comparison with other mainstream deep learning methods. Since the proposed method for flood detection has a stronger generalization ability and robustness, as well as higher accuracy, it has great potential in flood disaster assessment and post-disaster reconstruction.
Author Contributions
Conceptualization, H.S.; methodology, H.W.; software, H.W.; validation, H.W.; formal analysis, H.Z.; investigation, H.W.; resources, H.S.; data curation, R.Z. and J.C.; writing original draft preparation, H.W.; writing—review and editing, H.W., H.S., and X.T.; visualization, J.H.; supervision, M.H. and Z.Q.; project administration, H.S. and H.Z.; funding acquisition, H.Z. All authors have read and agreed to the published version of the manuscript.
Funding
This research was funded jointly by the National Natural Science Foundation of China grant number 62101167, 61906055 and 61901149, the National Natural Science Foundation of Zhejiang Province grant number LQ20D010007, the Foundation of National Defense Key Laboratory grant number JKWATR-210202 and Foundation of Science and Technology on Sonar Laboratory grant number 6142109KF201807.
Data Availability Statement
All data presented in this study are available.
Acknowledgments
The authors would like to thank the ESA for providing the time series of Sentinel-1A SAR data.
Conflicts of Interest
The authors declare no conflict of interest.
References
- Huang, M.; Jin, S. Rapid Flood Mapping and Evaluation with a Supervised Classifier and Change Detection in Shouguang Using Sentinel-1 SAR and Sentinel-2 Optical Data. Remote Sens. 2020, 12, 2073. [Google Scholar] [CrossRef]
- Manavalan, R. SAR image analysis techniques for flood area mapping-literature survey. Earth Sci. 2017, 10, 1–14. [Google Scholar] [CrossRef]
- Fang, Z.; He, L.; Hu, L.; Tuo, T. Developing Geospatial Web Services for Automatic Flood Mapping Using Sentinel-1 Images. In Proceedings of the 2021 International Conference on Agro-Geoinformatics, Shenzhen, China, 26–29 July 2021; pp. 1–5. [Google Scholar]
- Cao, H.; Zhang, H.; Wang, C.; Zhang, B. Operational Built-Up Areas Extraction for Cities in China Using Sentinel-1 SAR Data. Remote Sens. 2018, 10, 874. [Google Scholar] [CrossRef]
- Yang, H.; Pan, B.; Li, N.; Wang, W.; Zhang, J.; Zhang, X. A Systematic Method for Spatio-Temporal Phenology Estimation of Paddy Rice Using Time Series Sentinel-1 Images. Remote Sens. Environ. 2021, 259, 112394. [Google Scholar] [CrossRef]
- Zhang, H.; Qi, Z.; Li, X.; Chen, Y.; Wang, X.; He, Y. An Urban Flooding Index for Unsupervised Inundated Urban Area Detection Using Sentinel-1 Polarimetric SAR Images. Remote Sens. 2021, 13, 4511. [Google Scholar] [CrossRef]
- Krishna Vanama, V.S.; Rao, Y.S. Change Detection Based Flood Mapping of 2015 Flood Event of Chennai City Using Sentinel-1 SAR Images. In Proceedings of the 2019 IEEE International Geoscience and Remote Sensing Symposium, Yokohama, Japan, 28 July–2 August 2019; pp. 9729–9732. [Google Scholar]
- Vassileva, M.; Nascetti, A.; GiulioTonolo, F.; Boccardo, P. Unsupervised Flood Extent Detection from SAR Imagery Applying Shadow Filtering from SAR Simulated Image. In Proceedings of the 2015 IEEE International Geoscience and Remote Sensing Symposium, Milan, Italy, 26–31 July 2015; pp. 2707–2710. [Google Scholar]
- Shi, Q.; Liu, M.; Li, S.; Liu, X.; Wang, F.; Zhang, L. A Deeply Supervised Attention Metric-Based Network and an Open Aerial Image Dataset for Remote Sensing Change Detection. IEEE Trans. Geosci. Remote Sens. 2022, 60, 1–16. [Google Scholar] [CrossRef]
- Sun, Z.; Geng, H.; Lu, Z.; Scherer, R.; Woźniak, M. Review of Road Segmentation for SAR Images. Remote Sens. 2021, 13, 1011. [Google Scholar] [CrossRef]
- Dong, H.; Zhang, L.; Zou, B. Densely Connected Convolutional Neural Network Based Polarimetric SAR Image Classification. In Proceedings of the 2019 IEEE International Geoscience and Remote Sensing Symposium, Yokohama, Japan, 28 July–2 August 2019; pp. 3764–3767. [Google Scholar]
- Ai, J.; Tian, R.; Luo, Q.; Jin, J.; Tang, B. Multi-Scale Rotation-Invariant Haar-Like Feature Integrated CNN-Based Ship Detection Algorithm of Multiple-Target Environment in SAR Imagery. IEEE Trans. Geosci. Remote Sens. 2019, 57, 10070–10087. [Google Scholar] [CrossRef]
- Ai, J.; Mao, Y.; Luo, Q.; Xing, M.; Jiang, K.; Jia, L.; Yang, X. Robust CFAR Ship Detector Based on Bilateral-Trimmed-Statistics of Complex Ocean Scenes in SAR Imagery: A Closed-Form Solution. IEEE Trans. Aerosp. Electron. Syst. 2021, 57, 1872–1890. [Google Scholar] [CrossRef]
- Ai, J.; Mao, Y.; Luo, Q.; Jia, L.; Xing, M. SAR Target Classification Using the Multikernel-Size Feature Fusion-Based Convolutional Neural Network. IEEE Trans. Geosci. Remote Sens. 2022, 60, 1–13. [Google Scholar] [CrossRef]
- Chen, K.; Hao, M.; Zhuang, L.; Xie, C. A method for water body extraction in SAR using CNN. Electron. Meas. Technol. 2021, 44, 125–131. [Google Scholar]
- Kim, M.U.; Oh, H.; Lee, S.-J.; Choi, Y.; Han, S. Deep Learning Based Water Segmentation Using KOMPSAT-5 SAR Images. In Proceedings of the 2021 IEEE International Geoscience and Remote Sensing Symposium, Brussels, Belgium, 11–16 July 2021; pp. 4055–4058. [Google Scholar]
- Wang, Y.; Wang, C.; Zhang, H. Integrating H-A-α with Fully Convolutional Networks for Fully PolSAR Classification. In Proceedings of the 2017 International Workshop on Remote Sensing with Intelligent Processing, Shanghai, China, 18–21 May 2017; pp. 1–4. [Google Scholar]
- Feng, W.; Sui, H.; Huang, W.; Xu, C.; An, K. Water Body Extraction From Very High-Resolution Remote Sensing Imagery Using Deep U-Net and a Superpixel-Based Conditional Random Field Model. IEEE Geosci. Remote Sens. Lett. 2019, 16, 618–622. [Google Scholar] [CrossRef]
- Li, Z.; Wang, R.; Zhang, W.; Hu, F.; Meng, L. Multiscale Features Supported DeepLabV3+ Optimization Scheme for Accurate Water Semantic Segmentation. IEEE Access 2019, 7, 155787–155804. [Google Scholar] [CrossRef]
- Strudel, R.; Garcia, R.; Laptev, I.; Schmid, C. Segmenter: Transformer for Semantic Segmentation. In Proceedings of the 2021 IEEE/CVF International Conference on Computer Vision (ICCV), Montreal, BC, Canada, 17 October 2021; pp. 7242–7252. [Google Scholar]
- Xie, E.; Wang, W.; Yu, Z.; Anandkumar, A.; Alvarez, J.M.; Luo, P. SegFormer: Simple and Efficient Design for Semantic Segmentation with Transformers. arXiv 2021, arXiv:2105.15203. [Google Scholar]
- Zhou, J.; Li, M.; Wang, X.; Xiu, X.; Huang, D. Extracting Tobacco Planting Areas Using LSTM from Time Series Sentinel-1 SAR Data. In Proceedings of the 2021 9th International Conference on Agro-Geoinformatics, Shenzhen, China, 26–29 July 2021; pp. 1–4. [Google Scholar]
- Geng, J.; Wang, H.; Fan, J.; Ma, X. SAR Image Classification via Deep Recurrent Encoding Neural Networks. IEEE Trans. Geosci. Remote Sens. 2018, 56, 2255–2269. [Google Scholar] [CrossRef]
- Zhang, J.; Xing, M.; Sun, G.-C.; Chen, J.; Li, M.; Hu, Y.; Bao, Z. Water Body Detection in High-Resolution SAR Images With Cascaded Fully-Convolutional Network and Variable Focal Loss. IEEE Trans. Geosci. Remote Sens. 2021, 59, 316–332. [Google Scholar] [CrossRef]
- Xue, W.; Yang, H.; Wu, Y.; Kong, P.; Xu, H.; Wu, P.; Ma, X. Water Body Automated Extraction in Polarization SAR Images with Dense-Coordinate-Feature-Concatenate Network. IEEE J. Sel. Top. Appl. Earth Obs. Remote Sens. 2021, 14, 12073–12087. [Google Scholar] [CrossRef]
- Sandler, M.; Howard, A.; Zhu, M.; Zhmoginov, A.; Chen, L. MobileNetV2: Inverted Residuals and Linear Bottlenecks. arXiv 2019, arXiv:1801.04381. [Google Scholar]
- Su, H.; Peng, Y.; Xu, C. Using improved DeepLabv3+ network integrated with normalized difference water index to extract water bodies in Sentinel-2A urban remote sensing images. J. Appl. Remote Sens. 2021, 15, 018504. [Google Scholar] [CrossRef]
- Zhang, W.; He, X.; Li, W. An integrated ship segmentation method based on discriminator and extractor. Image Vis. Comput. 2020, 93, 103824. [Google Scholar] [CrossRef]
- Chen, L.; Zhu, Y.; Papandreou, G.; Schroff, F.; Adam, H. Encoder-Decoder with Atrous Separable Convolution for Semantic Image Segmentation. arXiv 2018, arXiv:1802.02611. [Google Scholar]
- Lin, T.; Dollar, P.; Girshick, R.; He, K.; Hariharan, B.; Belongie, S. Feature Pyramid Networks for Object Detection. In Proceedings of the 2017 IEEE Conference on Computer Vision and Pattern Recognition, Honolulu, HI, USA, 21–26 July 2017. [Google Scholar]
- Lin, G.; Milan, A.; Shen, C.; Reid, I. Refinenet: Multi-path refinement networks with identity mappings for high-resolution semantic segmentation. In Proceedings of the 2017 IEEE Conference on Computer Vision and Pattern Recognition, Honolulu, HI, USA, 21–26 July 2017. [Google Scholar]
- Yu, F.; Koltun, V. Multi-Scale Context Aggregation by Dilated Convolutions. arXiv 2016, arXiv:1511.07122. [Google Scholar]
- Parrilli, S.; Poderico, M.; Angelino, C.V.; Verdoliva, L. A Nonlocal SAR Image Denoising Algorithm Based on LLMMSE Wavelet Shrinkage. IEEE Trans. Geosci. Remote Sens. 2012, 50, 606–616. [Google Scholar] [CrossRef]
- Di Martino, G.; Di Simone, A.; Iodice, A.; Poggi, G.; Riccio, D.; Verdoliva, L. Scattering-Based SARBM3D. IEEE J. Sel. Top. Appl. Earth Obs. Remote Sens. 2016, 9, 2131–2144. [Google Scholar] [CrossRef]
- Patel, S.; Goswami, M. Comparative Analysis of Histogram Equalization Techniques. In Proceedings of the 2014 International Conference on Contemporary Computing and Informatics, Mysuru, India, 27–29 November 2014; pp. 167–168. [Google Scholar]
- Liu, H.; Wang, S.; Hou, B. Unsupervised classification of polarimetric SAR images integrating color features. In Proceedings of the 2014 IEEE International Geoscience and Remote Sensing Symposium, Quebec City, QC, Canada, 13–18 July 2014; pp. 2197–2216. [Google Scholar]
- Nasirzadehdizaji, R.; Balik Sanli, F.; Abdikan, S.; Cakir, Z.; Sekertekin, A.; Ustuner, M. Sensitivity Analysis of Multi-Temporal Sentinel-1 SAR Parameters to Crop Height and Canopy Coverage. Appl. Sci. 2019, 9, 655. [Google Scholar] [CrossRef]
- Grimaldi, S.; Xu, J.; Li, Y.; Pauwels, V.R.N.; Walker, J.P. Flood Mapping under Vegetation Using Single SAR Acquisitions. Remote Sens. Environ. 2020, 237, 111582. [Google Scholar] [CrossRef]
- Zeng, C.; Wang, J.; Huang, X.; Bird, S.; Luce, J. Urban water body detection from the combination of high-resolution optical and SAR images. In Proceedings of the 2015 Joint Urban Remote Sensing Event, Lausanne, Switzerland, 30 March–1 April 2015; pp. 1–4. [Google Scholar]
- Giustarini, L.; Hostache, R.; Matgen, P.; Schumann, G.; Bates, P.; Mason, D. A Change Detection Approach to Flood Mapping in Urban Areas Using TerraSAR-X. IEEE Trans. Geosci. Remote Sens. 2013, 51, 2417–2430. [Google Scholar] [CrossRef]
- Li, Y.; Chen, Y.; Wang, N.; Zhang, Z. Scale-aware trident networks for object detection. In Proceedings of the 2019 IEEE Conference on Computer Vision and Pattern Recognition, Long Beach, CA, USA, 15–20 June 2019; pp. 6054–6063. [Google Scholar]
- Zhu, X.; Hu, H.; Lin, S.; Dai, J. Deformable convnets v2: More deformable better results. In Proceedings of the 2019 IEEE Conference on Computer Vision and Pattern Recognition, Long Beach, CA, USA, 15–20 June 2019; pp. 9308–9316. [Google Scholar]
- Li, Y.; Shi, W.; Liu, G.; Jiao, L.; Ma, Z.; Wei, L. SAR Image Object Detection Based on Improved Cross-Entropy Loss Function with the Attention of Hard Samples. In Proceedings of the 2021 IEEE International Geoscience and Remote Sensing Symposium, Brussels, Belgium, 11–16 July 2021; pp. 4771–4774. [Google Scholar]
- Kodym, O.; Španěl, M.; Herout, A. Segmentation of Head and Neck Organs at Risk Using CNN with Batch Dice Loss. arXiv 2018, arXiv:1812.02427. [Google Scholar]
- Zhao, H.; Shi, J.; Qi, X.; Wang, X.; Jia, J. Pyramid Scene Parsing Network. arXiv 2018, arXiv:1612.01105. [Google Scholar]
- Ronneberger, O.; Fischer, P.; Brox, T. U-Net: Convolutional Networks for Biomedical Image Segmentation. arXiv 2018, arXiv:1505.04597. [Google Scholar]


Publisher’s Note: MDPI stays neutral with regard to jurisdictional claims in published maps and institutional affiliations. |
© 2022 by the authors. Licensee MDPI, Basel, Switzerland. This article is an open access article distributed under the terms and conditions of the Creative Commons Attribution (CC BY) license (https://creativecommons.org/licenses/by/4.0/).