Article

Primary Interannual Variability Patterns of the Growing-Season NDVI over the Tibetan Plateau and Main Climatic Factors

1
Collaborative Innovation Center on Forecast and Evaluation of Meteorological Disasters, Key Laboratory of Meteorological Disaster of Ministry of Education, Nanjing University of Information Science & Technology, Nanjing 210044, China
2
State Key Laboratory of Severe Weather, Institute of Tibetan Plateau Meteorology, Chinese Academy of Meteorological Sciences, Beijing 100081, China
3
Department of Atmospheric Science, School of Environmental Studies, China University of Geosciences, Wuhan 430074, China
*
Author to whom correspondence should be addressed.
Remote Sens. 2022, 14(20), 5183; https://doi.org/10.3390/rs14205183
Submission received: 8 September 2022 / Revised: 9 October 2022 / Accepted: 14 October 2022 / Published: 17 October 2022

Abstract

:
The Tibetan Plateau (TP) vegetation plays an important role in the local ecosystem, which responds significantly to climate change and can affect local and large-scale weather and climate anomalies. However, little attention has been paid to its year-to-year variation. In this paper, using two NDVI datasets (GIMMS and MODIS) originated from satellite remote sensing, the variability characteristics of NDVI over the TP on the interannual time scale and associated local climatic factors were investigated. The results show that two primary patterns of NDVI governed TP during the main growing season (June–September, JJAS) for the period 1982–2020. The first one is a uniform pattern, with a consistent spatial variation over the entire TP, and the second is a dipole pattern, with an out-of-phase spatial variation of NDVI between the northern and southern TP. Interannual variations of the different climatic factors regulate the NDVI variability over the different regions of the TP. The interannual variability of the uniform NDVI pattern is mainly affected by the two local climatic factors, the preceding May–August precipitation and simultaneous JJAS sunshine duration. Specifically, NDVIs over the southern and eastern TP have a more significant response to the preceding precipitation and simultaneous sunshine duration, respectively. The variability of the dipole NDVI pattern is primarily modulated by the preceding May–August precipitation and simultaneous surface air temperature, ground surface temperature, and sunshine duration. However, NDVIs over the northern and southern TP have different degrees of response to the four climatic factors, with the most significant response being to preceding precipitation. The combined effect of these factors contributes to the formation of the interannual variability in the uniform and dipole patterns. This paper may shed light on deeply understanding the reasons for the inconsistency in variations of vegetation over the different regions of the TP under climate change. In addition to the effect of local climatic factors that this study focuses on, the influence of external climatic factors on the variability of the TP NDVI deserves further research in the future.

1. Introduction

As one of the major land surface factors, vegetation plays an important role in the exchange in energy and materials between the atmosphere, ecosphere, hydrosphere, etc. [1,2]. Additionally, vegetation is involved in the land–atmosphere interaction and can be considered an indicator of global climate change [3]. Therefore, vegetation is affected by climate change [4,5], and it can also exert a feedback effect on regional and global climate [6,7,8,9,10,11,12,13]. The normalized difference vegetation index (NDVI) is an important indicator of vegetation coverage and growth activity [14] and has been applied in studying the relationship between vegetation and climate change [15]. Due to its special location and altitude, the Tibetan Plateau (TP) has the world’s largest, highest-altitude, and most unique ecosystem. In recent years, the TP vegetation has received academic attention and extensive research [10,11,12,13,16].
In climate sensitivity, various factors can modulate the variability of NDVI over the TP [17,18,19,20], with regional and seasonal differences in their correlations [21,22,23]. Generally, air temperature and precipitation jointly affect the TP NDVI [24,25]. Precipitation can exert a lagged impact on the TP NDVI, whereas the lagged impact of air temperature is not significant [26]. In areas with relatively well-grown vegetation, the response of NDVI to air temperature and precipitation is more pronounced [27]. Other factors, such as ground temperature, sunshine duration, snow cover, and carbon dioxide (CO2) concentrations, directly affect NDVI or indirectly modulate the connection between NDVI and air temperature (precipitation). In the southeastern TP, where the environment is usually moist and the sunshine is insufficient, NDVI is negatively correlated with precipitation and positively correlated with sunshine duration [28]. In contrast, in the southern TP with warm and dry climatic conditions, NDVI is negatively correlated with temperature [29]. Additionally, the snow cover over the TP can affect NDVI during the subsequent spring and summer [30]. Using model simulations, Gao et al. revealed the different contributions of different CO2 concentrations to the future vegetation growth in the TP [31].
Because of the typically cold and dry alpine climate, there is a wide variety of vegetation over the TP with different growth trends. Under global warming, air temperature and precipitation over the whole TP showed an increasing trend, which overall promotes vegetation growth, and, as a result, NDVI in the whole TP generally shows an increasing trend [26,28,32,33,34,35,36,37,38,39,40]. However, although air temperature and precipitation over the TP generally experienced a similar increasing trend, the amplitude and time of the variability in these climatic factors are different over different regions of the TP [34]. The complex climate change has led to significant differences in the response of vegetation to climatic anomalies in various regions of the TP [33]. As such, there are obvious inconsistent trends between the regional and whole NDVIs in the TP [35,36].
Accompanying global warming and an associated increase in NDVI over the TP, several areas within the TP are experiencing vegetation degradation [35,37,38,39]. Although air temperature and precipitation significantly increased over the entire Three-River-South (TRS) area of the TP, only NDVI in the southeast TRS region showed an increasing trend, while it did not in the northwestern TRS region [36]. Similarly, several studies indicated that the vegetation became more luxuriant in the high-altitude regions of the central and southwestern TP, due to a gradually warmer and more humid climate [29,34,40,41]. In contrast, vegetation degradation occurred in the northeastern TP, at relatively lower altitudes [28,29,40,41,42,43]. Much meaningful progress has been made on the influence of atmospheric heat sources over the TP on the climate in the middle-high latitudes of Eurasia, especially in East Asia [44,45,46,47,48,49]. As one of the major land surface factors, vegetation plays an important role in influencing the TP thermodynamic conditions by altering the local surface albedo and roughness [10,11,12,13]. The above inconsistency in the variability of NDVIs in different regions is likely to cause anomalous changes in the TP thermodynamic effects, which will further affect climate change in the downstream regions. Therefore, the regional differences in NDVI over the TP warrant further investigation.
The climate and ecological characteristics of the TP are changing significantly under the global warming tendency. Understanding the relationship between the TP vegetation and regional and global climate changes is beneficial for the ecological and environmental protection of the TP [26,32,33,34,35,36,42]. Nowadays, increasingly improved remote sensing data provide longer-term vegetation information with a higher spatial resolution, and they allow us to better explore the main variability characteristics of the TP vegetation with local or even global climate change from a climatological perspective. However, these previous studies focused on the long-term trend or variability of the TP vegetation under human activities and natural climate change, rather than variability on the interannual timescales. Given the effects of climatic factors on vegetation growth with year-to-year variability in many regions [1,50,51,52,53,54,55], this paper attempts to clarify spatiotemporal characteristics of the interannual variability in the TP vegetation during its growing season and associated dominant climatic factors over the different regions of the TP. This is conducive to the follow-up to explore the linkage between global climate change and vegetation elements over the TP and has important scientific significance and application value.
The remainder of this paper is organized as follows. In Section 2, data and methods are described, which include the area and season of the study, the use of NDVI and meteorological element data, and statistical analysis methods. Section 3 introduces results, in which Section 3.1 presents the characteristics of interannual variability of NDVI over the TP during the main growing season and Section 3.2 analyzes dominant climatic factors affecting the TP NDVI. Section 4 (i.e., Conclusions) summarizes the spatio-temporal characteristics of the TP NDVI interannual variability and how local climate factors affect it. Finally, a discussion is given in Section 5, which analyzes the contributions and shortcomings of this paper and gives an outlook for future research. This paper is expected to provide a better understanding of features and their physical reasons for the interannual variability of the TP vegetation.

2. Data and Methods

2.1. Data

This paper used NDVI to reflect vegetation cover and growth activity. The NDVI was calculated as follows.
N D V I = N I R R e d N I R + R e d
where NIR is the near-infrared radiation and Red is the red light. The NDVI can be regarded as an important information source for qualitative and quantitative evaluation of vegetation cover and its growth activity [14,26,56] and has therefore been extensively applied in investigating vegetation dynamics in various regions [15].
The updated remote sensing data provide longer-term vegetation information with a higher spatial resolution [57,58,59,60,61], which enables a more detailed investigation of the spatial and temporal characteristics of the TP NDVI. Two NDVI datasets were used in this paper. One is GIMMS NDVI3g, measured by the advanced very high-resolution radiometer (AVHRR) sensor, which was derived from the National Oceanic and Atmospheric Administration (NOAA). This dataset is from January 1982 to December 2014, with a spatial resolution of 8 km (hereafter as GIMMS NDVI). The other is MOD13C2 NDVI, measured by the moderate resolution imaging spectroradiometer (MODIS) sensor, which was derived from the National Aeronautics and Space Administration (NASA). This dataset is from February 2000 to December 2020, with a spatial resolution of 500 m (hereafter as MODIS NDVI). The former is one of the best datasets for describing vegetation dynamics, while the latter is a refinement of the NDVI dataset of AVHRR sensors [57,58,59,60,62]. To explore the characteristics of interannual variability in NDVI over the TP for the entire period from 1982 to 2020, we spliced the two datasets. The splicing method is described in the next subsection.
The meteorological variables which were used in this paper include precipitation (PRE), surface air temperature (SAT), ground surface temperature (GST), and sunshine duration (SSD). The variables were obtained from the National Meteorological Information Center of China. The quality and completeness of the data on these variables are significantly higher than those in previous releases of similar surface data products. The 1982–2020 daily meteorological elements at 88 stations (red dots in Figure 1a) within the boundary of the TP (3000 m above sea level) were used. To analyze the relevant factors affecting the interannual variability of the TP NDVI during the main growing season, the daily data were processed into the monthly data on 0.5° × 0.5° grids through daily accumulation and Cressman interpolation.

2.2. The Area and Season of the Study

The Tibetan Plateau is located in the subtropical region of eastern Eurasia and is the highest (average altitude above 4000 m) in the world, with complex terrain. It is known as the “Water Tower of Asia” and “The Third Pole”. Because of its relatively unique regional natural environment and climatic characteristics, the vegetation over the TP spans from grasslands to deserts. With relatively little anthropogenic disturbance to the TP vegetation, it responds to climate change more rapidly than that over other regions at the same latitudes. Therefore, the Tibetan Plateau is an ideal region for understanding the relationship between vegetation and regional and global climate change.
Figure 1 shows the spatial distribution and temporal variability between the two NDVI datasets during their common period (2002–2014). Since the MODIS NDVI was unstable from 2000 to 2001, the two years were not used here. The annual cycle of the TP vegetation is consistent with previous studies [26,42]. Specifically, the TP NDVI rapidly grew after April, reached a peak in August, and then decreased rapidly after September (Figure 1b). The period of the increasing growth of NDVI is the regreening stage of TP vegetation [63], and the period from November to March in the following year is the yellowing stage, with the decreasing growth of the TP vegetation. The period from June to September (JJAS) can be considered the main growing season of TP vegetation, which is also the study season of this paper. During the main growing season (JJAS), the TP NDVI is distributed in a clear northwest-southeast orientation (Figure 1a). Ignoring the negative NDVI values (less than 0) due to the reflection of clouds, rain, and snow, the maximum NDVI of the southeast and the minimum NDVI of the northwest were about 0.823 and 0.015, respectively.

2.3. Methods

NDVI values between the GIMMS and MODIS NDVIs show a significant linear correlation [64,65], with a regression coefficient of 0.89 (significant at the 99% confidence level; Figure S1), which has been reported in several studies on vegetation over TP [26,61]. Previous studies primarily focused on the linear consistency between the two raw datasets. However, the present study focuses on the characteristics of the interannual variability in NDVI during the growing season. Table S1 and Figure S1 present the spatial correlation coefficients (SCCs), relative deviation (RD), root-mean-square error (RMSE), and correlation coefficients (R = 0.87) of the GIMMS and MODIS NDVIs during JJAS for the common period (2002–2014). SCCs and regression analyses were used to identify the differences in the spatial distribution and temporal variability, and RD and RMSE were used to capture the differences in the magnitude. The GIMMS and MODIS NDVIs have a significant agreement and good continuity during the main growing season (JJAS), which also supports the plausibility of splicing the two NDVI datasets into a longer dataset.
In this paper, the extension methods of different data were in reference to previous studies [26,61,64,65,66]. A linear regression equation was established using the standardized JJAS MODIS and GIMMS NDVIs for the period 2002–2014. Based on this equation, the 2015–2020 JJAS MODIS NDVI can be fitted and spliced to the standardized 1982–2014 GIMMS NDVI. Ultimately, we obtained the standardized JJAS TP NDVI during the longer period 1982–2020.
The empirical orthogonal function (EOF) decomposition was used to analyze the characteristics of interannual variability in the TP NDVI during the main growing season. The North test was used to verify the independence of the leading EOF modes [67]. The EOF decomposition, also known as principal component analysis (PCA), is used to decompose the original variable fields into linear combinations of orthogonal functions to obtain spatial modes with some physical significance. Due to its special location and altitude, the TP is covered by diverse vegetation, small-area desert, and bare soil [68]. Different vegetation and land types can result in different variations of NDVI over the different regions of the TP. The EOF decomposition can capture more dominant and homogeneous interannual patterns of vegetation over the TP, thus providing more insight into its spatial and temporal variability characteristics.
Wavelet transform analysis was used to analyze the cyclical characteristics of interannual variability in the TP NDVI during the main growing season. Traditional statistical methods, such as linear correlation and univariate and multiple regression, were used to explore dominant factors affecting the variability of the TP NDVI. Unless otherwise stated, Student’s t-test was used to evaluate the significance of these analyses.

3. Results

3.1. Characteristics of Interannual Variability in the TP NDVI

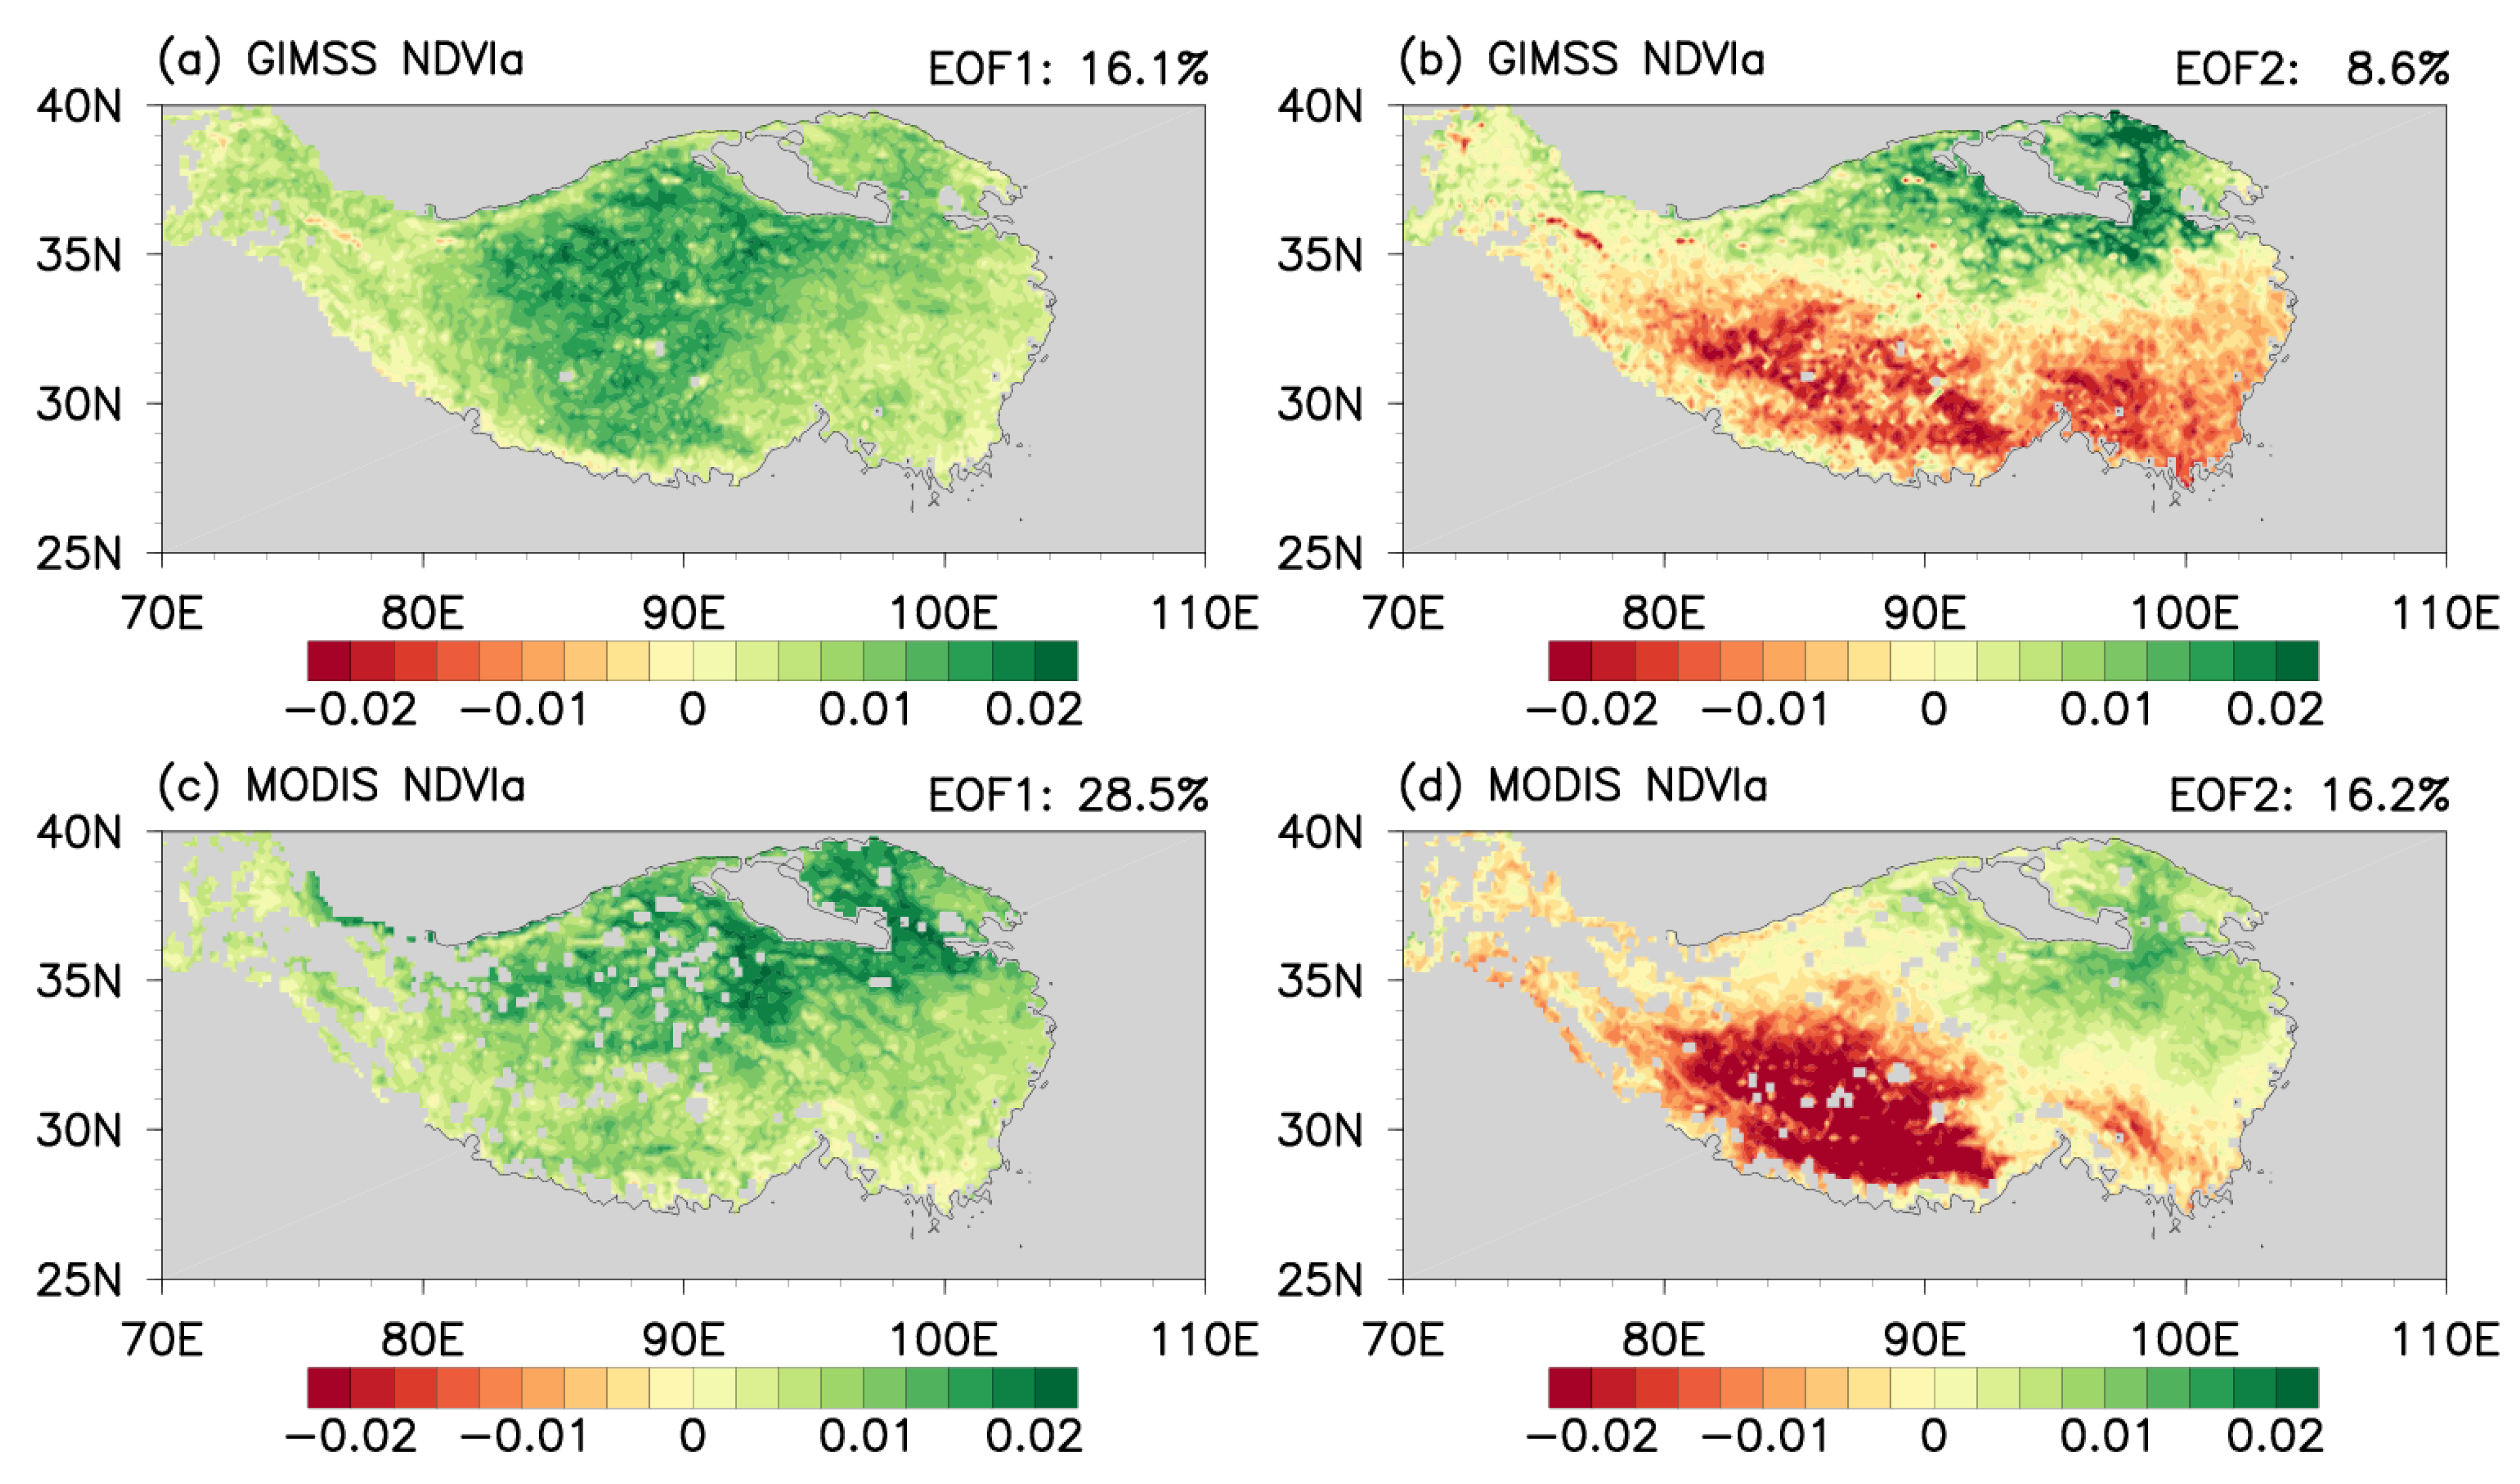
To ensure consistent spatial and temporal characteristics of the TP NDVI during JJAS, we performed EOF analyses during the period 2002–2014 (Figure 2) using two NDVI datasets (i.e., the standardized GIMMS and MODIS JJAS NDVI). The two NDVI data-based results show similar EOF patterns. Specifically, the first EOF (EOF1) shows a uniform pattern of NDVI anomalies over the TP, with larger loadings (anomalies) over the central and western TP (Figure 2a,c). Hereafter, this pattern is referred to as the uniform NDVI pattern. The second EOF (EOF2) shows a north–south dipole pattern of NDVI anomalies over the TP, reflecting that the higher (lower) NDVI over the northern TP corresponds to lower (higher) NDVI over the southern TP (Figure 2b,d). This pattern is called the dipole NDVI pattern. The first two EOF patterns account for 16.1% and 8.6% of the total variance for the GIMMS data, and 28.5% and 16.2% for the MODIS data, both passing the North test [67].
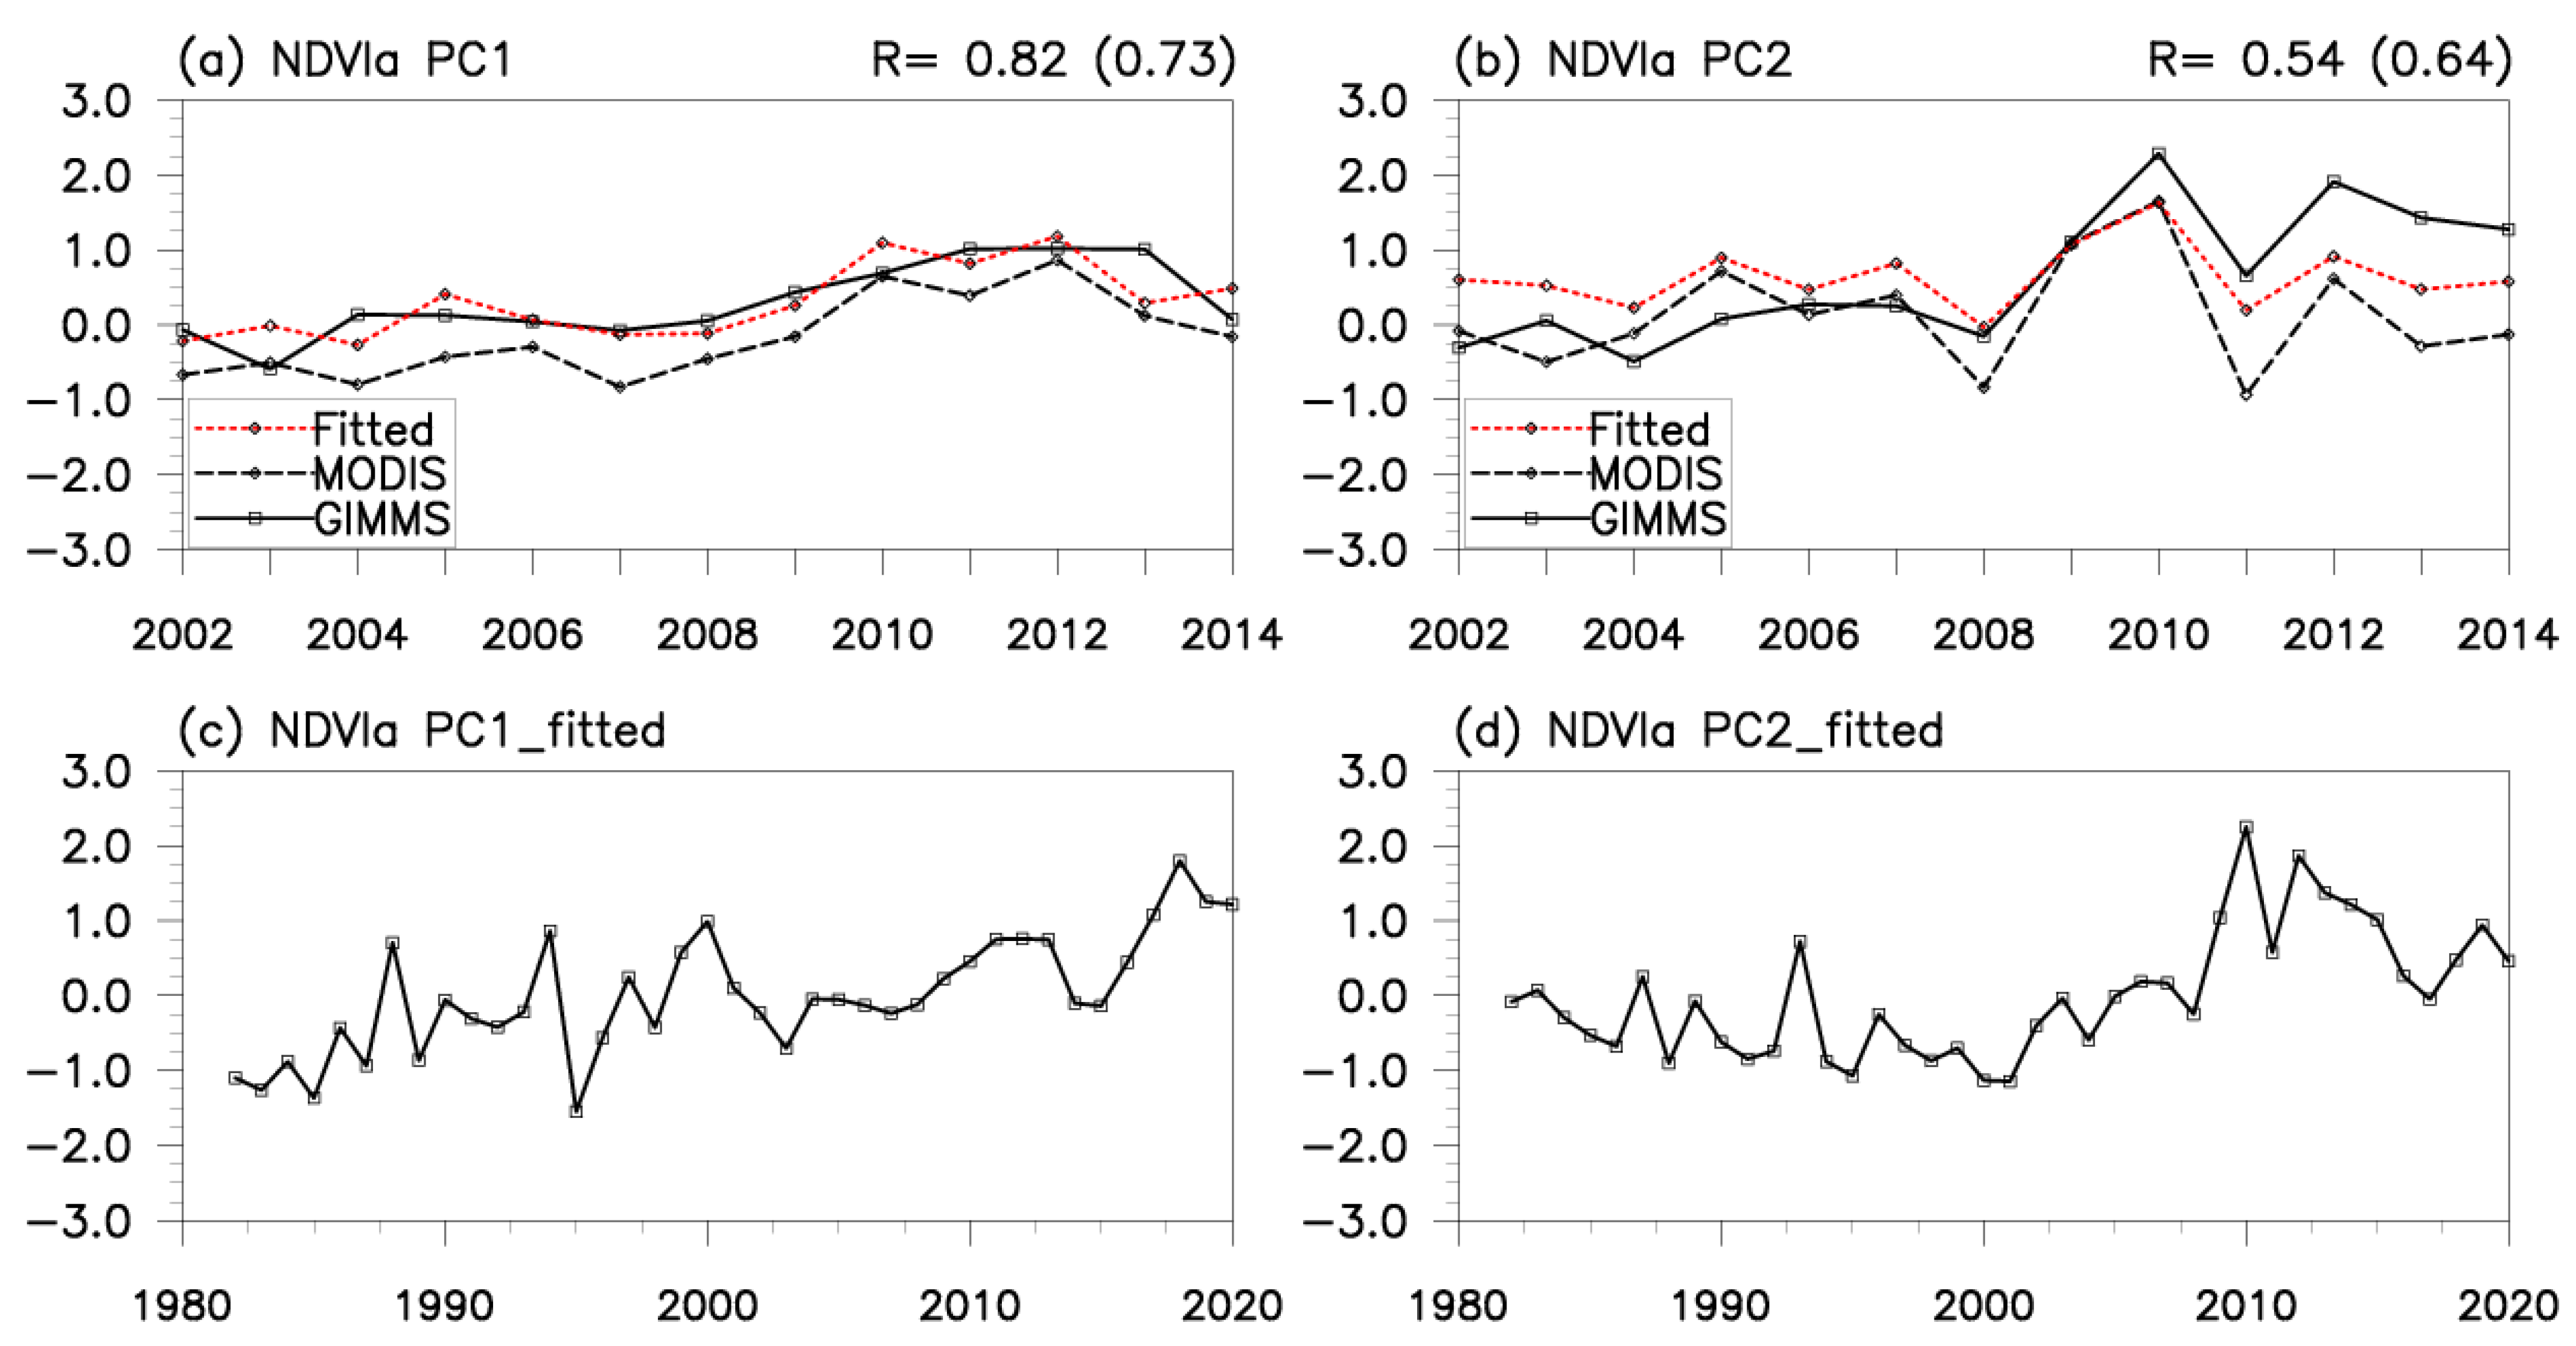
The time series of the principal component (PC1) of GIMMS-based EOF1 is significantly correlated with that of the PC1 of MODIS-based EOF1, with a correlation coefficient of 0.82, significant at a 99% confidence level (Figure 3a). Similarly, the time series of the PC2 of GIMMS-based EOF2 is significantly correlated with that of the PC2 of MODIS-based EOF2, with a correlation coefficient of 0.54, significant at the 99% confidence level (Figure 3b).
The aforementioned results reveal that the GIMMS and MODIS NDVIs during the period 2002–2014 both capture the first two primary patterns of the JJAS TP NDVI and the variability of the primary patterns. Given the high consistency between the GIMMS and MODIS NDVI-based PC1 (PC2), the 2015–2020 JJAS MODIS NDVI-based PC1 (PC2) can be fitted and spliced to the standardized 1982–2014 GIMMS NDVI-based PC1 (PC2). Finally, the time series of PC1 and PC2 during a longer term (1982–2020) were obtained (Figure 3c,d).
PC1 shows an obvious increasing trend with stronger amplitude before 2000 and weaker amplitude after 2000 (Figure 3c). Its temporal variability has a significant period of 2–4 a during 1982–2000, and another periodic variation of 10–12 a during 1982–2020 (Figure S2a). This suggests that there is both interannual and interdecadal variability for PC1. This study focuses on the interannual variation of the TP NDVI and does not discuss too much about the interdecadal variability. PC2 has a weaker increasing trend compared to that of PC1 (Figure 3d). However, it has one amplitude change each after 1990 and before 2010; the latter has a more pronounced enhancement. The temporal characteristics of PC2 obtained from the wavelet transform have two periods of 2–4 a before 2000 and 2–5 a after 2000 (Figure S2b), which is consistent with the results in Figure 3d. The temporal variability and periodic characteristics of these two PC indices suggest that the two NDVI patterns can dominate on the TP in different years.
The NDVI anomalies regressed upon PC1 (PC2) during the period 1982–2020 show a uniform (dipole) pattern (Figure 4a,b), resembling the spatial distributions in Figure 2a,b. This signifies that the two primary patterns existed not only during the period 2002–2014 but also during the longer period 1982–2020. The above results reveal that the two primary patterns of NDVI over the TP stably existed in the period of 1982–2020, and the fitted and spliced PC indices can reflect the characteristics of the interannual variability of the TP NDVI.

3.2. Local Climatic Factors Influencing Interannual Variability in the TP NDVI

In Section 3.1, we found that variability of the JJAS NDVI shows two primary patterns over the TP, namely, the uniform and dipole NDVI patterns. Here, we further explore the local climatic factors responsible for the two primary patterns. Generally, the most important elements influencing vegetation growth are moisture and thermal conditions [69]. Thermal conditions for vegetation growth are mainly related to SAT, GST, and SSD, while moisture conditions are mainly associated with PRE. The NDVI does not always respond to the change in the thermal and moisture conditions immediately; instead, sometimes, the response of vegetation to local climatic factors (especially for PRE) has a certain lag [26,69,70,71,72,73]. Therefore, the simultaneous and time-lagged effects of the climatic factors on the two patterns were investigated.
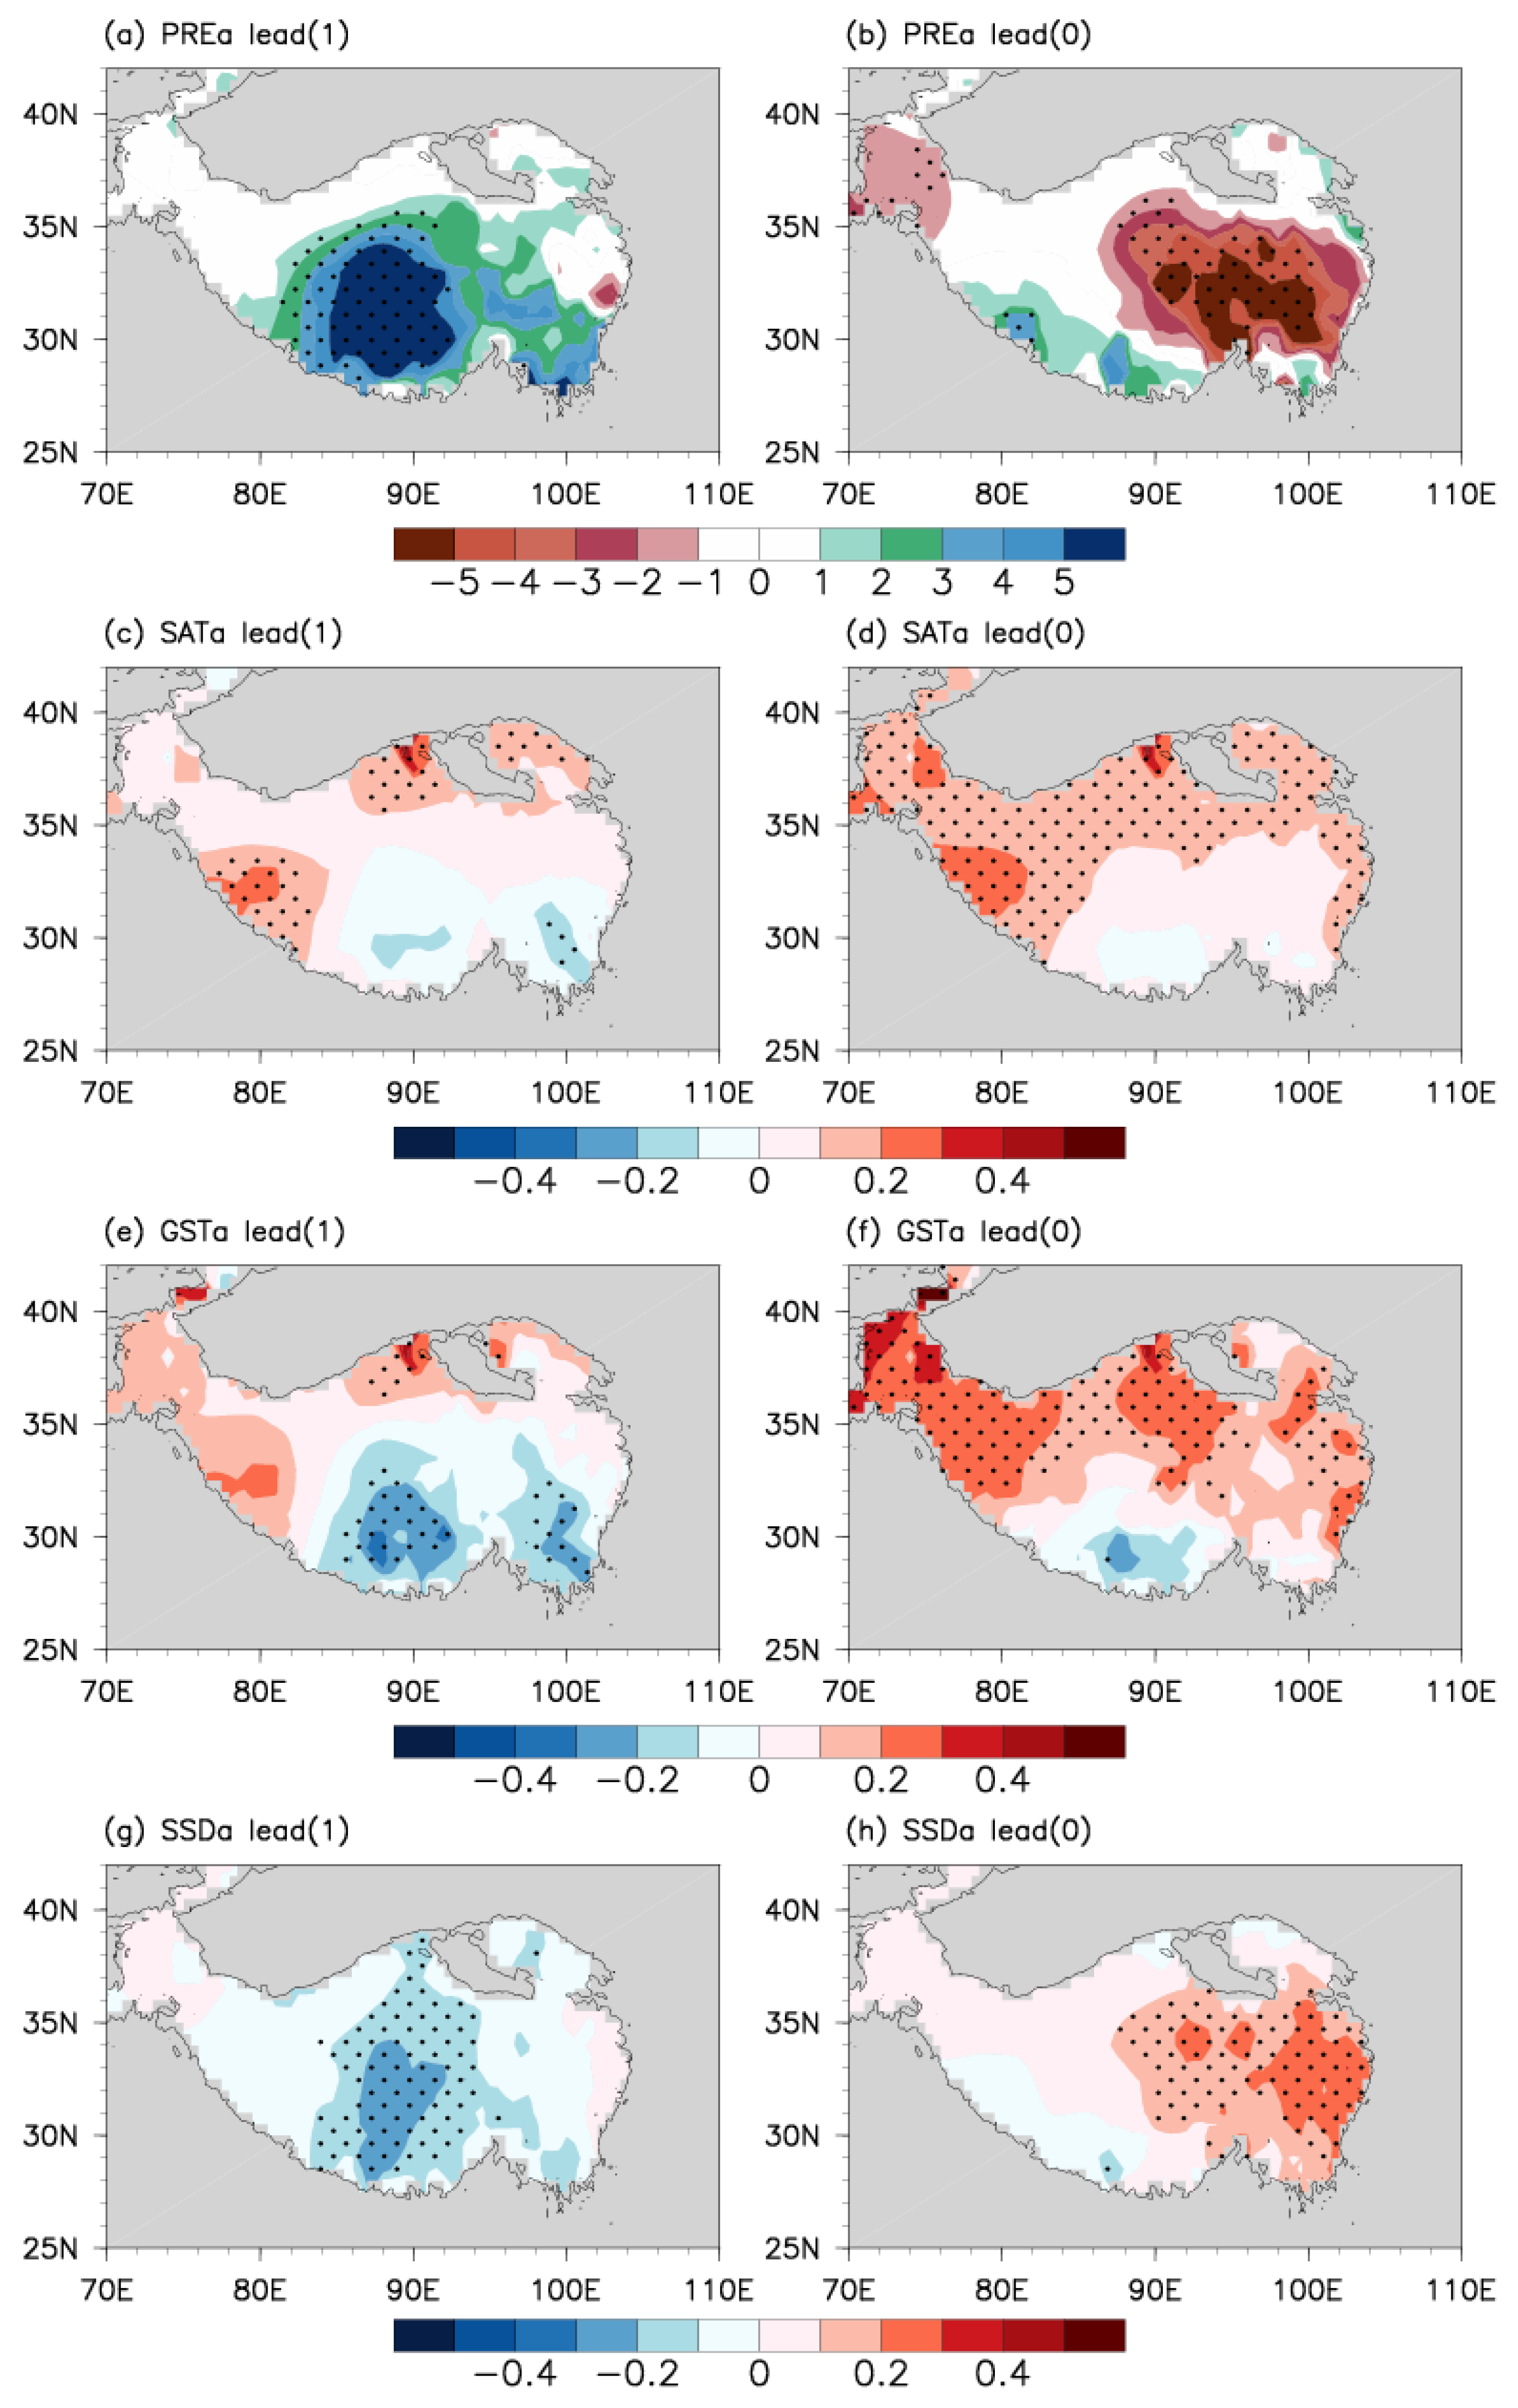
Figure 5 presents the anomalies of different factors regressed upon the JJAS uniform NDVI Index (UNI, i.e., PC1), in which leads (0) denotes the anomalies during JJAS and lead (1) denotes those during May–August (MJJA), namely, one month in advance. The MJJA (lead 1) PRE anomalies are consistent with the JJAS uniform pattern, with more precipitation in accord with higher NDVI (Figure 5a). In contrast, the higher JJAS NDVI corresponds to simultaneous (lead 0) negative PRE anomalies (Figure 5b). The results imply that the JJAS uniform pattern tends to be affected by the preceding MJJA PRE anomalies, rather than the simultaneous PRE anomalies. In other words, the PRE anomalies have a one-month lagged impact on the uniform pattern.
The simultaneous SAT and GST may play an important role in modulating the uniform pattern during JJAS. Significant positive SAT and GST anomalies facilitate higher NDVI over almost the entire TP, which can be clearly detected in Figure 5d,f. In contrast, there is no clear relationship between the preceding MJJA SAT (GST) anomalies and the JJAS uniform pattern (Figure 5c,e).
Overall, these climatic factors are generally linked with a large-area NDVI over the TP. However, it is noteworthy that different climatic factors tend to regulate NDVI over the different regions of the TP. For example, the PRE anomalies are more significantly related to NDVI over the southwestern TP (Figure 5a), while the SAT and GST anomalies are more significantly connected with NDVI over the large-range northern TP (Figure 5d,f). The SSD anomalies have a more significant relationship with NDVI over the eastern TP during JJAS (Figure 5h).
The preceding MJJA PRE anomalies regressed upon the JJAS dipole NDVI Index (DNI, i.e., PC2) clearly show more (less) precipitation over the northern (southern) TP (Figure 6a), coordinating with higher (lower) NDVI over the northern (southern) TP (Figure 4b). Similarly, Figure 6g shows that less (more) sunshine over the northern (southern) TP corresponds to higher (lower) NDVI over the northern (southern) TP, which implies that the preceding MJJA SSD cannot explain the JJAS dipole pattern.
To further reveal the combined effect of different climatic factors, we defined the indices of the PRE, SAT, GST, and SSD anomalies for the two NDVI patterns, respectively. As shown in Table 1, the PRE index can be defined by the MJJA area-mean PRE anomalies over the southwestern TP (28°–35°N, 80°–92°E) because the MJJA PRE anomalies over this region significantly modulate the variability of the uniform pattern during the following JJAS. In contrast, more (less) precipitation over the northern (southern) TP during MJJA can affect the variability of the dipole pattern during JJAS, and therefore the PRE index for this pattern can be defined by the difference between the PRE anomalies over the northern TP (33°–40°N, 91°–104°E) and that over the southern TP (28°–32°N, 81°–94°E). Similarly, the other indices were also defined on the basis of the key regions governed by these climatic factors (see Table 1).
Based on the aforementioned indices that modulate the patterns of NDVI, we established two multivariate linear regression models in the two following equations to fit the UNI and DNI, respectively.
U N I = 0.01 + 0.35 P R E a 0.02 S A T a + 0.13 G S T a + 0.26 S S D a
D N I = 2.9 × 10 9 + 0.33 P R E a + 0.44 S A T a 0.63 G S T a + 0.19 S S D a
in which the left terms represent the UNI and DNI and the right terms (PRE, SAT, GST, and SSD) represent the indices (see the definitions in Table 1) of the climate factors responsible for the uniform and dipole NDVI patterns, with “a” indicating anomalies. The coefficients of the right terms can reflect the combined effect of these climatic factors with different weights. For convenience, the right terms in Equations (2) and (3) are referred to as the combined-effect indices for the UNI and DNI, respectively. It should be noted that the estimate of the intercept of Equation (3) is 2.9 × 10⁻⁹, close to 0, which is negligible when calculating the combined-effect index of the DNI.
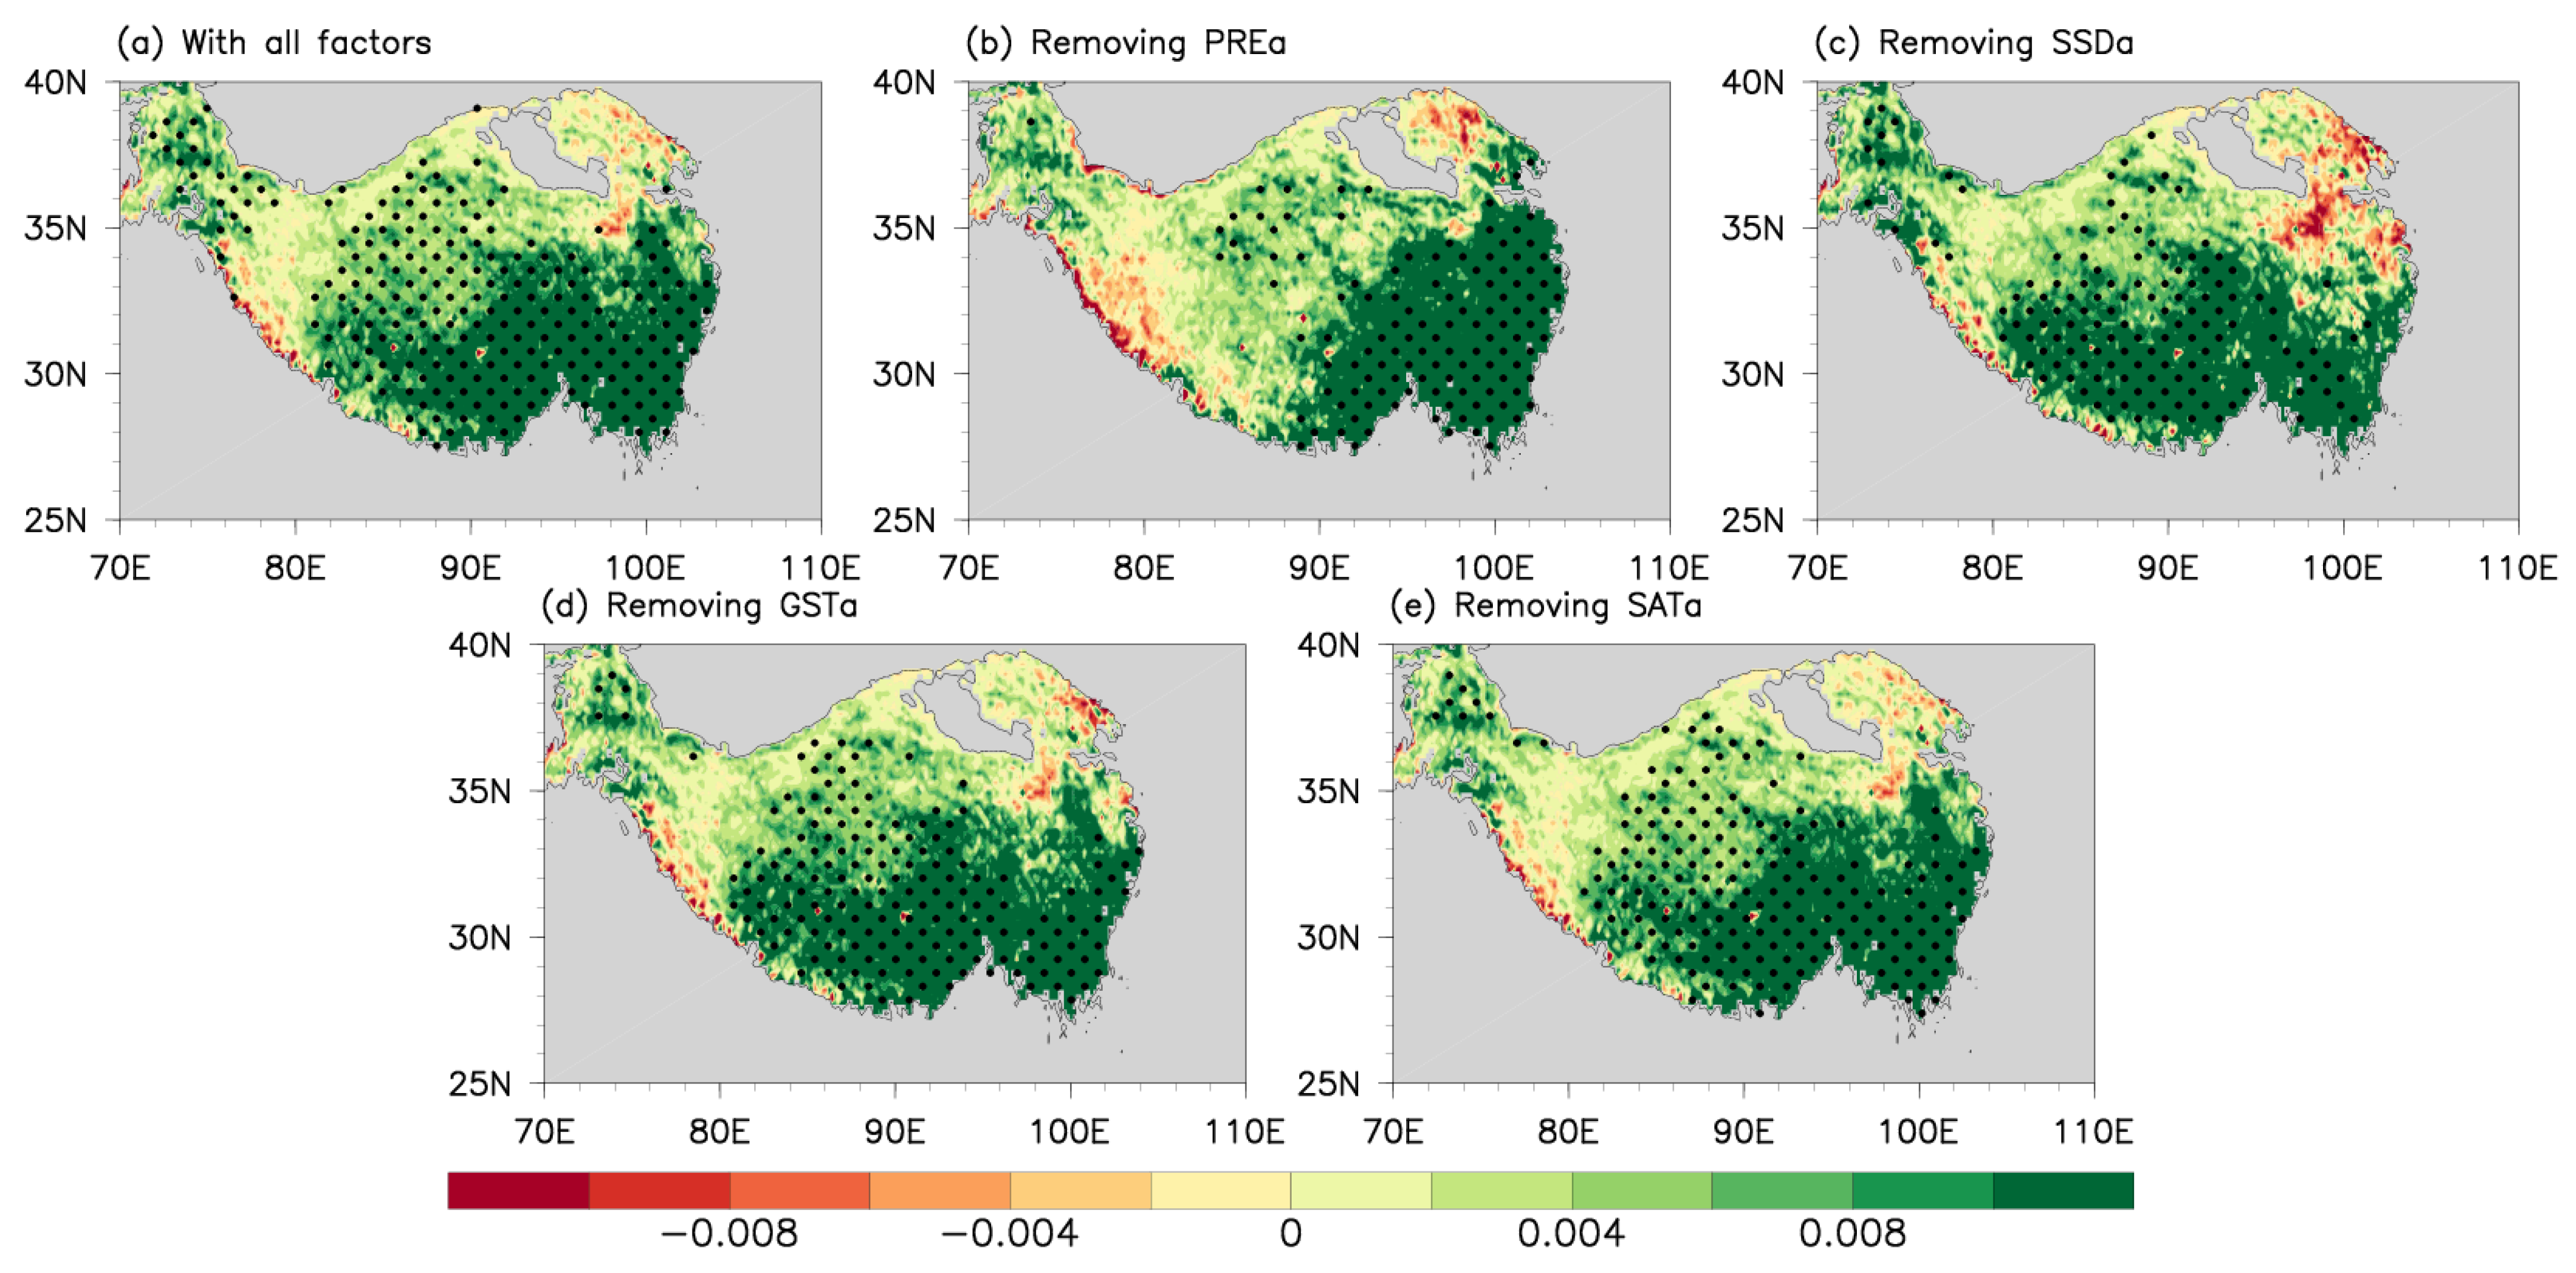
The NDVI anomalies regressed upon the combined-effect index for the UNI show that significantly positive anomalies appear over almost the entire TP (Figure 7a). Such a uniform pattern resembles the leading mode of NDVI (Figure 4a), implying that the variability of the uniform pattern can be attributed to the synergistic modulation of the PRE and SSD anomalies. The effect of the GST and SAT indices is relatively weaker. The MJJA PRE anomaly tends to play the most important role in adjusting the uniform pattern. After removing the effect of the MJJA PRE index, significantly positive anomalies of NDVI disappear over the southwestern TP (Figure 7b). After removing the effect of the simultaneous SSD index, NDVI changed to the negative anomalies over the northeastern TP (Figure 7c). The JJAS GST and SAT indices have relatively weaker impacts on the uniform pattern. After removing the effect of the JJAS GST and SAT indices, significantly positive anomalies over the entire TP still exist (Figure 7d,e).
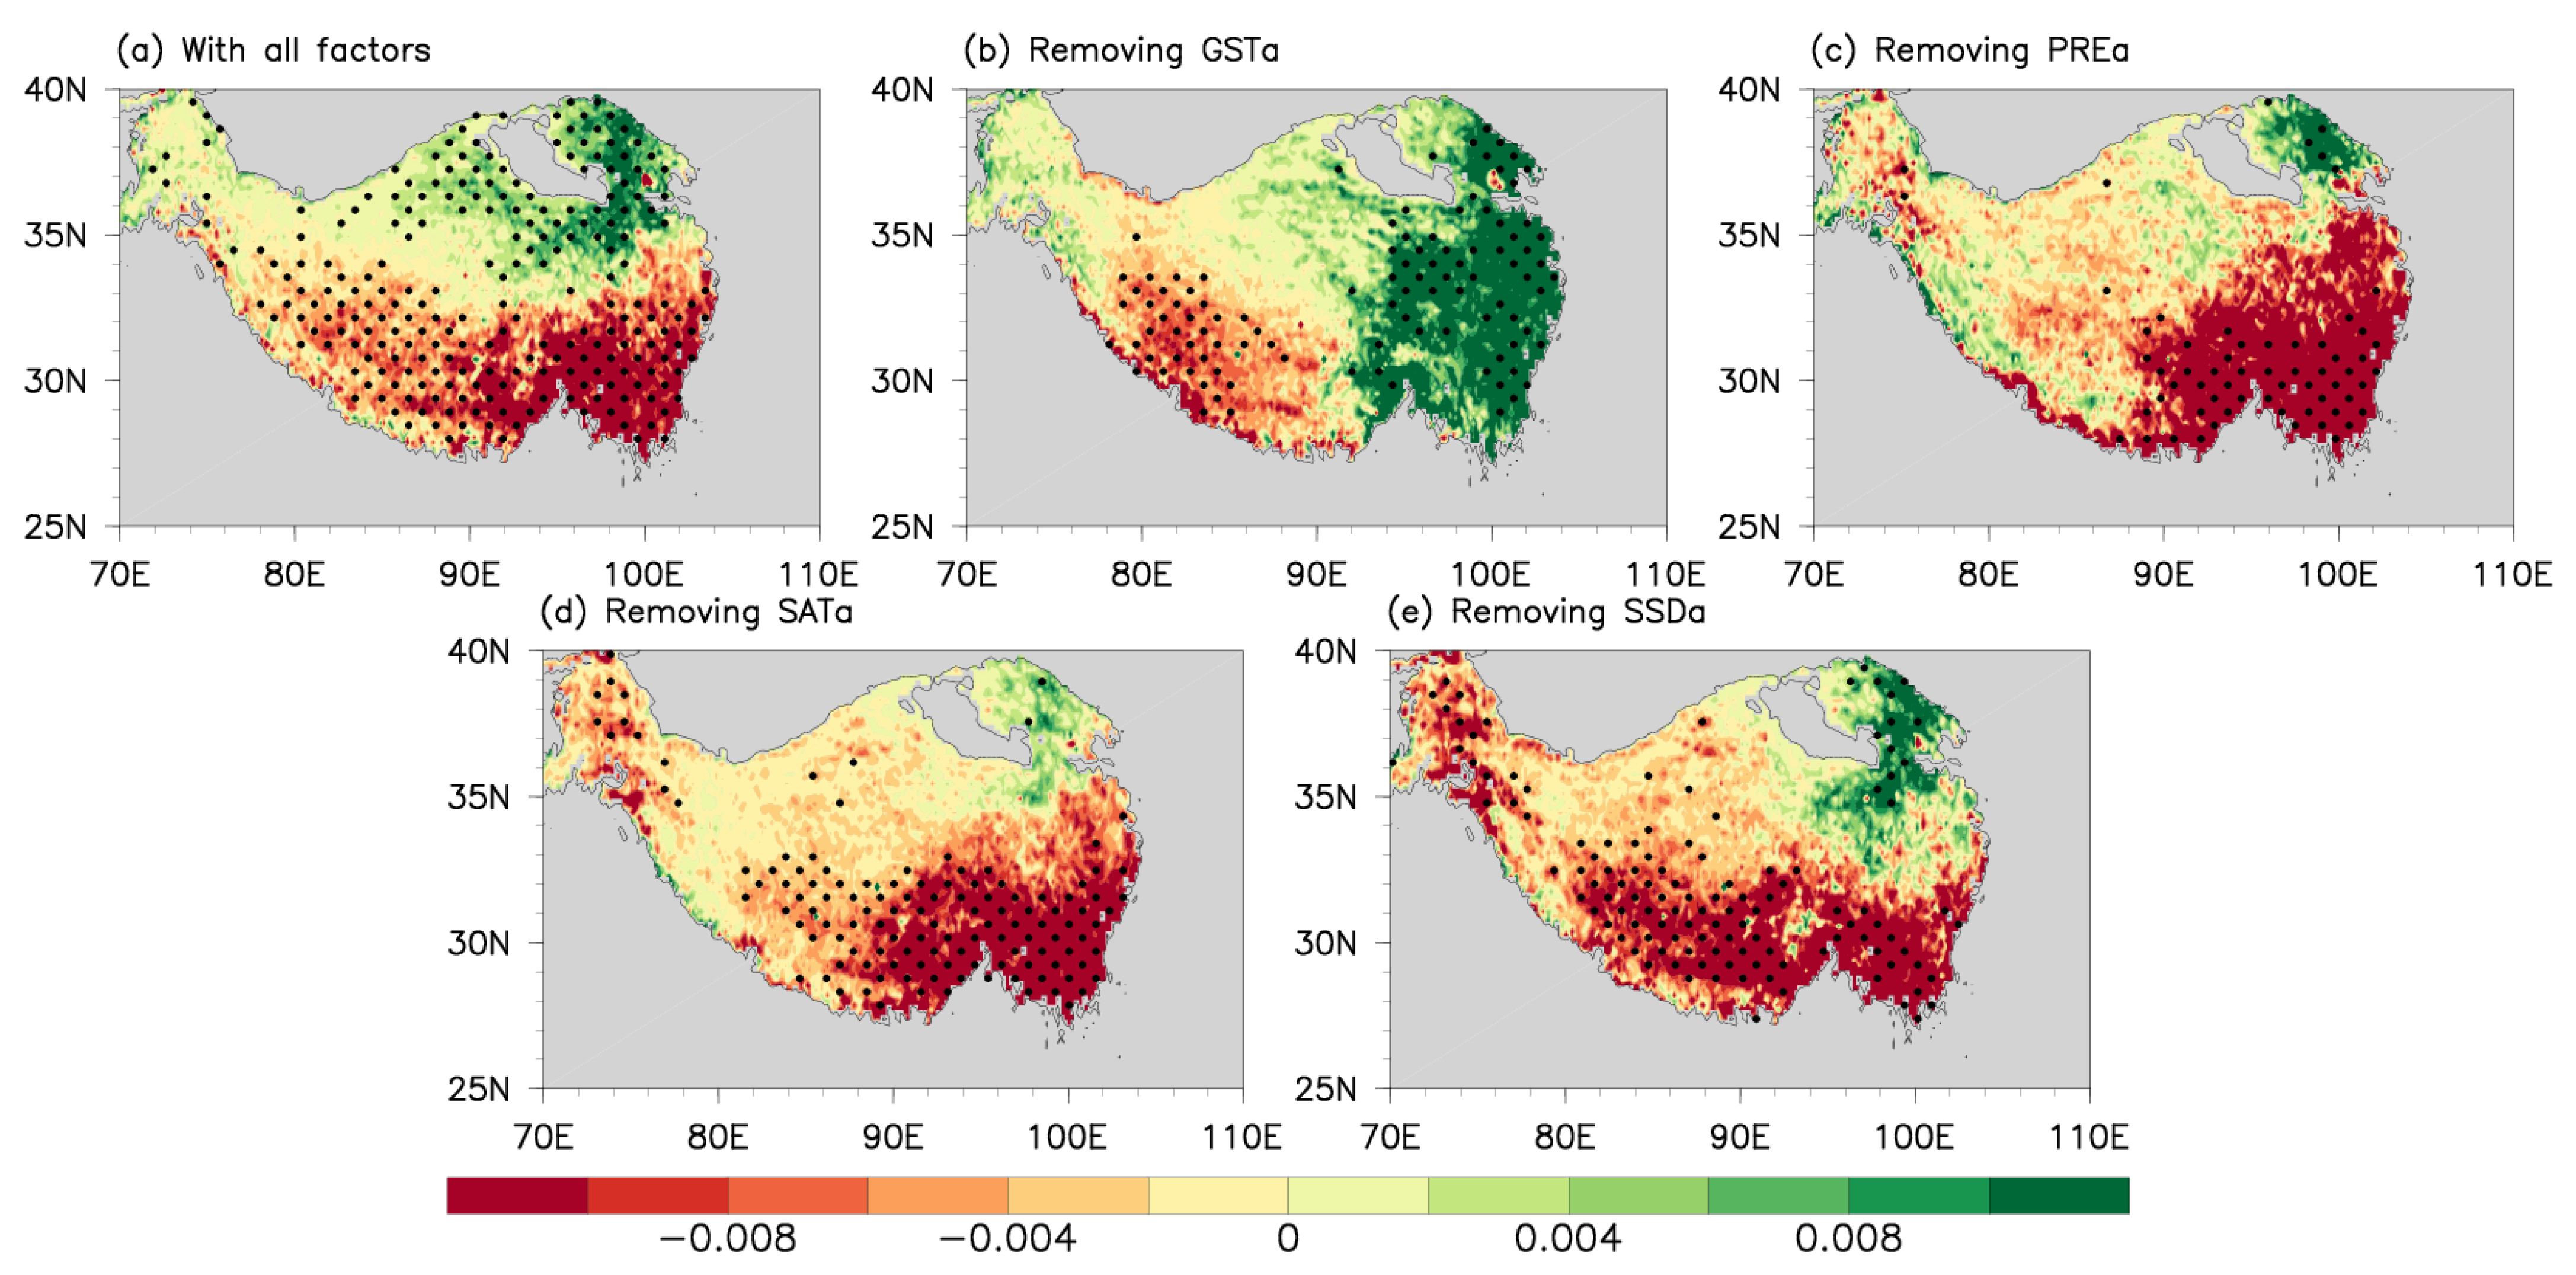
The NDVI anomalies regressed upon the combined-effect index for the DNI show that significantly positive (negative) anomalies appear over the northern (southern) TP, forming a dipole pattern (Figure 8a). This pattern is similar to the second mode of NDVI (Figure 4b), signifying that the PRE, SSD, SAT, and GST indices synergistically modulate the variability of the diploe pattern. After removing the influence of GST anomalies, the dipole pattern changed to an east–west pattern (Figure 8b). When the other climatic factor anomalies (PRE, SAT, and SSD anomalies) are absent, the dipole pattern is also unclear, and is especially insignificant over the northern TP (Figure 8c–e).
The aforementioned results reveal that the uniform pattern is mainly modulated by the preceding PRE and simultaneous SSD anomalies, while the dipole pattern is governed by all these climatic factors.

4. Discussion

The TP vegetation plays a crucial role in linking the local and Asian climate systems [74], especially in its ability to influence the weather and climate in its downstream regions, although it is itself sensitive and vulnerable in response to global climate change [75]. Variations in the TP vegetation dynamics can cause a change in local surface albedo and roughness, which affects the TP thermodynamic effects [10,11,12,13]. Most studies [44,45,46,47,48,49] indicate that TP thermodynamics has a significant influence on the large-scale circulation system and East Asia monsoon. All these suggest that the variation of the growing-season vegetation dynamics over TP can affect the atmosphere, ecosphere, and hydrosphere in East Asia and even all world regions [10,11,12,13]. However, the key components, the variability characteristics of the growing-season vegetation dynamics over the TP, have not received enough attention.
Previous studies mainly focused on the long-term or interdecadal variations in the TP vegetation under climate change, but studies of the TP vegetation on interannual timescales are relatively few. Moreover, the dominant characteristics of the spatial distribution of the NDVI anomalies over the TP remain unclear, although previous studies have found the inconsistency of the variability in the vegetation growth in the different regions of the TP. This paper reveals the primary patterns of the variability of NDVI over the TP on interannual timescales and relevant local climatic factors, which may help further understand the reason for the inconsistency of the variations of vegetation over the different regions of the TP. It was found that there are two patterns of NDVI interannual variability during the main growing season (JJAS); the uniform NDVI pattern exhibits the same change trend of vegetation growth over the whole TP (Figure 4a), while the dipole NDVI pattern shows a seesaw change in vegetation growth on the northern and southern TP (Figure 4b). These two primary patterns can be directly affected by local climatic factors (PRE, SAT, GST, and SSD).
For the uniform NDVI pattern, Figure 5a implies that the JJAS uniform pattern tends to be affected by the preceding MJJA PRE anomalies, rather than the simultaneous PRE anomalies. In other words, the PRE anomalies have a one-month lagged impact on the uniform pattern. A higher NDVI roughly corresponds to the positive SSD anomalies (Figure 5h), indicating that more concurrent sunshine can promote the growth of vegetation over the TP during JJAS. Note that the higher JJAS NDVI corresponds to the significantly negative SSD anomalies during MJJA (Figure 5g). Nevertheless, this correspondence does not mean that preceding weaker sunshine can contribute to the more rapid growth of vegetation during the following months. Actually, the MJJA weaker sunshine (negative SSD anomalies) should be attributed to more PRE anomalies during the same period (Figure 5a).
For the dipole NDVI pattern, the preceding MJJA PRE anomalies dominate the variability of the dipole pattern (Figure 6a). The SAT and GST anomalies during the preceding MJJA may not be responsible for the variability of the dipole pattern since positive (negative) SAT and GST anomalies (Figure 6c,e) correspond to lower (higher) NDVI (Figure 4b). These out-of-phase relationships do not make sense. During JJAS, only the significantly negative GST anomalies over the southeastern TP (Figure 6f) may contribute to a lower NDVI over the same region and modulate part of the dipole pattern. However, the significant correlation between the dipole NDVI and the preceding SSD is noncausal, which is mainly due to the significant relationship between PRE and NDVI (Figure 6a) since more (less) precipitation causes shorter (longer) SSD. During JJAS, large-area negative SSD anomalies over the southern TP (Figure 6h) may inhibit the growth of vegetation and thus cause lower NDVI there, which adjusts the variability of the southern part of the dipole pattern at the same time. The aforementioned results also indicate that, under the framework of the dipole pattern, different climatic factors are responsible for NDVI over the different regions of the TP and eventually cause the NDVI anomaly with the dipole pattern.
In general, the interannual variability of the TP NDVI during JJAS is closely related to that of the preceding precipitation and the simultaneous air temperature, ground surface temperature, and sunshine duration, but with significant regional differences. The combined effect of these factors contributes to the formation of the interannual variability in the uniform and dipole NDVI patterns. Certainly, such regional differences are related to the local climate (high/low temperature, rainy/drought) where the vegetation itself is located [10,26,29,31,32,42,43,73,74,76]. Nevertheless, not only these factors can modulate the interannual variability of the TP NDVI. Additionally, snow cover, CO2 concentration, and nitrogen deposition play important roles in modulating vegetation growth over the TP [77]. Winter snow cover variation over the TP can affect the TP vegetation dynamics at the regreening stage (April–May), and CO2 concentration and nitrogen deposition can affect the growth of the TP vegetation from a biological perspective [77]. They may explain the small differences between Figure 4a and Figure 7a, and Figure 4b and Figure 8a.
Additionally, the anomalous oceanic and land conditions and associated atmospheric teleconnections may result in precipitation and thermal anomalies over the TP, such as the Indian summer monsoon [30,78,79], North Atlantic Oscillation [80,81,82,83], SST anomalies in several key oceans [83,84,85], Eurasian snow cover [86], and soil moisture in several regions [87,88]. The above studies lead us to believe that external climate factors may change thermal and moisture conditions by stimulating atmospheric circulation anomalies over the TP, which in turn results in the interannual variation of NDVI. The forcing effects of these factors and associated mechanisms deserve further exploration in the future. We can also establish statistical models to predict the growth trend of the TP vegetation under future climate change via the combined effect of local climatic factors on the interannual variation of NDVI over the TP. This can further deepen the understanding of the relationship between the TP vegetation and regional and global climate change and provide a basis for ecological and environmental protection of the TP.

5. Conclusions

To better understand the features of the TP vegetation and its physical interaction with climate change, the variability characteristics of NDVI over the TP on interannual time scales were studied via longer-term and higher-spatial-resolution remote sensing data in this paper. The findings demonstrate that there are two primary patterns of the TP NDVI during the main growing season (JJAS). The first pattern is the uniform pattern, with consistent spatial variation over the entire TP, and the second one is the dipole pattern, with an out-of-phase spatial variation of NDVI between the northern and southern TP.
Both the MODIS and GIMMS NDVIs manifest the above two primary patterns, and the time series of the MODIS-based UNI (DNI) is significantly correlated with that of the GIMMS-based UNI (DNI). Through fitting and splicing the JJAS MODIS NDVI-based UNI (DNI) to the standardized GIMMS NDVI-based UNI (DNI), we obtained the time series of the UNI and DNI during a longer term (1982–2020), with the interannual cycle of 2–4 a in the former and interannual cycles of 2–4 a and 2–5 a in the latter. Further analyses reveal that, during the period 1982–2020, the variability of the JJAS uniform pattern is mainly affected by two local climatic factors (i.e., the preceding MJJA PRE and simultaneous SSD) and the variability of the JJAS dipole pattern is mainly modulated by the preceding MJJA PRE and simultaneous SAT, GST, and SSD.
With respect to the effects of these climatic factors, two results should be noted. (1) Different climatic factors tend to significantly regulate NDVI over the different regions. The combined effect of these factors contributes to the variations in the uniform and dipole patterns. (2) PRE tends to have a lagged effect on vegetation growth over TP, while the other climatic factors (SAT, GST, and SSD) show simultaneous effects.

Supplementary Materials

The following supporting information can be downloaded at: https://www.mdpi.com/article/10.3390/rs14205183/s1, Figure S1. Scatter plot of least squares linear regression between the MODIS and GIMMS NDVIs in TP during the period 2002–2014, where the solid black line denotes the fitted regression line; Figure S2. Wavelet transforms of the PC1 (a) and PC2 (b), in which the periods significant at the 95% confidence level are stippled with black dots; Table S1. Monthly comparison between the GIMMS and MODIS NDVIs over TP during the main growing season (JJAS), in which the parameters for comparison are spatial correlation coefficient (SCC), root mean square error (RMSE), and relative deviation (RD). The superscript “*” indicates that the correlation coefficients are statistically significant at the 95 % confidence level.

Author Contributions

Conceptualization, H.-L.R.; methodology, H.-L.R. and G.L.; formal analysis, X.M.; data curation, X.M.; writing—original draft preparation, X.M., G.L. and H.-L.R.; writing—review and editing, X.M., G.L. and H.-L.R. All authors have read and agreed to the published version of the manuscript.

Funding

This work was jointly supported by the Second Tibetan Plateau Scientific Expedition and Research (STEP) program (Grant 2019QZKK0105), the Strategic Priority Research Program of the Chinese Academy of Sciences (Grant XDA2010030807), the National Key Research and Development Program on monitoring, Early Warning and Prevention of Major Natural Disaster (Grant No. 2018YFC1506001), and the Basic Research Fund of CAMS (Grant 2021Z007).

Data Availability Statement

GIMMS NDVI3g data in this research was provided by the ECOCAST, downloaded from the website at https://ecocast.arc.nasa.gov/data/pub/gimms/ (accessed on 28 November 2020). MOD13C2 data was provided by the LAADS DAAC/NASA, from the website at https://ladsweb.modaps.eosdis.nasa.gov/ (accessed on 13 January 2022). The daily meteorological dataset of basic meteorological elements of China National Surface Weather Station (V3.0) was provided by the National Meteorological Information Center, from the website at http://data.cma.cn/ (accessed on 18 January 2022).

Acknowledgments

We appreciate ECOCAST and LAADS DAAC/NASA for providing the NDVI data. We thank National Meteorological Information Center for providing four daily meteorological datasets.

Conflicts of Interest

The authors declare no conflict of interest.

References

  1. Keeling, C.D.; Chin, J.F.S.; Whorf, T.P. Increased activity of northern vegetation inferred from atmospheric CO2 measurements. Nature 1996, 382, 146–149. [Google Scholar] [CrossRef]
  2. Cao, M.K.; Woodward, F.I. Dynamic responses of terrestrial ecosystem carbon cycling to global climate change. Nature 1998, 393, 249–252. [Google Scholar] [CrossRef]
  3. Sun, H.Y.; Wang, C.Y.; Niu, Z. Analysis of the Vegetation Cover Change and the Relationship between NDVI and Environmental Factors by Using NOAA Time Series Data. J. Remote Sens. 1998, 2, 204–210. (In Chinese) [Google Scholar] [CrossRef]
  4. Weiss, J.L.; Gutzler, D.S.; Allred Coonrod, J.E.; Dahm, C.N. Seasonal and inter-annual relationships between vegetation and climate in central New Mexico, USA. J. Arid Environ. 2004, 57, 507–534. [Google Scholar] [CrossRef]
  5. Nezlin, N.P.; Kostianoy, A.G.; Li, B.L. Inter-annual variability and interaction of remote-sensed vegetation index and atmospheric precipitation in the Aral Sea region. J. Arid Environ. 2005, 62, 677–700. [Google Scholar] [CrossRef]
  6. Shukla, J.; Nobre, C.; Sellers, P. Amazon deforestation and climatem change. Science 1990, 247, 1322–1325. [Google Scholar] [CrossRef] [PubMed] [Green Version]
  7. Zhang, J.Y.; Dong, W.J.; Fu, C.; Wu, L.Y. The influence of vegetation cover on summer precipitation in China: A statistical analysis of NDVI and climate data. Adv. Atmos. Sci. 2003, 20, 1002–1006. [Google Scholar] [CrossRef]
  8. Li, W.P.; Xue, Y.K. Numerical simulation of the impact of vegetation index on the interannual variation of summer precipitation in the Yellow River Basin. Adv. Atmos. Sci. 2005, 22, 865–876. [Google Scholar] [CrossRef]
  9. Zhang, J.; Walsh, J.E. Thermodynamic and hydrological impacts of increasing greenness in Northern high latitudes. J. Hydrometeorol. 2006, 7, 1147–1163. [Google Scholar] [CrossRef]
  10. Liu, Y.Q.; Fan, G.Z.; Zhou, D.W.; Li, H.Q.; Hua, W.; Li, X.M. Variability of NDVI in Winter and Spring on the Tibetan Plateau and their Relationship with Summer Precipitation. Acta Meteorol. Sin. 2007, 65, 959–967. [Google Scholar] [CrossRef]
  11. Hua, W.; Fan, G.Z.; Zhou, D.W.; Ni, C.J.; Li, X.M.; Wang, Y.L.; Liu, Y.Q.; Huang, X.L. Preliminary analysis on the relationships between Tibetan Plateau NDVI change and its surface heat source and precipitation of China. Sci. China. Ser. D Earth Sci. 2008, 51, 677–685. [Google Scholar] [CrossRef]
  12. Wang, Y.X.; Zhao, P.; Yu, R.C.; Rasul, G. Inter-decadal variability of Tibetan spring vegetation and its associations with eastern China spring rainfall. Int. J. Climatol. 2009, 30, 856–865. [Google Scholar] [CrossRef]
  13. Zuo, Z.; Zhang, R.; Zhao, P. The relation of vegetation over the Tibetan Plateau to rainfall in China during the boreal summer. Clim. Dyn. 2011, 36, 1207–1219. [Google Scholar] [CrossRef]
  14. Csiszar, I.; Gutman, G. Global high-resolution land surface albedo monthly maps from NOAA/AVHRR for use in climate models. IEEE Int. Geosci. Remote Sens. Symp. Proc. 1998, 2, 710–712. [Google Scholar] [CrossRef]
  15. Fang, S.B.; Yu, W.G.; Qi, Y. Spectra and vegetation index variations in moss soil crust in different seasons, and in wet and dry conditions. Int. J. Appl. Earth Obs. Geoinf. 2015, 38, 261–266. [Google Scholar] [CrossRef]
  16. Huang, X.L.; Zhang, T.B.; Yi, G.H.; He, D.; Zhou, X.B.; Li, J.; Bie, X.; Miao, J. Dynamic Changes of NDVI in the Growing Season of the Tibetan Plateau during the Past 17 Years and Its Response to Climate Change. Int. J. Environ. Res. Public Health 2019, 16, 3452. [Google Scholar] [CrossRef] [Green Version]
  17. Mao, D.H.; Wang, Z.M.; Ling, L.; Ren, C.Y. Integrating AVHRR and MODIS data to monitor NDVI changes and their relationships with climatic parameters in Northeast China. Int. J. Appl. Earth Obs. Geoinf. 2012, 18, 528–536. [Google Scholar] [CrossRef]
  18. Sun, J.; Cheng, G.; Li, W.; Sha, Y.; Yang, Y. On the Variation of NDVI with the Principal Climatic Elements in the Tibetan Plateau. Remote Sens. 2013, 5, 1894–1911. [Google Scholar] [CrossRef] [Green Version]
  19. Liu, S.H.; Yan, D.H.; Shi, X.L.; Yuan, Z. Inter-annual variability of vegetation NDVI, accumulated temperature and precipitation and their correlations in China. Arid Land Geogr. 2014, 37, 480–489. (In Chinese) [Google Scholar]
  20. Fang, S.B.; Zhang, X.S. Control of vegetation distribution: Climate, geological substrate, and geomorphic factors. A case study of grassland in Ordos, Inner Mongolia, China. Can. J. Remote Sens. 2013, 39, 167–174. [Google Scholar] [CrossRef]
  21. Shen, B.; Fang, S.B.; Li, G. Vegetation coverage changes and their response to meteorological variables from 2000 to 2009 in Naqu, Tibet, China. Can. J. Remote Sens. 2014, 40, 67–74. [Google Scholar] [CrossRef]
  22. Shen, B.; Fang, S.B.; Yu, W.G. Different correlations between NDVI and meteorological factors at temporal-time scales. J. Remote Sens. 2016, 20, 481–490. [Google Scholar] [CrossRef]
  23. Zhao, Q.Q.; Zhang, J.P.; Zhao, T.B.; Li, J.H. Vegetation Changes and Its Response to Climate Change in China Since 2000. Plateau Meteorol. 2021, 40, 292–301. (In Chinese) [Google Scholar] [CrossRef]
  24. Li, Z.; Yan, F.L.; Fan, X.T. The Variability of NDVI over Northwest China and Its Relation to Temperature and Precipitation. J. Remote Sens. 2005, 9, 308–313. (In Chinese) [Google Scholar] [CrossRef]
  25. Ding, M.J.; Zhang, Y.L.; Liu, L.S.; Wang, Z.F. Temporal and spatial distribution of grassland coverage change in Tibetan Plateau since 1982. J. Nat. Resour. 2010, 25, 2114–2122. [Google Scholar] [CrossRef]
  26. Meng, M.; Niu, Z.; Ma, C.; Tian, H.F. Variation Trend of NDVI and Response to Climate Change in Tibetan Plateau. Res. Soil Water Conserv. 2018, 25, 360–372. (In Chinese) [Google Scholar] [CrossRef]
  27. Wang, Q.X.; Lü, S.H.; Bao, Y.; Ma, D.; Li, R.Q. Characteristics of Vegetation Change and Its Relationship with Climate Factors in Different Time-Scales on Qinghai-Xizang Plateau. Plateau Meteorol. 2014, 33, 301–312. (In Chinese) [Google Scholar] [CrossRef]
  28. Du, J.; Zhao, C.; Shu, J.; Jiaerheng, A.; Yuan, X.; Yin, J.; Fang, S.; He, P. Spatiotemporal changes of vegetation on the Tibetan Plateau and relationship to climatic variables during multiyear periods from 1982–2012. Environ. Earth Sci. 2016, 75, 77. [Google Scholar] [CrossRef]
  29. Zhang, Y.W.; Wang, D.H.; Zhai, P.M.; Gu, G.J.; He, J.H. Spatial Distributions and Seasonal Variations of Tropospheric Water Vapor Content over the Tibetan Plateau. J. Clim. 2013, 26, 5637–5654. [Google Scholar] [CrossRef]
  30. Wang, S.; Wang, X.; Chen, G.; Yang, Q.; Wang, B.; Ma, Y.; Shen, M. Complex responses of spring alpine vegetation phenology to snow cover dynamics over the Tibetan Plateau, China. Sci. Total Environ. 2017, 593–594, 449–461. [Google Scholar] [CrossRef]
  31. Gao, Q.; Guo, Y.; Xu, H.; Ganjurjav, H.; Li, Y.; Wan, Y.; Qin, X.; Ma, X.; Liu, S. Climate change and its impacts on vegetation distribution and net primary productivity of the alpine ecosystem in the Qinghai-Tibetan Plateau. Sci. Total Environ. 2016, 554–555, 34–41. [Google Scholar] [CrossRef] [PubMed]
  32. Pang, G.J.; Wang, X.J.; Yang, M.X. Using the NDVI to identify variations in, and responses of, vegetation to climate change on the Tibetan Plateau from 1982 to 2012. Quat. Int. 2017, 444, 87–96. [Google Scholar] [CrossRef]
  33. Jiang, Y.C.; Li, D.L.; Zheng, R. Variation characteristics of snow cover and frozen soil and their relationships with vegetation in the Tibetan Plateau from 1971 to 2016. Trans. Atmos. Sci. 2020, 43, 481–494. (In Chinese) [Google Scholar] [CrossRef]
  34. Li, Q.; Zhang, C.L.; Wang, R.D.; Zhou, N. Climate change and impact on desertification in Qinghai-Tibet Plateau from 1965–2016. J. Beijing Norm. Univ. Nat. Sci. 2018, 54, 659–665. (In Chinese) [Google Scholar] [CrossRef]
  35. Cao, X.J.; Ganjurjav, H.; Liang, Y.; Gao, Q.Z.; Zhang, Y.; Li, Y.E.; Wan, Y.F.; Danjiu, L.B. Temporal and spatial distribution of grassland degradation in northern Tibet based on NDVI. Acta Pratacult. Sin. 2016, 25, 1–8. (In Chinese) [Google Scholar] [CrossRef]
  36. Li, W.X.; Xu, J.; Yao, Y.Q.; Zhang, Z.C. Temporal and Spatial Changes in the Vegetation Cover (NDVI) in the Three-River Headwater Region, Tibetan Plateau, China under Global Warming. Mt. Res. 2021, 39, 473–482. (In Chinese) [Google Scholar] [CrossRef]
  37. Gao, Q.; Li, Y.; Wan, Y.F.; Wan, Y.; Lin, E.; Xiong, W.; Wangzha, J.; Wang, B.; Wenfu, L. Grassland degradation in Northern Tibet based on remote sensing data. J. Geogr. Sci. 2006, 16, 165–173. [Google Scholar] [CrossRef]
  38. Liang, S.H.; Chen, J.; Jin, X.M.; Wan, L.; Gong, B. Regularity of Vegetation Coverage Changes in the Tibetan Plateau over the Last 21 Years. Adv. Earth Sci. 2007, 22, 33–40. (In Chinese) [Google Scholar] [CrossRef]
  39. Liu, J.Y.; Xu, X.L.; Sao, Q.Q. The Spatial and Temporal Characteristics of Grassland Degradation in the Three-River Headwaters Region in Qinghai Province. J. Geogr. Sci. 2008, 18, 364–376. [Google Scholar] [CrossRef]
  40. Lu, Q.; Wu, S.H.; Zhao, D.S. Variations in Alpine Grassland Cover and Its Correlation with Climate Variables on the Qinghai-Tibet Plateau in 1982–2013. Sci. Geogr. Sin. 2017, 37, 292–300. (In Chinese) [Google Scholar] [CrossRef]
  41. Hua, Y.; Wang, S.; Jiang, J.; Zhou, W.; Xu, Q.; Li, X.; Liu, B.; Zhang, D.; Zheng, M. Characteristics and sources of aerosol pollution at a polluted rural site southwest in Beijing, China. Sci. Total Environ. 2018, 626, 519–527. [Google Scholar] [CrossRef] [PubMed]
  42. Yang, Y.H.; Piao, S.L. Variation in grassland vegetation cover in relation to climatic factors on the Tibetan Plateau. J. Plant Ecol. 2006, 1, 1–8. (In Chinese) [Google Scholar] [CrossRef]
  43. Zhuo, G.; Chen, S.R.; Zhou, B. Spatio-temporal variation of vegetation coverage over the Tibetan Plateau and its responses to climatic factors. Acta Ecol. Sin. 2018, 38, 3208–3218. (In Chinese) [Google Scholar] [CrossRef]
  44. Yeh, T.C. Some aspects of the thermal influences of the Qinghai-Tibetan Plateau on the atmospheric circulation. Arch. Met. Geoph. Biokl. Ser. A 1982, 31, 205–220. [Google Scholar] [CrossRef]
  45. Chen, L.X.; Reiter, E.R.; Feng, Z.Q. The atmospheric heat source over the Tibetan Plateau: May–August 1979. Mon. Weather Rev. 1985, 113, 1741–1791. [Google Scholar] [CrossRef]
  46. Zhao, P.; Chen, L.X. Interannual variability of atmospheric heat source/sink over the Qinghai-Xizang (Tibetan) Plateau and its relation to circulation. Adv. Atmos. Sci. 2001, 18, 106–116. [Google Scholar] [CrossRef]
  47. Wu, G.; Liu, Y.; Zhang, Q.; Duan, A.; Wang, T.; Wan, R.; Liu, X.; Li, W.; Wang, Z.; Liang, X. The Influence of the Mechanical and Thermal Forcing of the Tibetan Plateau on the Asian Climate. J. Hydrometeor. 2007, 8, 770–789. [Google Scholar] [CrossRef] [Green Version]
  48. Wang, B.; Bao, Q.; Hoskins, B.; Wu, G.X.; Liu, Y.M. Tibetan Plateau warming and precipitation changes in East Asia. Geophys. Res. Lett. 2008, 35, L14702. [Google Scholar] [CrossRef] [Green Version]
  49. Liu, G.; Zhao, P.; Nan, S.; Chen, J.; Wang, H. Advances in the study of linkage between the tibetan plateau thermal anomaly and atmospheric circulations over its upstream and downstream regions. Acta Meteorol. Sin. 2018, 76, 861–869. (In Chinese) [Google Scholar] [CrossRef]
  50. Huete, A.; Didan, K.; Miura, T.; Rodriguez, E.P.; Gao, X.; Ferreira, L.G. Overview of the radiometric and biophysical performance of the MODIS vegetation indices. Remote Sens. Environ. 2002, 83, 195–213. [Google Scholar] [CrossRef]
  51. Weltzin, J.F.; Loik, M.E.; Schwinning, S.; Williams, D.G.; Fay, P.A.; Haddad, B.M.; Harte, J.; Huxman, T.E.; Knapp, A.K.; Lin, G.; et al. Assessing the response of terrestrial ecosystems to potential changes in precipitation. BioScience 2003, 53, 941–952. [Google Scholar] [CrossRef]
  52. Sarkar, S.; Kafatos, M. Interannual variability of vegetation over the Indian sub-continent and its relation to the different meteorological parameters. Remote Sens. Environ. 2004, 90, 268–280. [Google Scholar] [CrossRef]
  53. Notaro, M.; Williams, M.J.W. Projected vegetation changes for the American Southwest: Combined dynamic modeling and bioclimatic-envelope approach. Ecol. Appl. 2012, 22, 1365–1388. [Google Scholar] [CrossRef] [PubMed]
  54. Jiang, X.; Rauscher, S.A.; Ringler, T.D.; Lawrence, D.M.; Williams, A.P.; Allen, C.D.; Steiner, A.L.; Cai, D.M.; McDowell, N.G. Projected Future Changes in Vegetation in Western North America in the Twenty-First Century. J. Clim. 2013, 26, 3671–3687. [Google Scholar] [CrossRef]
  55. Yu, M.; Wang, G.L.; Parr, D.; Ahmed, K.F. Future changes of the terrestrial ecosystem based on a dynamic vegetation model driven with RCP8.5 climate projections from 19 GCMs. Clim. Chang. 2014, 127, 257–271. [Google Scholar] [CrossRef]
  56. Sun, J. Study on the biomass characteristics and their allocation mechanism in Tibetan alpine grassland. Ph.D. Thesis, University of Chinese Academy of Sciences, Beijing, China, 2013. (In Chinese). [Google Scholar]
  57. Fensholt, R.; Rasmussen, K.; Nielsen, T.T.; Mbow, C. Evaluation of earth observation based long term vegetation trends—Intercomparing NDVI time series trend analysis consistency of Sahel from AVHRR GIMMS. Terra MODIS and SPOT VGT data. Remote Sens. Environ. 2009, 113, 1886–1898. [Google Scholar] [CrossRef]
  58. Alcaraz-Segura, D.; Liras, E.; Tabik, S.; Paruelo, J.; Cabello, J. Evaluating the consistency of the 1982–1999 NDVI trends in the Iberian Peninsula across four time-series derived from the AVHRR sensor. LTDR, GIMMS, FASIR, and PAL-II. Sensors 2010, 10, 1291–1314. [Google Scholar] [CrossRef] [PubMed]
  59. Chen, Y.L.; Long, B.J.; Pan, X.B.; Zhong, S.Q.; Mo, W.H. Differences between MODIS NDVI and AVHRR NDVI in monitoring grasslands change. J. Remote Sens. 2011, 15, 831–845. [Google Scholar] [CrossRef] [Green Version]
  60. Fensholt, R.; Rasmussen, K. Analysis of trends in the Sahelian ‘rain-use efficiency’ using GIMMS NDVI, RFE and GPCP rainfall data. Remote Sens. Environ. 2011, 115, 438–451. [Google Scholar] [CrossRef]
  61. Du, J.Q.; Shu, J.M.; Wang, Y.H.; Li, Y.C.; Zhang, L.B.; Guo, Y. Comparison of GIMMS and MODIS normalized vegetation index composite data for Qinghai-Tibet Plateau. Chin. J. Appl. Ecol. 2015, 25, 533–544. (In Chinese) [Google Scholar]
  62. Beck, H.E.; Mcvicar, T.R.; Dijk, A.; Schellekens, J.; Jeu, R.; Bruijnzeel, L.A. Global evaluation of four AVHRR-NDVI data sets: Intercomparison and assessment against Landsat imagery. Remote Sens. Environ. 2011, 115, 2547–2563. [Google Scholar] [CrossRef]
  63. Liu, S.Y.; Zhang, L.; Wang, C.Z. Vegetation Phenology in the Tibetan Plateau Using MODIS Data from 2000 to 2010. Remote Sens. Inf. 2014, 29, 25–30. (In Chinese) [Google Scholar]
  64. Gallo, K.; Li, J.; Reed, B.; Eidenshink, J.; Dwyer, J. Multi-platform comparisons of MODIS and AVHRR normalized difference vegetation index data. Remote Sens. Environ. 2005, 99, 221–231. [Google Scholar] [CrossRef]
  65. Fensholt, R.; Proud, S.R. Evaluation of Earth Observation based global long term vegetation trends - Comparing GIMMS and MODIS global NDVI time series. Remote Sens. Environ. 2012, 119, 131–147. [Google Scholar] [CrossRef]
  66. Beck, P.; Goetz, S.J. Satellite observations of high northern latitude vegetation productivity changes between 1982 and 2008: Ecological variability and regional differences. Environ. Res. Lett. 2011, 6, 45501–45510. [Google Scholar] [CrossRef]
  67. North, G.R.; Bell, T.L.; Cahalan, R.F.; Moeng, F.J. Sampling errors in the estimation of empirical orthogonal function. Mon. Weather Rev. 1982, 110, 699–706. [Google Scholar] [CrossRef]
  68. Liu, M.G. Atlas of Physical Geography of China, 3rd ed.; Sinomap Press: Beijing, China, 2010. (In Chinese) [Google Scholar]
  69. Zhang, W.J.; Gao, Z.Q. Study on The Response of Vegetation Cover to Precipitation and Temperature in Central/East Tibetan Plateau. Prog. Geogr. 2005, 24, 13–22. (In Chinese) [Google Scholar] [CrossRef]
  70. Braswell, B.H.; Schimel, D.S.; Under, E.; Moore, B. The response of global terrestrial ecosystems to interannual temperature variability. Science 1997, 278, 870–872. [Google Scholar] [CrossRef]
  71. Potter, C.S.; Brooks, V. Global analysis of empirical relations between annual climate and seasonality of NDVI. Int. J. Remote Sens. 1998, 19, 2921–2948. [Google Scholar] [CrossRef]
  72. Li, X.; Li, X.B.; Chen, Y.H.; Ying, G. Temporal Response of Vegetation to Climate Variables in Temperate Steppe of Northern China. Chin. J. Plant. Ecol. 2007, 31, 1054–1062. [Google Scholar] [CrossRef]
  73. Zhao, Y.P.; Zhang, X.Z.; Wang, J.S.; Shen, Z.X. Correlation Analysis between NDVI and Climatic Factors of Grassland Ecosystems in the Northern Tibetan Plateau from 1982 to 2003. Resour. Sci. 2009, 31, 1988–1998. (In Chinese) [Google Scholar] [CrossRef]
  74. Huang, K.; Zhang, Y.; Zhu, J.; Liu, Y.; Zu, J.; Zhang, J. The Influences of Climate Change and Human Activities on Vegetation Dynamics in the Qinghai-Tibet Plateau. Remote Sens. 2016, 8, 876. [Google Scholar] [CrossRef] [Green Version]
  75. Zhang, R.H.; Su, F.G.; Jiang, Z.H.; Gao, X.J. An overview of projected climate and environmental changes across the Tibetan Plateau in the 21st century. Chin. Sci. Bull. 2015, 60, 3036–3047. (In Chinese) [Google Scholar] [CrossRef]
  76. Wang, Z.P.; Zhang, X.Z.; He, Y.T.; Li, M.; Shi, P.L.; Zu, J.X.; Niu, B. Responses of normalized difference vegetation index (NDVI) to precipitation changes on the grassland of Tibetan Plateau from 2000 to 2015. Chin. J. Appl. Ecol. 2018, 29, 75–83. (In Chinese) [Google Scholar] [CrossRef]
  77. Xu, G.; Zhang, H.; Chen, B.; Zhang, H.; Innes, J.L.; Wang, G.; Yan, J.; Zheng, Y.; Zhu, Z.; Myneni, R.B. Changes in Vegetation Growth Dynamics and Relations with Climate over China’s Landmass from 1982 to 2011. Remote Sens. 2014, 6, 3263–3283. [Google Scholar] [CrossRef] [Green Version]
  78. Dong, W.; Lin, Y.; Wright, J.S.; Ming, Y.; Xie, Y.; Wang, B.; Luo, Y.; Huang, W.; Huang, J.; Wang, L.; et al. Summer rainfall over the southwestern Tibetan Plateau controlled by deep convection over the Indian subcontinent. Nat. Commun. 2016, 7, 10925. [Google Scholar] [CrossRef] [PubMed] [Green Version]
  79. Jiang, X.; Ting, M.A. Dipole Pattern of Summertime Rainfall across the Indian Subcontinent and the Tibetan Plateau. J. Clim. 2017, 30, 9607–9620. [Google Scholar] [CrossRef]
  80. Liu, X.; Yin, Z.-Y. Spatial and temporal variation of summer precipitation over the eastern Tibetan Plateau and the North Atlantic Oscillation. J. Clim. 2001, 14, 2896–2909. [Google Scholar] [CrossRef]
  81. Liu, H.; Duan, K.; Li, M.; Shi, P.; Yang, J.; Zhang, X.; Sun, J. Impact of the North Atlantic Oscillation on the dipole oscillation of summer precipitation over the central and eastern Tibetan Plateau. Int. J. Climatol. 2015, 35, 4539–4546. [Google Scholar] [CrossRef]
  82. Wang, Z.Q.; Duan, A.; Yang, S.; Ullah, K. Atmospheric moisture budget and its regulation on the variability of summer precipitation over the Tibetan Plateau. J. Geophys. Res. Atmos. 2017, 122, 614–630. [Google Scholar] [CrossRef]
  83. Gao, Y.; Wang, H.; Li, S. Influences of the Atlantic Ocean on the summer precipitation of the southeastern Tibetan Plateau. J. Geophys. Res. Atmos. 2013, 118, 3534–3544. [Google Scholar] [CrossRef]
  84. Chen, X.Y.; You, Q.L. Effect of Indian Ocean SST on Tibetan Plateau precipitation in the early rainy season. J. Clim. 2017, 30, 8973–8985. [Google Scholar] [CrossRef]
  85. He, K.; Liu, G.; Zhao, J.; Li, J. Co-variability of the summer NDVIs on the eastern Tibetan Plateau and in the Lake Baikal region: Associated climate factors and atmospheric circulation. PLoS ONE 2020, 15, e0239465. [Google Scholar] [CrossRef] [PubMed]
  86. Xu, J.J.; Lu, J. Precipitation over the Qinghai-Xizang Plateau in summer and its association with the Eurasian snow cover. J. Nanjing Inst. Meteor. 1992, 15, 517–524. (In Chinese) [Google Scholar]
  87. Wang, H.; Liu, G.; Wang, S.; He, K. Precursory Signals (SST and Soil Moisture) of Summer Surface Temperature Anomalies over the Tibetan Plateau. Atmosphere 2021, 12, 146. [Google Scholar] [CrossRef]
  88. He, K.; Liu, G.; Wu, R.; Nan, S.; Wang, S.; Zhou, C.; Qi, D.; Mao, X.; Wang, H.; Wei, X. Oceanic and land relay effects in the link between spring sea surface temperatures in the Indian Ocean and summer precipitation over the Tibetan Plateau. Atmos. Res. 2022, 266, 105953. [Google Scholar] [CrossRef]
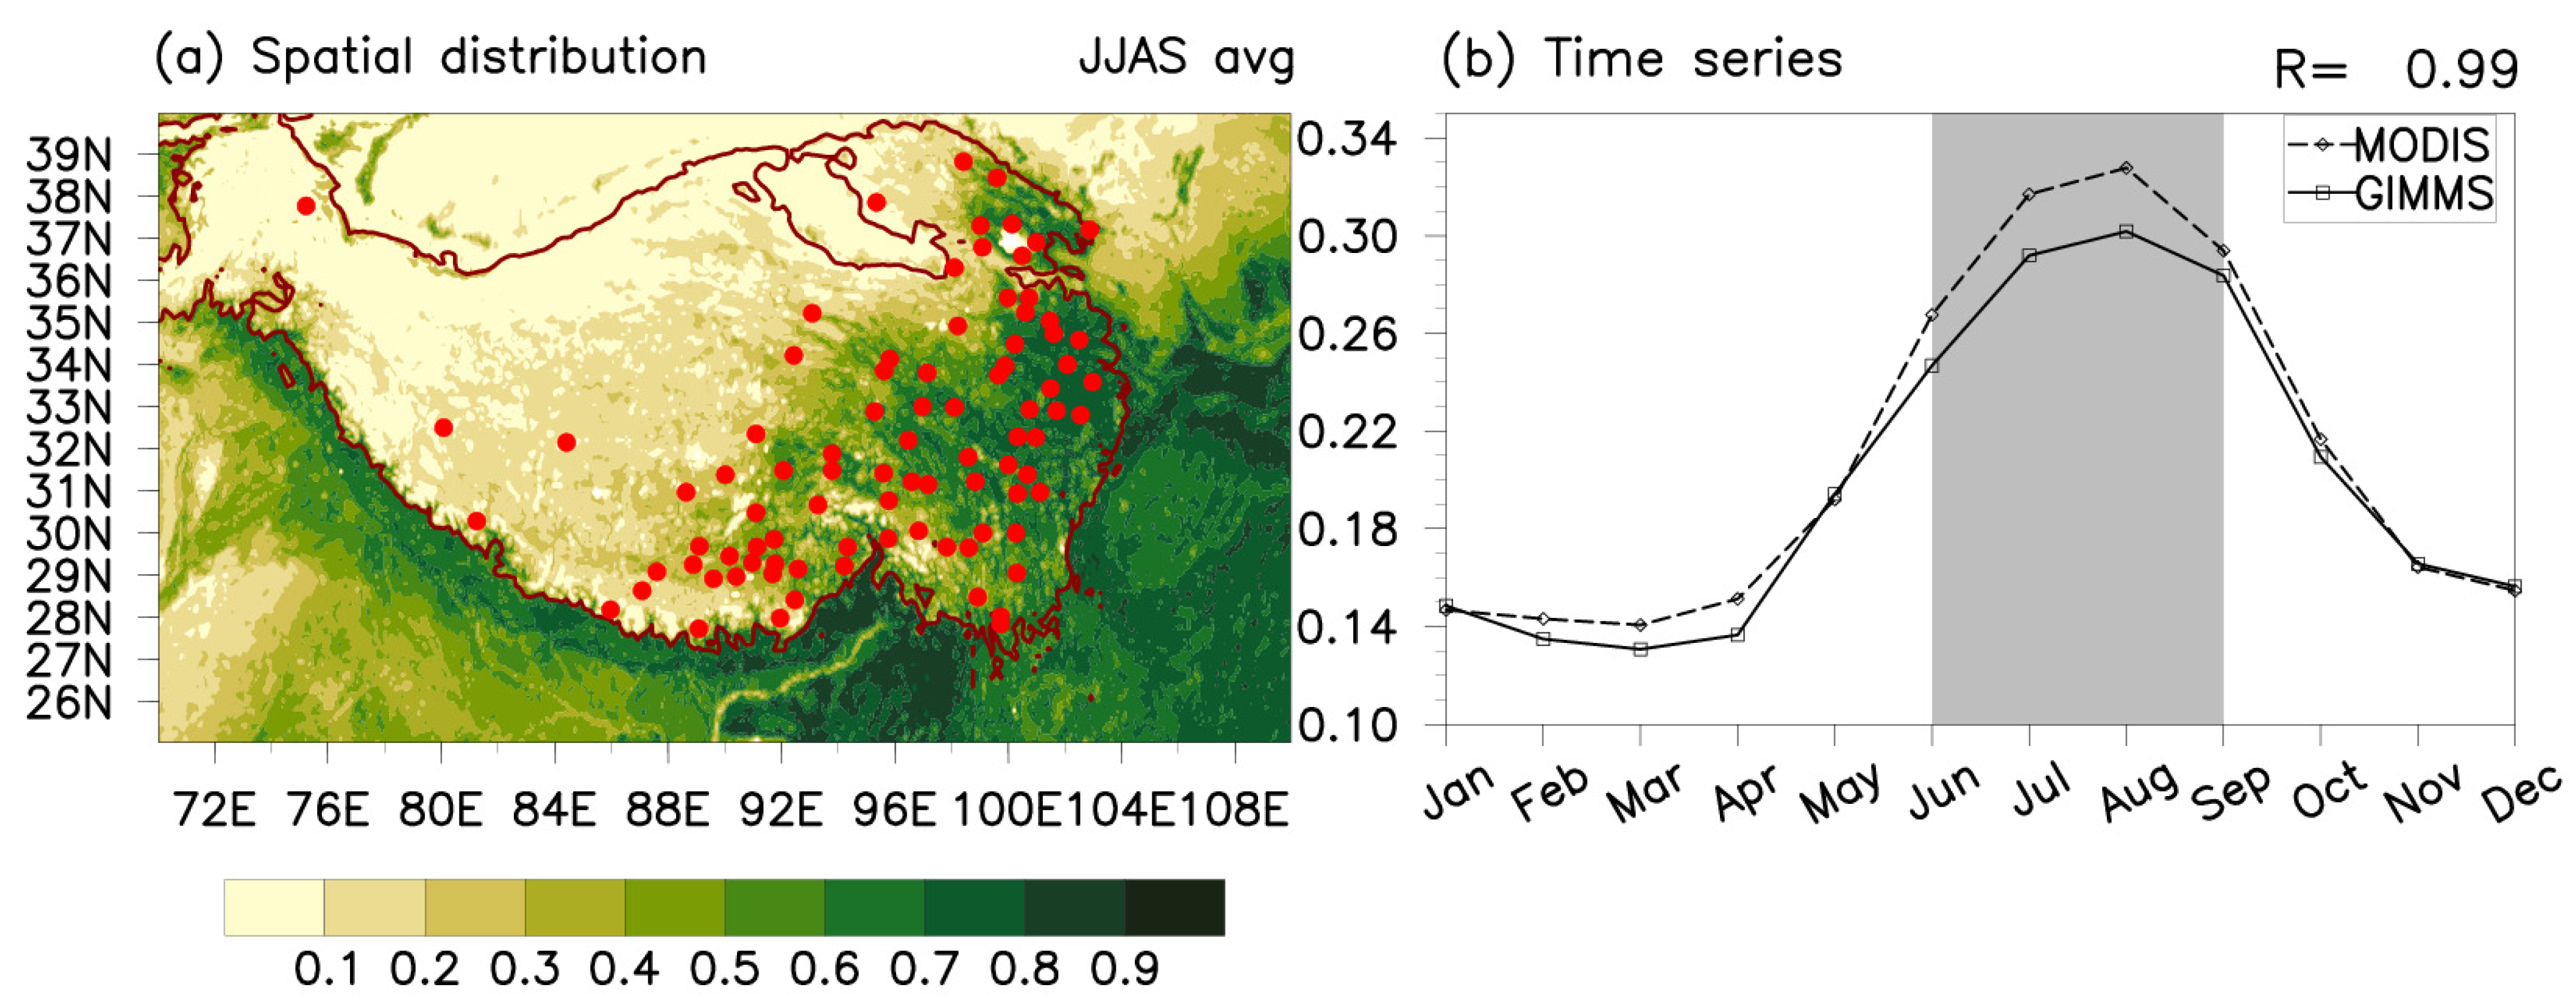
Figure 1. (a) Map showing the location of the study area and 88 meteorological stations (red dots) within the boundary of the TP (3000 m above sea level; brown lines). Shadings denote the TP NDVI during the main growing season (JJAS) for the period 2002–2014. (b) Annual cycles of the TP NDVI for the period 2002–2014. The gray shading indicates the TP vegetation during JJAS, and the solid and dashed lines represent the monthly evolution of the GIMMS and MODIS NDVIs, respectively.
Remotesensing 14 05183 g001
Figure 2. The first (EOF1; (a)) and second (EOF2; (b)) EOF modes of the JJAS standardized GIMMS NDVI anomalies over the TP during the period 2002–2014. (c,d) as in (a,b), respectively, but for the MODIS NDVI anomalies.
Remotesensing 14 05183 g002
Figure 3. (a) The time series of PC1 during the period 2002–2014, in which the black solid, black dashed, and red dashed lines represent the GIMMS- and MODIS-based PC1, respectively. (b) as in (a), but for the time series of PC2. (c) The time series of the fitted and spliced PC1 during the period 1982–2020. (d) as in (c), but for the time series of PC2.
Remotesensing 14 05183 g003
Figure 4. JJAS TP NDVI anomalies regressed upon PC1 (a) and PC2 (b) for the period 1982–2020, in which the NDVI anomalies significant at the 95% confidence level are stippled with black dots.
Remotesensing 14 05183 g004
Figure 5. MJJA PRE ((a); unit: mm), SAT ((c); unit: °C), GST ((e); unit: °C), and SSD ((g); unit: hours) anomalies regressed upon the JJAS UNI for the period 1982–2020. Lead (1) denotes anomalous climatic factors that occurred one month earlier than the NDVI anomalies. (b,d,f,h) as in (a,c,e,g), but for anomalous climatic factors during JJAS. Lead (0) denotes anomalous climatic factors that occurred at the same time as the NDVI anomalies. Anomalies of climatic factors significant at the 95% confidence level are stippled with black dots.
Remotesensing 14 05183 g005
Figure 6. MJJA PRE ((a); unit: mm), SAT ((c); unit: °C), GST ((e); unit: °C), and SSD ((g); unit: hours) anomalies regressed upon the JJAS DNI for the period 1982–2020. Lead (1) denotes anomalous climatic factors that occurred one month earlier than the NDVI anomalies. (b,d,f,h) as in (a,c,e,g), but for anomalous climatic factors during JJAS. Lead (0) denotes anomalous climatic factors that occurred at the same time as the NDVI anomalies. Anomalies of climatic factors significant at the 95% confidence level are stippled with black dots.
Remotesensing 14 05183 g006
Figure 7. (a) JJAS NDVI anomalies regressed upon the combined-effect index for the UNI during the period 1982–2020. The other figures are as in (a), but for the regression upon the combined-effect index after removing the effect of the PRE (b), SSD (c), GST (d), and SAT (e) anomalies, respectively. NDVI anomalies significant at the 95% confidence level are stippled with black dots.
Remotesensing 14 05183 g007
Figure 8. (a) JJAS NDVI anomalies regressed upon the combined-effect index for the DNI during the period 1982–2020. The other figures are as in (a), but for the regression upon the combined-effect index after removing the effect of the GST (b), PRE (c), SAT (d), and SSD (e) anomalies, respectively. NDVI anomalies significant at the 95% confidence level are stippled with black dots.
Remotesensing 14 05183 g008
Table 1. Definition of the indices of the climate factors responsible for the uniform and dipole NDVI patterns and associated key regions.
IndicesUniform NDVI PatternDipole NDVI Pattern
PREArea-mean PRE anomalies over (28–35°N, 80–92°E) in MJJA.Difference between area-mean PRE anomalies over (33–40°N, 91–104°E) and that over (28–33°N, 81–94°E) in MJJA.
SATArea-mean SAT anomalies over (34–40°N, 70–104°E) in JJAS.Area-mean SAT anomalies over (33–40°N, 70–104°E) in JJAS.
GSTArea-mean GST anomalies over (33–40°N, 70–104°E) in JJAS.Area-mean GST anomalies over (34–40°N, 70–104°E) in JJAS.
SSDArea-mean SSD anomalies over (30–35°N, 90–104°N) in JJAS.Area-mean SSD anomalies over (28–30°N, 76–104°N]) in JJAS.
Publisher’s Note: MDPI stays neutral with regard to jurisdictional claims in published maps and institutional affiliations.