Article

The Evolution of Irrigation Effects on Agricultural Drought Mitigation in North China

1
State Key Laboratory of Remote Sensing Science, Aerospace Information Research Institute, Chinese Academy of Sciences, Beijing 100101, China
2
College of Resources and Environment, University of Chinese Academy of Sciences, Beijing 100049, China
3
Key Laboratory of Geospatial Technology for the Middle and Lower Yellow River Regions (Henan University), Ministry of Education, Kaifeng 475004, China
4
Information and Research Institute of Meteorology, Hydrology and Environment (IRIMHE), Ulaanbaatar 15160, Mongolia
*
Author to whom correspondence should be addressed.
Remote Sens. 2022, 14(20), 5197; https://doi.org/10.3390/rs14205197
Submission received: 19 August 2022 / Revised: 4 October 2022 / Accepted: 12 October 2022 / Published: 17 October 2022
(This article belongs to the Section Remote Sensing in Agriculture and Vegetation)

Abstract

:
Drought is one of the most common natural threats to agricultural production worldwide. Few studies have studied the effects of agricultural practices on drought mitigation at a regional scale over a long period. This paper analyzes the spatiotemporal characteristics in the agricultural drought-affected area change index (ADAC), which was developed to assess the drought mitigation. The linear regression method was used to investigate the impact factors on the change of ADAC in the three main winter wheat provinces of northern China. The results showed that the average ADAC during the main growing season in the study area was approximately −61.5% over the past 38 years, which indicated a great decrease of the agricultural drought-affected area. The significant decreasing trends of ADAC values across the study area during 1981–2000 could be explained by the area percentage equipped for irrigation (APEI) by 49.2–89.7%. There was a lack of pronounced change trends of ADAC during 2001–2018, implying that the positive effects of irrigation infrastructure in the plain area might reach a plateau under the constraints of available water resources, and other agricultural practices need to be investigated in the future. This research provides helpful decision information on drought adaptation management and water conservation project planning.

1. Introduction

Drought is a worldwide natural threat and, in extreme cases, a disaster in economic, social and ecological terms [1]. From 1984 to 2017, drought caused annual economic losses in China of more than $5.5 billion [2]. Agriculture was the sector most affected by drought, accounting for more than 80% of total losses [3]. For example, in China, approximately 27 Mha of crop areas were affected by drought in 2000, and the economic losses exceeded more than 50 billion RMB [4]. Climate change will cause regional droughts to be more frequent and severe in the future [5,6,7]. The drought area is estimated to increase by approximately 15–44%, and the estimated losses might increase ten times compared to the 1986–2005 period under the scenario of a 1.5 °C increase from the current level in China [2]. The expanded drying regions will threaten global food security. Therefore, various drought mitigation measures have been applied to reduce or eliminate these negative effects [8].
There are diverse agricultural measures to combat drought globally. Measures with long-term effects, such as biological, institutional and infrastructural measures, can reduce the vulnerability of agricultural systems to drought. Agricultural practices with short-term effects aim to address one drought event [9]. Measures have been independently or jointly applied in a region by the government and farmer households [10,11,12]. Governments invest in infrastructure to serve as irrigation facilities, including canal lining, sprinkler irrigation, and drip or pipeline reservoirs [13,14], and they develop drought tolerance varieties and promote institutions for deficit irrigation [15,16,17,18], water rights and water prices [19]. Farmer households take anti-drought measures such as adjustment of the crop planting structure, mulching, irrigation and other agricultural inputs to improve crop yield based on experience [20,21,22].
Irrigation—the artificial provision of moisture to plants—is a major anti-drought measure [22,23,24,25]. Irrigation stabilizes climate extremes and variability by shifting the threshold to beyond the level at which crops will be negatively affected, and it can also prevent crop yield declines due to climate impacts [26,27,28,29,30]. However, overexpansion of irrigation also reduces the water supply accessible to crops with the restriction of water resources, exacerbating the impacts of extreme droughts [24,25]. Therefore, the effect of irrigation for combating drought can be instructive for developing and implementing mitigation schemes and can contribute to decision making regarding disaster management [3,14].
The drought mitigation measures involving irrigation mainly includes two types. One is non-engineering measures, such as increasing the amount of irrigation water, and deficit irrigation. Hydrological models are popular for assessing the effect of irrigation amounts on streamflow and groundwater, as well as stream temperature [31,32,33]. The effect of deficit irrigation is mostly studied to investigate the impacts on yield and water use efficiency in the filed scale [34,35,36,37]. However, the yield variable is not entirely appropriate for quantifying the effect of irrigation on drought mitigation due to many impact factors, such as fertilizer, disease and pest control. Neither statistical models involving the yield variable nor hydrological models have been used to assess the impacts of irrigation on mitigating drought directly. The other is the irrigation infrastructure, which provides access to water for irrigation and to enhance reliability of irrigation. It is a general and effective conventional engineering measure to adapt to drought [38,39]. The expansion of irrigation infrastructure makes the increase of irrigation possible, leads to substantial additional water withdrawals, and results in the agriculture system being more vulnerable to extreme droughts under the restriction of water resources [24,38,40]. Little research to date has investigated the performance of the irrigation infrastructure on drought mitigation over a long period.
Field investigations of agricultural measures involving irrigation on drought mitigation are normally limited by spatial representability and temporal continuity. Remote sensing technology has been widely applied to meteorological and agricultural drought monitoring worldwide [41,42,43,44]. To date, few studies have explored the quantitative impacts of irrigation infrastructure on drought mitigation at the regional scale. Wu et al. (2020) developed the index of agricultural drought area change (ADAC), which can reflect the spatiotemporal changes in the comprehensive performances of anti-drought measures on agricultural drought [45]. Unlike field investigations or model simulations, The ADAC index was calculated by using pixel-based PDSI and VHI data. The advantage of the ADAC can provide drought-mitigated area information at a regional scale. However, due to many agriculture practices applied in a region, the contribution of irrigation measures to drought mitigation over a long period has not been investigated.
The overall goal of this study is to examine the influence of irrigation infrastructure on drought mitigation in northern China over the past 38 years. First, the spatial and temporal changes in the ADAC for the growth period of winter wheat in three main production provinces of northern China were analyzed to provide a better understanding of the performance of anti-drought measures. Second, the impacts of area percentage equipped for irrigation (APEI) on drought mitigation were explored for two periods, which were determined by abrupt change point analysis of the ADAC. The results can support drought adaptation management under climate change, water conservation project management and investments in food security.

2. Materials and Methods
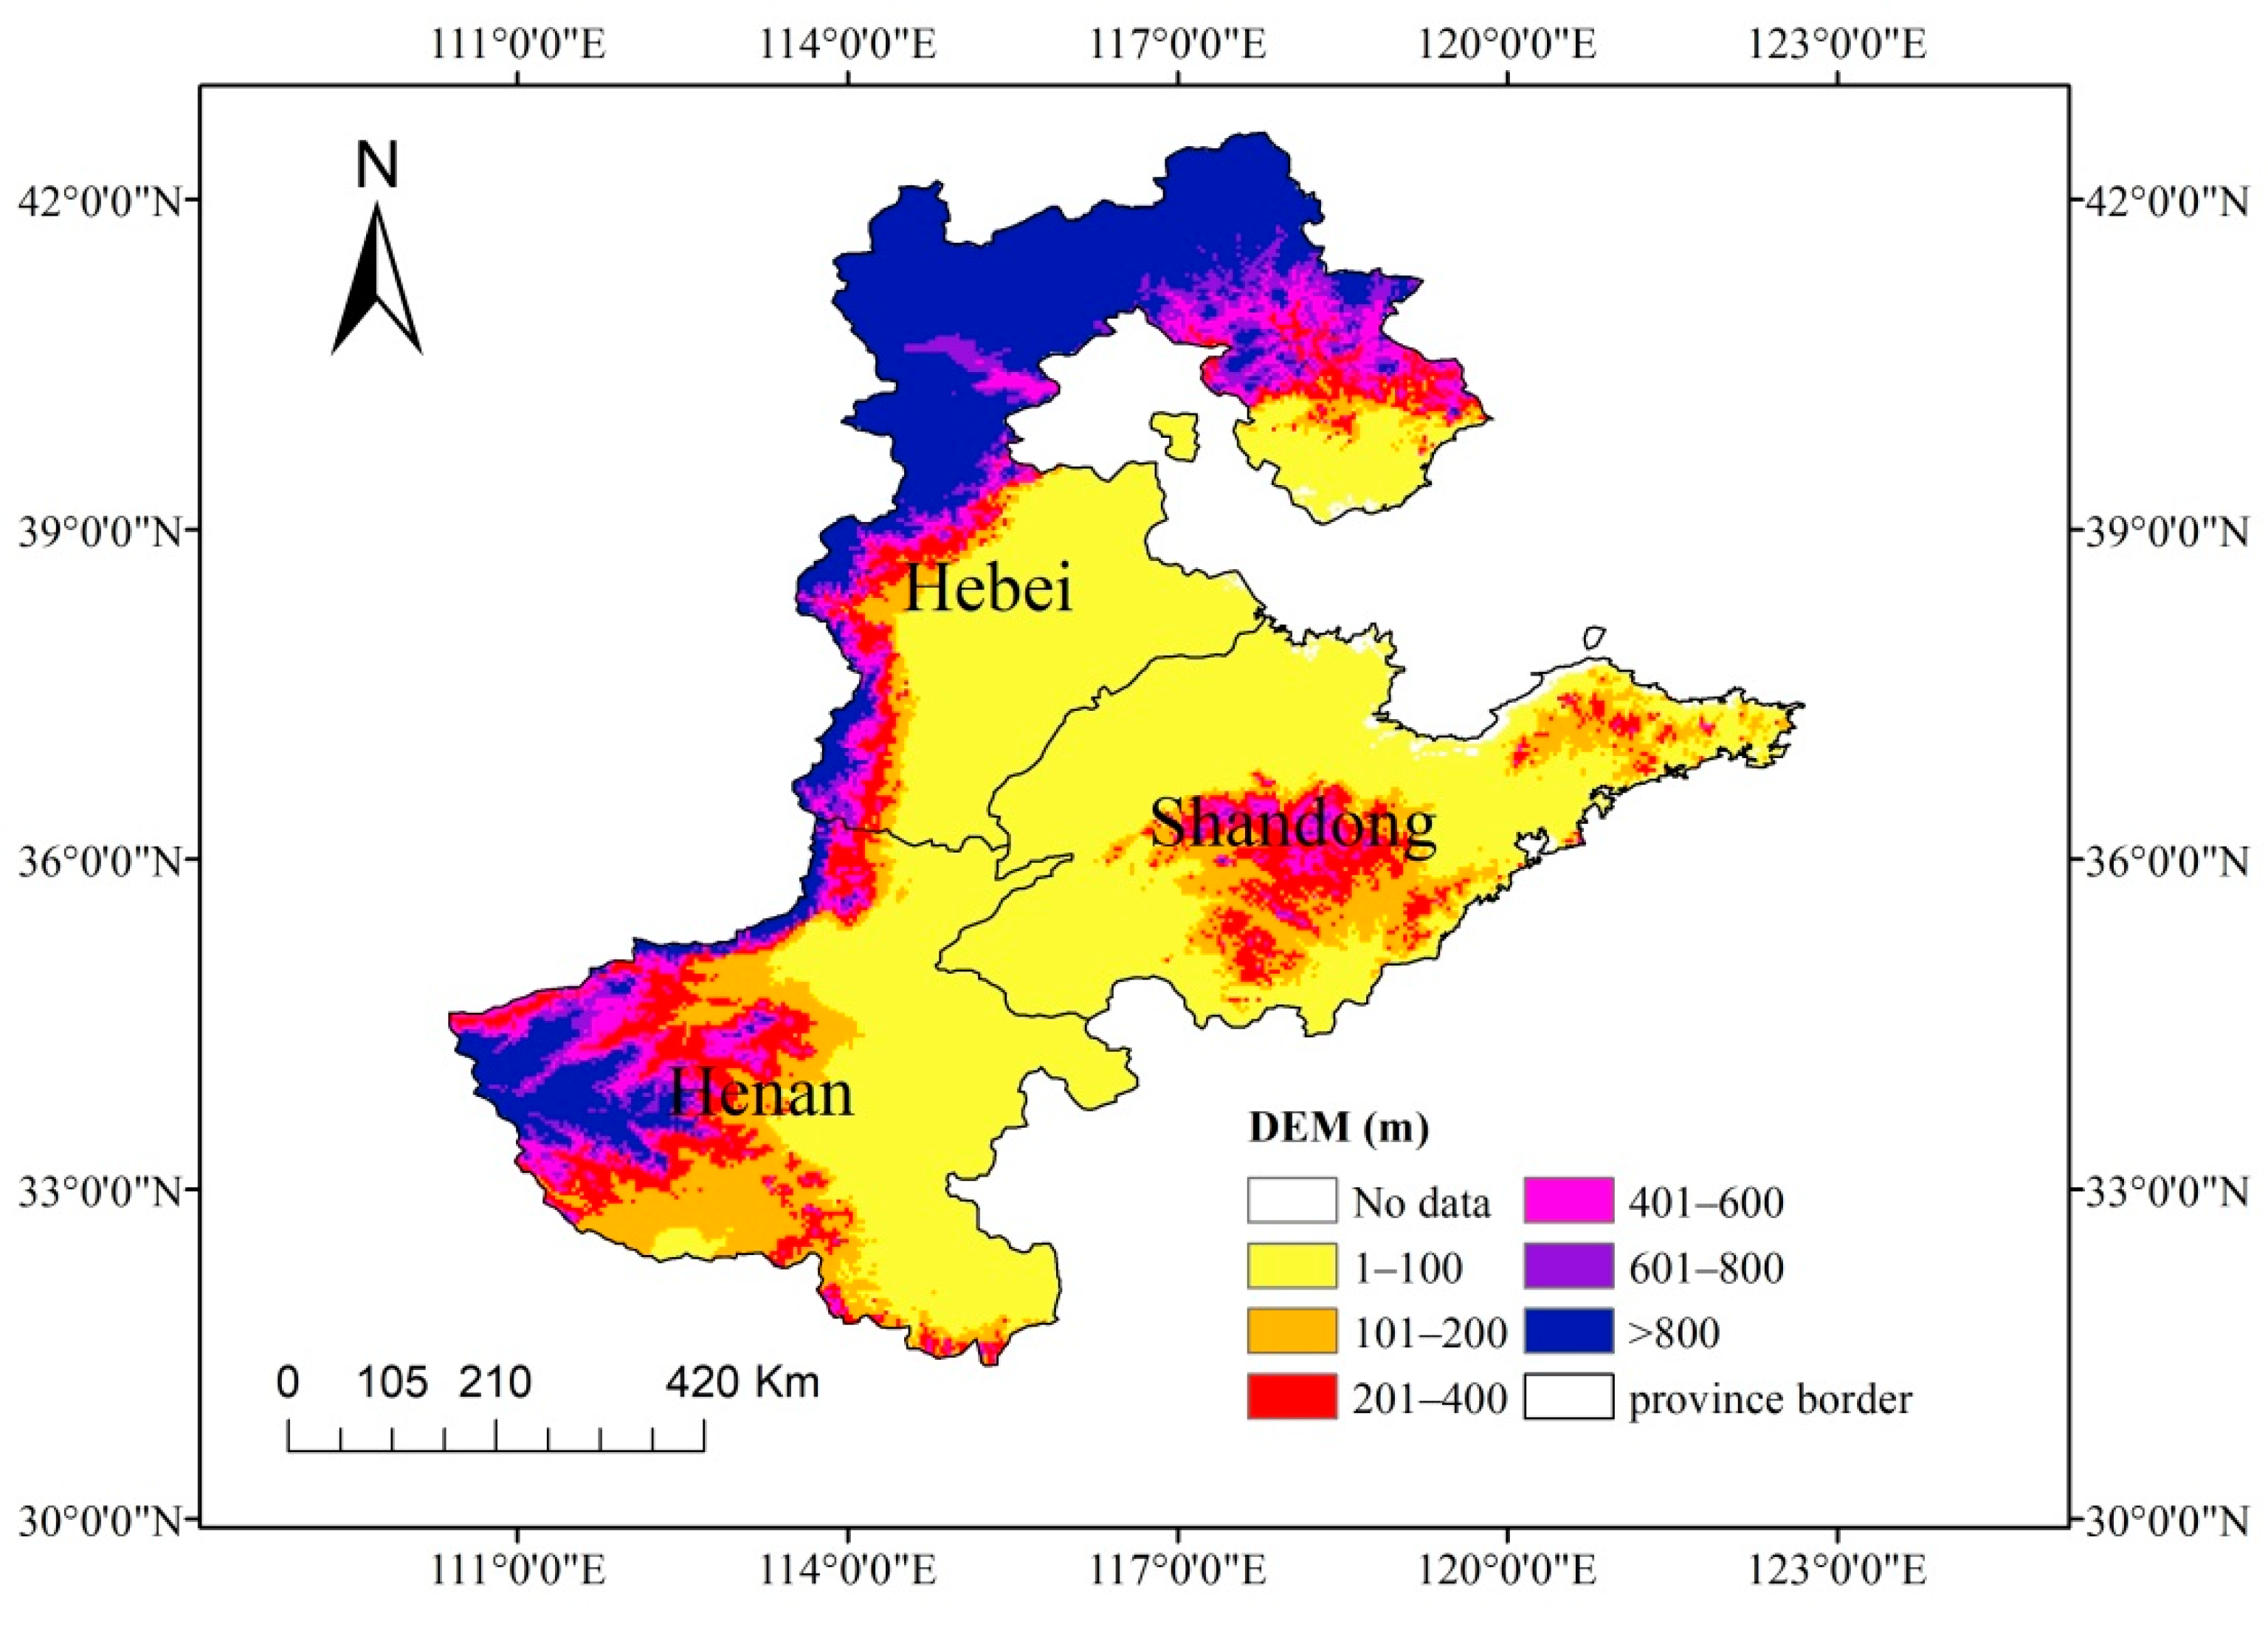
2.1. Study Area

The study area is located between 110.24 and 122.80° E and 31.38 and 42.67° N, including Hebei, Henan and Shandong Provinces (HHSP) in North China (Figure 1). It has a temperate zone continental monsoon climate with an average annual rainfall of 500–900 mm. Approximately 80% of annual precipitation is concentrated to between June and September. Drought, particularly spring and summer drought, is the most serious meteorological threat to agricultural production in the North China Plain (NCP), in which the major part was covered by the study area [46,47].
The study area is an important winter wheat (Triticum aestivum L.) production region in China, accounting for more than 55% of the total national wheat production. Due to insufficient precipitation during the wheat growth period, irrigation is definitely one of the major agricultural practices to mitigate the effects of drought and reduce the vulnerability of crop production in the NCP [35,48]. Canal lining, pipeline and drip and sprinkler irrigation from both surface water and groundwater resources have been applied in approximately 44% of the cropland in the Hai Basin, including the major part of the HHSP, since the 1980s [49]. Investigation of the performance of irrigation on drought mitigation over a long period for the study area will be valuable to support decision-making on planning and investment in irrigation water conservation projects.

2.2. Data

The Palmer drought severity index (PDSI) was developed based on the difference between actual and potential evapotranspiration [50] (Palmer, 1965). Potential evapotranspiration is calculated according to the water requirement for crop growth unconstrained by water availability. The PDSI has been widely used to identify meteorological drought at regional and global scales [6,38,42]. The global PDSI dataset from 1981 to 2018 was downloaded from the Terra Climate dataset supported by the University of Idaho (http://www.climatologylab.org/terraclimate.html, accessed on 1 February 2020). The dataset has an approximately 4 km resolution with a monthly time interval [51].
The Vegetative Health Index (VHI) is based on vegetation vigor and thermal conditions [52]. It has been successfully used in many countries and regions, such as North America, China, Mongolia and Africa [44,53]. The VHI dataset from 1981 to 2018 was downloaded from the website of the Centre for Satellite Applications and Research of the National Environmental Satellite, Data, and Information Service. The weekly VHI data for the study area were extracted with a spatial resolution of 4 km from 1981 to 2018 and composed of monthly data using the mean method.
The land cover product for 1990, 2000 and 2010 was collected from the Strategic Priority Research Program-Climate Change: Carbon Budget and Related Issues from the Chinese Academy of Science project [54]. The products used an object-oriented classification method to produce the land cover for all of China every ten years at a 30 m resolution and achieved over 90% accuracy on the first classes. The cropland type was extracted from the dataset for the study area. For convenience, it was converted into grid data with a spatial resolution of 4 km using ArcGIS [55].
A digital elevation model (DEM) was used to calculate the decadal annual change in ADAC for three topographic classes: the plain region (<200 m), hilly region (200–500 m) and mountain region (>500 m).
The provincial area equipped for irrigation (AEI), the winter crop planting area and the amount of agricultural irrigation water use data for the study area were acquired from the China National Statistical Data Website (http://data.stats.gov.cn, accessed on 1 February 2020). AEI or area percentage for irrigation (APEI) indicates the irrigation infrastructure development and is widely used to measure the capacity of drought mitigation for cultivated land.

2.3. Methodology

Agricultural drought is defined as a shortage of soil water for crop growth, and, hence, it adversely affects crop yield. It is related to climatic factors and regional agricultural practices. Wu et al. (2020) proposed an index of agricultural drought-affected area change (ADAC) to quantify the mitigation effect based on the difference between the percentages of drought-affected area identified by the PDSI and VHI (Equation (1)). The PDSI is assumed to be agricultural drought under natural conditions, the VHI is actual drought-triggered vegetation stress and the differences between the PDSI- and VHI-defined areas represent the mitigation achieved by agricultural practices, such as irrigation, mulching and crop variety. The range of ADAC is 0–100%. The lower the ADAC is, the greater the drought mitigation effect is, and vice versa.
A D A C i = PA ( V H I i < β | PDSI i < α ) PA ( PDSI i < α ) PA ( PDSI i < α )
where i is the spring season from March to May, and it is the critical growing period of winter wheat for the study area; α is the threshold parameter for judging drought by the PDSI; and β is the threshold parameter for judging drought by the VHI. PA () is the percentage of drought-affected area in the cropland in the unit. The values of α and β are −1.0 and 0.45, respectively. Here, the minor difference in the ADAC calculation from the original formula is that the agricultural drought-affected areas derived from the VHI in this study are calculated when the PDSI is also lower than α to ensure that vegetation under stress is caused by drought, not by other factors, such as plant diseases and insect pests.

2.4. Analysis

The Mann–Kendall (M–K) method has been widely used to identify varying trends in hydrological and climatological time series data [46,56]. The main purpose of the M–K test in this study is to investigate abrupt change in the 38-year ADAC data series.
A simple linear regression method was used to determine the change rates of the ADAC and AEI at different phases with monotonic trends. The F-test was performed to determine the significance of the fitting equation at a confidence interval of 95%. The Pearson correlation coefficient was used to investigate the relationships between the ADAC and provincial irrigation infrastructure at different phases after the Shapiro-Wilk normality test using SPSS software. A two-tailed significance test was applied to indicate a significant correlation at a confidence interval of 95%.

3. Results

3.1. Inter-Annual Change in Agricultural Drought Affected Area Change

The average values of the ADAC in the whole study area over the past 38 years were −61.5%. The average PDSI drought-affected area percentage of the total crop area was 52.1%, and the average VHI drought-affected area percentage was 30.1%. Agricultural practices caused the agricultural drought-affected area to decrease with great gratitude. The average drought-affected area percentages identified by the PDSI and VHI and the ADAC values for the spring period (March–May) during 1981–2018 are presented in Figure 2. The general weak increasing trends of the PDSI drought area percentage indicated that agriculture faces increasing drought risks under natural conditions. Similar results have also been presented in other studies [46,57]. However, the decreasing trends in the VHI drought-affected area indicated that the agricultural drought risks decreased. This finding was also confirmed by a study showing that no agricultural losses, but frequent droughts, were observed in the NCP [58]. Thus, the ADAC presented general decreasing trends over the past 38 years.
The average ADAC values for Hebei, Henan and Shandong Provinces were −52.5%, −68.8% and −63.2%, respectively. The annual change in ADAC in Henan Province had a significant decreasing trend with an annual decline rate of −1.8% and generally weak decreasing trends in Hebei and Shandong Provinces. As shown in Figure 3, it is obvious that the fluctuating change in the decadal ADAC for Hebei and Shandong provinces decreased from 1980s to the lowest point at 1990s (Hebei in 1997 and Shandong in 1998) and then converted to an increase. However, the significant change in the ADAC in Henan Province was attributed to the reverse trends of increasing PDSI drought areas to decreasing VHI drought areas.

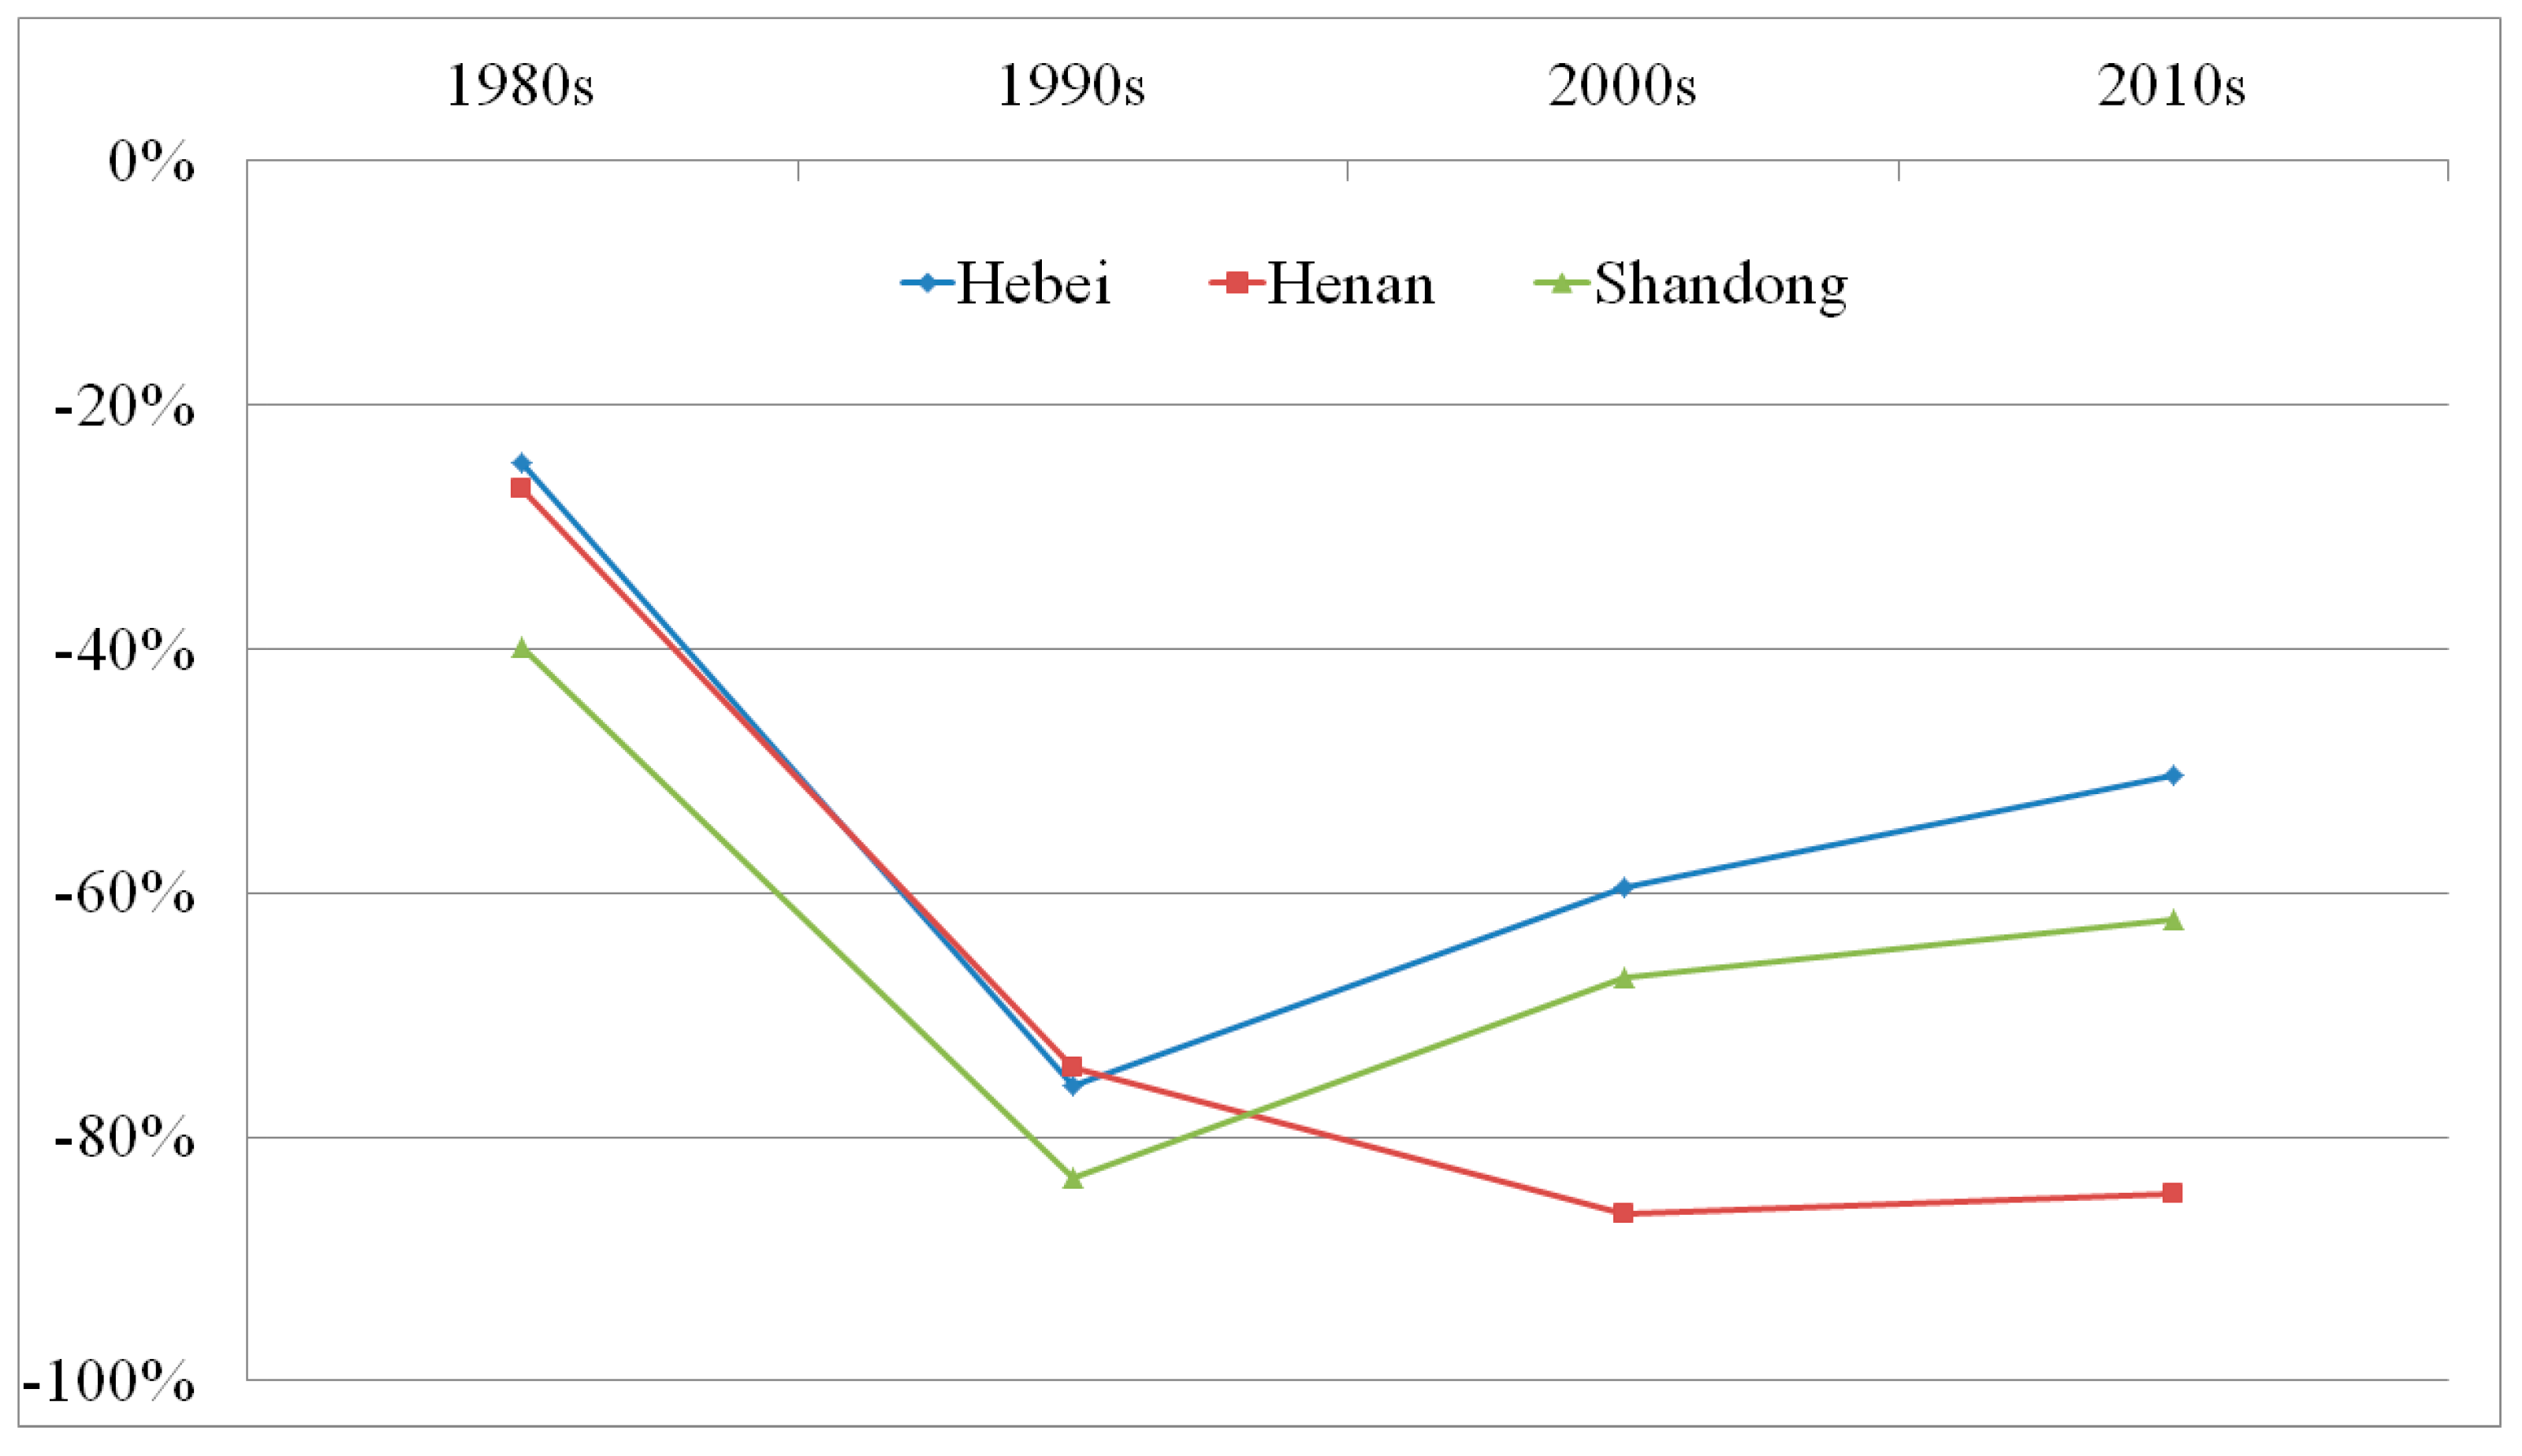
3.2. Decade Changes in Agricultural Drought Affected Area Change

ADAC values were calculated every decade for three provinces (Table 1). The increase in the PDSI drought area percentage by 7.2 and 1.5 percentage points from the 1980s to 2010s for Henan and Shandong Provinces indicated that drought risk increased under the impact of climate change in the two provinces. However, the PDSI drought area percentage decreased by 1.6 percentage points for Hebei Province. The actual agricultural drought area percentage decreased by 7.9, 2.2 and 8.5 percentage points for Hebei, Henan and Shandong, respectively. As a result, ADAC values decreased by 20.7, 54.3 and 20.9 percentage points from the 1980s to 2010s.
The decadal changes in the ADAC among the three provinces are different. The drops in ADAC in Hebei Province occurred from the 1980s to 1990s and then converted to increases in the 1990s–2000s and 2000s–2010s. Similar changes were shown in Shandong Province. The decreases in ADAC in Henan Province in the 1980s–1990s and 1990s–2000s converted to increases between the 2000s and 2010s. Generally, a substantial decrease in ADAC, with 47.3 percentage points for Hebei, 42.5 percentage points for Henan, and 41.8 percentage points for Shandong, occurred from the 1980s to 1990s. This implies that agricultural activities in the 1990s had the most significant and effective impacts on drought mitigation. Because the expansion of tube wells and use in agriculture began accelerating in the mid-1990s [59], the rapid development in irrigation infrastructure might be a critical measure of drought mitigation and increasing yield.

3.3. The Topographic Influence on Changes of ADAC

The average decadal ADAC for three topographic classes in three provinces were calculated (Table 2). The average drought area percentages of the PDSI and VHI in the plain region accounted for approximately 92% and 93%, respectively. The changes in the average decade ADAC in the plain region match well with those in all provinces. The changes in the ADAC in the hilly region and mountain regions are different. For instance, the average decade ADAC values increased from the 1980s to 2010s for Hebei and Shandong provinces in the hilly region and for Hebei and Henan provinces in the mountain region. This result indicated that the effective agricultural measures for drought mitigation during the 1990s were mostly implemented in the plain region.

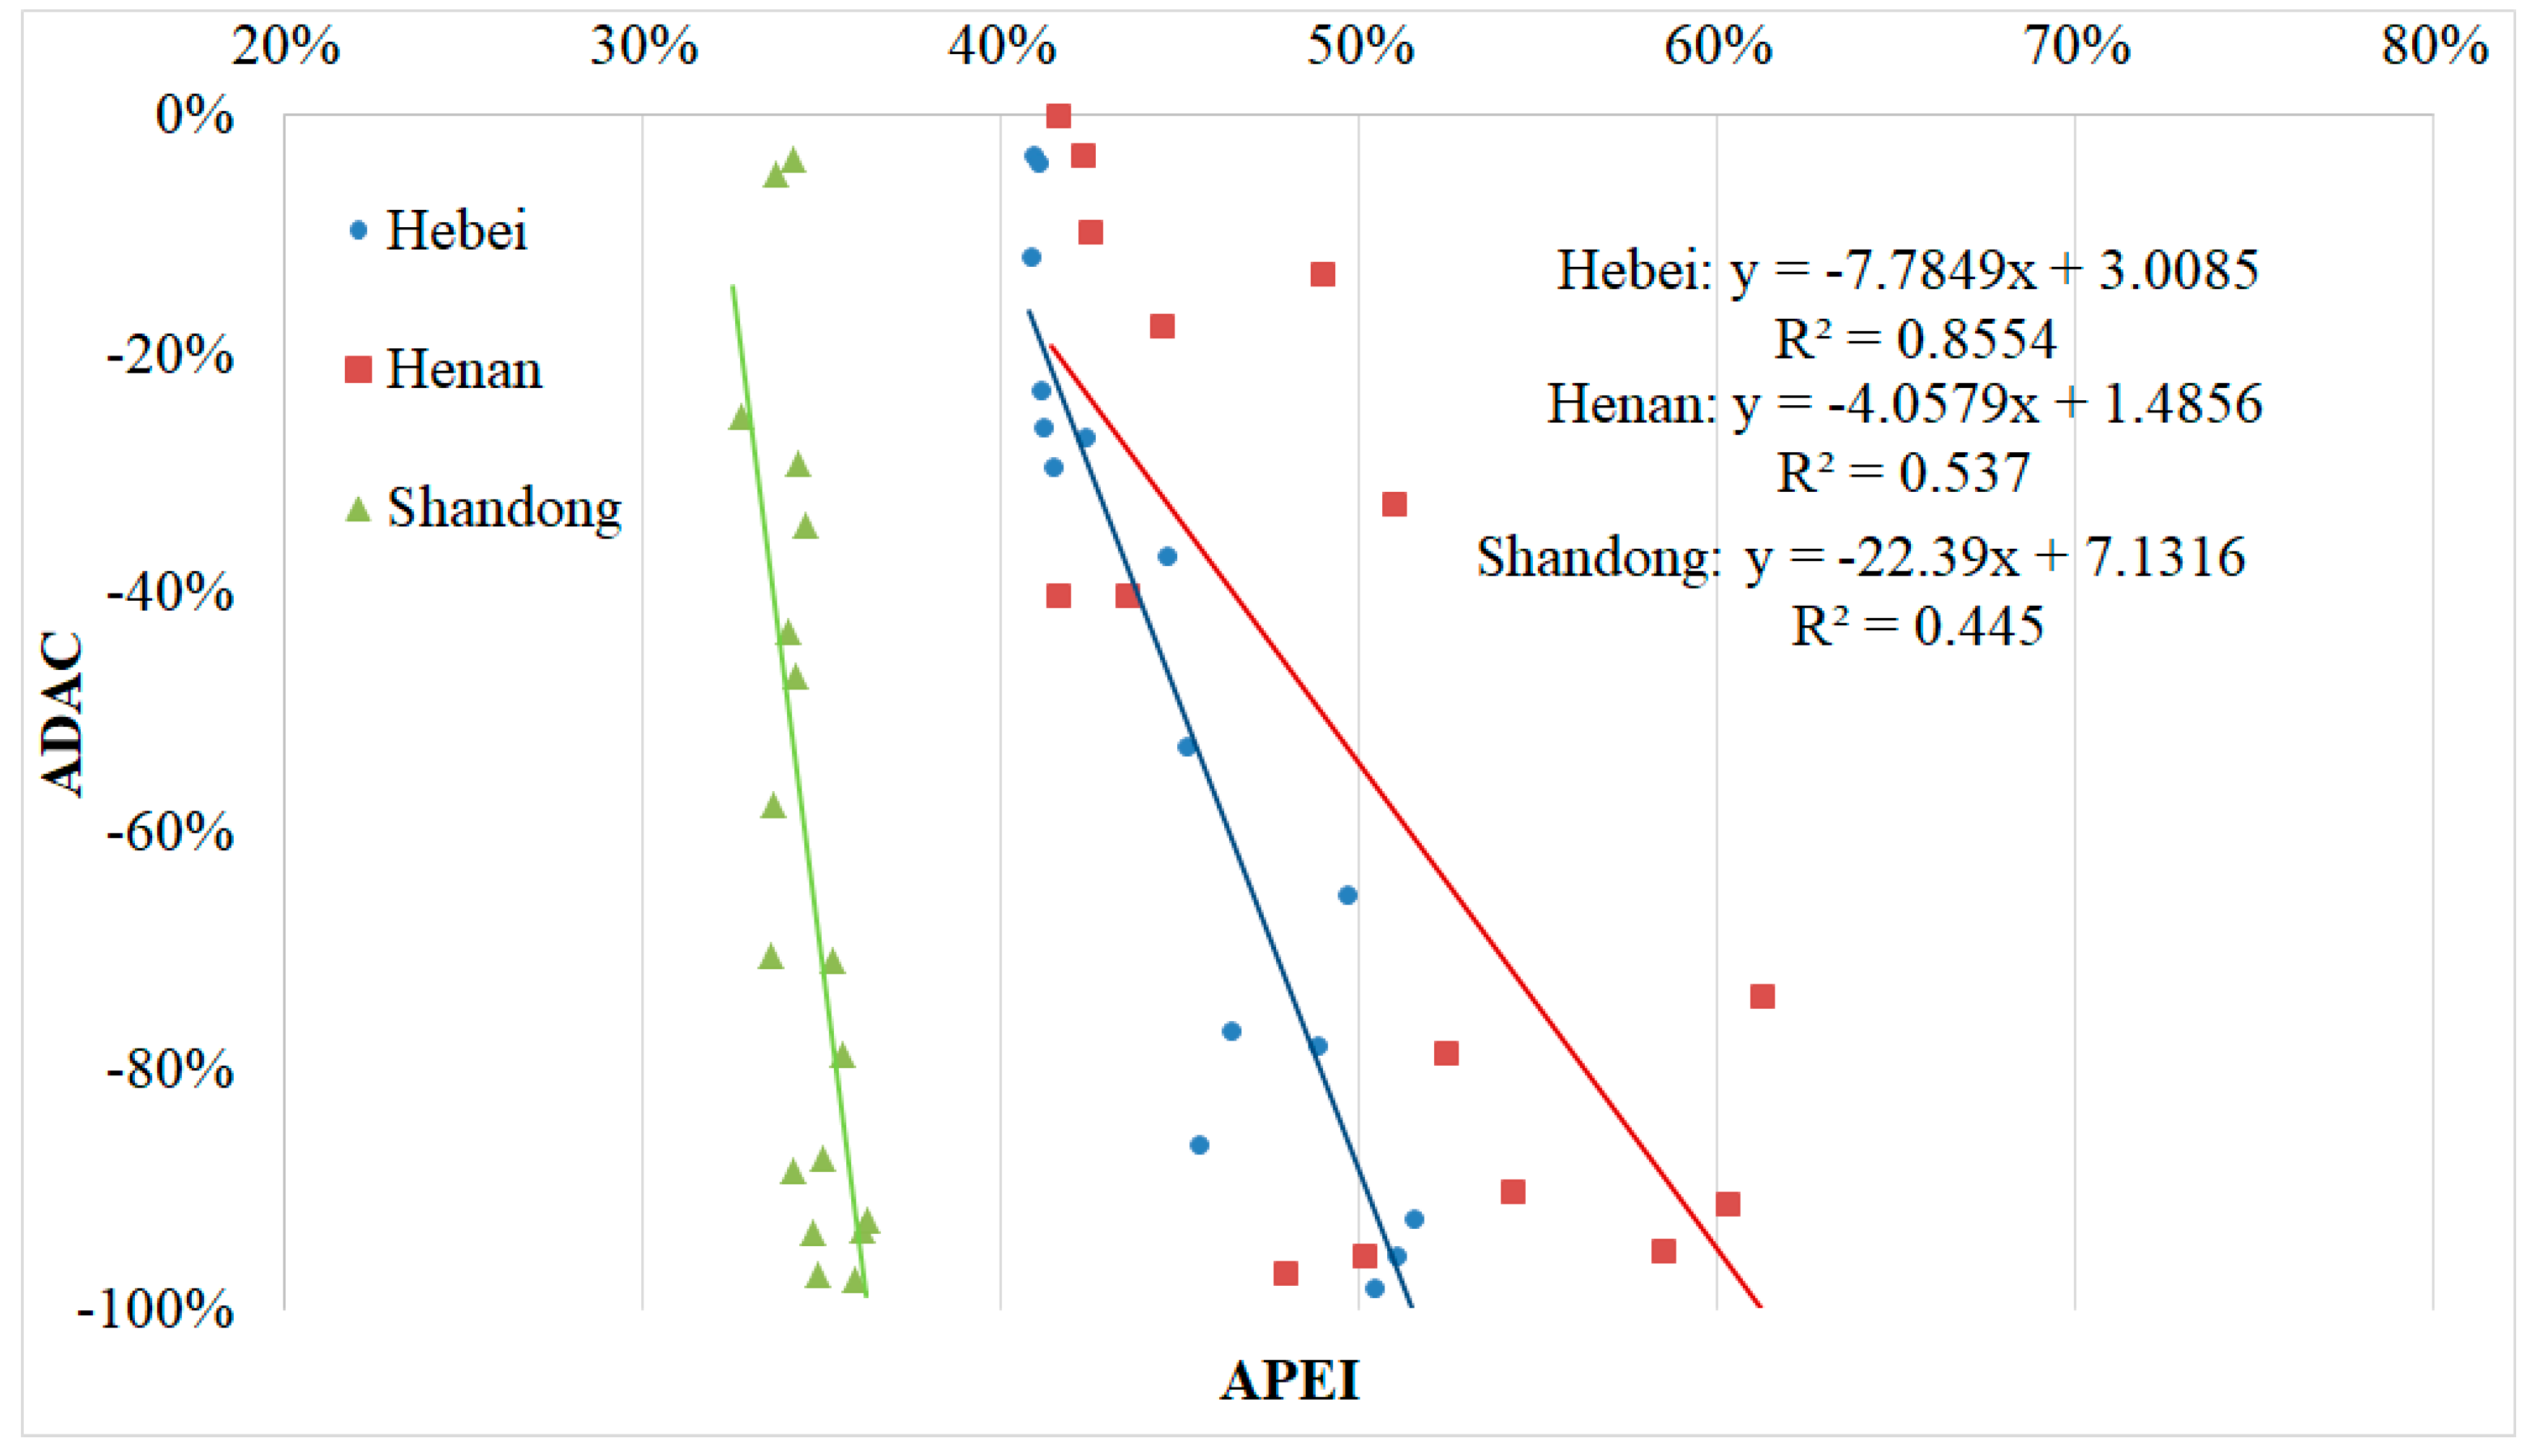
3.4. The Impact of APEI on Changes of ADAC

The Mann–Kendall method was applied to the 38-year ADAC data to identify the timing of abrupt changes, which is important to investigate the changes in the contribution rate of human activities. In HHSP, this was between 2000 and 2001. Thus, the entire 38-year period was divided into two periods according to the point of abrupt change: P1 (1981–2000) and P2 (2001–2018). Linear trend analysis showed that significant negative trends of annual ADAC for three provinces occurred during P1, with an annual decline rate of −4.34–−3.95% (Table 3). However, the ADAC showed a weak decrease in Shandong Province and increasing trends in Hebei and Henan Provinces during P2.
The trend analysis of Area Percentage Equipped for Irrigation (APEI) showed that the change in APEI for P1 and P2 both had significant increasing trends for the three provinces (Table 3). It indicated that the areas equipped for irrigation gradually increased due to continual government investments. The annual increase rates in P1 are higher than those in P2 for Hebei and Henan Provinces. The increased rate of APEI was the lowest for Shandong Province.
The relationships between ADAC and APEI need to be investigated individually for P1 and P2 due to the variation differences. Significant correlations between the ADAC and APEI in the three provinces occurred in P1. The Pearson correlation coefficients of ADAC and APEI during the period of 1981–2000 for Hebei, Henan and Shandong Provinces were 0.92, 0.73 and 0.67, respectively. The simple linear regression method was applied in this period. The results showed that the changes in APEI in Hebei, Henan and Shandong Provinces explained approximately 85.54%, 53.7% and 44.5% of the variation in the ADAC, respectively (see Figure 4).
However, there were lower correlations between the ADAC and APEI in 2001–2018, even though the area equipped for irrigation increased significantly in P2 in the three provinces. The winter crop planting area showed the downward trend due to the impacts of market and water resources during this period. The expansion of the equipped irrigation improved the capacity of irrigation security for other crops, such as maize, cotton, soybean and vegetables. Therefore, the change of equipped irrigation area does not have obvious positive effects on drought mitigation for the spring season during P2. The performance of drought mitigation might be affected by the irrigated frequency and irrigated water amount when the water resources are constrained. This was proved by the study of Yang et al. (2016), who concluded that the change of irrigation times played a significant and positive role in mitigating the adverse impacts of extreme drought events on wheat production according to the survey data from 1663 wheat plots during 2012–2013 in North China Plain [60].
PDSI had been widely applied to study the drought change under climate change [6,61]. Here, the average decade PDSI drought area percentages were analyzed. In Hebei Province, the average PDSI values for drought-affected areas during the 1980s, 1990s, 2000s and 2010s were −2.03, −2.48, −3.08 and −2.70, respectively. This result indicated that the drought magnitude under natural conditions had increased since 1980, and the drought severity grew rapidly during the 2000s. The average PDSI values for drought areas in Henan Province decreased from −1.64 in the 1980s to −2.43 in the 1990s, increased to −1.80 in the 2000s, and then dropped to −2.62 in the 2010s. The average PDSI values in Shandong Province were relatively stable for four decades, with ranges of −2.19 and −2.61. The drought severities in Henan and Shandong were highest in the last 10 years. Variations in drought magnitude might affect the performance of drought mitigation. Lu et al. (2012) analyzed the change in drought with PDSI on the North China Plain and found that the frequencies of mild, moderate and severe drought decreased in the 1990s and increased after 2000 [46]. The upward drought severities since 2000, particularly in extreme drought conditions, required more water resources. Zhang et al. (2015) found that more irrigation was applied in response to a one-unit reduction in PDSI, and resulted in a decrease in the areas supplied by surface irrigation infrastructure [38]. Thus, the effect of irrigation infrastructure was offset by decreasing irrigation water use due to a water deficit. This could be one important reason for the weak correlations between APEI and ADAC change during 2001–2018.

4. Discussion

The ADAC index based on remote sensing data was developed to quantify the mitigation effect based on the difference between the percentages of drought-affected area identified by the PDSI and VHI [45]. The drought-affected area by PDSI describes the soil moisture deficit caused by climate change, and it does not consider the impact of agricultural practices. The VHI describes the actual agricultural drought. The difference should reflect the changes in the contribution of anti-drought measures. The Pearson Correlation analysis between seven impact factors with ADAC showed lower correlations for rainfall (r = 0.263), temperature (r = −0.357), radiation (r = −0.345), agriculture water use (r = −0.259), reservoir capacity (r = −0.157), and number of pumps for agricultural water (r = −0.462) than Area Percentage Equipped for Irrigation (APEI). The results prove that ADAC is an index to reflect the impacts of human activities. Additionally, the multiple regression analysis results showed that only the linear function with APEI passed the confidence testing. Therefore, the effects of irrigation factor on drought mitigation over a long period were first investigated in the study area.
The ADAC analysis results show that significant increasing trends occurred in HHSP during the critical season of winter wheat over the past 38 years. Human activities, particularly irrigation, have an important role in coping with drought.
A significant increase in the change in ADAC values occurred in the period of 1981–2000 (P1). Such improvements coincided with a substantial establishment period of irrigation infrastructure [62]. APEI changes were investigated and found to explain 49.2–89.7% of the variations in the ADAC in the cropland. Due to the rapid exploration of groundwater for irrigation since the 1980s, farmers expanded the sown area of crops due to the high irrigation water guarantee. The irrigation development is a predominant and effective measure to combat drought events under the climate change without the limit of water resources.
However, this trend was not maintained in the subsequent period of 2001–2018 (P2). After the 2000s, the increasing drought severities, the decline of private tube wells, and the requirement of ecological security caused the decrease of available water resources for irrigation. Mo et al. (2017) concluded that the potential demand for wheat crop irrigation water will increase under climate change projections and that the ability to expand irrigation will be constrained by the availability of water resources [63]. The similar result was that irrigation greatly reduced the drought risk of corn yields from 1958 to 1976, but this advantage diminished due to the overexpansion of irrigation beyond what the water availability in the Ogallala Aquifer in the U.S. could support [64]. Zhang et al. (2015) also found drier climate leads to additional irrigation use but that it can be partially counteracted by greater-efficiency irrigation technology [38]. It was proved by the reduction of the winter wheat crop area and decreasing rate of the expansion of irrigation infrastructure during P2. It could be guessed that the increase AEI in P2 might play a role on the summer crops growth, but not for winter wheat. Therefore, the expansion of irrigation infrastructure must be consistent with the limit on available water resources [24,38,40]. On the other hand, farmers’ activities in response to drought vary. For farmers who are able to apply engineering measures, increasing the amount of irrigation water and the reliability of irrigation water are adopted. After 2000, engineering measures were constrained due to serious water resource shortages, particularly in severe drought years, and most farmers preferred to adopt non-engineering measures, such as changing crop production inputs, adjusting the seeding/harvesting date, increasing irrigation intensity, and changing crop varieties [10,48,64]. Measures such as seed variety application and adjustment of production inputs have been proven to contribute to drought mitigation [40]. Late seeding for winter wheat has been suggested and applied in Nebraska [65]. The positive effect of irrigation infrastructure can be discovered at a regional scale, but not for farmers’ behavior on combating drought.
In this context, the positive effects of irrigation infrastructure during the winter wheat growth period in the plain areas of the three provinces might reach a plateau due to serious water resources shortages. Due to a lack of data of non-engineering measures, such as increasing irrigation intensity, adjusting the seeding/harvesting date, and changing crop varieties, this paper only examines the relations between the AEI and drought mitigation index at the regional scale. Although the shares of other non-engineering measures on drought mitigation cannot be quantitatively evaluated, we estimate that these measures have played an important role in drought mitigation at a regional scale during the recent twenty years based on the above analysis. The effects of other anti-drought measures need to be further investigated.
Due to using the PDSI and VHI data with 4 km resolution, the methodology could be expanded to assess the impacts of irrigation infrastructure on drought mitigation in global agricultural areas. It can be also applied to assess the effects of farmers’ activities if the drought information can be accessed at a fine resolution.

5. Conclusions

In this study, a new remote sensing-based drought mitigation index, ADAC, which reflects the difference between the areas projected to be drought-affected based on climatic data and the actual areas experiencing vegetative stress, was used to assess the evolution of the effects of anti-drought measures at the regional scale. We analyzed the changes in ADAC values in the three provinces in northern China over the past 38 years. The impacts of area equipped for irrigation on changes in ADAC were investigated. Irrigation played an active and positive role in drought mitigation for winter wheat in the plains areas of three provinces during the 1980s and 1990s. However, the contribution of irrigation infrastructure to drought mitigation has been greatly reduced since 2000. The effects of non-engineering measures on the drought mitigation need to be further investigated in the future. These findings are helpful to provide decision support for irrigation project investment and drought adaptation management in northern China under climate change. The appropriate application of ADAC can be expanded to all irrigated agricultural areas to evaluate the contribution of historical irrigation development policies globally.

Author Contributions

Conceptualization, N.Y. and B.W.; methodology, N.Y.; formal analysis, N.Y.; resources, N.Y., W.Z., D.B., X.Z. and Z.M.; writing—original draft preparation, N.Y. and B.W.; writing—review and editing, N.Y. and W.Z. All authors have read and agreed to the published version of the manuscript.

Funding

This research was funded by the National Key Research and Development Program of China [Grant No. 2022YFE0113900; 2016YFA0600304], the Strategic Priority Research Program of the Chinese Academy of Sciences [Grant No. XDA19030202], and the Alliance of International Science Organizations [Grant No. ANSO-CR-KP-2020-07].

Data Availability Statement

PDSI and VHI data are openly available. Land cover data can be applied to the ecosystem remote sensing laboratory of the Aerospace Information Research Institute from the Chinese Academy of Science.

Acknowledgments

We are grateful to the University of Idaho for providing the PDSI and the Centre for Satellite Applications and Research of the National Environmental Satellite, Data, and Information Service for providing the VHI dataset. We appreciate the comments and suggestions by anonymous reviewers.

Conflicts of Interest

The authors declare no conflict of interest.

References

  1. Seneviratne, S.I.; Ciais, P. Environmental science: Trends in ecosystem recovery from drought. Nature 2017, 548, 164–165. [Google Scholar] [CrossRef] [PubMed] [Green Version]
  2. Su, B.; Huang, J.; Fischerc, T.; Wang, Y.; Kundzewicz, Z.; Zhai, J.; Sun, H.; Wang, A.; Zeng, X.; Wang, G.; et al. Drought losses in China might double between the 1.5° C and 2.0° C warming. Proc. Natl. Acad. Sci. USA 2018, 115, 10600–10605. [Google Scholar] [CrossRef] [PubMed] [Green Version]
  3. Patrick, E. Drought characteristics and management in Central Asia and Turkey. In FAO Water Reports (FAO); Food and Agriculture Organization of the United Nations: Rome, Italy, 2017; p. 114. [Google Scholar]
  4. Li, R.; Geng, S. Impacts of climate change on agriculture and adpative strategies in China. J. Integr. Agric. 2013, 12, 1402–1408. [Google Scholar] [CrossRef]
  5. Cook, B.I.; Ault, T.R.; Smerdon, J.E. Unprecedented 21st century drought risk in the American Southwest and Central Plains. Sci. Adv. 2015, 1, 1–7. [Google Scholar] [CrossRef] [Green Version]
  6. Dai, A. Increasing drought under global warming in observations and models. Nat. Clim. Change 2013, 3, 52–58. [Google Scholar] [CrossRef]
  7. Spinoni, J.; Vogt, J.; Naumann, G.; Barbosa, P.; Dosio, A. Will drought events become more frequent and severe in Europe? Int. J. Climatol. 2018, 38, 1718–1736. [Google Scholar] [CrossRef] [Green Version]
  8. Wei, Y.; Langford, J.; Willett, I.R.; Barlow, S.; Lyle, C. Is irrigated agriculture in the Murray Darling Basin well prepared to deal with reductions in water availability? Glob. Environ. Change-Hum. Policy Dimens. 2011, 21, 906–916. [Google Scholar] [CrossRef]
  9. Cancelliere, A.; Ancarani, A.; Rossi, G. Susceptibility of Water Supply Reservoirs to Drought Conditions. J. Hydrol. Eng. 1998, 3, 140–148. [Google Scholar] [CrossRef]
  10. Li, X.; Yang, Y.; Poon, J.P.H.; Liu, Y.; Liu, H. Anti-drought measures and their effectiveness: A study of farmers’ actions and government support in China. Ecol. Indic. 2018, 87, 285–295. [Google Scholar] [CrossRef]
  11. Zhang, T.; Lin, X.; Sassenrath, G.F. Current irrigation practices in the central United States reduce drought and extreme heat impacts for maize and soybean, but not for wheat. Sci. Total Environ. 2015, 508, 331–342. [Google Scholar] [CrossRef]
  12. Masoero, F.; Gallo, A.; Giuberti, G.; Fiorentini, L.; Moschini, M. Effect of water-saving irrigation regime on whole-plant yield and nutritive value of maize hybrids. J. Sci. Food Agric. 2013, 93, 3040–3045. [Google Scholar] [CrossRef] [PubMed]
  13. Carter, M.R.; Little, P.D.; Mogues, T.; Negatu, W. Poverty Traps and Natural Disasters in Ethiopia and Honduras. World Dev. 2007, 35, 835–856. [Google Scholar] [CrossRef]
  14. Wang, Y.; Yang, J.; Chang, J.; Zhang, R. Assessing the drought mitigation ability of the reservoir in the downstream of the Yellow River. Sci. Total Environ. 2019, 646, 1327–1335. [Google Scholar] [CrossRef] [PubMed]
  15. Chang, J.; Clay, D.E.; Hansen, A.; Clay, S.A.; Schumacher, T.E. Water stress impact on transgenic drought-tolerant corn in the northern Great Plains. Agron. Soils Environ. Qual. 2013, 106, 125–130. [Google Scholar] [CrossRef] [Green Version]
  16. Grassini, P.; Yang, H.; Irmak, S.; Thorburn, J.; Burr, C.; Cassman, K.G. High-yield irrigated maize in the western U.S. Corn Belt: II. Irrigation management and crop water productivity. Field Crops Res. 2011, 120, 133–141. [Google Scholar] [CrossRef] [Green Version]
  17. Fereres, E.; Soriano, M.A. Deficit irrigation for reducing agricultural water use. J. Exp. Bot. 2006, 58, 147–159. [Google Scholar] [CrossRef] [Green Version]
  18. Geerts, S.; Raes, D. Deficit irrigation as an on-farm strategy to maximize crop water productivity in dry areas. Agric. Water Manag. 2009, 96, 1275–1284. [Google Scholar] [CrossRef] [Green Version]
  19. Bandyopadhyay, N.; Bhuiyan, C.; Saha, A.K. Drought mitigation: Critical analysis and proposal for a new drought policy with special reference to Gujarat (India). Prog. Disaster Sci. 2020, 5, 100049. [Google Scholar] [CrossRef]
  20. Chatterjee, S.; Bandyopadhyay, K.K.; Pradhan, S.; Singh, R.; Datta, S.P. Effects of irrigation, crop residue mulch and nitrogen management in maize (Zea mays L.) on soil carbon pools in a sandy loam soil of Indo-gangetic plain region. CATENA 2018, 165, 207–216. [Google Scholar] [CrossRef]
  21. Derpsch, R.; Franzluebbers, A.J.; Duiker, S.W.; Reicosky, D.C.; Koeller, K.; Friedrich, T.; Sturny, W.G.; Sá, J.C.M.; Weiss, K. Why do we need to standardize no-tillage research? Soil Tillage Res. 2014, 137, 16–22. [Google Scholar] [CrossRef]
  22. Mcdonald, R.I.; Girvetz, E.H. Two Challenges for U.S. Irrigation Due to Climate Change: Increasing Irrigated Area in Wet States and Increasing Irrigation Rates in Dry States. PLoS ONE 2013, 8, e65589. [Google Scholar] [CrossRef] [PubMed]
  23. Uwizeyimana, D.; Mureithi, S.M.; Karuku, G.; Kironchi, G. Effect of water conservation measures on soil moisture and maize yield under drought prone agro-ecological zones in Rwanda. Int. Soil Water Conserv. Res. 2018, 6, 214–221. [Google Scholar] [CrossRef]
  24. Hornbeck, R.; Keskin, P. The Historically Evolving Impact of the Ogallala Aquifer: Agricultural Adaptation to Groundwater and Drought. Am. Econ. J. Appl. Econ. 2014, 6, 190–219. [Google Scholar] [CrossRef] [Green Version]
  25. Troy, T.J.; Kipgen, C.; Pal, I. The impact of climate extremes and irrigation on US crop yields. Environ. Res. Lett. 2015, 10, 054013. [Google Scholar] [CrossRef] [Green Version]
  26. Araujo, J.A.; Abiodun, B.J.; Crespo, O. Impacts of drought on grape yields in Western Cape, South Africa. Theor. Appl. Climatol. 2016, 123, 117–130. [Google Scholar] [CrossRef]
  27. Li, X.; Kang, S.; Zhang, X.; Li, F.; Lu, H. Deficit irrigation provokes more pronounced responses of maize photosynthesis and water productivity to elevated CO2. Agric. Water Manag. 2018, 195, 71–83. [Google Scholar] [CrossRef]
  28. Zhang, T.; Simelton, E.; Huang, Y.; Shi, Y. A Bayesian assessment of the current irrigation water supplies capacity under projected droughts for the 2030s in China. Agric. For. Meteorol. 2013, 178, 56–65. [Google Scholar] [CrossRef]
  29. Zipper, S.C.; Qiu, J.; Kucharik, C.J. Drought effects on US maize and soybean production: Spatiotemporal patterns and historical changes. Environ. Res. Lett. 2016, 11, 094021. [Google Scholar] [CrossRef]
  30. Schauberger, B.; Archontoulis, S.; Arneth, A.; Balkovic, J.; Ciais, P.; Deryng, D.; Elliott, J.; Folberth, C.; Khabarov, N.; Müller, C.; et al. Consistent negative response of US crops to high temperatures in observations and crop models. Nat. Commun. 2017, 8, 13931. [Google Scholar] [CrossRef] [Green Version]
  31. Brocca, L.; Tarpanelli, A.; Filippucci, P.; Dorigo, W.; Zaussinger, F.; Gruber, A.; Fernández-Prieto, D. How much water is used for irrigation? A new approach exploiting coarse resolution satellite soil moisture products. Int. J. Appl. Earth Obs. Geoinf. 2018, 73, 752–766. [Google Scholar] [CrossRef]
  32. Essaid, H.I.; Caldwell, R.R. Evaluating the impact of irrigation on surface water-groundwater interaction and stream temperature in an agricultural watershed. Sci. Total Environ. 2017, 599, 581–596. [Google Scholar] [CrossRef] [PubMed]
  33. Haddeland, I.; Lettenmaier, D.P.; Skaugen, T. Effects of irrigation on the water and energy balances of the Colorado and Mekong river basins. J. Hydrol. 2006, 324, 210–223. [Google Scholar] [CrossRef]
  34. Zhang, Y.Q.; Kendy, E.; Yu, Q.; Liu, C.M.; Shen, Y.J.; Sun, H.Y. Effect of soil water deficit on evapotranspiration, crop yield, and water use efficiency in the North China Plain. Agric. Water Manag. 2004, 64, 107–122. [Google Scholar]
  35. Fang, Q.; Ma, L.; Green, T.R.; Yu, Q.; Wang, T.; Ahuja, L.R. Water resources and water use efficiency in the North China Plain: Current status and agronomic management options. Agric. Water Manag. 2010, 97, 1102–1116. [Google Scholar] [CrossRef]
  36. Solh, M.; van Ginkel, M. Drought preparedness and drought mitigation in the developing world’ s drylands. Weather. Clim. Extrem. 2014, 3, 62–66. [Google Scholar] [CrossRef] [Green Version]
  37. Yan, N.; Wu, B.; Perry, C. Assessing potential water savings in agriculture on the Hai Basin plain, China. Agric. Water Manag. 2015, 154, 11–19. [Google Scholar] [CrossRef]
  38. Zhang, T.; Lin, X.; Rogers, D.H.; Lamm, F.R. Adaption of irrigation infrastructure on irrigation demands under future drought in the United States. Earth Interact. 2015, 19, 1–16. [Google Scholar] [CrossRef]
  39. Osteen, C.; Gottlieb, J.; Vasavada, U. Agricultural resources and environmental indicators. In Economic Information Bulletin; U.S. Department of Agriculture, Economic Research Service: Washington, DC, USA, 2012; Volume 98, p. 55. [Google Scholar]
  40. Burrell, A.L.; Evans, J.P.; Liu, Y.Y. Detecting dryland degradation using Time Series Segmentation and Residual Trend analysis (TSS-RESTREND). Remote Sens. Environ. 2017, 197, 43–57. [Google Scholar] [CrossRef]
  41. Abdulrazzaq, Z.T.; Hadi, R.; Aziz, N.A. Integrated TRMM Data and Standardized Precipitation Index to Monitor the Meteorological Drought. Civ. Eng. J. 2019, 5, 1590–1598. [Google Scholar] [CrossRef] [Green Version]
  42. Dai, A. Characteristics and trends in various forms of the Palmer Drought Severity Index during 1900–2008. J. Geophys. Res. 2011, 116, D12115. [Google Scholar] [CrossRef] [Green Version]
  43. Kogan, F.; Salazar, L.; Roytman, L. Forecasting crop production using satellite-based vegetation health indices in Kansas, USA. Int. J. Remote Sens. 2012, 33, 2798–2814. [Google Scholar] [CrossRef]
  44. Yan, N.; Wu, B.; Boken, V.K.; Chang, S.; Yang, L. A drought monitoring operational system for China using satellite data: Design and evaluation. Geomat. Nat. Hazards Risk 2016, 7, 264–277. [Google Scholar] [CrossRef]
  45. Wu, B.; Ma, Z.; Yan, N. Agricultural drought mitigating indices derived from the changes in drought characteristics. Remote Sens. Environ. 2020, 244, 111813. [Google Scholar] [CrossRef]
  46. Lu, H.; Mo, X.; Hu, S. Spatialtemporal variation characteristics of meterological droughts in North China Plain during 1960-2009. J. Nat. Disasters 2012, 21, 72–82. [Google Scholar] [CrossRef]
  47. Chen, F.; Liu, J.; Li, M. Researches on spatial and temporal succession law of agricultural drought in the past 60 years in China. J. Southwest China Norm. Univ. 2011, 36, 111–114. [Google Scholar]
  48. Wang, J.; Yang, Y.; Huang, J.; Chen, K.Z. Information provision, policy support, and farmers’ adaptive responses against drought: An empirical study in the North China Plain. Ecol. Model. 2015, 318, 275–282. [Google Scholar] [CrossRef]
  49. Zhu, X.C.; Wang, B.L.; Zhao, G.; Wang, S.H.; Liu, J.H. The strategic study of water saving and high efficiency water use in the Hai Basin. In Research Report; GEF Integrated Management of Water Resources and Water Environment: Beijing, China, 2008; pp. 42–44. [Google Scholar]
  50. Palmer, W.C. Meteorological Drought, Research Paper; US Department of Commerce Weather Bureau: Washington, DC, USA, 1965; p. 45.
  51. Abatzoglou, J.T.; Dobrowski, S.Z.; Parks, S.A.; Hegewisch, K.C. TerraClimate, a high-resolution global dataset of monthly climate and climatic water balance from 1958–2015. Sci. Data 2018, 5, 170191. [Google Scholar] [CrossRef] [Green Version]
  52. Kogan, F. World droughts in the new millennium from AVHRR-based vegetation health indices. Eos Trans. Am. Geophys. Union 2002, 83, 557–563. [Google Scholar] [CrossRef]
  53. Chang, S.; Wu, B.; Yan, N.; Davdai, B.; Nasanbat, E. Suitability Assessment of Satellite-Derived Drought Indices for Mongolian Grassland. Remote Sens. 2017, 9, 650. [Google Scholar] [CrossRef] [Green Version]
  54. Wu, B. China’s Land Cover; Science Press: Beijing, China, 2017. [Google Scholar]
  55. Zhang, L.; Li, X.; Yuan, Q.; Liu, Y. An object-based approach to national land cover mapping using HJ satellite imagery. J. Appl. Remote Sens. 2014, 8, 1–19. [Google Scholar] [CrossRef]
  56. Kendall, M.G. Rank Correlation Methods; Charles Griffin: London, UK, 1975. [Google Scholar]
  57. Yu, H.; Zhang, Q.; Sun, P.; Song, C. Impacts of drought intensity and drought duration on winter wheat yield in five provinces of North China Plain. Acta Geogr. Sin. 2019, 74, 87–102. [Google Scholar]
  58. Zhang, Q.; Yu, H.; Sun, P.; Singh, V.P.; Shi, P. Multisource data based agricultural drought monitoring and agricultural loss in China. Glob. Planet. Change 2019, 172, 298–306. [Google Scholar] [CrossRef]
  59. Wang, J.; Huang, J.; Huang, Q.; Rozelle, S. Privatization of tubewells in north china: Determinants and impacts on irrigated area, productivity and the water table. Hydrogeol. J. 2006, 14, 275–285. [Google Scholar] [CrossRef]
  60. Yang, Y.; Wang, J.; Huang, J. The adaptive irrigation behavior of farmers and impacts on yield during extreme drought events in the North China Plain. Resour. Sci. 2016, 38, 900–908. [Google Scholar] [CrossRef]
  61. Trenberth, K.; Dai, A.; Schrier, G.; Jones, P.; Barichivich, J.; Briffa, K.; Sheffield, J. Global warming and changes in drought. Nat. Clim. Change 2013, 4, 17–22. [Google Scholar] [CrossRef]
  62. Piao, S.; Ciais, P.; Huang, Y.; Shen, Z.; Peng, S.; Li, J.; Zhou, L.P.; Liu, H.Y.; Ma, Y.C.; Ding, Y.H.; et al. The impacts of climate change on water resources and agriculture in China. Nature 2010, 467, 43–51. [Google Scholar] [CrossRef]
  63. Mo, X.; Hu, S.; Lin, Z.; Liu, S.; Xia, J. Impacts of climate change on agricultural water resources and adaptation on the North China Plain. Adv. Clim. Change Res. 2017, 8, 93–98. [Google Scholar] [CrossRef]
  64. Chen, H.; Wang, J.; Huang, J. Policy support, social capital, and farmers’ adaptation to drought in China. Glob. Environ. Change 2014, 24, 193–202. [Google Scholar] [CrossRef]
  65. Klein, R.N.; Lyon, D.J.; Kruge, G.R. Seeding Rates for Winter Wheat in Nebraska. G2056, Nebraska Extension Publications, USA. 2011. Available online: https://extensionpublications.unl.edu/assets/html/g2056/build/g2056.htm (accessed on 25 May 2021).
Figure 1. Location of the study area and Digital Elevation Model.
Remotesensing 14 05197 g001
Figure 2. The decadal agricultural drought-affected area changes (ADAC) and drought-affected area identified by the PDSI and VHI during the period of March–May in 1981–2018 over the study area.
Remotesensing 14 05197 g002
Figure 3. The decadal agricultural drought affected area changes (ADAC) during the period of March-May in the period of 1981–2018 for Hebei, Henan and Shandong Provinces.
Remotesensing 14 05197 g003
Figure 4. Scatter plots of the relationship between the agricultural drought-affected area changes (ADAC) of crop land and Area Percentage Equipped for Irrigation (APEI) during the period of 1981–2000 for Hebei, Henan and Shandong Provinces.
Remotesensing 14 05197 g004
Table 1. Decade drought area percentages from PDSI and VHI, and agricultural drought-affected area changes (ADAC) during 1981–2018 for Hebei, Henan and Shandong Provinces.
ProvincePDSIVHIADAC
HebeiHenanShandongHebeiHenanShandongHebeiHenanShandong
1980s (1981–1990)55.2%45.4%63.5%40.0%30.4%35.7%−26.1%−27.5%−40.3%
1990s (1991–2000)44.1%34.6%52.6%29.4%19.7%25.3%−73.4%−70.0%−82.0%
2000s (2001–2010)51.4%45.4%61.9%33.4%28.8%31.3%−59.2%−86.0%−66.7%
2010s (2011–2018)53.5%52.5%65.0%32.2%28.1%27.3%−46.9%−81.8%−61.1%
1981–201851.0%44.5%60.8%33.8%26.7%29.9%−52.5%−68.8%−63.2%
Table 2. Decade agricultural drought-affected area changes (ADAC) of three topographic classes during 1981–2018 for Hebei, Henan and Shandong Provinces.
DEMProvinceADAC
HebeiHenanShandong
<2001980s (1981–1990)−25.5%−27.0%−46.8%
1990s (1991–2000)−74.9%−74.1%−82.0%
2000s (2001–2010)−59.2%−87.4%−67.0%
2010s (2011–2018)−49.7%−84.1%−62.2%
1981–2018−53.4%−69.6%−65.9%
200–5001980s (1981–1990)−35.0%−43.4%−50.7%
1990s (1991–2000)−63.0%−59.5%−71.9%
2000s (2001–2010)−58.5%−73.3%−62.6%
2010s (2011–2018)−27.9%−45.9%−49.9%
1981–2018−47.7%−57.7%−59.4%
>5001980s (1981–1990)−46.1%−43.1%-
1990s (1991–2000)−45.4%−67.6%-
2000s (2001–2010)−58.4%−57.2%-
2010s (2011–2018)−44.5%−37.3%-
1981–2018−49.1%−53.0%-
Table 3. Trend change rates of agricultural drought-affected area changes (ADAC) and Area Percentage Equipped for Irrigation (APEI) during different periods in Hebei, Henan and Shandong Provinces.
PeriodADACAPEI
HebeiHenanShandongHebeiHenanShandong
1981–2018−0.83%−1.86% *−0.71%0.34% *0.68% *0.11% *
1981–2000 (P1)−4.34% *−3.95% *−4.34% *0.46% *0.90% *0.10% *
2001–2018 (P2)0.65%0.08%−0.18%0.26% *0.33% *0.15% *
* denotes the significance at the 95% confidence level.
Publisher’s Note: MDPI stays neutral with regard to jurisdictional claims in published maps and institutional affiliations.

