Article

Impact of Quasi-Biweekly Oscillation on Southeast Asian Cold Surge Rainfall Monitored by TRMM Satellite Observation

1
Department of Atmospheric Sciences, Yunnan University, Kunming 650500, China
2
Center for Monsoon System Research, Institute of Atmospheric Physics, Chinese Academy of Sciences, Beijing 100029, China
*
Author to whom correspondence should be addressed.
Remote Sens. 2022, 14(20), 5200; https://doi.org/10.3390/rs14205200
Submission received: 29 August 2022 / Revised: 13 October 2022 / Accepted: 14 October 2022 / Published: 17 October 2022

Abstract

:
Based on the Tropical Rainfall Measuring Mission (TRMM) satellite observation and ERA5 re-analysis dataset, this paper studies the influence of the northwestward-propagating quasi-biweekly oscillation (QBWO) over the western North Pacific on cold surge rainfall (CSR) over Southeast Asia. Cold surges are the most important driver affecting Southeast Asian rainfall on a synoptic scale. The presence of the QBWO during phases 6–8, in which the associated active convection coupling with a cyclonic circulation reaches Southeast Asia, provides a favorable environment for the increase of CSR. The increase in CSR primarily occurs east of the Philippines, leading to a high likelihood of triggering extreme rainfall. The effects from the QBWO are independent of those from the active MJO phases over Southeast Asia. Additionally, cold surge activity could also be influenced by the QBWO. An examination of the QBWO and MJO indicates that the most preferred phases for the occurrence of cold surges are the time when phase 1 of the QBWO co-exists with phase 7 of the MJO or the time when phase 7 of the QBWO couples with phase 5 of the MJO. Accordingly, about 40% of the total cold surge days would fall in either combination.

1. Introduction

Asian winter monsoons with prevailing surface northeast flows affect the climate variations over Southeast Asia [1,2,3,4]. As an important synoptic-scale system of the Asian winter monsoon season, northeasterly cold surges are widely observed and dominate the hydrological cycle over Southeast Asia [5,6,7]. Northeasterly cold surges, which correspond with the cold air outbreak over the South China Sea, are often related to the southward intrusions of the surface Siberia–Mongolia High [8,9,10]. Cold surges are consistent with the intensified northerly winds of the season, the decreased surface temperature, and the increased pressure and moisture over the South China Sea [9]. They occur several times during a winter and can last from just a few days to several weeks [5]. After the onset of a cold surge, a northeast flow can rapidly progress towards the equator from the mid-latitudes, resulting in a strong moisture convergence and enhanced convection in Southeast Asia. As a result, extreme flooding could occur in the east of the Philippines, the eastern coast of the Malay Peninsula, the north of Sumatra, and the northeast and northwest of Borneo through the effects of wind–terrain interactions [11,12,13,14] and the strengthening of the Borneo vortex [15,16,17,18].
Cold surge rainfall (CSR) over Southeast Asia can be measured effectively through satellite observation. The launch of the Tropical Rainfall Measuring Mission (TRMM) satellite in November 1997 has provided an opportunity to monitor the variation and spatial distribution of CSR [19,20]. The TRMM satellite is devoted to observing rainfall in the tropics and subtropics of the Earth by using a passive microwave imager (TMI), precipitation radar (PR), and visible and infrared sensors (VIRS). It can observe the Earth’s surface between 40°S and 40°N, only taking 96 min to circle the globe. Thus, the TRMM satellite has an instantaneous precipitation measurement with high spatial and temporal resolution [21,22], and it is applicable to our study. Using the TRMM satellite-derived precipitation estimates over the tropical oceans, Fauzi and Hidayat [7] and Hattori et al. [9] found that the eastward-propagating Madden–Julian oscillation (MJO) [23,24] can drive substantial increases or decreases of CSR over the western Maritime Continent depending on the specific MJO phases. In addition, a reduction in the frequency of cold surges over the South China Sea was also observed during one-half of the MJO cycle. The anomalous southerly and southwesterly winds linked to the MJO, which are produced by the Rossby wave response [25] of an anticyclonic circulation to the MJO suppressed convection over the eastern Maritime Continent [26], partially counter the northeasterly surge winds over the South China Sea [27]. Hence, the variations in CSR over Southeast Asia could be influenced by the intraseasonal oscillation (ISO).
The ISO has two primary peaks, one at the 30–60-day or 40–50-day timescale (i.e., the MJO) and the other at the 10–20-day timescale [28,29,30]. The latter usually refers to the quasi-biweekly oscillation (QBWO). While the large impacts of the MJO on the CSR over Southeast Asia have been well recognized, the counterpart analyses of the QBWO have not been discussed in the previous literature. Recently, Dong and Wang [31] identified a significant QBWO over the western North Pacific (WNP) during the boreal winter, whose variability is larger than the MJO in situ. The QBWO propagates northwestward from the tropical central-western Pacific to the WNP [31]. Its convective phases may also affect the CSR over Southeast Asia and the surge winds over the South China Sea via the associated convection and circulation anomalies. The possible impacts of the QBWO on the CSR over Southeast Asia and its potential synergy effects with the MJO will be addressed in this study using the TRMM satellite observations. Section 2 describes the data and methodology. First, Section 3 investigates the impacts of cold surges and the QBWO over the WNP on Southeast Asian rainfall during the boreal winter; then, the effects of the QBWO on CSR and cold surges as well as a comparison with the MJO are examined. Finally, Section 4 and Section 5 discuss and summarize the main findings, respectively.

2. Data and Methods

The TRMM 3B42 satellite’s daily observational data with a horizontal resolution of 0.25° × 0.25°, which covers the period from 1998 to 2019 [32], was used in this study. The 3B42 algorithm produces the TRMM-adjusted merged-infrared precipitation and root-mean-square precipitation-error estimates. Daily wind fields are extracted from the six-hour data collection of the fifth generation European Center for Medium-Range Weather Forecasts (ECMWF) re-analysis for the global climate (ERA5) [33] with a 1.0° × 1.0° horizontal resolution from 1979 to the present. Here, we focus on the extended boreal winter that covers the months from November to March (NDJFM). As a result, 21 winters from 1998 to 2018 were considered, and the 1998 winter denotes the period from November 1998 to March 1999. The NDJFM was chosen because both the frequency of cold surges [12] and the rainfall for most countries over Southeast Asia [27] reached a maximum at this time.
Following Chang et al. [5], the cold surges were defined in days when the 925 hPa northerly winds over the South China Sea averaged between 110°E and 117.5°E along 15°N and exceeded a threshold of 8 ms−1. Based on the criterion, 721 cold surge days were identified, accounting for roughly 22.7% within a total of 3171 winter days during NDJFM. The phase and amplitude of the MJO were identified using the real-time multivariate MJO indices (RMMs). The RMMs were constructed by the EOF analysis of the near-equatorially averaged (15°S–15°N) OLR and zonal wind anomalies at 850 hPa and 200 hPa with a 20–100-day filter window [34]. We focused on phases 2, 3 and 4 of the MJO with the normalized RMMs being larger than 1. These MJO phases correspond to the enhanced convection over Southeast Asia [27]. Similar to the MJO, the phase and magnitude of the QBWO over the WNP were also detected using the first two EOF modes of the 10–20-day filtered TRMM rainfall anomalies over the WNP (0°–30°N, 120°–180°E) during the extended winter [31]. An active QBWO day was identified when its normalized magnitudes (PC12 + PC22) were larger than 1. In the study, the daily anomaly of a variable was defined as the deviation of its daily value from the long-term mean daily cycle from 1998–2018. The study area in Southeast Asia was focused on the region between 10°S–20°N and 90°–140°E (Figure 1a). Composite analyses were used, and their significance levels were estimated with the two-tailed Student’s t-test by considering the effective degrees of freedom (Ndof). The Ndof is computed following Bretherton et al.’s formula [35]:
N d o f = N × 1 r 1 r 2 / 1 + r 1 r 2
where N represents the total sample number during a composite event, and r1 and r2 indicate the lag-one autocorrelation coefficients of the targeted climate anomalies. Unless otherwise specified, only results exceeding the 95% confidence levels are shown.

3. Results

3.1. Impacts of Cold Surges and the QBWO on Southeast Asian Rainfall

The activeness of cold surges is closely associated with the East Asian winter monsoon [6,7]. In climatology, cold surges can first be observed to affect Southeast Asia around late October or early November [36]. About 19.14% of cold surge days occur during November. The occurrence frequency of cold surges peaks during December at a proportion of approximately 36.06% (Figure 1b); it then weakens in March at roughly 5.83% due to the retreat of the East Asian winter monsoon [1].
In order to reflect the importance of cold surges on Southeast Asian rainfall during NDJFM, the rainfall anomalies were composited with the exclusive and inclusive cold surge days and are shown in Figure 2a,b, respectively. Without cold surges, only a weak decrease in rainfall occurs in north of Borneo (NBO) and northeast of the Philippines, which is accompanied by the anomalous southerly winds over the South China Sea (Figure 2a). In contrast, the presence of cold surges causes the strengthened northeasterly winds that originate from the South China Sea to penetrate into the south of Sumatra and then cross the equator by shifting counterclockwise (Figure 2b). The northeasterly winds, on the one hand, are parallel to the west coastline of Borneo and are associated with an enhanced shear vorticity, resulting in the strengthening of the Borneo vortex (Figure 2b). On the other hand, they are perpendicular to the mountain terrains of the northern Philippines and Malay Peninsula. Under the circulation configuration, notable increases in rainfall occur east of the Philippines (EPH), north and west of Borneo, east of southeastern Sumatra, near the southeastern Malay Peninsula, and over the Java Sea (Figure 2b). The rainfall anomalies over Southeast Asia that are associated with cold surges have two centers, one over the EPH (10°–20°N, 120°–135°E) and the other over the NBO (5°–12.5°N, 110°–120°E). These results indicate that cold surges are the primary driver for winter rainfall over Southeast Asia on a synoptic scale, and they can explain greater than 50% and 40% of the total NDJFM precipitation over the NBO and the Philippines Sea (Figure 2c), respectively.
To evaluate the influence of the QBWO over the WNP on CSR over Southeast Asia, the QBWO’s properties should be first recognized. Figure 3 shows the regional details of the combined measurements of the 925 hPa winds and TRMM rainfall over Southeast Asia during eight QBWO phases, in which the normalized magnitudes of the QBWO are larger than 1. During phase 1, a weak anticyclonic circulation occurs over the equatorial western Pacific, which is accompanied by a negative rainfall anomaly. From phases 2 to 3, the anticyclonic anomaly propagates northwestward and arrives at the South China Sea and Philippines Sea. The coupled negative rainfall anomaly also moves to the EPH in the same direction. Consequently, expansive southwesterly winds occupy the South China Sea and persist through phase 4. The southwesterly winds recede and are gradually replaced by the northeasterly winds from phases 5 to 8 due to the northwestward propagation of a cyclonic circulation and a positive rainfall anomaly. The most distinctive manifestation of the QBWO’s influence on Southeast Asian rainfall is represented in phases 6–8, in which the enhanced large-scale cyclonic circulation and the local-scale rainfall are observed over the parts of Southeast Asia surrounded by the South China Sea and Philippines Sea. Hence, in the following analyses, phases 6–8 of the QBWO were selected as active quasi-biweekly days over Southeast Asia. Given this, about 679 QBWO days covering roughly 21.4% of total winter days were considered, which is comparable to that of the cold surge days. The frequency distribution of the QBWO for phases 6–8 is shown in Figure 4a. The occurrence frequency of the QBWO peaks during December, followed by November and January. The month-to-month evolution of the QBWO’s activity is consistent with that of the cold surges (Figure 1b), thereby indicating the potential effects of the QBWO on cold surges and the resultant rainfall over Southeast Asia.

3.2. Impact of QBWO on CSR over Southeast Asia

The QBWO over the WNP could change the CSR over Southeast Asia by directly modulating the environment to be more advantaged or disadvantaged for convections or by indirectly altering the cold surge activity through the consistent or opposite wind over the South China Sea. To elaborate on this, Figure 5a,b shows the composite rainfall and wind anomalies over Southeast Asia during phases 6–8 of the QBWO and during the days it co-exists with cold surges, respectively. The active QBWO is associated with a significant enhancement of rainfall over the EPH and is accompanied by a strong cyclonic circulation and low-level convergence surrounding the Philippines (Figure 5a). The northeasterly winds over the South China Sea are associated with the QBWO’s cyclonic circulation and could strengthen the southward invasion of cold surge winds. Anomalies in rainfall and circulation for days when the QBWO and a cold surge co-occur (Figure 5b) are dominated by the effects of the cold surge (Figure 2b); however, the presence of QBWO partly strengthens the CSR over Southeast Asia, especially over the EPH (Figure 5b). The co-occurring event can explain more than 45–50% of the total CSR amount over the EPH and more than 50% over the southeastern Indo-China Peninsula (Figure 5c). Hence, it confirms the strengthened effects of the QBWO over the WNP on Southeast Asian CSR.
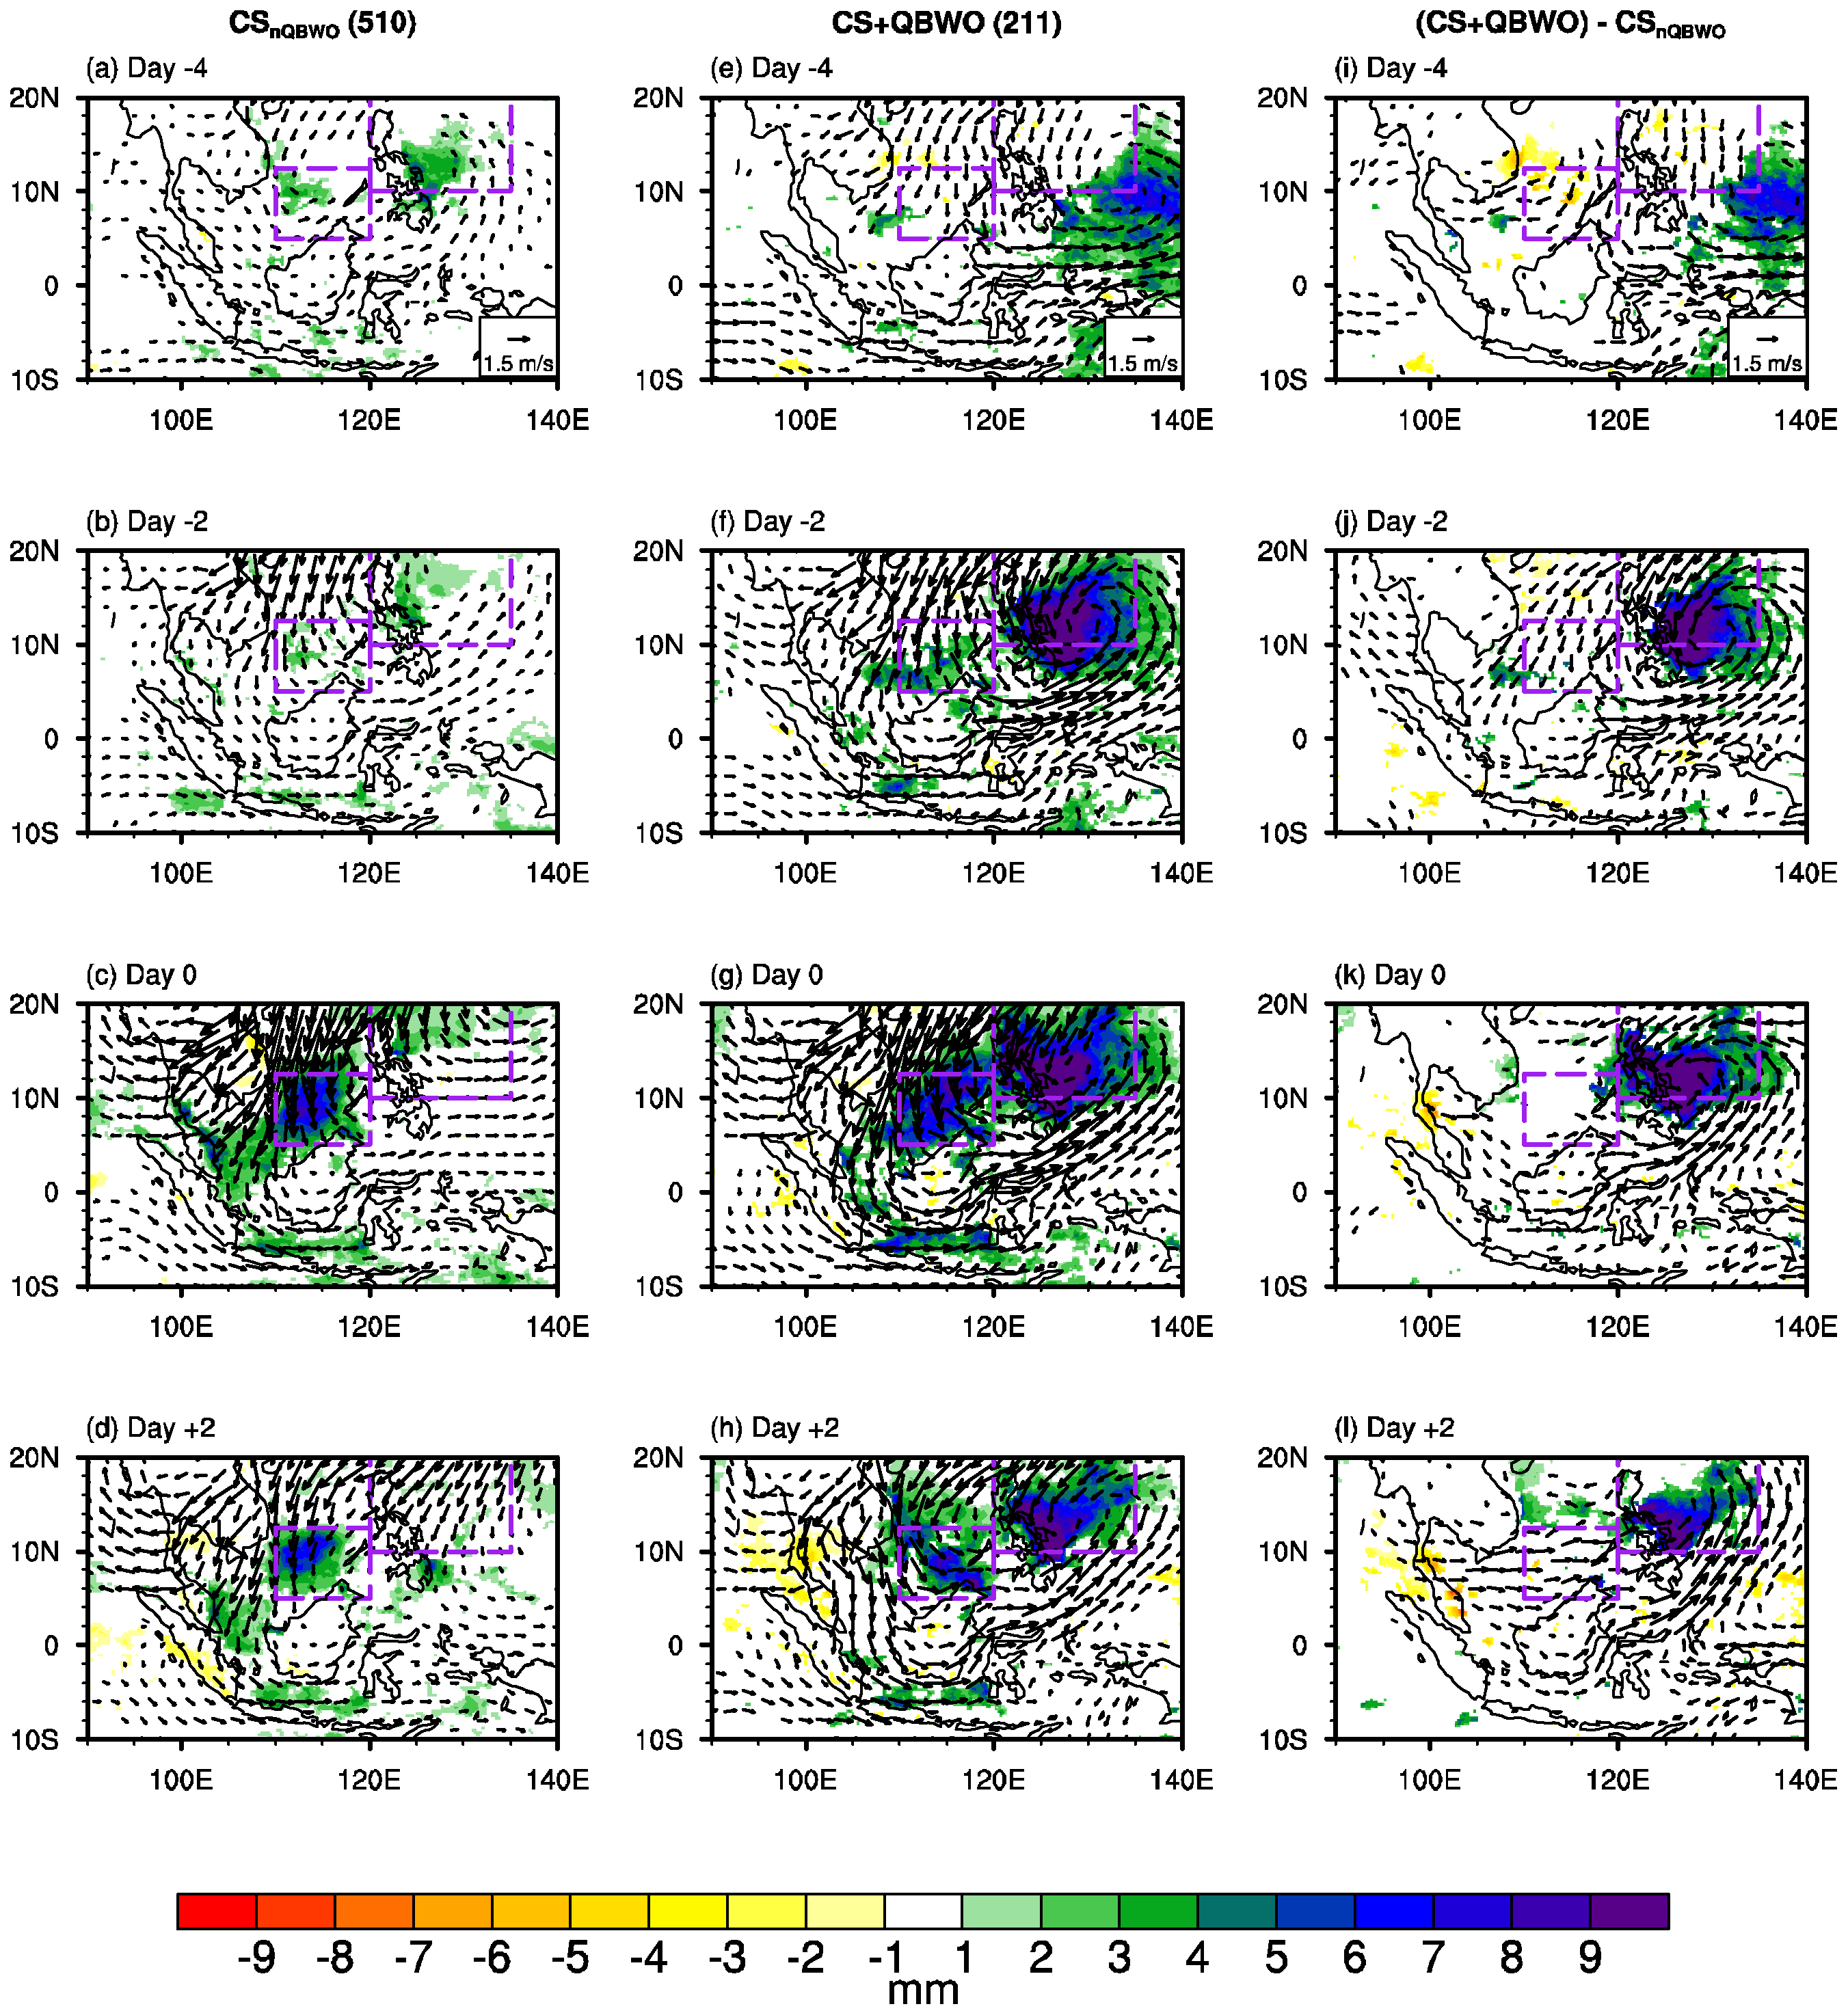
How does the QBWO affect the CSR and surge winds over Southeast Asia throughout its lifetime? To understand this, the lead-lag composites of the 925 hPa winds and rainfall anomalies for different time leads before a cold surge co-occurring without or with the QBWO are presented (Figure 6). At day −4 in the composite without the QBWO, the northeasterly winds over the South China Sea that are associated with cold surges are not fully established, and the Borneo vortex is weak (Figure 6a). Only a weak positive rainfall anomaly over the EPH was found in response to a cyclonic circulation, which was partly composed of the weak northeasterly surge winds over the South China Sea. The northeasterly winds then develop and intensify throughout the South China Sea at day −2, while the EPH rainfall has a slight northwestward movement and tends to weaken in the meantime (Figure 6b). The intensified northeasterly surge winds invade southward from the southern South China Sea and reach the Java Sea at day 0, thereby causing the Borneo vortex to be enhanced and extending heavy rainfall from the NBO to the Java Sea (Figure 6c). From day 0 to day +2, the cold surge starts to decay over the South China Sea, and it is also associated with the weakening of rainfall over the NBO (Figure 6d). The co-existing days show features of both the cold surge and the QBWO, whereas they are still dominated by the cold surge. At day −4, the signals related to the QBWO have not yet reached Southeast Asia. Hence, the QBWO has limited influence on the cold surge and CSR (Figure 6e,i). At day −2, the circulation and rainfall associated with the QBWO propagated northwestward and reached near the EPH (Figure 6f). With the help of the QBWO, the northeasterly surge winds over the South China Sea were strengthened and the CSR over the EPH was largely increased (Figure 6f,j). This situation persists from day −2 to day 0, and makes the surge winds penetrate further southward and change to westerly winds more quickly when crossing the equator at day 0 (Figure 6g,k). At day +2, there was a northwestward receding of the QBWO′s signals, resulting in the westerly anomalies over the southern South China Sea (Figure 6l). Consequently, the original northeasterly winds over there in the composite of cold surge days (Figure 6d) turned into the northerly winds when a cold surge and the QBWO co-exist (Figure 6h). This leads to a weakly negative rainfall anomaly over the southeastern parts of the Malay Peninsula due to the loose northeasterly wind–terrain interactions [13]. Overall, the comparison between the cold surge days with and without the QBWO indicates a strengthening effect of the QBWO on CSR over Southeast Asia. Despite the distribution of rainfall being strongly controlled by the cold surge when both events co-occurred, the additional effect implies that the arrival of the northwestward-propagating QBWO provided a favorable environment for the CSR increase over the EPH and the enhancement of the cold surge over the South China Sea.
To gain a detailed knowledge of the QBWO′s modulation on CSR over Southeast Asia, the day-to-day evolution of area-mean rainfall anomalies over the EPH and NBO are shown in the composite of cold surges co-occurring with or without the QBWO (Figure 7). It can be found that the heavy EPH rainfall, which was observed during all cold surge days (Figure 2b), was actually less induced by the remaining surge days when excluding phases 6–8 of the QBWO (Figure 7a). In contrast, the QBWO over the WNP contributes much more CSR over the EPH with magnitudes of roughly 6 mm around day 0 when the QBWO and a cold surge co-exist (Figure 7c)—about 6-times larger than those without the QBWO (Figure 7a). Another feature of heavy EPH rainfall in its daily evolution was characterized by an obvious oscillation of about two weeks when the QBWO exists, with the positive rainfall occurring from day −4 to day +4 and the negative rainfall appearing after day +4 and before day −4 (Figure 7c). Thus, the presence and propagation of the QBWO does not only greatly enhance the CSR intensity over the EPH, but also alter its lifetime. Similar periodic oscillations of rainfall evolutions also occur over the NBO, while the magnitudes of the area-mean rainfall are comparable whether the QBWO exists or not (Figure 7b,d). These results indicate that although the QBWO can affect the lifetime of CSR over the NBO by influencing the cold surge winds over the South China Sea (Figure 6), it has a limited effect on the CSR intensity over there.
In addition to the seasonal mean precipitation, the impacts of cold surges on Southeast Asia could also be reflected by extreme rainfall [17,37,38]. Thus, we further indicated the spatial distribution of rainfall probability over Southeast Asia, which surpasses the 90th and 95th percentile extreme threshold in NDJFM (Figure 8), and is forced by cold surge days with or without the QBWO. The threshold of extreme rainfall is defined as the 90th or 95th percentile at each grid for each NDJFM calendar day. The percentile thresholds are based on a centered 5-day window from 1998–2018 to produce a reasonable sample size. Then, an extreme day is detected when the rainfall in a day is above the threshold. The results show that a higher probability of extreme rainfall that exceeds a specific threshold is expected to occur over the areas with a higher mean rainfall (Figure 6c,g,k). During the cold surge days without the QBWO, the rainfall probability surpassing the 90th (95th) threshold is approximately 16% and 20% (8% and 10%) over the EPH and NBO (Figure 8a,d), respectively. When the QBWO over the WNP co-exists with a cold surge, there is a significant increase in the extreme rainfall probability over the EPH (Figure 8b,e). The increases in the 90th and 95th thresholds are above 10% and 8% (Figure 8c,f), respectively. Therefore, phases 6–8 of the QBWO make the environment more favorable for convection development over the EPH by facilitating conditional instability and moisture convergence surrounding the Philippines (Figure 5a); this can result in significantly increased CSR over the EPH and leads to a higher likelihood of triggering extreme rainfall compared to a cold surge alone. In contrast, the changes in the probability of experiencing extreme rainfall over the remaining regions of Southeast Asia are less directly influenced by the QBWO.

3.3. Comparison between the QBWO and MJO

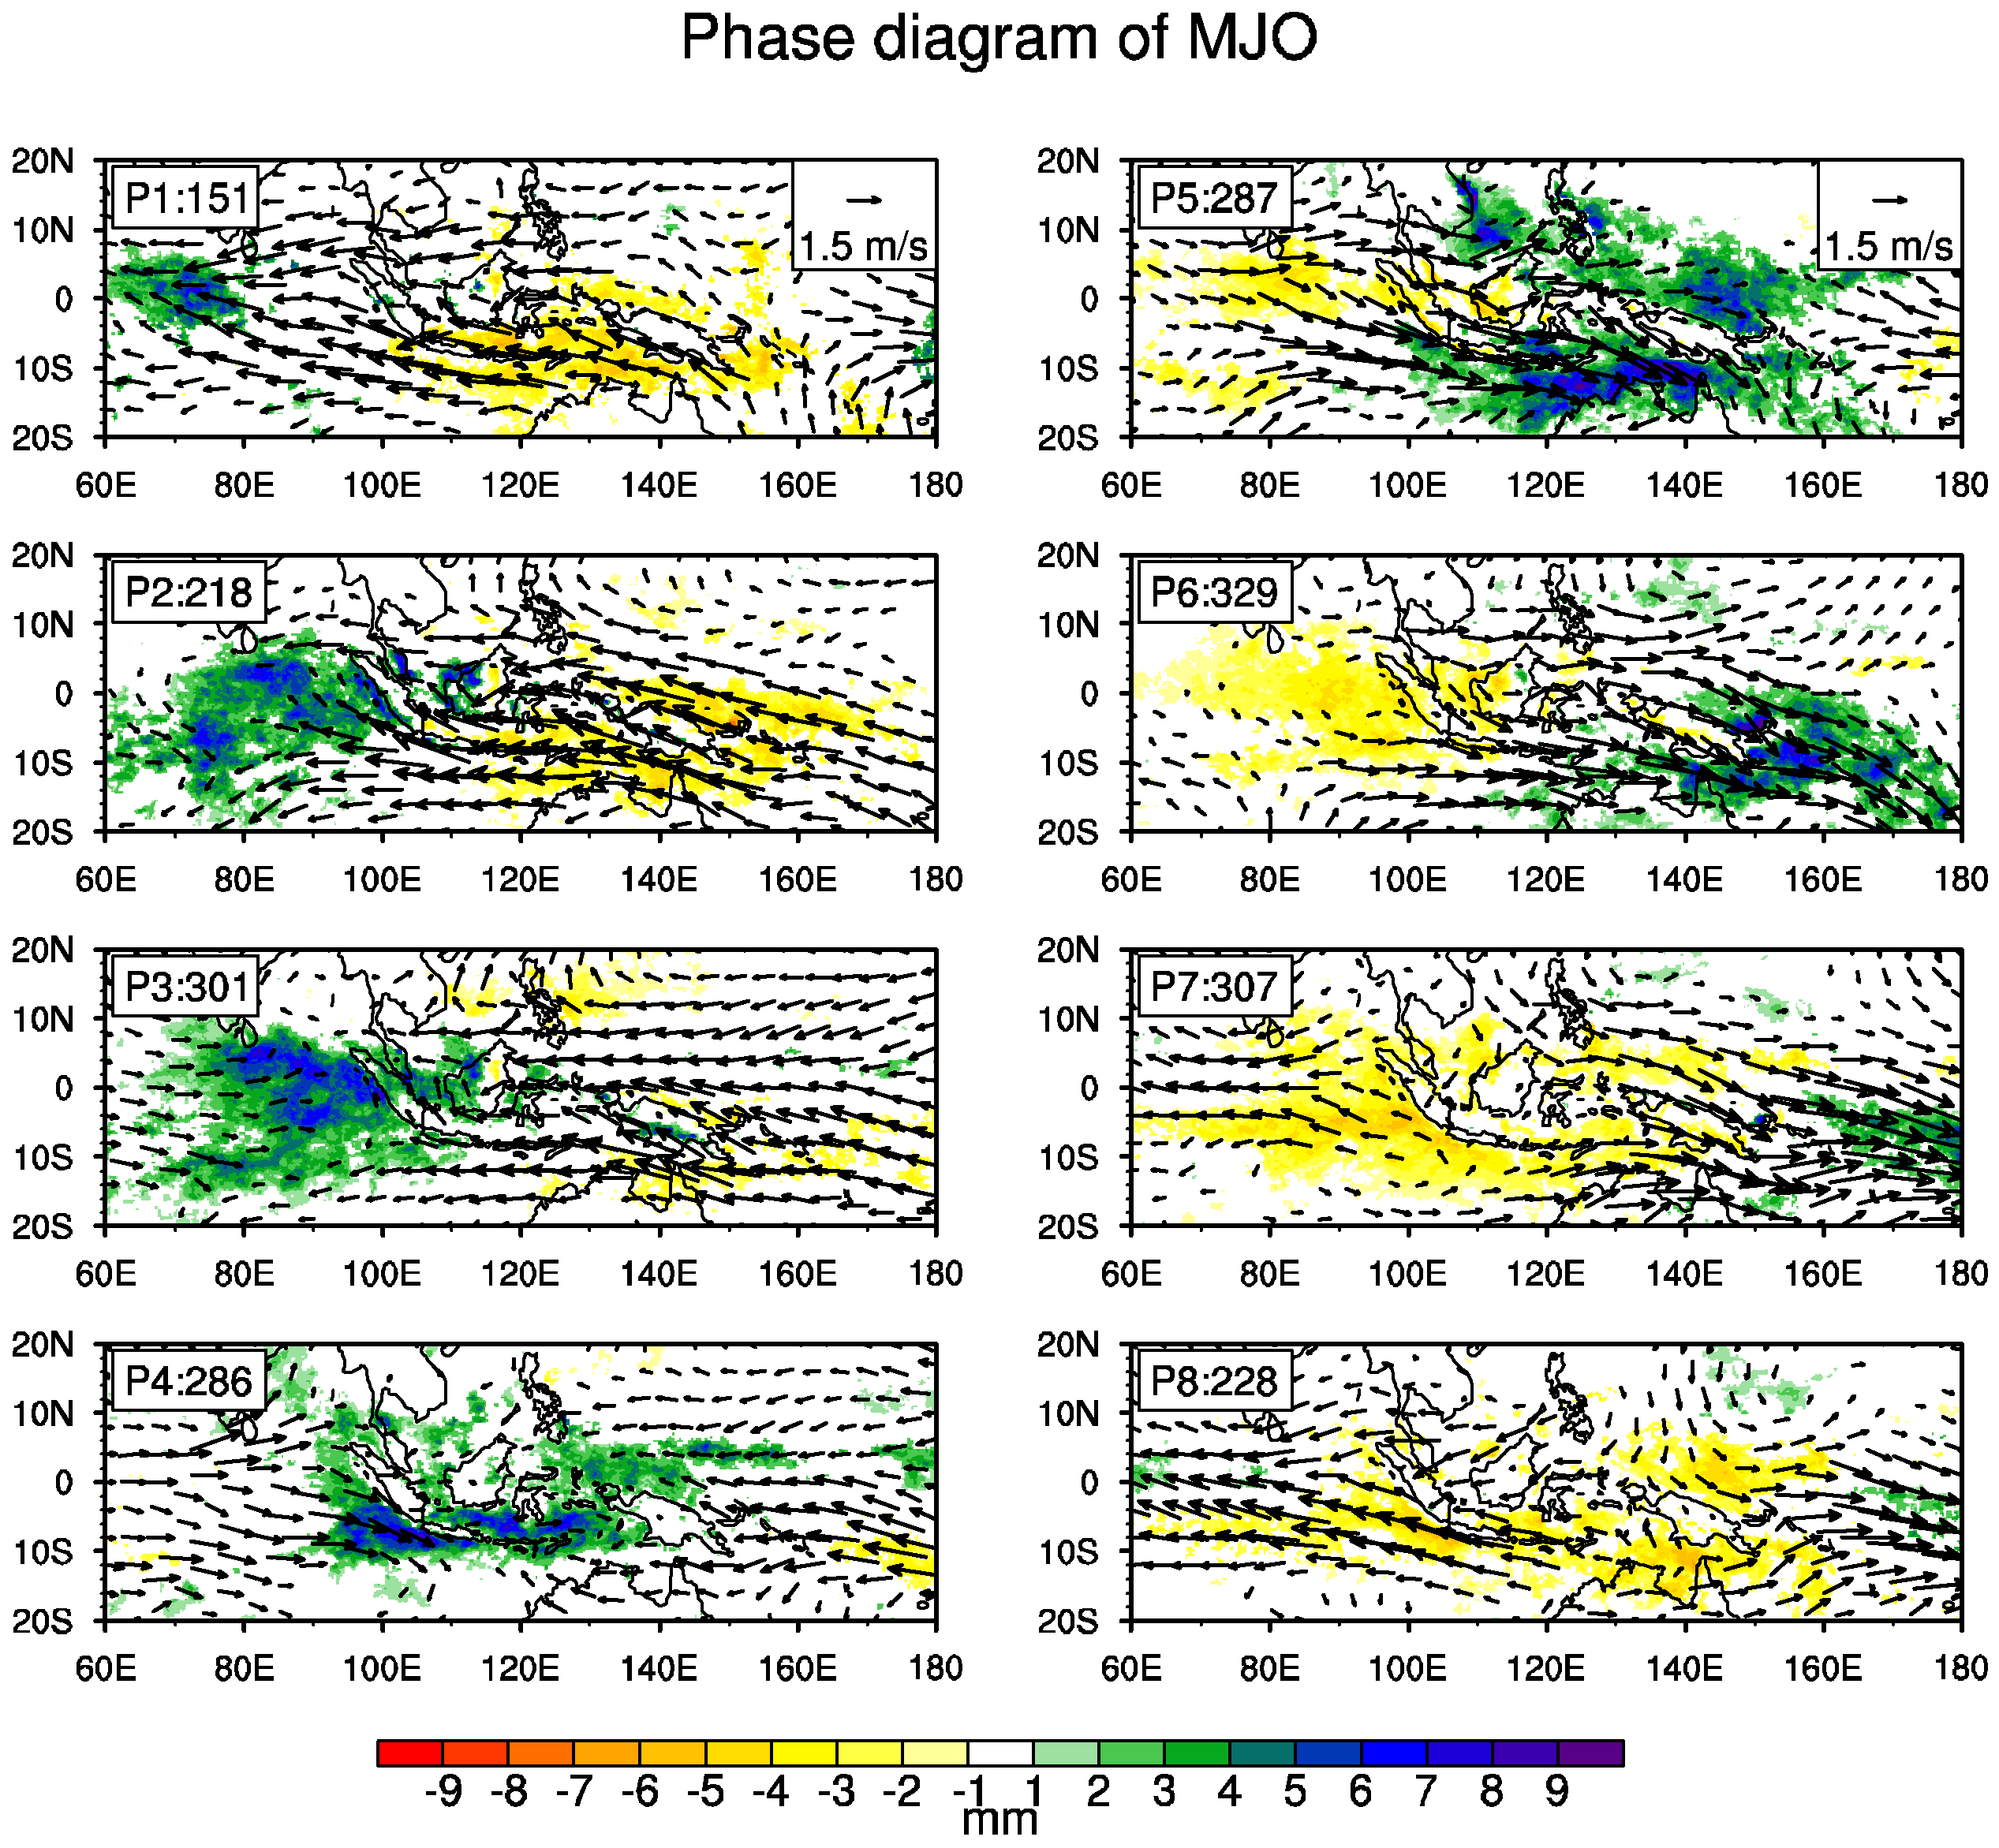
As the primary members of ISO during winter, both the QBWO and the MJO have substantial impacts on CSR over Southeast Asia. It is necessary and essential for us to compare these two ISO modes. The MJO is an eastward-propagating oscillation from the tropical Indian Ocean to the tropical central Pacific, with its convectively active phases impacting the rainfall distribution over Southeast Asia (Figure 9). It is accompanied by the Kelvin wave response of easterly (westerly) wind anomalies and Rossby wave response of cyclonic (anticyclonic) circulation to the east and to the northwest of the active (suppressive) convection, respectively. During phase 1, there is a southerly wind anomaly associated with the MJO that appears over the northern South China Sea. It then evolves into expansive southwesterly winds during phases 2 and 3. Subsequently, the wind anomaly gradually becomes the northerly wind and persists through phases 6 and 7. In the equatorial region of Southeast Asia, the easterly anomaly is observed during phases 1–3, and the westerly anomaly occurs during phases 5–7. The resulting circulation pattern is consistent with the evolution of the active and suppressed convections that are represented by the rainfall anomalies. In this study, we focus on MJO phases 2–4, in which the MJO-related rainfall anomalies are active over Southeast Asia [13,27]. The frequency distribution of the MJO during phases 2–4 for each winter month is shown in Figure 4b. Its activity peaks in March, in which cold surges and the QBWO begin to weaken (Figure 1b and Figure 4a). Hence, compared with the QBWO, the active MJO may superpose less cold surge days during an extended winter.
The wind and rainfall anomalies during phases 2–4 of the MJO are presented in Figure 10; it shows that a significant increase in rainfall is associated with the MJO and predominantly occurs over the western Maritime Continent, including the eastern Indian Ocean, the west of Sumatra, the southern Malay Peninsula, and parts of Borneo. However, the rainfall over the EPH was weak and negative and an anticyclonic circulation was observed over the South China Sea and Philippines Sea (Figure 10a). The anticyclone could weaken the northeasterly surge winds during the MJO episodes [27]. When the MJO and cold surge were concurred, the rainfall distribution over Southeast Asia was also dominated by cold surges; however, with the help of the MJO, the CSR over the southern South China Sea, eastern coast of the Malay Peninsula, and the east of Sumatra were largely increased (Figure 10b) compared to the individual cold surge composites (Figure 2b). Consequently, days where a cold surge co-existed with the MJO could explain about 35–45% of the total CSR over the southern South China Sea, Malay Peninsula, and the east of Sumatra (Figure 10c). These results indicate the different dominances of CSR under different ISO backgrounds.
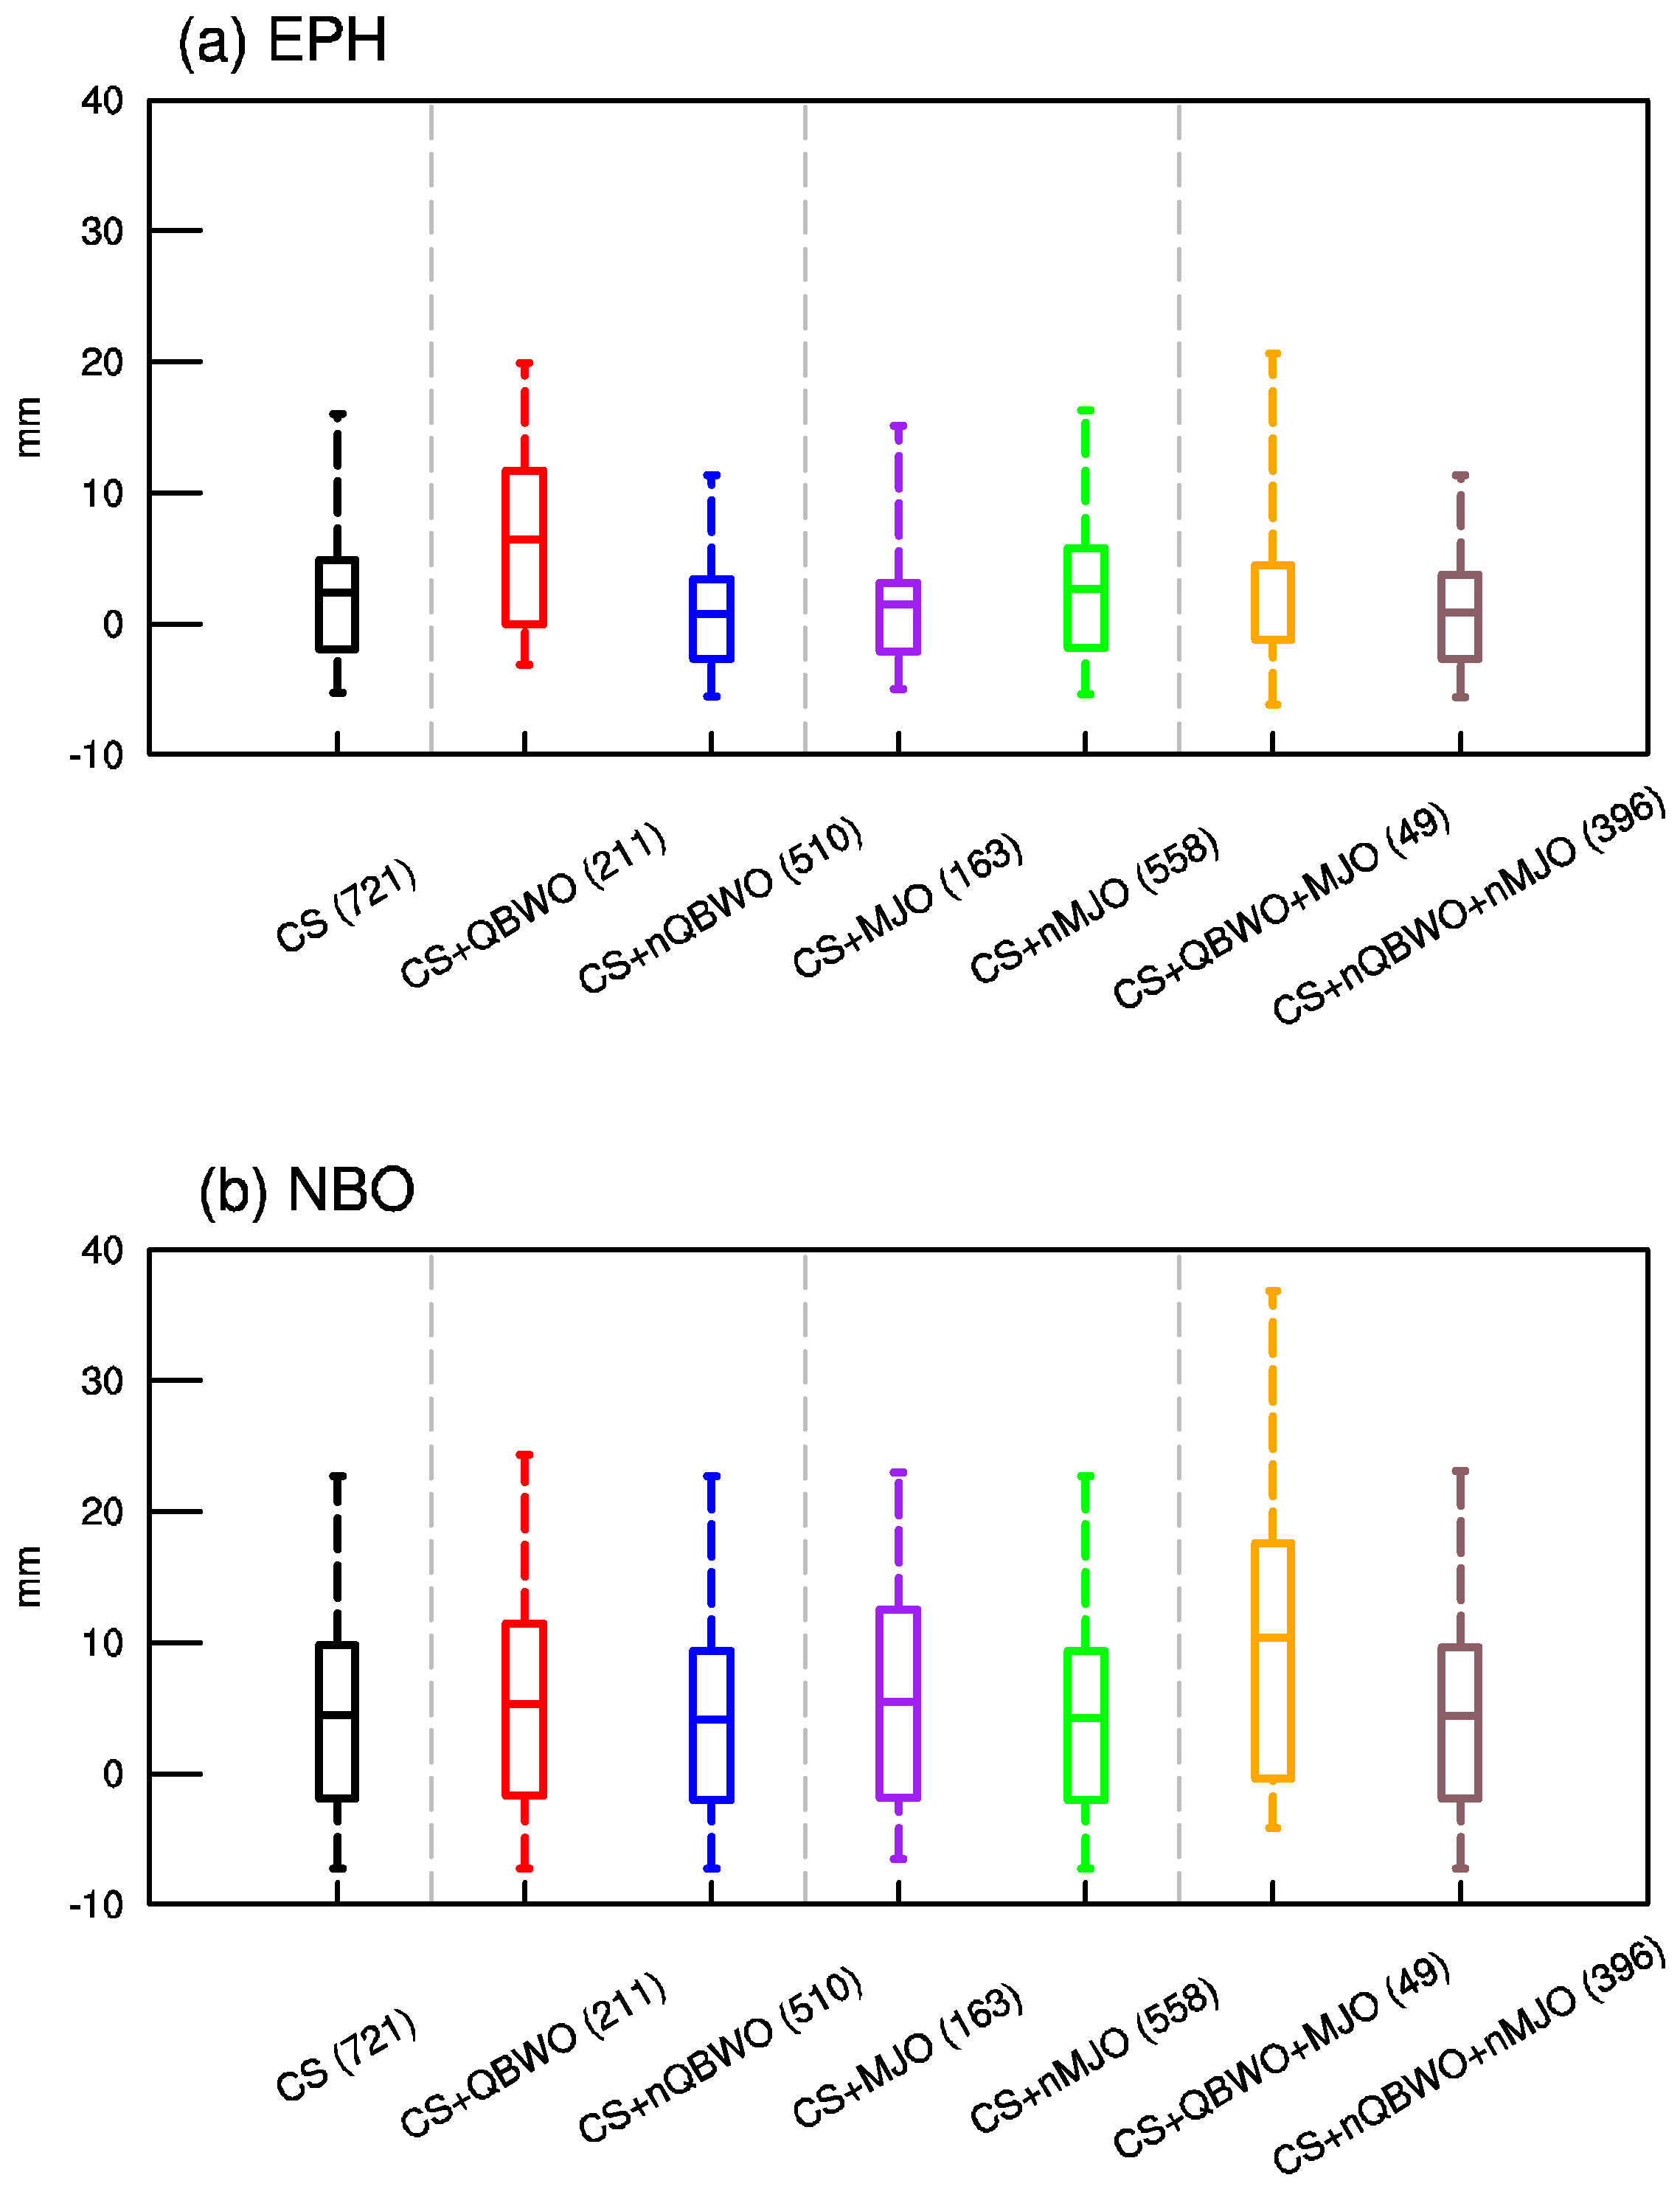
To better compare the effects of the QBWO and MJO on CSR over Southeast Asia, the box-plots of the area-mean rainfall anomalies over the EPH and NBO during different combinations are shown. Figure 11 presents that over the EPH, the composite rainfall magnitude was about 2.42 mm for all cold surge days; however, when the effect of the QBWO was included (excluded), the magnitude was largely increased (decreased) to 6.44 (0.76) mm (Table 1), indicating a greater (lesser) extreme rainfall intensity (Figure 11a). The opposite happens in the MJO composite, in which the CSR intensity is slightly decreased and increased when the active MJO days are included and excluded, respectively; this is because an opposite rainfall signal over the EPH occurred during phases 2–4 of the MJO (Figure 10a) and during all cold surge days (Figure 2b). As a result, when both ISO modes co-exist with a cold surge, the EPH rainfall increases to 4.46 mm, roughly 1.8-times larger than that of all cold surge days. In contrast, without the effect of any ISO mode, the EPH rainfall decreases to about 0.90 mm. These results indicate that the ISO can significantly influence the CSR over the EPH, in which the QBWO plays a more important role than the MJO. Compared to the EPH, the NBO rainfall has smaller changes during different composite groups (Figure 11b). Hence, the individual ISO mode has a limited influence on the CSR intensity over the NBO. Only when both ISO modes co-occur with a cold surge, the area-mean NBO rainfall is significantly increased to 10.39 mm, which is about 2.3-times larger than that of all the cold surge days, with a magnitude of 4.47 mm (Table 1). For such conditions, the extreme rainfall intensity over the NBO was also strengthened by approximately 1.6-times.
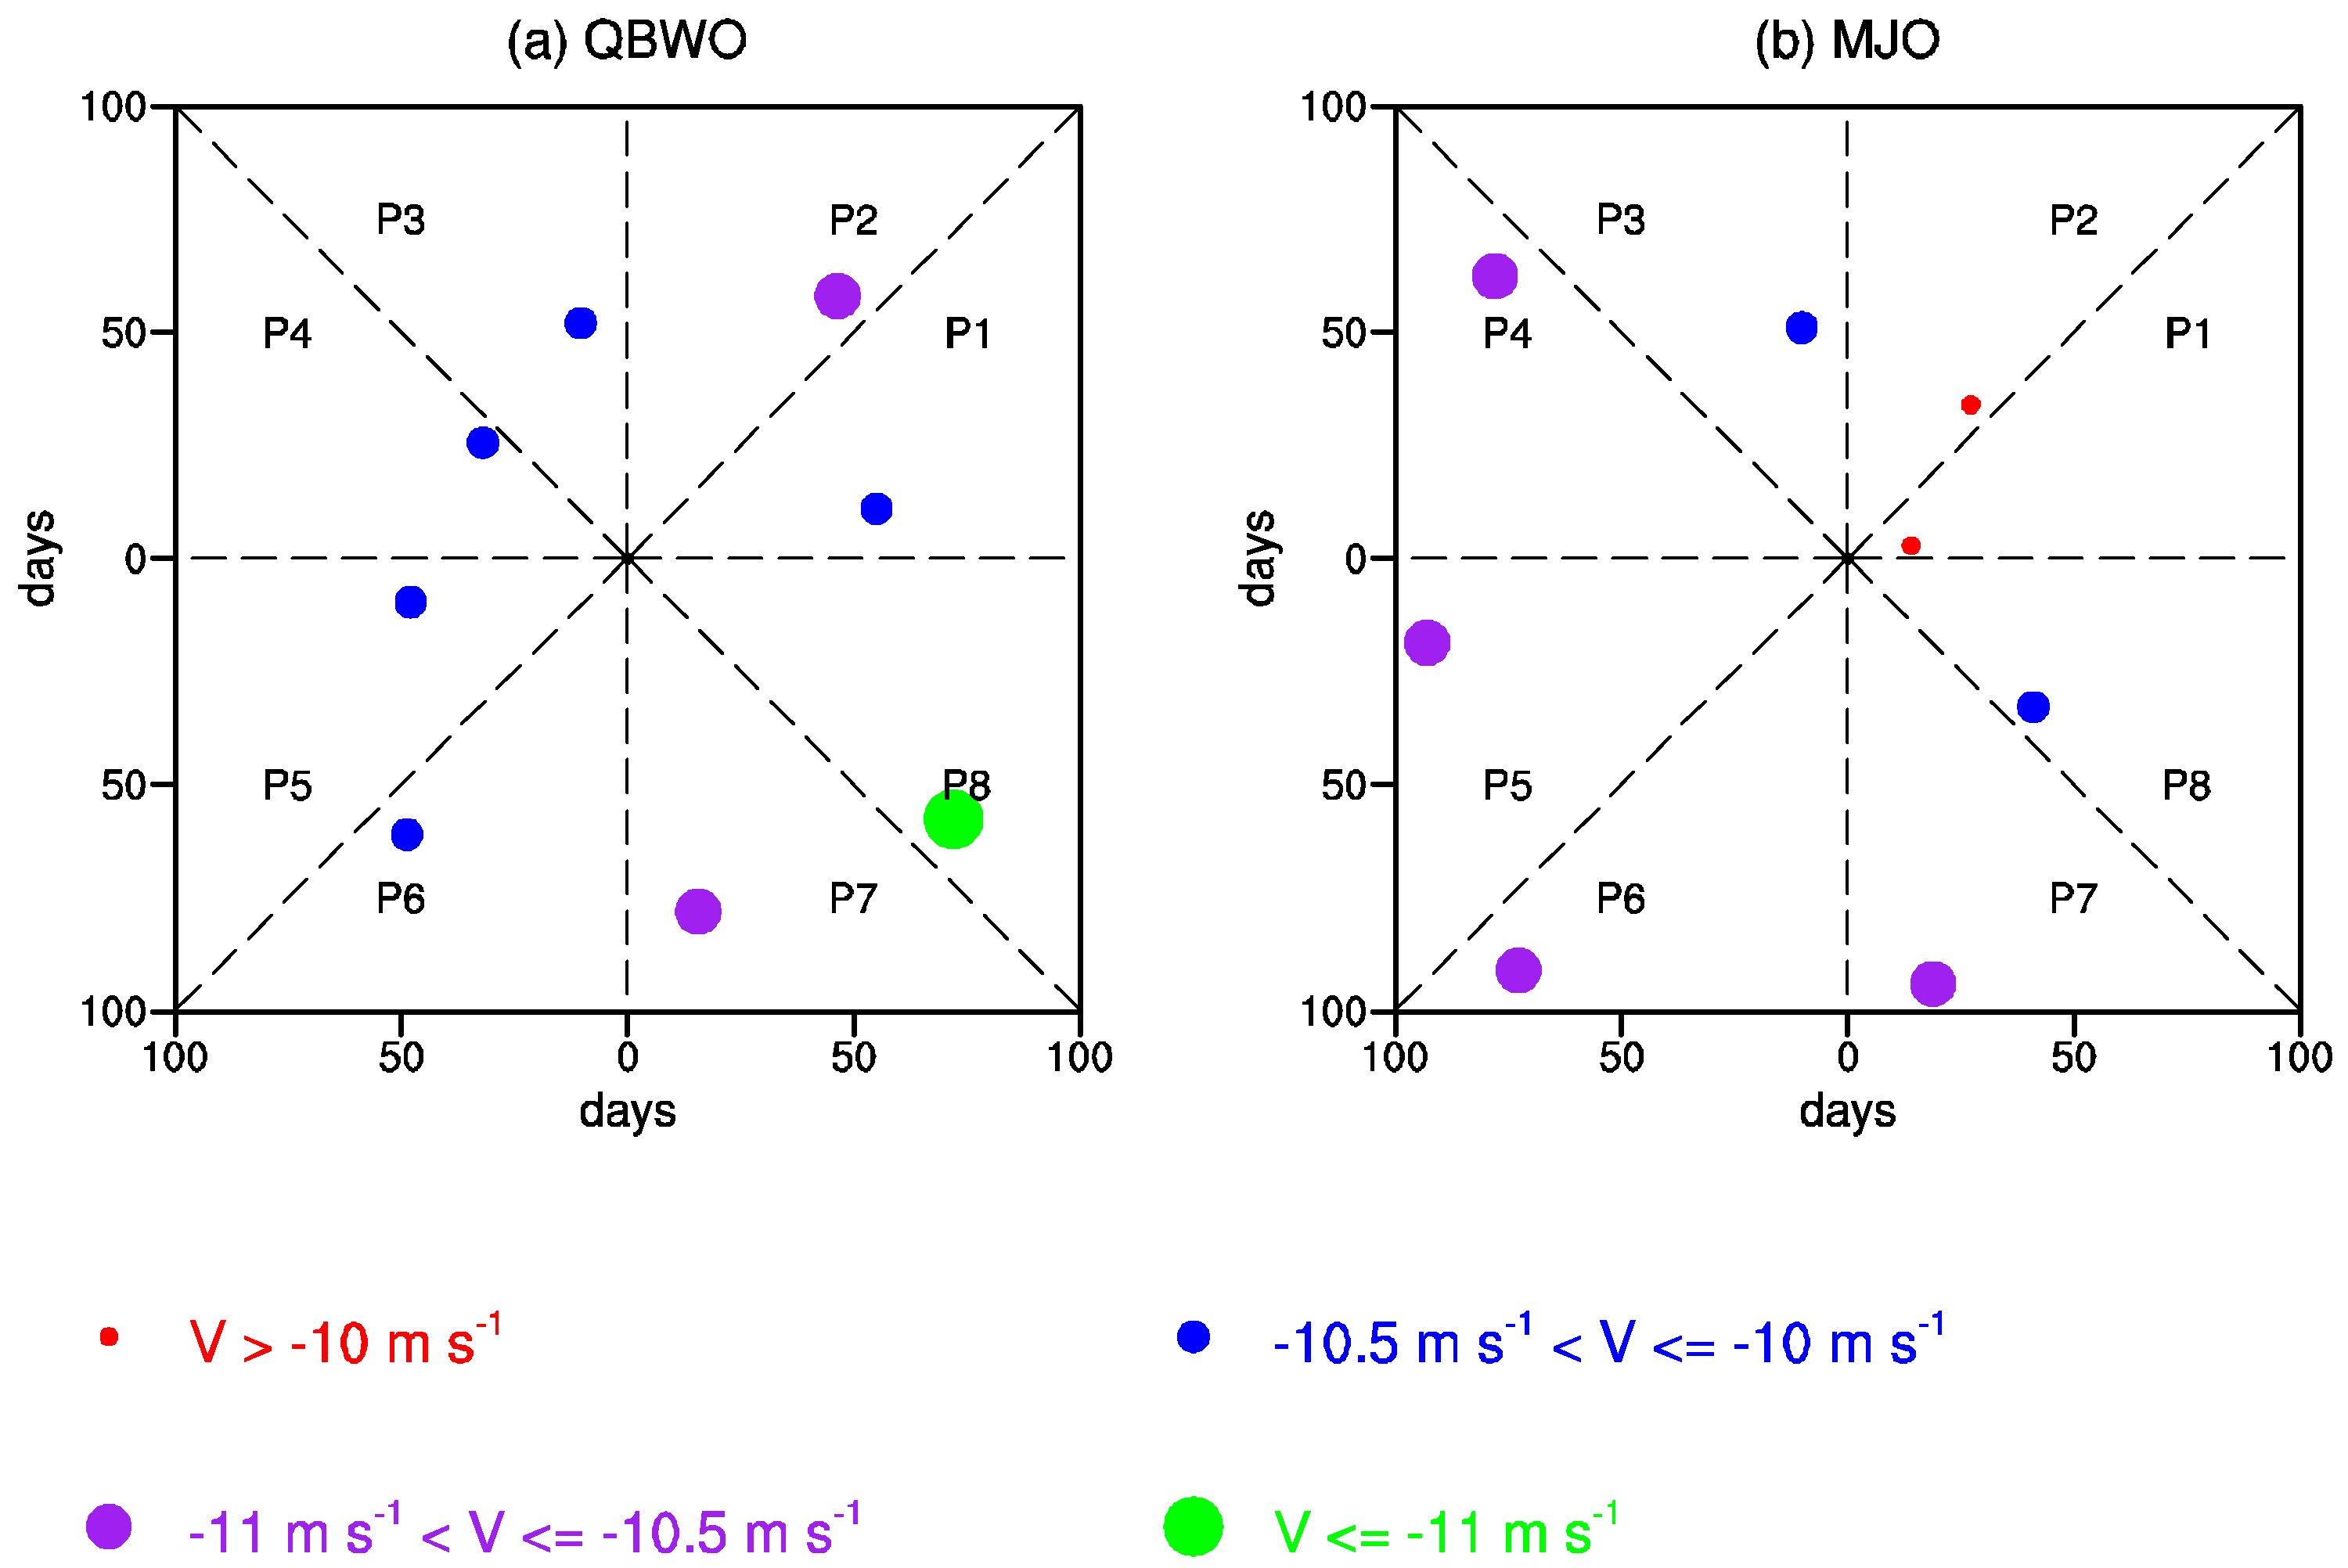
Apart from the influences on CSR, the cold surge activity could also be changed by these two ISO modes via the consistent or opposite dynamic structures over the South China Sea. To measure this possibility, Figure 12 shows the two-dimensional distribution of cold surge frequency and intensity during eight QBWO and MJO phases individually. Under the background of the QBWO, cold surges occur more frequently during phases 6–8 than the remaining phases (Figure 12a), with stronger surge winds during phases 7–8 due to the stronger northeasterly winds over the South China Sea that are associated with the QBWO (Figure 3). When the MJO exists, cold surges tend to occur more frequently (infrequently) during phases 5–7 (phases 1–2) with a higher (lower) surge wind intensity (Figure 12b). As a result, phases 5–7 (phases 1–2) of the MJO are the most preferred (unpopular) phases for the occurrence of cold surges, with a probability of about 56.05% (9.67%). The counterpart phases in the QBWO are phases 6–8 and phases 4–5, having probabilities of about 46.28% and 17.54% (Figure 13a), respectively. In addition to the separate co-occurrences of individual ISO modes with cold surges, the co-existence of both ISO modes for modulating the occurrence of cold surges was also investigated. This can be understood by a joint probability distribution (Figure 13b); it shows that the most probable phases for the occurrence of cold surges are the time when phase 1 of the QBWO co-exists with phase 7 of the MJO or the time when phase 7 of the QBWO couples with phase 5 of the MJO. The former combination may be dominated by the MJO, while the latter is dominated by both the QBWO and the MJO (Figure 13a). The joint probability signifies the fact that the favorable phases of only one type of ISO mode may not be the most conducive time for the occurrence of cold surges over the South China Sea. In fact, about 2.1% of the total cold surge days are linked with the time when phase 1 of the QBWO couples with phase 7 of the MJO (Figure 13c), and roughly 2.2% are associated with the time when phase 7 of the QBWO is consistent with phase 5 of the MJO (Figure 13d). These percentage values may seem smaller at a glance, but they represent the fact that out of (8 × 8) 64 combinations of ISO phases, only two capture 2.1% or 2.2% of the occurrence of total cold surge days, indicating the rare event when the QBWO, MJO and a cold surge are concurrent. A Venn diagram [39] suggests [supposing A and B be two arrays and n being the cardinal number: n A B = n A + n B n A B ] that about 18.5% of the total cold surge days would fall within either phase 1 of the QBWO or phase 7 of the MJO (Figure 13c), and about 21.5% would fall within either phase 7 of the QBWO or phase 5 of the MJO (Figure 13d). Accordingly, a sum of 40% of the total cold surge days could occur in either combination.

4. Discussion

In this study, we investigated the impact of the QBWO over the WNP on the CSR over Southeast Asia. The time scale of the QBWO is 10–20-days and is accompanied by westward propagation. These characteristics of the QBWO bear resemblance to the westward-propagating convectively coupled n = 1 equatorial Rossby (ER) wave since the n = 1 ER wave tends to be most active over the western Pacific and its variance peaks near periods of about 25–30 days [40]. Recently, Ferrett et al. [41] found that the increases in rainfall over the Philippines during winter are closely associated with the cyclonic winds of n = 1 ER waves. These results are similar to our study; however, the relationship between the QBWO and n = 1 ER wave remains unclear, and more work must be done to examine their relationship. This is left to future work.
In addition, this study only elaborates on the one-way effect between the QBWO and cold surges. Northeasterly cold surges can also play a crucial role that can affect the features of the ISO. For example, a cold surge over the South China Sea, which was documented as a trigger of tropical convection over the Maritime Continent, can provide favorable conditions for the MJO to propagate through the Maritime Continent and into the western Pacific [42]. Similarly, the strong cold air mass associated with cold surges over the South China Sea can enhance the local rising motion and cause enhanced cumulus cloud cover over the WNP [43]. This may strengthen the convective development and the cyclonic circulation through the northeasterly wind anomalies in situ, thus resulting in the possibility of affecting the QBWO over the WNP. This two-way interaction is an important issue that can help better understand tropical-extratropical interactions and warrants future research.

5. Conclusions

Based on TRMM satellite observations and the ERA5 atmospheric re-analysis dataset, this paper investigated the influence of the QBWO over the WNP on winter CSR over Southeast Asia. On a synoptic scale, Southeast Asian rainfall is primarily driven by cold surges. The northwestward-propagating QBWO over the WNP can evidently modulate the CSR over Southeast Asia. During phases 6–8 of the QBWO, the associated convection and circulation signals reached Southeast Asia. At that time, a strong cyclonic circulation coupling with a significant positive rainfall was observed surrounding the Philippines. On the one hand, the northeasterly wind anomaly that was associated with the cyclonic circulation led to enhanced cold surge winds over the South China Sea. On the other hand, the QBWO’s active convection can result in a large increase in the cold surge-related mean and extreme rainfall over the EPH and could make the rainfall evolution result in a typical quasi-biweekly feature. Hence, the QBWO over the WNP provides a favorable environment for CSR increase over Southeast Asia.
A comparison between the impacts of the QBWO and MJO shows that the QBWO dominates the CSR over the EPH, while the dominance in active MJO phases (i.e., phases 2–4) is over the western Maritime Continent. Hence, the effects from the QBWO are independent of those from the MJO. These results can provide different perspectives for understanding high-impact extreme weather events over Southeast Asia. In addition, due to the consistent northeasterly winds over the South China Sea that are related to a specific ISO mode, the most preferred phases for the occurrence of cold surges over the South China Sea were investigated further. We found that about 40% of the cold surge days would fall within phase 1 of the QBWO or phase 7 of the MJO, or within phase 7 of the QBWO or phase 5 of the MJO. This information is important and may offer valuable insights for the better prediction of cold surges while considering special ISO phases.

Author Contributions

Conceptualization, L.W. and Z.D.; data curation, L.W.; methodology, Z.D., and P.H; software, Z.D. and P.H.; validation, Z.D., L.W. and R.Y.; formal analysis, Z.D., L.W., R.Y. and J.C; investigation, Z.D., L.W., R.Y. and J.C.; writing—original draft preparation, Z.D.; writing—review and editing, Z.D.; visualization, Z.D. All authors have read and agreed to the published version of the manuscript.

Funding

This research was funded by the National Natural Science Foundation of China, grant number 42030603, 42022035, and 42205061.

Data Availability Statement

The TRMM satellite observation was downloaded from https://gpm.nasa.gov/data/directory/ (accessed on 1 January 2021). The ERA5 atmospheric re-analysis data were downloaded from https://cds.climate.copernicus.eu/ (accessed on 1 January 2021). The RMM index was obtained from the Bureau Meteorology of Australia via http://www.bom.gov.au/climate/mjo/graphics/rmm.74toRealtime.txt (accessed on 1 January 2021).

Acknowledgments

We thank the three anonymous reviewers for their valuable comments and suggestions to improve the manuscript.

Conflicts of Interest

The authors declare no conflict of interest.

References

  1. Chang, C.-P.; Wang, Z.; McBride, J.; Liu, C.-H. Annual Cycle of Southeast Asia—Maritime Continent Rainfall and the Asymmetric Monsoon Transition. J. Clim. 2005, 18, 287–301. [Google Scholar] [CrossRef]
  2. Akasaka, I.; Morishima, W.; Mikami, T. Seasonal march and its spatial difference of rainfall in the Philippines. Int. J. Climatol. 2007, 27, 715–725. [Google Scholar] [CrossRef]
  3. Wang, L.; Chen, W. How well do existing indices measure the strength of the East Asian winter monsoon? Adv. Atmos. Sci. 2010, 27, 855–870. [Google Scholar] [CrossRef]
  4. Sengupta, A.; Nigam, S. The Northeast Winter Monsoon over the Indian Subcontinent and Southeast Asia: Evolution, Interannual Variability, and Model Simulations. J. Clim. 2019, 32, 231–249. [Google Scholar] [CrossRef]
  5. Chang, C.-P.; Harr, P.A.; Chen, H.-J. Synoptic Disturbances over the Equatorial South China Sea and Western Maritime Continent during Boreal Winter. Mon. Weather Rev. 2005, 133, 489–503. [Google Scholar] [CrossRef]
  6. Chen, T.-C.; Tsay, J.-D.; Matsumoto, J.; Alpert, J. Development and Formation Mechanism of the Southeast Asian Winter Heavy Rainfall Events around the South China Sea. Part I: Formation and Propagation of Cold Surge Vortex. J. Clim. 2015, 28, 1417–1443. [Google Scholar] [CrossRef]
  7. Fauzi, R.R.; Hidayat, R. Role of cold surge and MJO on rainfall enhancement over indonesia during east asian winter monsoon. IOP Conf. Ser. Earth Environ. Sci. 2018, 149, 012045. [Google Scholar] [CrossRef] [Green Version]
  8. Wu, M.C.; Chan, J.C.L. Surface Features of Winter Monsoon Surges over South China. Mon. Weather Rev. 1995, 123, 662–680. [Google Scholar] [CrossRef]
  9. Hattori, M.; Mori, S.; Matsumoto, J. The Cross-Equatorial Northerly Surge over the Maritime Continent and Its Relationship to Precipitation Patterns. J. Meteorol. Soc. Japan. Ser. II 2011, 89, 27–47. [Google Scholar] [CrossRef] [Green Version]
  10. Pang, B.; Lu, R. Two Distinct Types of Extratropical Circulation Anomalies Associated with Cold Surges over the South China Sea. J. Clim. 2019, 32, 5069–5084. [Google Scholar] [CrossRef]
  11. Chang, C.-P.; Erickson, J.E.; Lau, K.M. Northeasterly Cold Surges and Near-Equatorial Disturbances over the Winter MONEX Area during December 1974. Part I: Synoptic Aspects. Mon. Weather Rev. 1979, 107, 812–829. [Google Scholar] [CrossRef]
  12. Zhang, Y.; Sperber, K.R.; Boyle, J.S. Climatology and Interannual Variation of the East Asian Winter Monsoon: Results from the 1979–95 NCEP/NCAR Reanalysis. Mon. Weather Rev. 1997, 125, 2605–2619. [Google Scholar] [CrossRef]
  13. Lim, S.Y.; Marzin, C.; Xavier, P.; Chang, C.-P.; Timbal, B. Impacts of Boreal Winter Monsoon Cold Surges and the Interaction with MJO on Southeast Asia Rainfall. J. Clim. 2017, 30, 4267–4281. [Google Scholar] [CrossRef]
  14. Tangang, F.T.; Juneng, L.; Salimun, E.; Vinayachandran, P.N.; Seng, Y.K.; Reason, C.J.C.; Behera, S.K.; Yasunari, T. On the roles of the northeast cold surge, the Borneo vortex, the Madden-Julian Oscillation, and the Indian Ocean Dipole during the extreme 2006/2007 flood in southern Peninsular Malaysia. Geophys. Res. Lett. 2008, 35, L14S07. [Google Scholar] [CrossRef]
  15. Saragih, R.M.; Fajarianti, R.; Winarso, P.A. Atmospheric study of the impact of Borneo vortex and Madden-Julian oscillation over Western Indonesian maritime area. J. Phys. Conf. Ser. 2018, 997, 012004. [Google Scholar] [CrossRef] [Green Version]
  16. Isnoor, K.F.N.; Firdianto, P.U.; Rejeki, H.A. The activity of Borneo Vortex as a trigger for extreme rain in West Borneo (case study: 24th–25th January 2017). IOP Conf. Ser. Earth Environ. Sci. 2019, 303, 012061. [Google Scholar] [CrossRef] [Green Version]
  17. Pullen, J.; Gordon, A.L.; Flatau, M.; Doyle, J.D.; Villanoy, C.; Cabrera, O. Multiscale influences on extreme winter rainfall in the Philippines. J. Geophys. Res. Atmos. 2015, 120, 3292–3309. [Google Scholar] [CrossRef]
  18. Xavier, P.; Lim, S.Y.; Ammar Bin Abdullah, M.F.; Bala, M.; Chenoli, S.N.; Handayani, A.S.; Marzin, C.; Permana, D.; Tangang, F.; Williams, K.D.; et al. Seasonal Dependence of Cold Surges and their Interaction with the Madden–Julian Oscillation over Southeast Asia. J. Clim. 2020, 33, 2467–2482. [Google Scholar] [CrossRef]
  19. Simpson, J.; Kummerow, C.; Tao, W.K.; Adler, R.F. On the Tropical Rainfall Measuring Mission (TRMM). Meteorol. Atmos. Phys. 1996, 60, 19–36. [Google Scholar] [CrossRef] [Green Version]
  20. Kummerow, C.; Barnes, W.; Kozu, T.; Shiue, J.; Simpson, J. The Tropical Rainfall Measuring Mission (TRMM) Sensor Package. J. Atmos. Ocean. Technol. 1998, 15, 809–817. [Google Scholar] [CrossRef]
  21. Sorooshian, S.; Gao, X.; Hsu, K.; Maddox, R.A.; Hong, Y.; Gupta, H.V.; Imam, B. Diurnal Variability of Tropical Rainfall Retrieved from Combined GOES and TRMM Satellite Information. J. Clim. 2002, 15, 983–1001. [Google Scholar] [CrossRef]
  22. Mao, J.; Wu, G. Diurnal variations of summer precipitation over the Asian monsoon region as revealed by TRMM satellite data. Sci. China Earth Sci. 2012, 55, 554–566. [Google Scholar] [CrossRef]
  23. Madden, R.A.; Julian, P.R. Detection of a 40–50 Day Oscillation in the Zonal Wind in the Tropical Pacific. J. Atmos. Sci. 1971, 28, 702–708. [Google Scholar] [CrossRef]
  24. Madden, R.A.; Julian, P.R. Description of Global-Scale Circulation Cells in the Tropics with a 40–50 Day Period. J. Atmos. Sci. 1972, 29, 1109–1123. [Google Scholar] [CrossRef]
  25. Gill, A.E. Some simple solutions for heat-induced tropical circulation. Q. J. R. Meteorol. Soc. 1980, 106, 447–462. [Google Scholar] [CrossRef]
  26. Zhang, C. Madden-Julian Oscillation. Rev. Geophys. 2005, 43, RG2003. [Google Scholar] [CrossRef] [Green Version]
  27. Xavier, P.; Rahmat, R.; Cheong, W.K.; Wallace, E. Influence of Madden-Julian Oscillation on Southeast Asia rainfall extremes: Observations and predictability. Geophys. Res. Lett. 2014, 41, 4406–4412. [Google Scholar] [CrossRef]
  28. Kikuchi, K.; Wang, B. Global Perspective of the Quasi-Biweekly Oscillation. J. Clim. 2009, 22, 1340–1359. [Google Scholar] [CrossRef]
  29. Wen, M.; Yang, S.; Higgins, W.; Zhang, R. Characteristics of the Dominant Modes of Atmospheric Quasi-Biweekly Oscillation over Tropical–Subtropical Americas. J. Clim. 2011, 24, 3956–3970. [Google Scholar] [CrossRef]
  30. Jia, X.; Yang, S. Impact of the quasi-biweekly oscillation over the western North Pacific on East Asian subtropical monsoon during early summer. J. Geophys. Res. Atmos. 2013, 118, 4421–4434. [Google Scholar] [CrossRef]
  31. Dong, Z.; Wang, L. Quasi-Biweekly Oscillation over the Western North Pacific in Boreal Winter and Its Influence on the Central North American Air Temperature. J. Clim. 2022, 35, 1901–1913. [Google Scholar] [CrossRef]
  32. Kummerow, C.; Simpson, J.; Thiele, O.; Barnes, W.; Chang, A.T.C.; Stocker, E.; Adler, R.F.; Hou, A.; Kakar, R.; Wentz, F.; et al. The Status of the Tropical Rainfall Measuring Mission (TRMM) after Two Years in Orbit. J. Appl. Meteorol. 2000, 39, 1965–1982. [Google Scholar] [CrossRef]
  33. Hersbach, H.; Bell, B.; Berrisford, P.; Hirahara, S.; Horányi, A.; Muñoz-Sabater, J.; Nicolas, J.; Peubey, C.; Radu, R.; Schepers, D.; et al. The ERA5 global reanalysis. Q. J. R. Meteorol. Soc. 2020, 146, 1999–2049. [Google Scholar] [CrossRef]
  34. Wheeler, M.C.; Hendon, H.H. An All-Season Real-Time Multivariate MJO Index: Development of an Index for Monitoring and Prediction. Mon. Weather Rev. 2004, 132, 1917–1932. [Google Scholar] [CrossRef]
  35. Bretherton, C.S.; Widmann, M.; Dymnikov, V.P.; Wallace, J.M.; Bladé, I. The Effective Number of Spatial Degrees of Freedom of a Time-Varying Field. J. Clim. 1999, 12, 1990–2009. [Google Scholar] [CrossRef]
  36. Moten, S.; Yunus, F.; Ariffin, M.; Burham, N.; Jeong Yik, D.; Mat Adam, M.K.; Weng Sang, Y. Satistics of Northeast Monsoon Onset, Withdrawal and Cold Surges in Malaysia. Malays. Meteorol. Dept. Tech. Rep. 2014, 27. Available online: http://www.met.gov.my/in/web/metmalaysia/publications/technicalpaper/fullpapers/document/44759/rp00_2014.pdf (accessed on 1 January 2021).
  37. Juneng, L.; Tangang, F.T.; Reason, C.J.C. Numerical case study of an extreme rainfall event during 9–11 December 2004 over the east coast of Peninsular Malaysia. Meteorol. Atmos. Phys. 2007, 98, 81–98. [Google Scholar] [CrossRef]
  38. Hai, O.S.; Samah, A.A.; Chenoli, S.N.; Subramaniam, K.; Ahmad Mazuki, M.Y. Extreme Rainstorms that Caused Devastating Flooding across the East Coast of Peninsular Malaysia during November and December 2014. Weather Forecast. 2017, 32, 849–872. [Google Scholar] [CrossRef]
  39. Karmakar, N.; Misra, V. The Relation of Intraseasonal Variations With Local Onset and Demise of the Indian Summer Monsoon. J. Geophys. Res. Atmos. 2019, 124, 2483–2506. [Google Scholar] [CrossRef]
  40. Kiladis, G.N.; Matthew, C.; Wheeler, M.C.; Haertel, P.T.; Straub, K.H.; Roundy, P.E. Convectively coupled equatorial waves. Rev. Geophys. 2009, 47, RG2003. [Google Scholar] [CrossRef]
  41. Ferrett, S.; Yang, G.-Y.; Woolnough, S.J.; Methven, J.; Hodges, K.; Holloway, C.E. Linking extreme precipitation in Southeast Asia to equatorial waves. Q. J. R. Meteorol. Soc. 2020, 146, 665–684. [Google Scholar] [CrossRef]
  42. Pang, B.; Lu, R.; Ling, J. Impact of cold surges on the Madden-Julian oscillation propagation over the Maritime Continent. Atmos. Sci. Lett. 2018, 19, e854. [Google Scholar] [CrossRef]
  43. Wang, L.; Chen, W. An Intensity Index for the East Asian Winter Monsoon. J. Clim. 2014, 27, 2361–2374. [Google Scholar] [CrossRef]
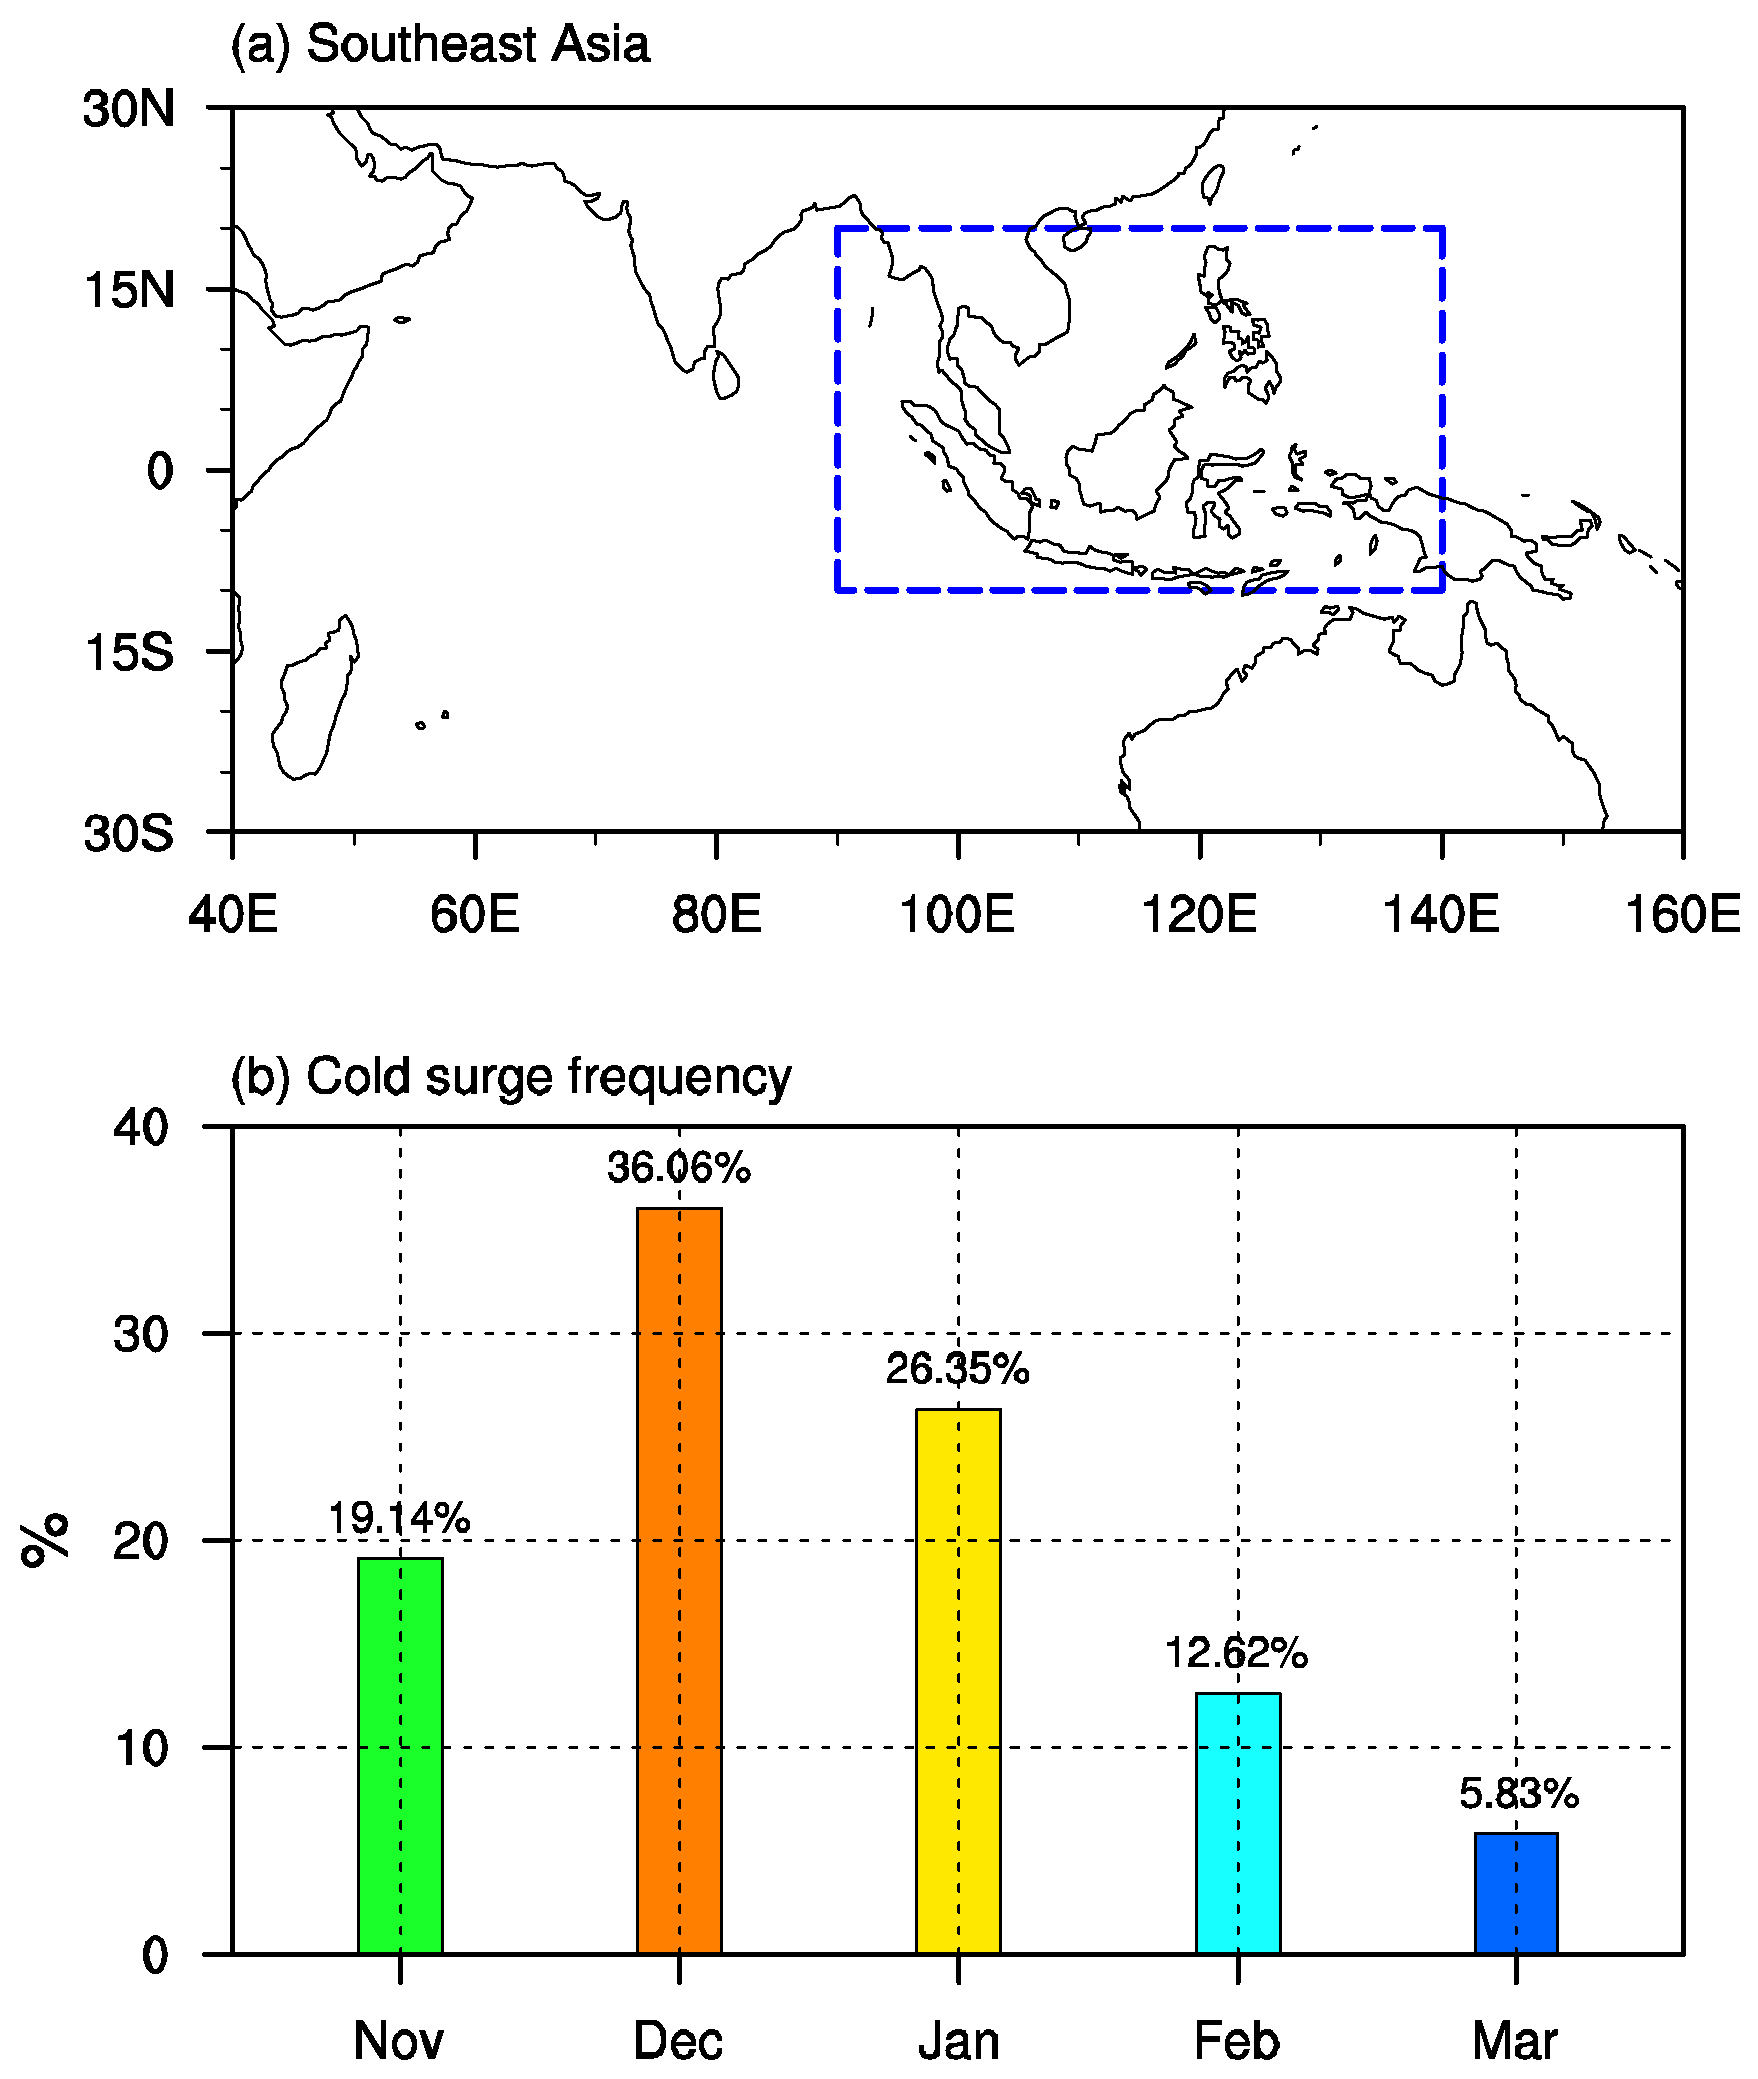
Figure 1. (a) Study area of Southeast Asia (10°S–20°N, 90°–140°E) indicated by the blue rectangle. (b) Frequency distribution (unit: %) of cold surge days for each winter month during 1998–2018.
Remotesensing 14 05200 g001
Figure 2. Composite anomalies of precipitation [shade, shade interval (SI) = 1 mm] and 925 hPa winds (vector, unit: 1.5 ms−1) during (a) no cold surge days and (b) cold surge days, respectively. (c) is the ratio (shade, SI = 10%) of total precipitation in (b) to that for all winter days. Number in left title indicates the composite days. Rectangles in (b) represent the regions over the EPH (10°–20°N, 120°–135°E) and NBO (5°–12.5°N, 110°–120°E), respectively. Values and vectors exceeding the 95% confidence levels based on the two-tailed Student’s t-test are shown in (a,b).
Remotesensing 14 05200 g002
Figure 3. Composite anomalies of precipitation (shade, SI = 1 mm) and 925 hPa winds (vector, unit: 1.5 ms−1) during eight phases of the QBWO over the WNP. Number in top-right represents the composite days in each QBWO phase. Values and vectors exceeding the 95% confidence levels based on the two-tailed Student’s t-test are shown.
Remotesensing 14 05200 g003
Figure 4. Frequency distribution (unit: %) of (a) QBWO days in phases 6–8 and (b) MJO days in phases 2–4 for each winter month during 1998–2018.
Remotesensing 14 05200 g004
Figure 5. Composite anomalies of precipitation (shade, SI = 1 mm) and 925 hPa winds (vector, unit: 1.5 ms−1) during days (a) in phases 6–8 of the QBWO and (b) during days when the QBWO and cold surge co-exist. Number in left title represents the composite days. (c) is the ratio (shade, SI = 5%) of total precipitation in (b) to that during all cold surge days. Rectangles in (b) represent the regions over the EPH (10°–20°N, 120°–135°E) and NBO (5°–12.5°N, 110°–120°E), respectively. Values and vectors exceeding the 95% confidence levels based on the two-tailed Student’s t-test are shown in (a,b).
Remotesensing 14 05200 g005
Figure 6. Composite daily evolution of precipitation (shade, SI = 1 mm) and 925 hPa wind (vectors, unit: 1.5 ms−1) anomalies during cold surge days (ad) without and (eh) with active QBWO days on (a,e) day −4, (b,f) day −2, (c,g) day 0 and (d,h) day +2, respectively. (il) are the differences between the days when cold surges and the QBWO co-exist and the days of cold surge without the QBWO. Rectangles represent the regions over the EPH (10°–20°N, 120°–135°E) and NBO (5°–12.5°N, 110°–120°E), respectively. Number in the top indicates the composite days. Values and vectors exceeding the 95% confidence levels based on the two-tailed Student’s t-test are shown.
Remotesensing 14 05200 g006
Figure 7. Composite daily evolution of area−mean precipitation over the EPH (10°–20°N, 120°–135°E; left panel) and over the NBO (5°–12.5°N, 110°–120°E; right panel) during cold surge days (a,b) without and (c,d) with the QBWO, respectively. Number in left title indicates the composite days. Values exceeding the 95% confidence levels based on the two-tailed Student’s t-test are shown as oblique lines.
Remotesensing 14 05200 g007
Figure 8. Probability (shade, SI = 2%) of extreme rainfall that exceeds the (upper panel) 90th threshold and (lower panel) 95th threshold during cold surge days (a,d) without and (b,e) with the QBWO, respectively. (c) and (f) are the differences in percent probability between the days when a cold surge and the QBWO co-exist and the days of a cold surge without the QBWO (shade, SI = 1%). Rectangles represent the regions over the EPH (10°–20°N, 120°–135°E) and NBO (5°–12.5°N, 110°–120°E), respectively.
Remotesensing 14 05200 g008
Figure 9. Composite anomalies of precipitation (shade, SI = 1 mm) and 925 hPa winds (vector, unit: 1.5 ms−1) during eight phases of the MJO. Number in top-left represents the composite days in each MJO phase. Values and vectors exceeding the 95% confidence levels based on the two-tailed Student’s t-test are shown.
Remotesensing 14 05200 g009
Figure 10. Same as Figure 5, but during phases 2−4 of the MJO.
Remotesensing 14 05200 g010
Figure 11. Box plots with the 5–95% and 25–75% ranges of rainfall (unit: mm) area−averaged over the EPH ((a) 10°–20°N, 120°–135°E) and NBO ((b) 5°–12.5°N, 110°–120°E) during the days of all cold surges (black), when cold surges co-existed with the QBWO (red), when cold surges occurred without the QBWO (blue), when cold surges co-existed with the MJO (purple), when cold surges occurred without the MJO (green), when cold surges co-existed with both ISO modes (orange), and when cold surges occurred without any ISO modes (brown), respectively. Number in x-axis indicates the composite days.
Remotesensing 14 05200 g011
Figure 12. Two−dimension distribution of frequency (unit: days) and intensity (unit: ms−1) of cold surges during different (a) QBWO phases and (b) MJO phases. Frequencies of cold surges during phases 1–8 and phases 4–5 (phases 2–3 and phases 6–7) of ISO modes should be referred to the values in x-axis (y-axis). Intensity of cold surges is defined as the 925 hPa meridional winds averaged over the South China Sea between 110°E and 117.5°E along 15°N. Different intensities are indicated with dots in different colors and sizes.
Remotesensing 14 05200 g012
Figure 13. (a) The marginal probability distribution (represented as a percentage of cold surge days occurring in an individual ISO mode) of cold surge days in (upper) eight MJO phases and (lower) QBWO phases (shade, unit: %). x-axis represents different ISO phases, and y-axis shows the percentage of cold surge days that fall in each ISO phase. (b) The joint probability distribution (represented as a percentage of cold surge days occurring in both ISO modes) of the cold surge days in different MJO and QBWO phases (shade, unit: %). (c,d) Venn diagrams that represent the percentage (unit: %) of the occurrence of cold surge days in favorable MJO and QBWO phases simultaneously.
Remotesensing 14 05200 g013
Table 1. Composite rainfall anomalies (unit: mm) area−averaged over the EPH (10°–20°N, 120°–135°E) and NBO (5°–12.5°N, 110°–120°E) during the days of all cold surges, when cold surges co-existed with the QBWO, when cold surges occurred without the QBWO, when cold surges co-existed with the MJO, when cold surges occurred without the MJO, when cold surges co-existed with both ISO modes, and when cold surges occurred without any ISO modes, respectively.
GroupEPHNBOGroupEPHNBO
CS2.424.47CS + nMJO2.694.17
CS + QBWO6.445.26CS + QBWO+MJO4.4610.39
CS + nQBWO0.764.14CS + nQBWO+nMJO0.904.36
CS + MJO1.515.48
Publisher’s Note: MDPI stays neutral with regard to jurisdictional claims in published maps and institutional affiliations.