Article

Early Monitoring of Cotton Verticillium Wilt by Leaf Multiple “Symptom” Characteristics

1
Xinjiang Production and Construction Crops Oasis Eco-Agriculture Key Laboratory, College of Agriculture, Shihezi University, Shihezi 832003, China
2
Aerospace Information Research Institute, Chinese Academy of Sciences, Bejing 100101, China
3
University of Chinese Academy of Sciences, Beijing 100049, China
*
Author to whom correspondence should be addressed.
Remote Sens. 2022, 14(20), 5241; https://doi.org/10.3390/rs14205241
Submission received: 3 September 2022 / Revised: 28 September 2022 / Accepted: 14 October 2022 / Published: 20 October 2022

Abstract

:
Early diagnosis of cotton verticillium wilt (VW) and accurate assessment of the disease degree are important prerequisites for preventing the large-scale development of cotton VW. Hyperspectral techniques have been widely used for monitoring the extent of plant diseases, but early detection of VW disease in cotton remains a challenge. In this study, the Boruta algorithm was used to select the key physiological characteristics (leaf temperature, chlorophyll a content, and equivalent water thickness) of cotton leaves at the early stage of VW disease, and then the Relief-F algorithm was used to select the spectral features indicating multiple “symptoms” of cotton VW disease at the early stage. In addition, a new cotton VW early monitoring indicator (CVWEI) was constructed by combining the weights of the new index and related bands using a hierarchical analysis (AHP) and entropy weighting method (EWM). The study showed that the physiological indices constructed under VW stress were better indicators of VW disease than traditional vegetation indices; CVEWI achieved a high accuracy of 95% in the test set, with a Kappa coefficient of 0.89; and the test set R2 was 0.73 and RMSE was 3.15% for monitoring disease severity, compared to the optimal classification constructed using a single spectral index. The results may provide new ideas and methods for early and accurate monitoring of VW and other fungal diseases.

1. Introduction

Cotton is a globally important fiber and oilseed crop. Verticillium wilt (VW) is one of the most widespread and devastating diseases of cotton and is a major obstacle to high yield and quality [1]. The disease is caused by Verticillium dahliae, and there is no effective control method due to the complex pathogenesis and high viability of Verticillium dahliae [2]. Accurate assessment and precise monitoring of the extent of the disease at an early stage of development, so that effective on-farm management measures can be implemented, will help to prevent and control the widespread occurrence of VW, and reduce the economic losses caused by the disease.
The traditional methods of visual diagnosis and laboratory testing in the field are costly, time-inefficient, and often unable to achieve rapid and non-destructive detection over large areas. It has been shown that the selection of vegetation indices (VIs) or the construction of special disease indices (SDIs) for disease-level diagnosis based on changes in pigment, moisture, and other physiological parameters can enable early and refined monitoring of disease levels. Calderón et al. found that chlorophyll fluorescence and the blue ratio (B/BG/BR) were the best indicators for diagnosing early infection in a remote-sensing-based VW monitoring study of olive trees, while the photochemical reflectance index (PRI), chlorophyll, and carotenoid indices detected VW only at moderate infection levels [3]. The Relief-F algorithm, based on the screening of characteristic bands, was used to construct spectral indices for different diseases and severity levels, in which a health index (HI) was established, and showed excellent results in diagnosing the severity of different diseases [4]. However, plant physiological functional traits under different biotic stresses have different driving mechanisms in spectral reflectance [5], and studies on monitoring plant disease levels through existing physiologically relevant vegetation indices (e.g., PRI, NDWI, and NDVI) have revealed that the same variations in vegetation indices under different stresses can affect the accuracy of early disease monitoring. Ref. [6] discovered that the chlorophyll content in leaves has a significant influence on the red-edge index (red-edge). Additionally, the red-edge index is widely used to identify abiotic stress conditions that have a large effect on leaf pigment concentration [7,8] and is less effective for early monitoring of specific biotic stresses. Secondly, empirical spectral disease indices (SDIs), constructed based on spectra, have a limited ability to generalize disease severity to different spatial and temporal contexts. Achieving early and more accurate monitoring of vegetation disease levels therefore requires quantifying the physiological conditions corresponding to specific plant biotic stresses [9,10]. Determining the patterns of changes in relevant physiological traits under specific biotic stress, constructing spectral indices for key physiological traits under disease stress, and establishing disease detection indicators for multiple physiological traits will be an effective approach to achieve early monitoring of specific biotic stresses.
In this paper, the Boruta algorithm was used to select the key physiological trait factors (leaf temperature, chlorophyll a content, and equivalent water thickness) of leaves in the early stage of VW disease onset, and then the Relief-F algorithm was used to optimize the spectral bands sensitive to the key physiological trait factors of leaves at the early stage of VW disease on cotton, and spectral difference ratio indices of chlorophyll a content and equivalent water thickness under VW disease stress were constructed. In addition, a hierarchical analysis (AHP) and entropy weighting method (EWM) were used to combine the weights of the indices and the relevant bands to construct a new index for early monitoring and severity assessment of VW disease on cotton.

2. Materials and Methods

The trial was carried out in the disease field of the Shihezi Institute of Agricultural Sciences (44.33°N, 86.04°E) (Figure 1) with the cultivar Xinlu Early 36, which is susceptible to Verticillium dahliae. The cotton was sown on 28 April 2021, and cultivation was managed as in a normal field. The test plot was divided into two groups, one with healthy cotton plants grown in soil completely free of Verticillium dahliae, and the other with VW-stressed cotton plants grown in soil in which Verticillium dahliae was present.

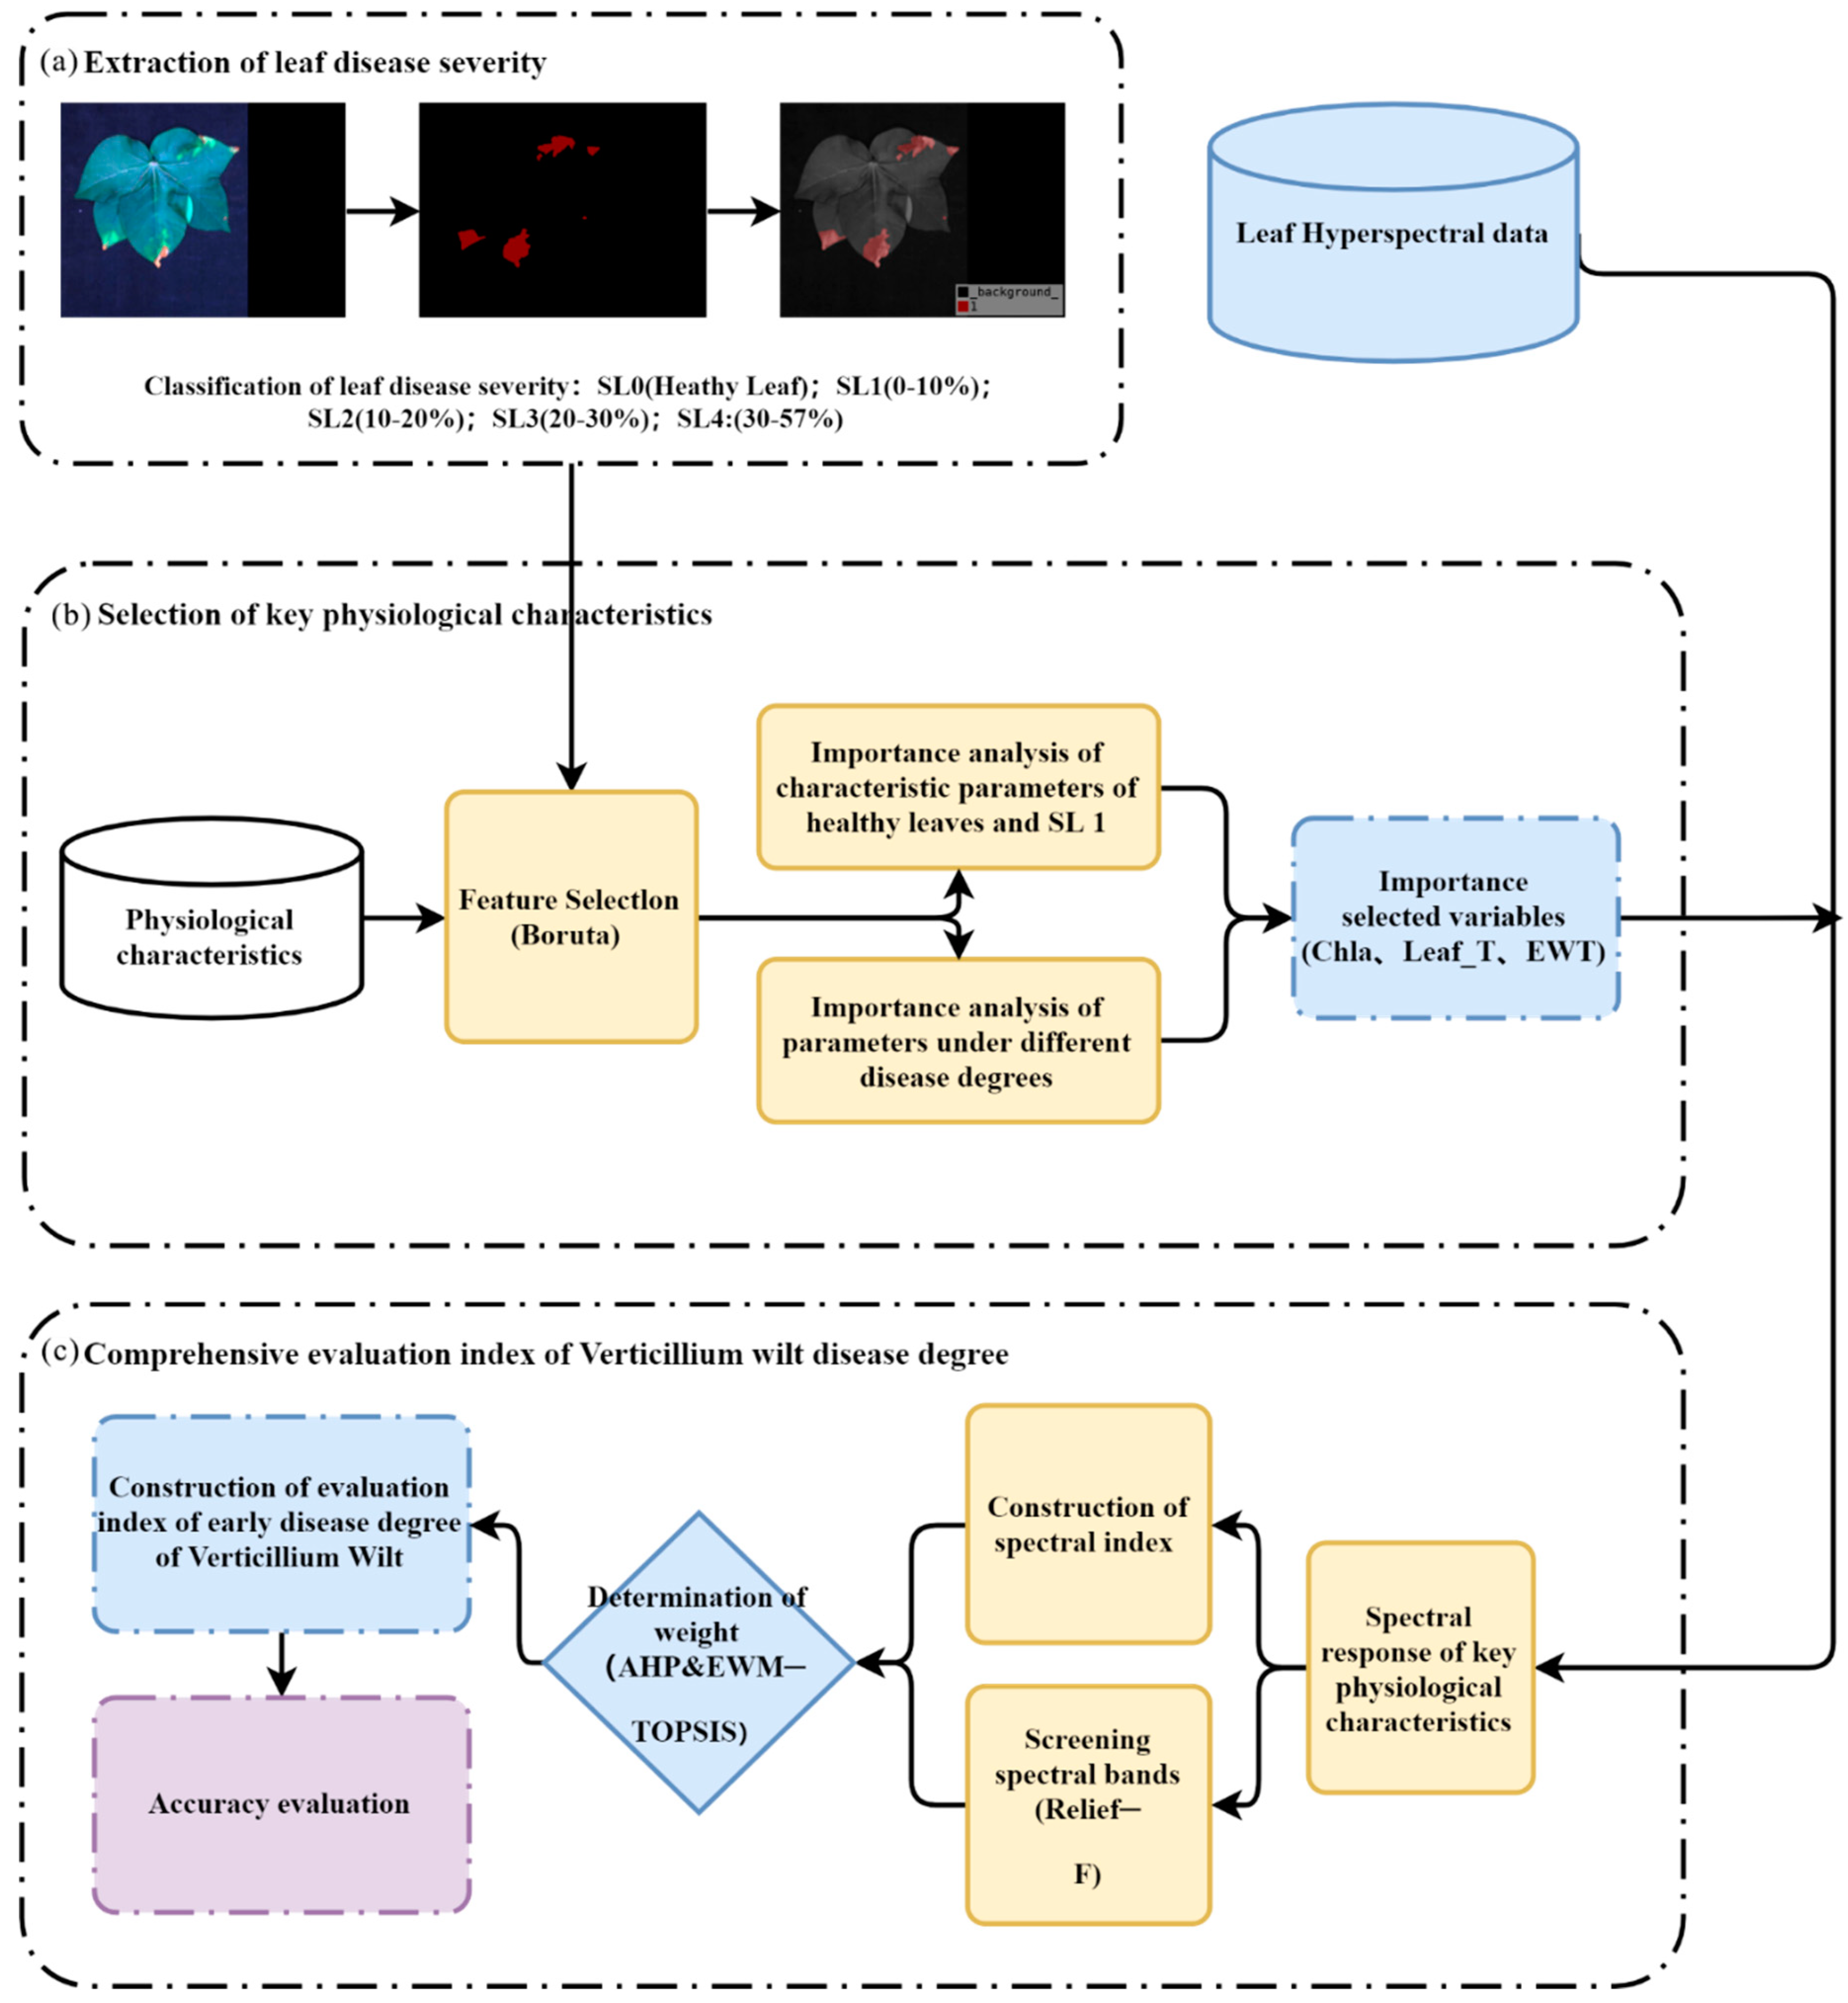
2.1. Method of Classifying the Severity of VW

The disease severity of each leaf was obtained by capturing images of diseased leaves and using the Labelme annotation tool (Labelme is an image annotation software with graphical interface. Its design inspiration comes from: http://labelme.csail.mit.edu/. (accessed on 7 September 2022)) image annotation software to obtain the spot size of VW diseased leaves [11]. In previous studies, the severity of VW in cotton was calculated by increasing the disease by one level for every 1/4 increase in leaf incidence [12], but in order to achieve relatively earlier and more accurate detection of VW stress in cotton, it is necessary to propose a more refined way of classifying the disease level. By the time most of the yellow spots appear on the diseased leaves, there is already extensive colonization by the VW fungus, causing leaf necrosis and wilting and abscission, which in turn severely damage the photosynthetic system of the leaves and provide little photosynthetic product for the cotton [13,14]. In this paper, cotton leaves with a leaf disease level of essentially 50% or less were selected and classified into four classes (Table 1), with SL0 being healthy cotton leaves, and SL1–SL4 being classified according to a 10% increase in severity of the disease spots (Figure 1B).

2.2. Method for the Determination of Leaf Reflectance Spectra

The sampling dates for this study were 12, 18, and 25 August 2021. From 12:00–16:00 Beijing time on a sunny and cloudless day, spectral data of healthy and VW-stressed cotton leaves were collected. The spectral data (350–2500 nm) of healthy and VW-stressed cotton leaves were measured using a Spectral Evolution SR-3500 portable geophysical spectrometer (USA), with the spectrometer’s own built-in light source and leaf clips for in vivo acquisition. The data were collected by avoiding the cotton leaf veins and measuring five locations per leaf, with the average of five replicates per location used to calculate the spectral value for this location. The spectral data were corrected before and after each measurement using the standard version.

2.3. Determination of Physiological Parameters of Cotton Leaves

We carried out biochemical measurements on cotton leaves that had been spectroscopically determined and established the chlorophyll (Cab), carotenoids (Car), equivalent water thickness, and dry matter mass of the leaves by the destruction method.
Determination of chlorophyll (Cab) and Car content: After weighing the diseased leaves fresh, 0.10 g of symmetrical parts on both sides of the main leaf veins were taken from the middle of the leaf proper, and cut and placed in a stoppered graduated test tube. The leaves were extracted with 25 mL of a mixture of acetone, ethanol, and water (4.5:4.5:1), left to stand at room temperature under shade until the samples were completely white, and measured using a 722 GN spectrophotometer. Absorptions at 470, 644.8, and 661.6 nm were measured using a spectrophotometer to obtain chlorophyll a (Chla), chlorophyll b (Chlb), and carotenoid Car [15,16].
Cotton leaves were weighed to obtain their fresh weight, then placed in an oven at 105° for 30 min, dried at a constant temperature of 95° to a constant weight, and then the dry weight of the leaves was determined. Equivalent water thickness is the ratio of leaf water content to leaf area [17].
EWT = ( FW DW ) / A ,
where FW is the fresh weight of the leaf, DW is the dry weight of the leaf (g), and A is the area of the leaf (cm2).
Leaf temperature: parameters such as leaf temperature (Leaf_T) (°C) and leaf thickness (Leaf_Thickness) of live cotton leaves were determined using a handheld MultispeQ (Beta) device connected to the PhotosynQ platform (www.photosynq.org, accessed on 16 April 2021) [18].

2.4. Screening of Key Physiological Characteristics of Cotton Leaves under VW Stress and Construction of a Spectral Index of Multiple “Symptom” Characteristics

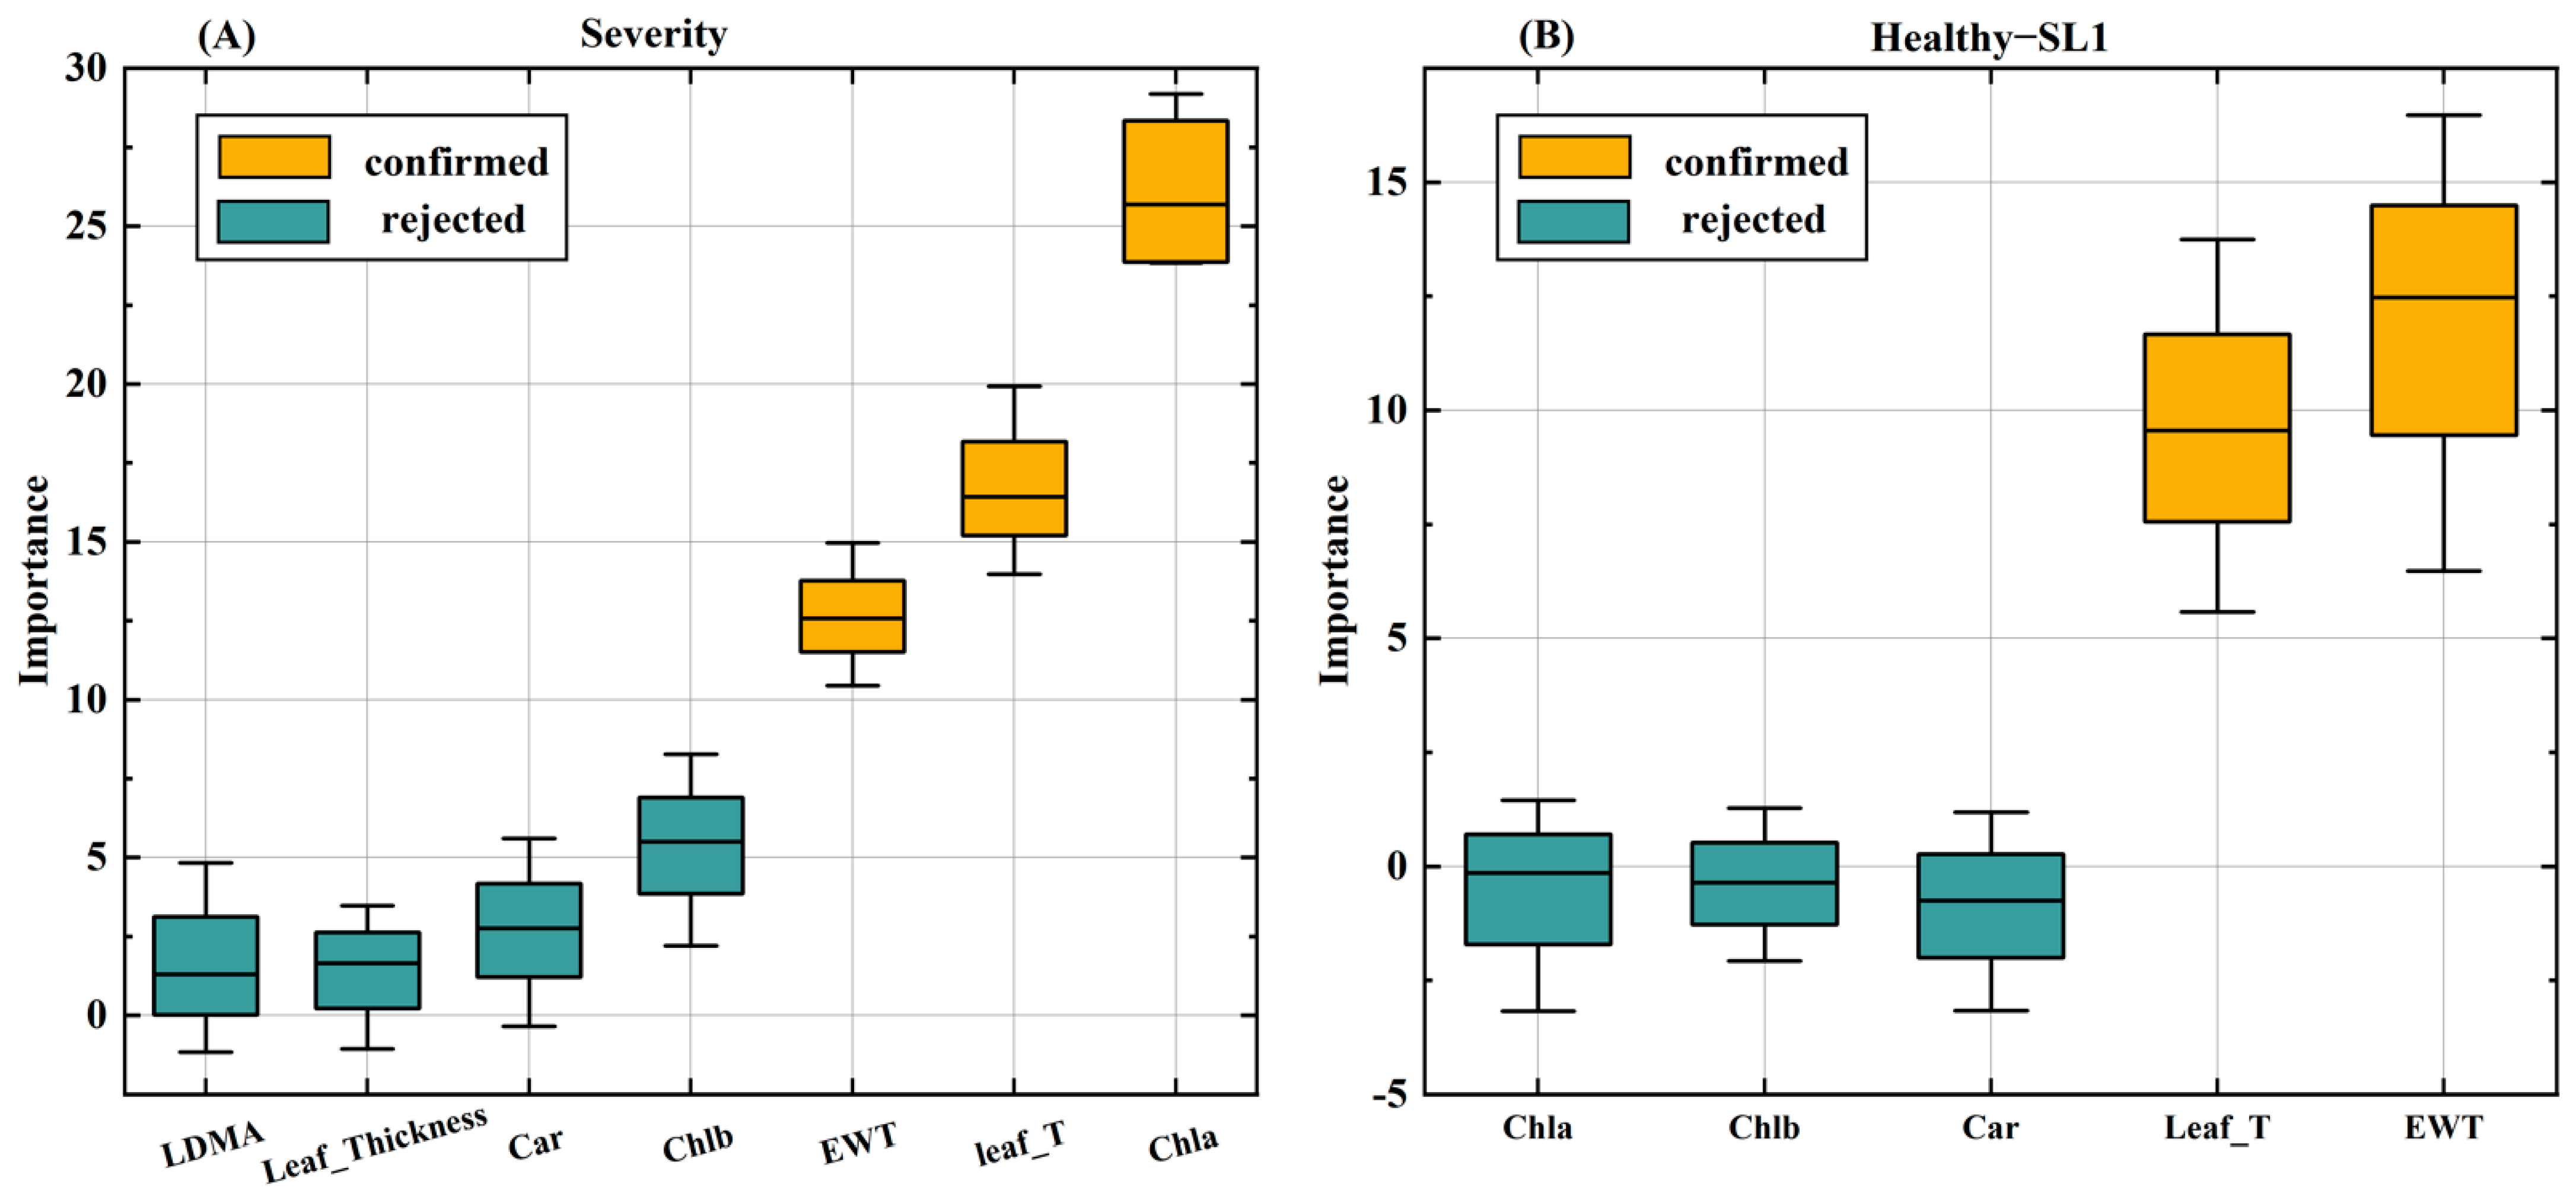
2.4.1. Screening Methods for Key Physiological Traits

The physiological characteristics of cotton leaves were analyzed to investigate the changes in these characteristics under different severities of disease. The key physiological trait factor screening method was a Boruta algorithm based on a wrapper of the random forest classification algorithm [19]. This is an integrated approach to classification through multiple unbiased weak classifiers and decision tree voting. The Boruta algorithm iteratively evaluates the importance of each original variable relative to the shaded variables to determine which variables are necessary and what their importance is. Variables are marked as rejected when they are significantly lower than shaded and are permanently discarded, while variables that are significantly higher than shaded are marked as confirmed. We set the number of iterations to 200 to determine the importance score for each feature and obtained the importance of each physiological feature in the severity and morbidity classification process.

2.4.2. Construction of a Spectral Index of Multiple “Symptom” Characteristics

A new spectral index for Chla and EWT under disease stress was developed using the construction of a differential ratio index based on a theory that considers radiation, scattering, and absorption by plant leaves. When radiant energy hits the leaf, part of it is reflected by the leaf surface, and the rest enters the leaf and is scattered by the leaf flesh structure. Internal scattering is also absorbed by leaf biochemicals at different wavelengths. The analytical relationship between leaf reflectance and chemical content then requires the elimination of the scattering effect of the leaf structure and the exclusion of other biochemical absorptions for specific wavelengths. The difference ratio index (DRI) is the ratio of the difference between the reflectance factors of three different wavelengths. We therefore took the ratio of the reflectance difference between a sensitive wavelength (Rλ1) and two other reference bands (Rλ2, Rλ3). The sensitive and reference wavelengths for Chla and EWT were obtained using the Relief-F algorithm and exhaustive screening. The Relief-F algorithm estimates the correlation based on how good the wavelengths are; it is able to correctly estimate the quality of strongly correlated features and is robust to outliers. An exhaustive search of the two reference wavelength ranges was carried out to obtain the optimal wavelength combination to invert the physiological characteristics of cotton leaves under VW stress.
DRI = R λ 3 R λ 1 R λ 3 R λ 2 ,
where Rλ1 represents the sensitive wavelength of the key physiological indices (chlorophyll a and equivalent water thickness) of cotton leaves under VW stress screened by the Relief-F algorithm, and Rλ2 and Rλ3 are the reference bands. The subscripts λ1,λ2, and λ3 refer to wavelengths.

2.4.3. Classic Vegetation Index

In order to compare the sensitivity of the newly constructed cotton physiological spectral index under VW stress with the classical vegetation indices (VIs) and VW disease severity, nine typical VIs were selected, including the normalized difference water index (NDWI), disease stress water index (DSWI1, DSWI2), healthy index (HI), red-edge chlorophyll index (Red_edge), photochemical reflectance index (PRI), and pigment-specific simple ratio (PSSRa, PSSRb, PSSRc) (Table 2).

2.5. Methodology for the Development of Early Monitoring Indicators for VW in Cotton

In this study we developed early detection indicators for multiple “symptom” characteristics of cotton VW based on a combination of AHP and EWM evaluation of superior and inferior solution distances. AHP is a method of dividing a final target into factors and indicators, forming a hierarchy of indicators at different levels according to the hierarchy, using this to construct a weighting matrix, and finally deriving the target results from the bottom up. The EWM uses the information entropy of data to describe the concept of the degree of variation of data indicators. According to the basic theory of EWM, the greater the numerical variation of data indicators, the greater the dispersion of the indicators, and the greater the impact on the comprehensive evaluation results, i.e., the corresponding weight value is higher. Objective data adjudicate indicator weights, and since both AHP and EWM are calculated by first obtaining the indicator weights and then evaluating the weight targets, the two weight evaluation methods can be integrated.
The principles of AHP and EWM used in this paper were based on the spectral indices and characteristic bands constructed from the important physiological characteristics of cotton under VW stress as disease evaluation indicators, the degree of difference between the two weighting methods, and the combined evaluation method of the superior Technique for Order Preference by Similarity to an Ideal Solution (TOPSIS). AHP will output the weight values of m disease evaluation factors based on disease severity through a random forest machine learning model, WAHP. AHP uses a random forest model to combine the m disease evaluation factors’ weights (WAHP) and the m disease evaluation factors’ weights (WEWM) are calculated by the entropy weighting method as two m-dimensional vectors. The specific calculation formula is:
W i = W AHP _ i × W EWM _ i 1 2 1 n W AHP _ i × W EWM _ i 1 2 .
We construct a weighted decision matrix based on the extremum method dimensionless matrix Z with the combined weights Wi:
Z = ( Z ij ) n × m = Z 11 Z 1 m Z n 1 Z nm .
Then we determine the positive and negative ideal solutions for the index. Let Z+ denote the positive ideal solution, i.e., the best solution, and Z denote the negative ideal solution, i.e., the worst solution. Then, we calculate the distance and closeness of each scenario to the positive and negative ideal solutions:
D i + = j = 1 m W j Z ij Z j + 2 D i = j = 1 m W j Z ij Z j 2 .
Finally, the closeness of each evaluation scheme to the positive and negative ideal solutions can be obtained from the distance to the positive and negative ideal solution as:
C i = D i / D i + + D i .
In the formula, when Ci tends to 1, the cotton’s VW condition is more serious; conversely, when Ci tends to 0, the cotton is healthier, and the severity of its cotton VW can be judged by this value.

2.6. Development of Remote Sensing Indicators for Early VW Monitoring of Multiple ‘Symptoms’ of Cotton

The flowchart shown in Figure 2 illustrates the experimental methodology of this study, including the acquisition of cotton leaf disease levels, the selection of key physiological traits, the construction of a physiological spectral index for cotton leaves under VW stress, and the development of a VW early detection index for cotton with the fusion of multiple physiological traits.

3. Results

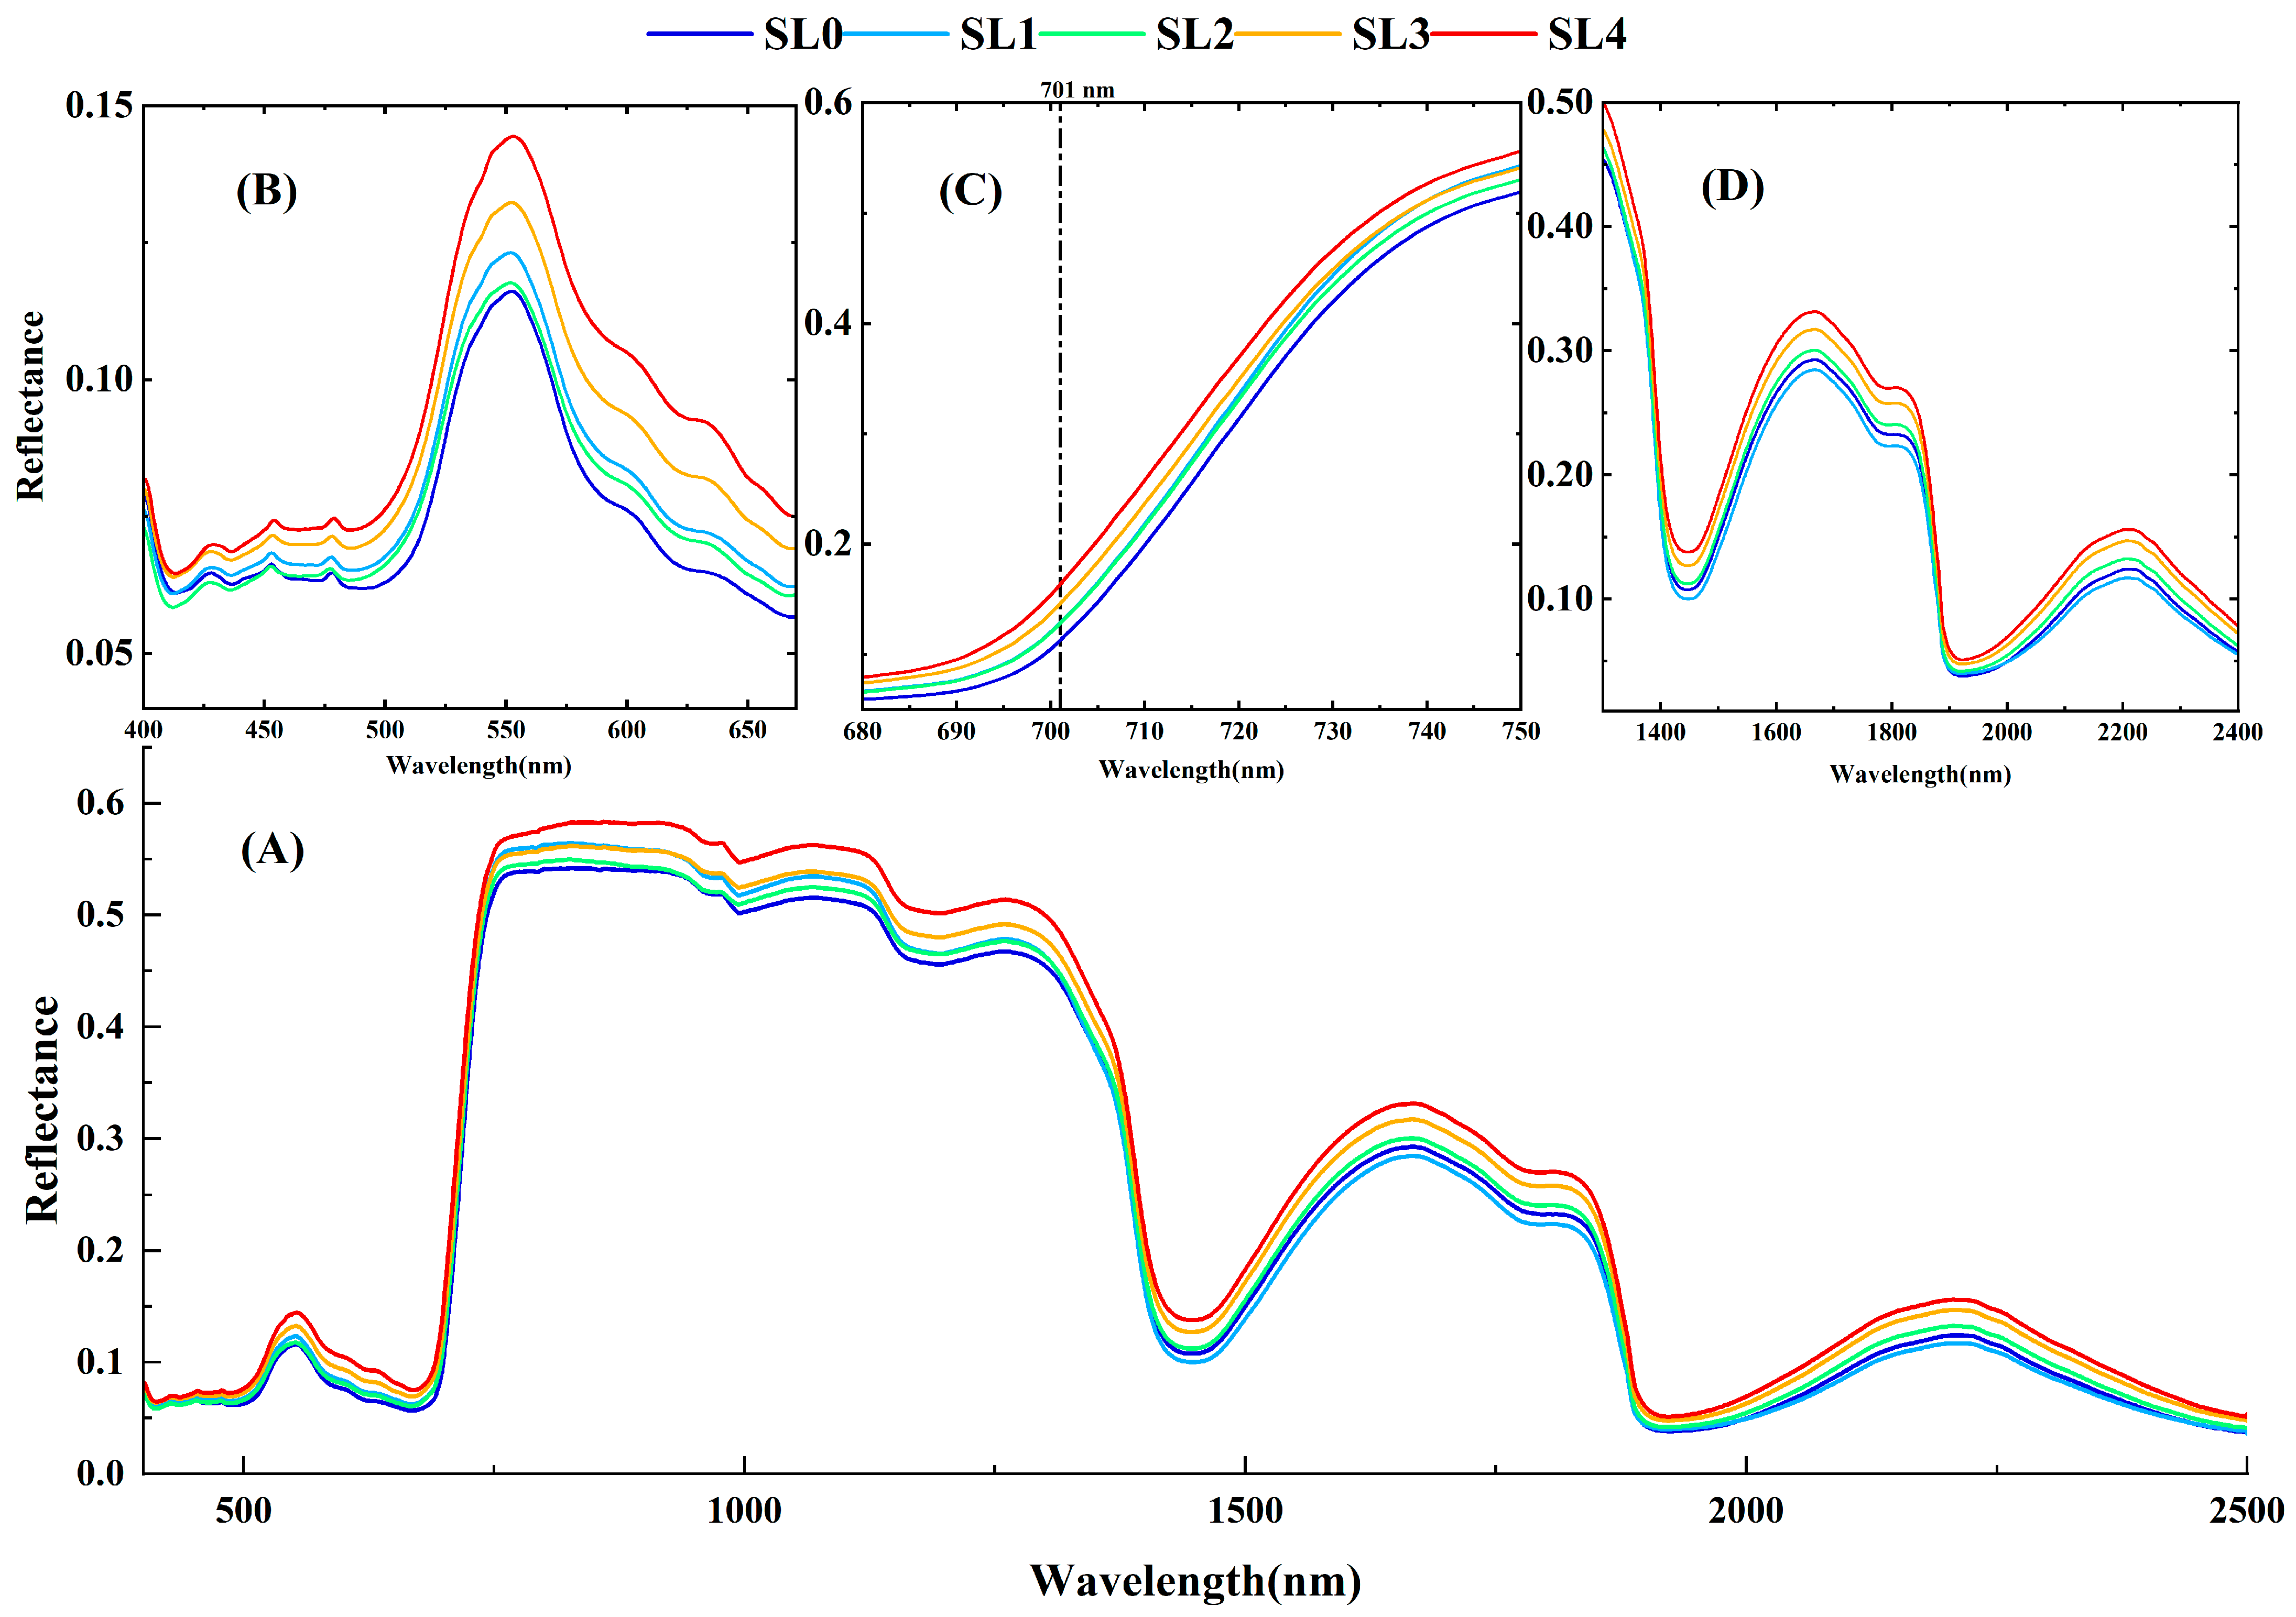
3.1. Spectral Characteristics of Cotton VW Leaves under Different Disease Levels

The overall spectral reflectance of cotton leaves showed an increasing trend with increasing VW disease (Figure 3A), a pattern that was generally consistent with previous studies [12,25]. In the visible wavelength range (400–760 nm) (Figure 3B,C), the red edge of the reflectance of diseased leaves (around 700 nm) showed a blueshift compared with healthy leaves, and the blueshift trend became more obvious with the increase in the degree of disease, which was highly correlated with the changes in multiple physiological characteristics of cotton leaves after VW stress. The spectral reflectance of SL1 varied according to the finer classification of the disease level, with the spectral reflectance of SL1 being higher than that of SL2 in the visible band, especially around 550 nm (Figure 3B). The physiological and biochemical changes in cotton leaves under VW stress were highly correlated, and the reason for the decrease in the spectral reflectance of SL1 in the SWIR region may be due to the significant difference in the EWT of SL1, which was higher than that of SL0 (Table 2). In the early stages of VW stress, the larger leaf veins of the leaves were still working, and water was confined to the parenchymal tissues of the veins, which kept the water from swelling, thus causing the cotton leaf water content to increase. There was an increase in the water content of cotton leaves when the disease was less severe [26].

3.2. Effect of Different Disease Levels on Physiological Indicators of Cotton Leaves

The physiological characteristics of cotton leaves under different disease stages were analyzed by obtaining changes in physiological parameters (leaf pigment, water content, dry matter weight, and leaf temperature) under different VW disease stages, and then the distribution of physiological parameters at different stages was displayed using box-line plots (Figure 4). Leaf_T was positively correlated with VW severity and negatively correlated with EWT, Chla, Chlb, and Car, while leaf thickness and dry matter mass (LDMA) were not significantly correlated with VW severity (Figure 4B,C). As shown in Table 1, we found an increasing trend in EWT followed by a decreasing trend under the fine disease severity classification (Figure 4A), with a significant (p < 0.05) 0.02 g/cm2 increase in EWT between healthy leaves and SL1, followed by a decreasing trend from SL1 to SL4, showing significant differences between all of the levels from SL1 to SL3; Chla showed a significant difference between SL0 and SL1; Chlb and Car showed no significant trend; Chlb had a significant decreasing trend between SL1 and SL2 but no significant difference between SL2 and SL3; and the lowest performance was in SL4 (Figure 4E). Car only showed a significant difference between SL2 and SL3, while dry matter mass and leaf thickness varied insignificantly overall and were not significantly different. Changes in plant temperature have been considered an effective feature for the early monitoring of disease. In this trial, Leaf_T was found to show significant differences at different disease levels, especially between healthy leaves and SL1 in the pre-disease period (p < 0.01).
As with the results of the analysis of variance, the best variables screened by the Boruta algorithm for monitoring the degree of VW disease leaf stress in cotton (Figure 5) were EWT, Chla, and Leaf_T. At different severities of VW in cotton leaves (Figure 5A), the most important variables were Chla, Leaf_T, and EWT—in that order. Between healthy leaves and slight degrees of VW (SL1) (Figure 5B), EWT was the most useful trait factor, followed by Leaf_T. However, Chla, which was the most useful trait factor at different severities, was not useful for monitoring slight degrees of VW, indicating that it is difficult to determine whether cotton leaves are under VW disease stress by pigment content alone in the early stages of the disease.

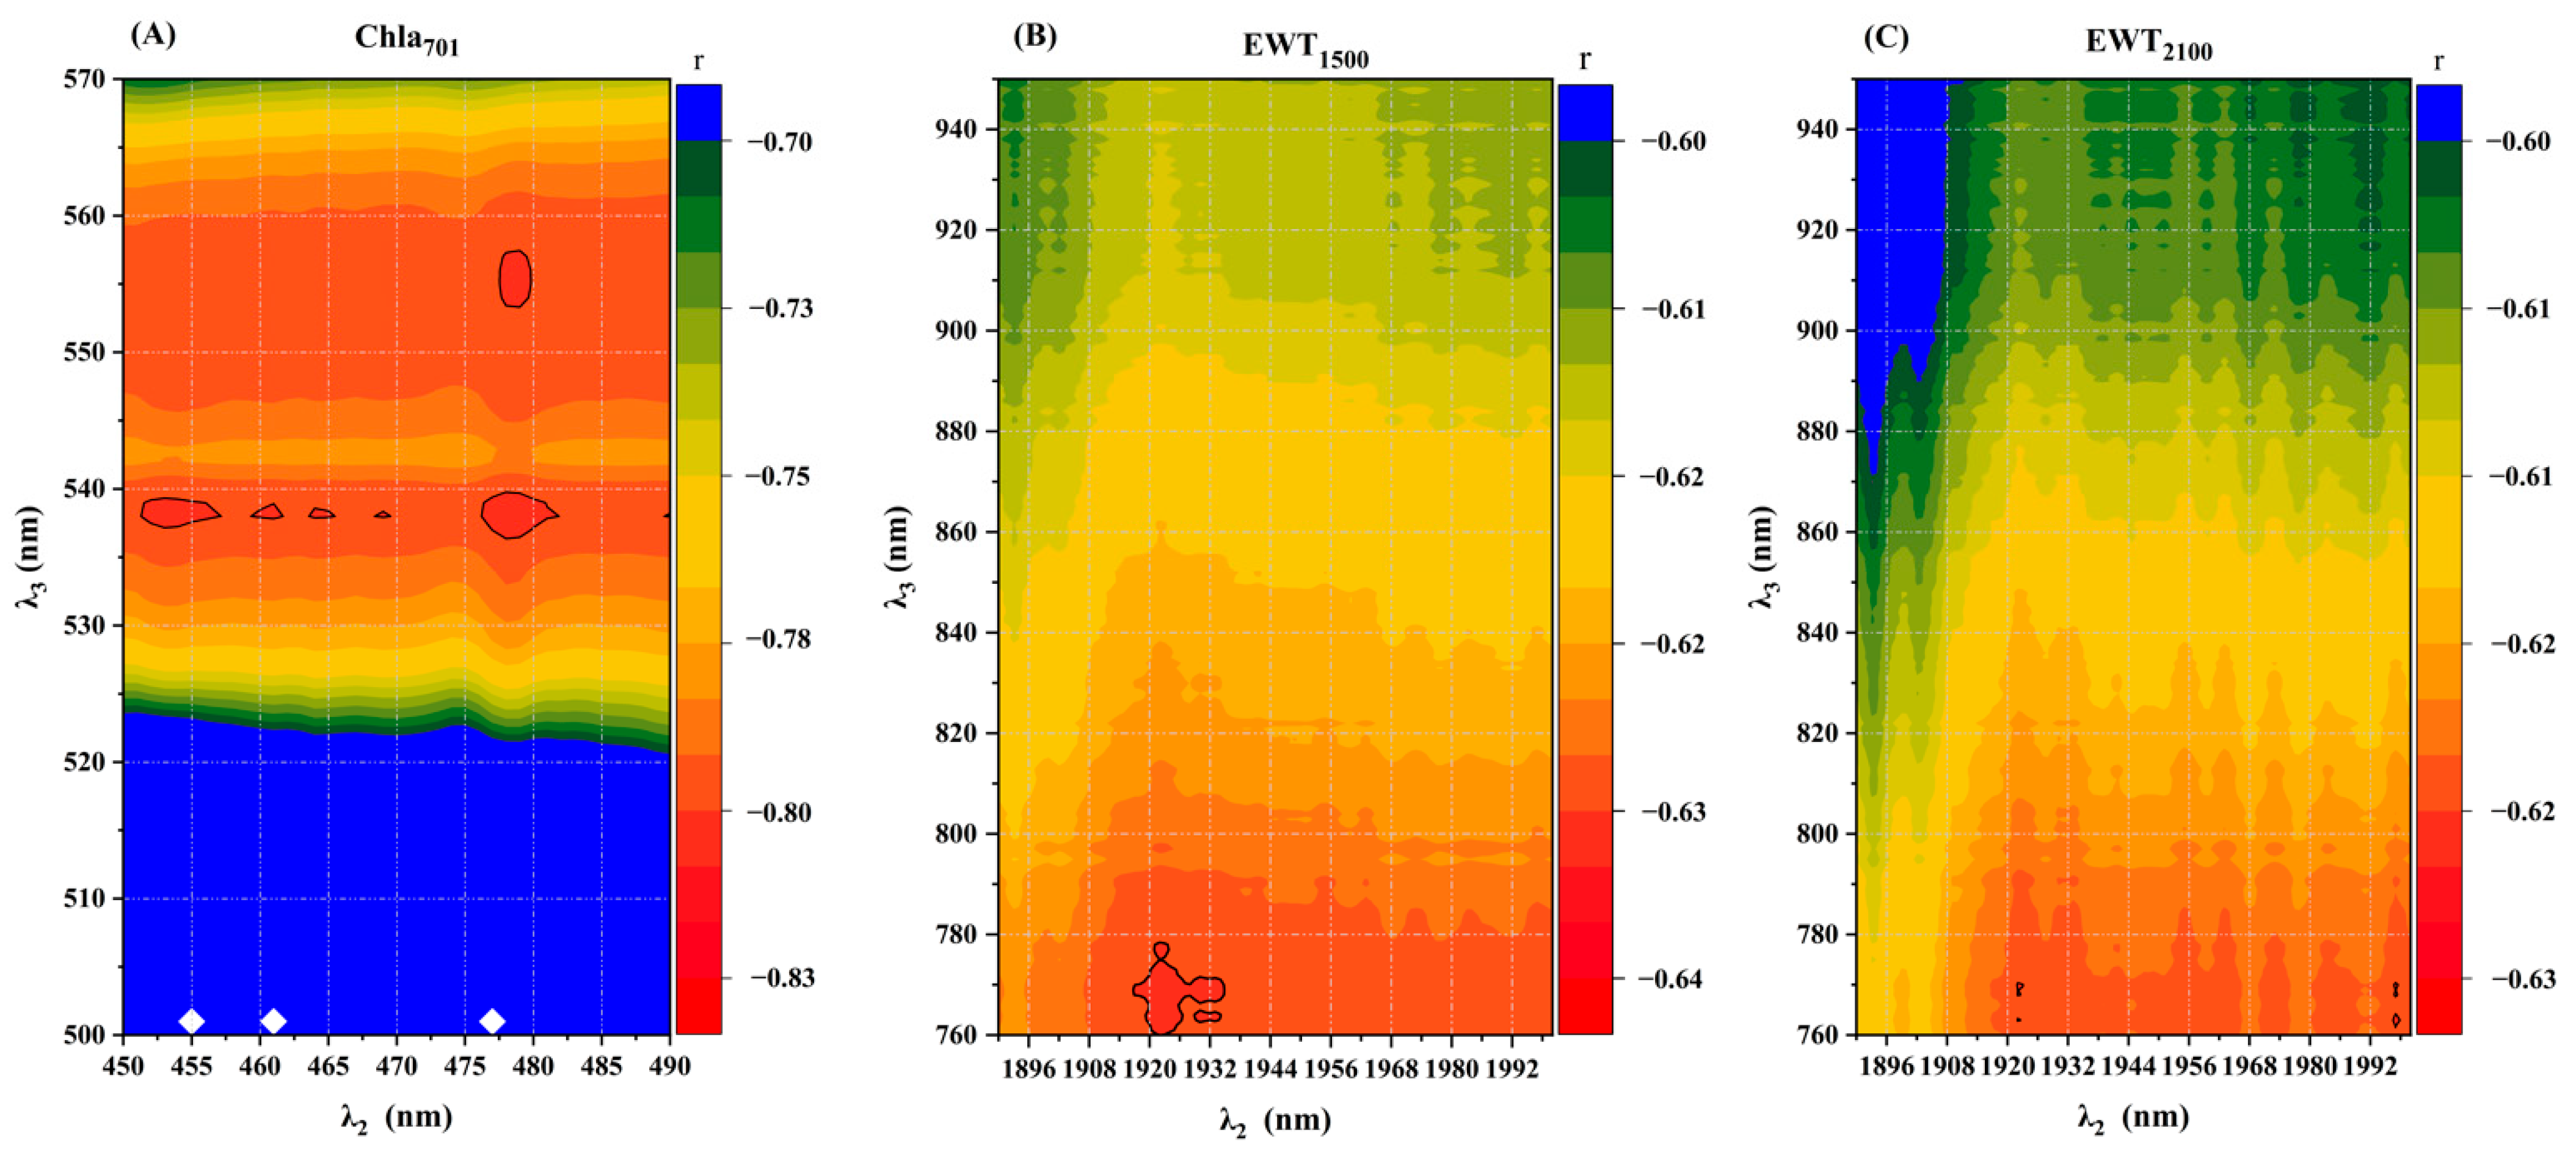
3.3. Selection of Characteristic Bands and Construction of Spectral Indices

To achieve VW disease monitoring in cotton with multiple physiological characteristics, the sensitive wavelengths were screened using the Relief-F algorithm for the abovementioned physiological indicators that were significantly related to the degree of disease and the spot size of diseased leaves, as shown in Figure 6, which resulted in single wavelengths around 701 nm, 1425 nm, and 1892 nm that were highly correlated with cotton leaves affected by VW (Figure 6A). We further evaluated the most relevant individual wavelengths and wavelength differences in the spectra of Chla, EWT, and Leaf_T using the Relief-F algorithm, with single peaks noted at 701 nm for Chla (Figure 6B), and 1405 nm, 1500 nm, 1855 nm, and 2100 nm for EWT, while single peaks at 760–950 nm in the near-infrared band and around 1920 nm as the insensitive band were also found (Figure 6C). Leaf_T, a key factor in our early disease monitoring, was highly sensitive to the stretching and bending of OH bonds in plant leaves, mainly in the NIR–SWIR range, and in this band range, 701 nm and 1610 nm were selected as the main sensitive bands in this study (Figure 6D).
The spectral indices of Chla and EWT under disease stress were constructed based on the theoretical consideration of plant leaf radiation, scattering, and absorption. As shown in Figure 6, we selected the sensitive and reference bands for Chla and EWT, respectively. For Chla, we identified 701 nm as the sensitive wavelength, and in addition, selected 500–570 nm as the green reflection peak of the leaf with the least absorption in the visible band as the reference band (Rλ2), and a second reference band (Rλ3) at 450–492 nm. This band range was the main strong absorption region of Car. For EWT, we identified 1500 nm and 2100 nm as sensitive wavelengths, the NIR reference band at 760–950 nm, and the second reference band around 1890–2000 nm. The range 760–950 nm indicated the highly reflective region of the blade, where reflection and scattering from the blade were influenced mainly by the blade surface and internal structure, and this range was not the main absorption band for moisture. At around 1920 nm, this reflection region was mainly influenced by scattering from the blade surface.
As shown in Figure 7, the optimal wavelength Rλ3 was 538 nm for Chla 500–570 nm and 478 nm for EWT 450–492 nm, with a correlation coefficient of 0.81. The correlation coefficient for EWT1500 was 765 nm at 760–950 nm and 1922 nm at 1890–2000 nm, with a correlation coefficient of 0.66. The EWT2100 was 770 nm at 760–950 nm and 1922 nm at 1890–2000 nm, with a correlation coefficient of 0.66. The correlation coefficient with the degree of disease was 0.62.
To evaluate the quantitative relationship between the physiological spectral indices and physiological parameters of cotton leaves under newly constructed VW stress, we used the dataset of diseased leaves to construct linear models of relevant physiological parameters for the three newly constructed spectral indices and the existing classical vegetation indices (Figure 8). Among them, the performance of EWT1500 (R2 = 0.70, RMSE = 0.02) and EWT2100 (R2 = 0.70, RMSE = 0.01) in evaluating EWT was better than that of DSWI1 (R2 = 0.70, RMSE = 0.10) and DSWI2(R2 = 0.46, RMSE = 0.23), and the performance of Chla701 (R2 = 0.42, RMSE = 0.11) in evaluating Chla was better than PSSRa (R2 = 0.09, RMSE = 0.71). These results indicate that the newly constructed physiological spectral index could more accurately represent the variation in the physiological characteristics of cotton leaves under VW stress. In addition, the leaf temperature sensitive wavelength of 1610 nm screened by the Relief-F algorithm also has a good quantitative relationship with the leaf temperature under VW stress (R2 = 0.35, RMSE = 0.23), which can reflect the temperature change in cotton leaves under VW stress (Figure 8G).
Compared to the classical spectral indices constructed by previous authors, the newly constructed physiological spectral indices under VW stress were more correlated with disease severity (Table 3). Under disease stress, a combination of multiple physiological changes in the leaf are affected, and the spectral reflectance is also affected by multiple factors. For early and accurate monitoring of VW, it is necessary to construct spectral indices of relevant physiological parameters for specific spectral changes of VW to achieve accurate early monitoring of VW.

3.4. Constructing Early Monitoring Indicators for VW in Cotton Based on AHP and EWM

Combined with the spectral indices related to physiological characteristics constructed under disease stress (EWT1500 = (R770 − R1500)/(R770 − R1922), EWT2100 = (R765 − R2100)/(R765 − R1922), Chla701 = (R538 − R701)/(R538 − R478)) and the relevant characteristic wavelengths 1425 nm, 1892 nm, and 1610 nm (with Leaf–T sensitive bands) screened by Relief-F, the subjective and objective weights of each parameter were determined by AHP and the entropy weight method (Table 4) to construct the cotton VW early monitoring indicator (CVWEI). Table 4 shows the comprehensive weights of each parameter: the weights from high to low were Chla701 > EWT1500 > EWT2100 > R1892 > R1610 > R1425. The constructed physiological spectral index occupies most of the weight, which proves that key physiological indicators play an important role in the early monitoring of VW, and it also proves that changes in multiple physiological characteristics need to be combined for accurate disease monitoring.
Based on the evaluation model of the TOPSIS method, the constructed physiological spectral indices Chla701, EWT1500, DSWI1, HI, and CVWEI, which performed best under VW stress in cotton, were used as model inputs and the corresponding disease severities were used as outputs (Table 5). The data were divided into a training set (n = 100) and a test set (n = 41) at a ratio of 2:1. The evaluation indices obtained ranged from 0 to 1, with values closer to 0 indicating healthier cotton leaves and those closer to 1 indicating that the cotton leaves were approximately severely stressed by VW. A threshold value of 0.2 was determined to distinguish healthy from diseased leaves (Figure 9). We focused on comparing CVWEI based on the fusion of multiple “symptom” features, and the quantitative relationship between the single spectral index, Chla701, with the best VW correlation and the disease degree (Figure 9). The results confirmed the excellent performance of CVWEI in evaluating early VW. Compared with Chla701, CVWEI exhibits a more obvious boundary between health and VW stress at 0.2 (Figure 9).
The results show that the HI-based classification of healthy and diseased leaves had the worst accuracy of 66%, with a Kappa coefficient of 0.19, while the CVWEI-based classification had the best accuracy of 99%, with a Kappa coefficient of 0.92. The DSWI1-based VW severity monitoring model had the worst R2 of 0.31 and RMSE of 12.50%, while the CVWEI-based monitoring model had the best R2 of 0.65 and RMSE of 8.17% (Table 5). The classification accuracy of healthy leaves and diseased leaves was CVWEI > EWT1500 > Chla701 > DSWI1 > HI, and the accuracy of the cotton VW severity monitoring model was CVWEI > Chla701 > EWT1500 > HI > DSWI1. The accuracy of the VW early detection index was higher.

4. Discussion

In this study, we first identified key physiological response trait factors of cotton leaves under early VW stress. In our approach to the division of disease levels, focusing on the ability of each physiological trait to discriminate between different levels of severity, we found significant variations in EWT and Leaf_T in mildly diseased leaves. In contrast, as the disease severity increased, Chla presented the most critical character variable, followed by EWT and Leaf_T. The reason for this pattern is that during the early stages of VW stress in cotton, the leaves effectively allow leaf tissue to conserve water and maintain cell expansion by closing the stomata [27], thereby slowing water loss; in addition, during VW, in the early stages of stress, the larger veins of the leaf are still working and water is confined to the parenchymal tissue of the veins, maintaining water swelling and therefore causing an increase in the water content of the cotton leaves when the disease is less severe [26]. As the disease progresses, the cotton ducts become severely clogged, resulting in the cotton leaves being unable to retain water, the water content decreasing dramatically, and the leaves becoming flaccid. The pigment content is not degraded until after VW has developed, with Chla being degraded preferentially over other pigments and showing visible symptoms on the leaves [28], so the pigment content contribution is minimal during the mild stage of the disease. When disease severity increases and yellow spots are evident on the leaves, the concentration of Chla decreases significantly, while the other pigment concentrations (Chlb, Car) only show a significant decreasing trend when disease severity reaches 20%, with Chla being more sensitive to VW disease stress compared to the other pigment contents. Changes in plant leaf temperature and fluorescence parameters have been considered effective features for early disease monitoring compared to physicochemical parameters such as leaf water content, pigment content, and biomass [29], and biological parameters such as chlorophyll content and water content do not cause changes in physiological traits over a short period of time [30,31]. These changes are often the cumulative effect of a period of physiological stress on the vegetation and do not reflect the true changes in physiological stress in a timely manner, whereas chlorophyll fluorescence parameters and leaf temperature are more indicative of photosynthetic physiological activity in leaves during the early stages of disease stress [3,32,33]. The Boruta algorithm verified that leaf temperature is the key physiological variable in the early stages of disease stress, which is consistent with previous studies that showed that early disease stress affects photosynthesis in leaves, and that pathogenic toxins cause distortion of the cystoid system, increase heat dissipation, and lead to disruption of the photoresponse center [13].
Another important aspect of this study was the construction of the spectral index of key physiological characteristics under VW stress. Achieving early and accurate monitoring of specific biotic stresses requires the incorporation of multiple physiological traits caused by diseases, and leaf spectral reflectance can be used as a high-throughput phenotypic signal for leaf- and canopy-scale physiological traits. The extraction of changes in these physiological functional traits from leaf reflectance spectra can be used as an important tool to achieve early detection of crop biotic stress and accurate monitoring of disease severity [34,35,36]. The sensitivity of detecting vegetation-related physiological traits can be significantly improved by simple VIs, but each vegetation index has its own specific vegetation expression, specific uses, and other limitations [37]. The physiological spectral indices constructed by using the response characteristics on spectral reflectance, the characteristic bands screened with the Relief-F algorithm, and the difference ratio values were significantly correlated with the severity of VW disease in the early stages. We found that the 700 nm vicinity exhibited higher weights with disease severity, Chla, and Leaf_T. This is consistent with previous studies that found that the vicinity of 700 nm is a balance between biochemical and biophysical properties of the plant, causing a blueshift in the position of the red edge when the plant is under stress, and therefore providing early detection of most stresses in plants [4,38,39]. We chose 1500 nm and 2100 nm as the characteristic moisture-related wavelengths. The wavelengths at 1150–1500 nm and 2100–2300 nm are the main water absorption regions and are less affected by structure at the canopy scale. Indices constructed in this way have a better generalizability, and our study confirmed that the correlation with the degree of disease was significantly higher than that for the original water stress-related indices. Notably, we also screened for characteristic bands in the NIR band that are sensitive to leaf temperature in the 1400–1900 nm range, mainly in respect of OH-bond stretching and bending [40]. Khan et al. selected bands that are highly correlated with temperature (697, 1400 nm). The model constructed by Khan et al. for the inversion of leaf temperature in the highly temperature-dependent bands (697, 1400, 1507, and 1531 nm) has excellent accuracy [41]. Combining the sensitive bands of Leaf_T will help to improve the accuracy of early detection of VW in cotton. Ultimately, compared to individual physiological spectral indices, our constructed multi-physiological feature fusion for early detection of VW can more accurately classify healthy and VW-stressed leaves, and monitor the degree of disease in VW with higher accuracy. In this study, hyperspectral technology was used to invert various “symptom” characteristics of early cotton leaves infected by verticillium wilt so as to accurately judge the infection of these leaves [42]. In contrast to traditional visual inspection, this method does not require experienced professionals to detect mass disease. At the same time, we can effectively detect early cotton VW through CVWEI, help managers prevent large-scale diseases in advance, and reduce the economic losses caused by VW. In addition, compared with the image detection technology of RGB cameras, hyperspectral data have the characteristics of high resolution and strong continuity [43], and can be used to detect the physiological changes in cotton leaves caused by verticillium wilt in a more targeted manner, which may help us to more effectively and accurately detect cotton leaf infestation with VW at an earlier stage. Although image detection exhibits a good performance in the identification of lesions, the latest research uses RGB images to automatically detect plant diseases [44] and can detect diseases that have just appeared as lesions. However, this research does not consider the disease type, which means that it is not possible to determine whether a disease is caused by a specific biotic or abiotic stress. This study will also help us to devise a more reliable classification for cotton verticillium wilt disease severity. The current disease classification method mainly defines the classification standard according to the proportion of “verticillium wilt” symptom areas on leaves, which is at odds with the cotton yield and cannot accurately reflect the actual incidence of verticillium wilt [12]. The disease index proposed by us, combined with the performance of cotton physiological indicators, will be more conducive to establishing a disease degree detection model related to cotton yield in the future and formulating a more reasonable disease classification method, which is convenient for large-area remote sensing monitoring and effectively controls verticillium wilt occurrence and development. The limitation of this study is that spectral data were collected by measuring five locations on each leaf, which may result in missing spectral information in some locations on cotton leaves, resulting in a decrease in monitoring accuracy. As an information acquisition technology that integrates image processing and spectroscopy, imaging spectroscopy can not only allow us to visually observe the spatial information of the image, but also to obtain the spectral information of each pixel of the target [45]. In order to further improve the detection accuracy of the disease degree, spectral imaging technology can be used to fuse the spatial and spectral information of leaves under VW stress to enhance their ability to express multiple types of “symptom” characteristic information caused by disease. Spectroscopic studies at the leaf level provide a basis for understanding the interaction between plants and reflected radiation, and can be extended to the canopy level for disease detection [46,47], but at the canopy scale, VW stress also affects canopy structure (leaf area index, leaf inclination) [3,48], so early detection of disease extent in VW also needs to consider the relationship between canopy spectra and structure to further improve the accuracy of detection. To combine these characteristic bands and spectral indices, we used a combination of AHP and EWM to determine the final weights of each characteristic factor. Weight values determined in this way have proven to be more reasonable and scientific, achieving subjective and objective intrinsic unity and realistic and credible evaluation results, and have been widely used. In this study, we also introduced an extended application model of the ideal solution similarity ranking technique to obtain evaluation indices for the fusion of multiple physiological traits of cotton VW through positive and negative ideal solution distances; the model is excellent for the early detection and fine monitoring of VW diseased leaves.

5. Conclusions

In this study, a new spectral index of the physiological traits of cotton under VW stress was constructed, based on the TOPSIS method of AHP and EWM, to obtain an early detection index for the fusion of multiple physiological traits of cotton under VW stress for early monitoring and severity assessment of VW diseases. The results of the study show that:
(1)
When compared to the classical vegetation index, the constructed spectral index of physiological traits of cotton under VW stress correlates more significantly with the severity of cotton diseased leaves. Achieving early and more accurate monitoring of the extent of disease in vegetation requires quantification of the physiological conditions corresponding to plant-specific biotic stresses;
(2)
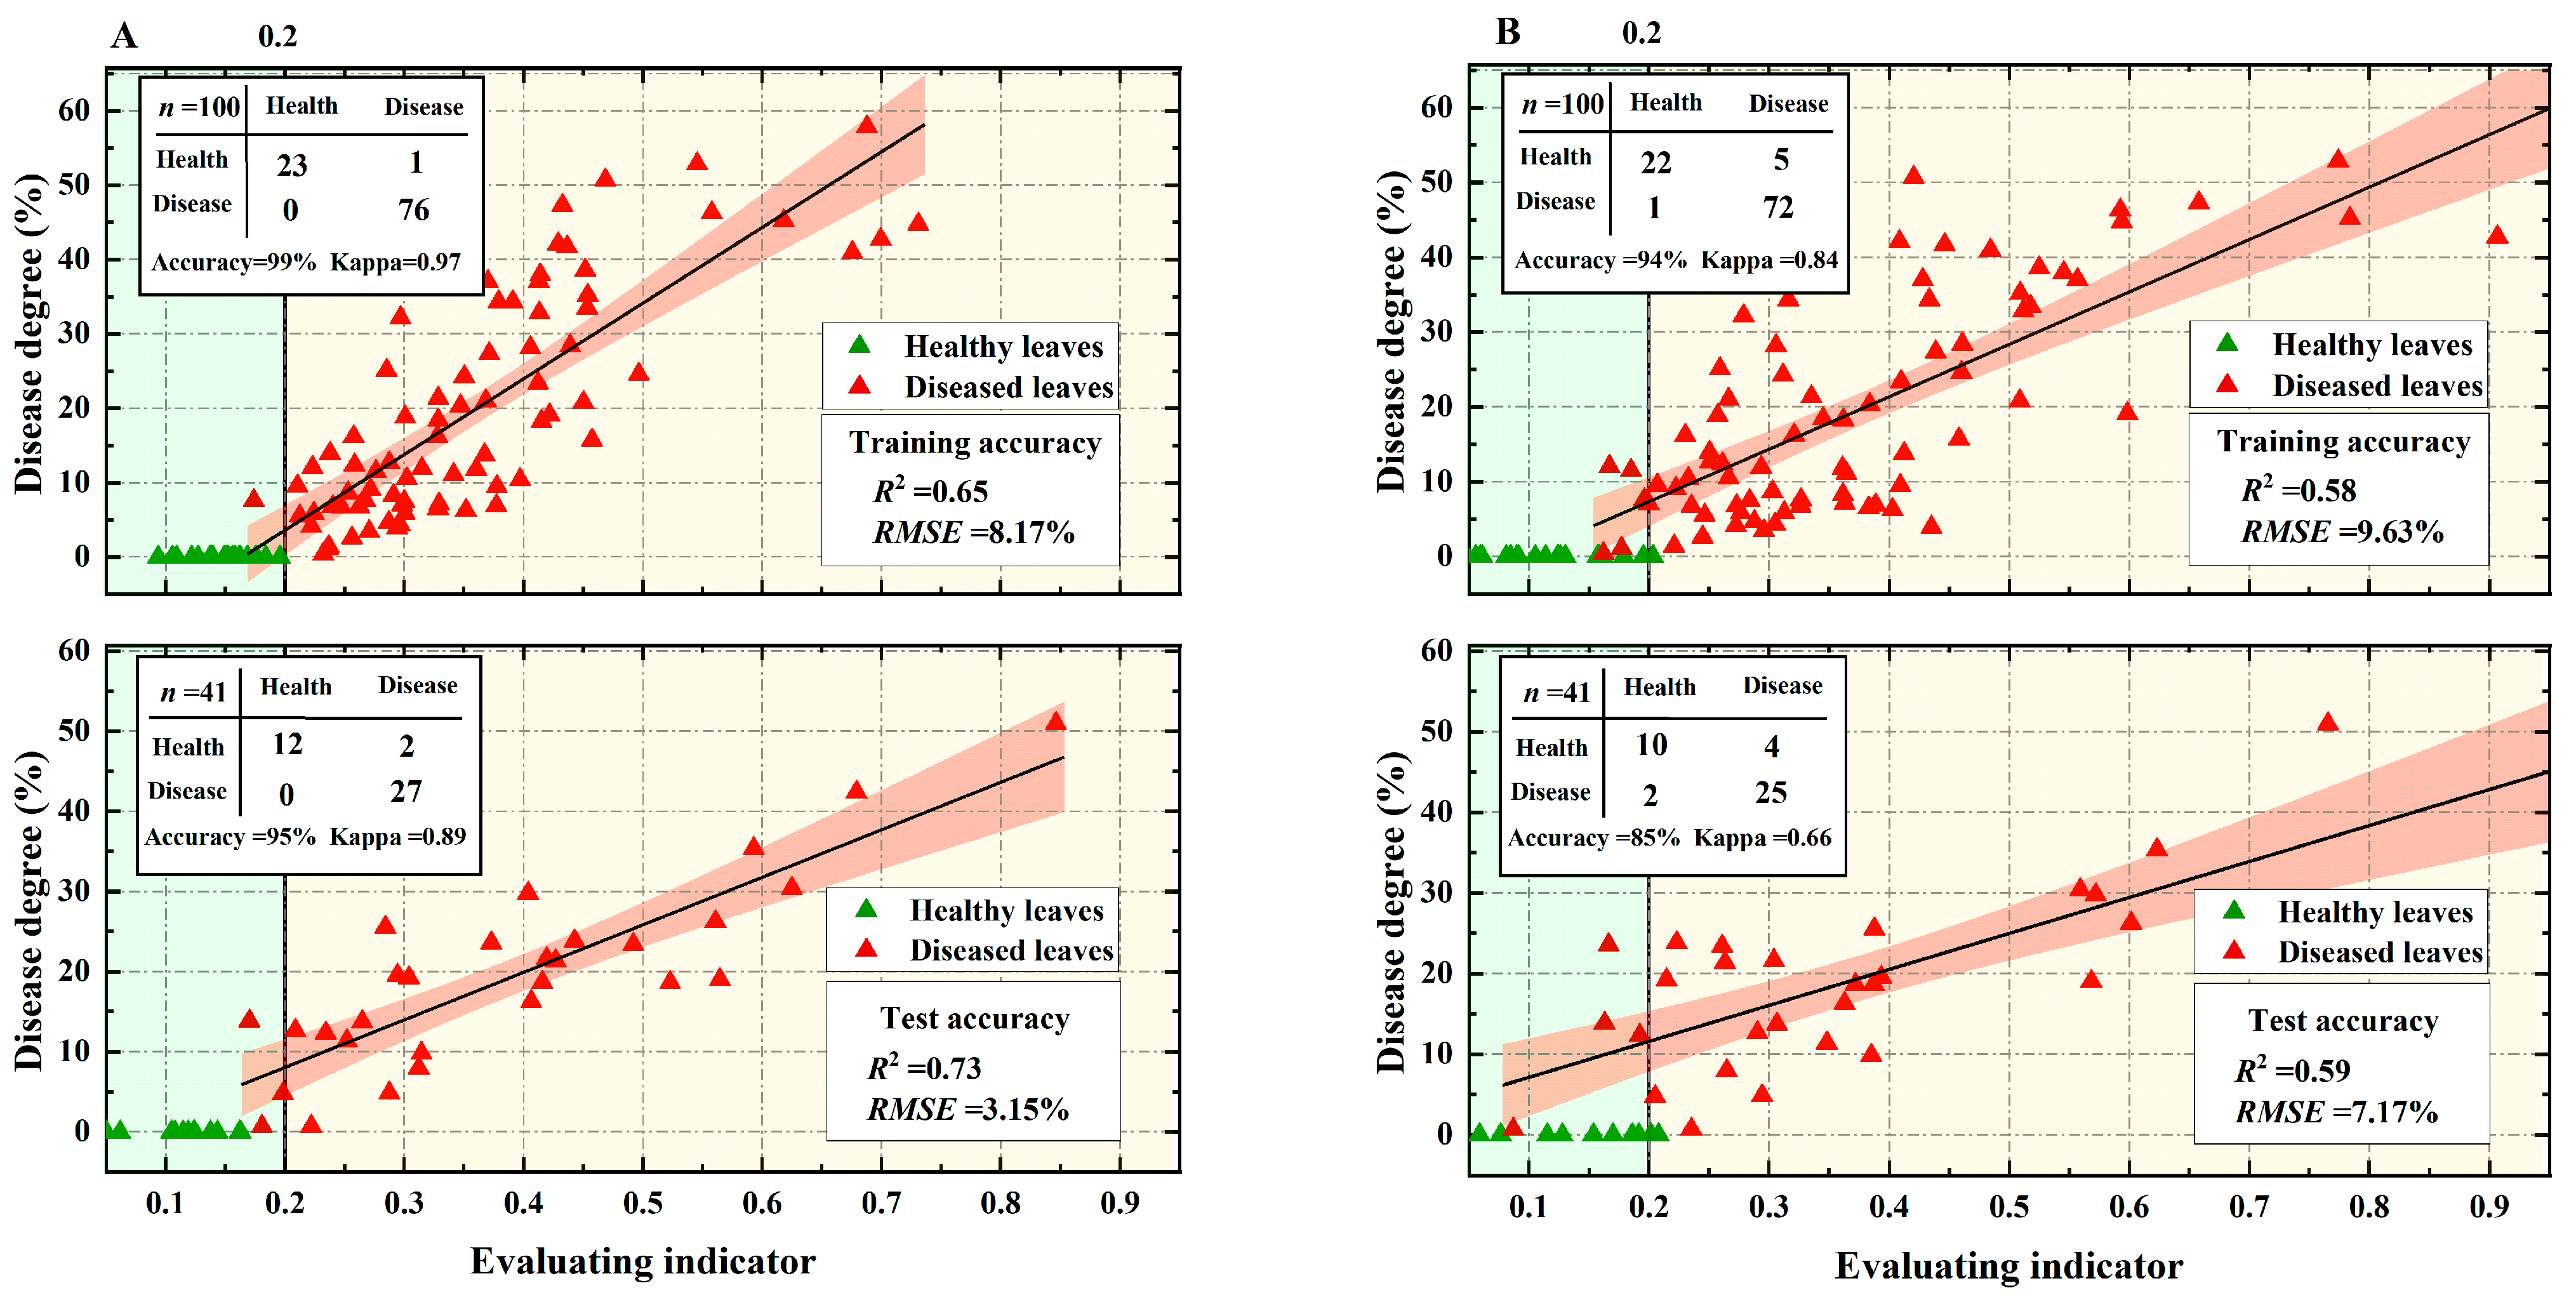
The CVWEI can further improve the early detection and severity monitoring of cotton VW by comparing the constructed early detection index of multiple ‘symptom’ features of cotton VW with the model constructed from a single physiological spectral index. The test set had a classification accuracy of 95%, a Kappa coefficient of 0.89, a linear regression model for disease severity, R2 = 0.73, and an RMSE of 3.15%.

Author Contributions

Conceptualization, M.Y., X.K. and J.W.; methodology, M.Y.; validation, M.Y., L.M. and X.Z.; formal analysis, S.Q. and M.Y.; investigation, L.M.; resources, C.H., Z.Z. and X.L.; data curation, S.Q. and M.Y.; writing—original draft preparation, M.Y.; writing—review and editing, M.Y., L.M., Z.Z. and C.H.; funding acquisition, Z.Z., X.L. and C.H. All authors have read and agreed to the published version of the manuscript.

Funding

This study was supported by the National Natural Science Foundation of China (No. 41971321), Key Research Program of Frontier Sciences, CAS (No. ZDBS-LY-DQC012), Key Scientific and Technological Research Program of XPCC (No. 2020AB005), The Common Application Support Platform for Land Observation Satellites of China’s Civil Space Infrastructure (CASPLOS_CCSI) and Open Fund of Key Laboratory of Oasis Eco-agriculture, XPCC (No. 201801 and 202003). Changping Huang was supported by Youth Innovation Promotion Association, CAS (No. Y2021047), China Xinjiang Uygur Autonomous Region Graduate Scientific Research Innovation Project (NO. XJ2022G115).

Institutional Review Board Statement

Not applicable.

Informed Consent Statement

Not applicable.

Data Availability Statement

Not applicable.

Conflicts of Interest

The authors declare that the research was conducted in the absence of any commercial or financial relationships that could be construed as a potential conflict of interest.

References

  1. Song, R.; Li, J.; Xie, C.; Jian, W.; Yang, X. An Overview of the Molecular Genetics of Plant Resistance to the Verticillium Wilt Pathogen Verticillium dahliae. Int. J. Mol. Sci. 2020, 21, 1120. [Google Scholar] [CrossRef] [Green Version]
  2. Fradin, E.F.; Thomma, B.P. Physiology and molecular aspects of Verticillium wilt diseases caused by V. dahliae and V. albo-atrum. Mol. Plant Pathol. 2006, 7, 71–86. [Google Scholar] [CrossRef]
  3. Calderón, R.; Navas-Cortés, J.A.; Lucena, C.; Zarco-Tejada, P.J. High-resolution airborne hyperspectral and thermal imagery for early detection of Verticillium wilt of olive using fluorescence, temperature and narrow-band spectral indices. Remote Sens. Environ. 2013, 139, 231–245. [Google Scholar] [CrossRef]
  4. Mahlein, A.K.; Rumpf, T.; Welke, P.; Dehne, H.W.; Plümer, L.; Steiner, U.; Oerke, E.C. Development of spectral indices for detecting and identifying plant diseases. Remote Sens. Environ. 2013, 128, 21–30. [Google Scholar] [CrossRef]
  5. Galieni, A.; D’Ascenzo, N.; Stagnari, F.; Pagnani, G.; Xie, Q.; Pisante, M. Past and Future of Plant Stress Detection: An Overview from Remote Sensing to Positron Emission Tomography. Front. Plant Sci. 2020, 11, 609155. [Google Scholar] [CrossRef]
  6. Liu, Y.; Cao, Y.; Wang, T.; Dong, Q.; Li, J.; Niu, C. Detection of 12 common food-borne bacterial pathogens by TaqMan real-time PCR using a single set of reaction conditions. Front. Microbiol. 2019, 10, 222. [Google Scholar] [CrossRef]
  7. Zhang, J.; Huang, Y.; Pu, R.; Gonzalez-Moreno, P.; Yuan, L.; Wu, K.; Huang, W. Monitoring plant diseases and pests through remote sensing technology: A review. Comput. Electron. Agr. 2019, 165, 104943. [Google Scholar] [CrossRef]
  8. Ortiz, J.C.M.; Carvajal, L.M.H.; Fernandez, V.B. Detection of significant wavelengths for identifying and classifying Fusarium oxysporum during the incubation period and water stress in Solanum lycopersicum plants using reflectance spectroscopy. J. Plant Prot. Res. 2019, 59, 244–254. [Google Scholar]
  9. Cunniffe, N.J.; Cobb, R.C.; Meentemeyer, R.K.; Rizzo, D.M.; Gilligan, C.A. Modeling when, where, and how to manage a forest epidemic, motivated by sudden oak death in California. Proc. Natl. Acad. Sci. USA 2016, 113, 5640–5645. [Google Scholar] [CrossRef] [Green Version]
  10. Hernández-Clemente, R.; Hornero, A.; Mottus, M.; Penuelas, J.; González-Dugo, V.; Jiménez, J.C.; Suárez, L.; Alonso, L.; Zarco-Tejada, P.J. Early Diagnosis of Vegetation Health from High-Resolution Hyperspectral and Thermal Imagery: Lessons Learned from Empirical Relationships and Radiative Transfer Modelling. Curr. For. Rep. 2019, 5, 169–183. [Google Scholar] [CrossRef] [Green Version]
  11. Russell, B.C.; Torralba, A.; Murphy, K.P.; Freeman, W.T. LabelMe: A Database and Web-Based Tool for Image Annotation. Int. J. Comput. Vis. 2008, 77, 157–173. [Google Scholar] [CrossRef]
  12. Chen, B.; Li, S.; Wang, K.; Zhou, G.; Bai, J. Evaluating the severity level of cotton Verticillium using spectral signature analysis. Int. J. Remote Sens. 2012, 33, 2706–2724. [Google Scholar] [CrossRef]
  13. Hampton, R.E.; Wullschleger, S.D.; Oosterhuis, D.M. Impact of Verticillium wilt on net photosynthesis, respiration and photorespiration in field-grown cotton (Gossypium hirsutum L.). Physiol. Mol. Plant Pathol. 1990, 37, 271–280. [Google Scholar] [CrossRef]
  14. Saeed, I.A.M.; MacGuidwin, A.E.; Rouse, D.I.; Sharkey, T.D. Limitation to Photosynthesis in Pratylenchus penetrans- and Verticillium dahliae-Infected Potato. Crop Sci. 1999, 39, 1340–1346. [Google Scholar] [CrossRef]
  15. Hernández-Clemente, R.; Navarro-Cerrillo, R.M.; Zarco-Tejada, P.J. Carotenoid content estimation in a heterogeneous conifer forest using narrow-band indices and PROSPECT+DART simulations. Remote Sens. Environ. 2012, 127, 298–315. [Google Scholar] [CrossRef]
  16. Abadia, J. Iron and plant pigments. In Iron Chelation in Plants and Soil Microorganisms; Academic Press: Cambridge, MA, USA, 1993; pp. 327–343. [Google Scholar]
  17. Li, X.; Sun, Z.; Lu, S.; Omasa, K. A multi-angular invariant spectral index for the estimation of leaf water content across a wide range of plant species in different growth stages. Remote Sens. Environ. 2021, 253, 112230. [Google Scholar] [CrossRef]
  18. Kuhlgert, S.; Austic, G.; Zegarac, R.; Osei-Bonsu, I.; Hoh, D.; Chilvers, M.I.; Roth, M.G.; Bi, K.; TerAvest, D.; Weebadde, P.; et al. Multispe Q Beta: A tool for large-scale plant phenotyping connected to the open PhotosynQ network. R. Soc. Open Sci. 2016, 3, 160592. [Google Scholar] [CrossRef] [Green Version]
  19. Kursa, M.B.; Rudnicki, W.R. Feature selection with the Boruta package. J. Stat. Softw. 2010, 36, 1–13. [Google Scholar] [CrossRef] [Green Version]
  20. Gao, B. NDWI—A normalized difference water index for remote sensing of vegetation liquid water from space. Remote Sens. Environ. 1996, 58, 257–266. [Google Scholar] [CrossRef]
  21. Apan, A.; Held, A.; Phinn, S.; Markley, J. Detecting sugarcane ‘orange rust’disease using EO-1 Hyperion hyperspectral imagery. Int. J. Remote Sens. 2004, 25, 489–498. [Google Scholar] [CrossRef] [Green Version]
  22. Dash, J.; Curran, P.J. The MERIS terrestrial chlorophyll index. Int. J. Remote Sens. 2004, 25, 5403–5413. [Google Scholar] [CrossRef]
  23. Gamon, J.; Serrano, L.; Surfus, J.S. The photochemical reflectance index: An optical indicator of photosynthetic radiation use efficiency across species, functional types, and nutrient levels. Oecologia 1997, 112, 492–501. [Google Scholar] [CrossRef] [PubMed]
  24. Blackburn, G.A. Spectral indices for estimating photosynthetic pigment concentrations: A test using senescent tree leaves. Int. J. Remote Sens. 1998, 19, 657–675. [Google Scholar] [CrossRef]
  25. Jing, X.; Huang, W.; Wang, J.; Wang, J.; Wang, K. Hyperspectral inversion models on verticillium wilt severity of cotton leaf. Spectrosc. Spect. Anal. 2009, 29, 3348–3352. [Google Scholar]
  26. Machardy, W.E.; Busch, L.V.; Hall, R. Verticillium wilt of chrysanthemum: Quantitative relationship between increased stomatal resistance and local vascular dysfunction preceding wilt. Can. J. Bot. 1976, 54, 1023–1034. [Google Scholar] [CrossRef]
  27. Pascual, I.; Azcona, I.; Morales, F.; Aguirreolea, J.; Sánchez-Díaz, M. Photosynthetic response of pepper plants to wilt induced by Verticillium dahliae and soil water deficit. J. Plant Physiol. 2010, 167, 701–708. [Google Scholar] [CrossRef]
  28. Tzeng, D.D.; de Vay, J.E. Physiological responses of Gossypium hirsutum L. to infection by defoliating and nondefoliating pathotypes of Verticillium dahliae Kleb. Physiol. Plant Pathol. 1985, 26, 57–72. [Google Scholar] [CrossRef]
  29. Matorin, D.N.; Timofeev, N.P.; Glinushkin, A.P.; Bratkovskaja, L.B.; Zayadan, B.K. Effect of Fungal Infection with Bipolaris sorokiniana on Photosynthetic Light Reactions in Wheat Analyzed by Fluorescence Spectroscopy. Mosc. Univ. Biol. Sci. Bull. 2018, 73, 203–208. [Google Scholar] [CrossRef]
  30. Zhang, L.; Qiao, N.; Huang, C.; Wang, S. Monitoring Drought Effects on Vegetation Productivity Using Satellite Solar-Induced Chlorophyll Fluorescence. Remote Sens. 2019, 11, 378. [Google Scholar] [CrossRef] [Green Version]
  31. Wang, Y.; Liang, C.; Wu, S.; Zhang, X.; Tang, J.; Jian, G.; Jiao, G.; Li, F.; Chu, C. Significant Improvement of Cotton Verticillium Wilt Resistance by Manipulating the Expression of Gastrodia Antifungal Proteins. Mol. Plant 2016, 9, 1436–1439. [Google Scholar] [CrossRef] [Green Version]
  32. Berdugo, C.A.; Zito, R.; Paulus, S.; Mahlein, A.K. Fusion of sensor data for the detection and differentiation of plant diseases in cucumber. Plant Pathol. 2014, 63, 1344–1356. [Google Scholar] [CrossRef]
  33. López-López, M.; Calderón, R.; González-Dugo, V.; Zarco-Tejada, P.J.; Fereres, E. Early detection and quantification of almond red leaf blotch using high-resolution hyperspectral and thermal imagery. Remote Sens. 2016, 8, 276. [Google Scholar] [CrossRef]
  34. Gold, K.M.; Townsend, P.A.; Chlus, A.; Herrmann, I.; Couture, J.J.; Larson, E.R.; Gevens, A.J. Hyperspectral Measurements Enable Pre-Symptomatic Detection and Differentiation of Contrasting Physiological Effects of Late Blight and Early Blight in Potato. Remote Sens. 2020, 12, 286. [Google Scholar] [CrossRef] [Green Version]
  35. Zarco-Tejada, P.J.; Camino, C.; Beck, P.S.A.; Calderon, R.; Hornero, A.; Hernández-Clemente, R.; Kattenborn, T.; Montes-Borrego, M.; Susca, L.; Morelli, M.; et al. Previsual symptoms of Xylella fastidiosa infection revealed in spectral plant-trait alterations. Nat. Plants 2018, 4, 432–439. [Google Scholar] [CrossRef] [PubMed] [Green Version]
  36. Camino, C.; Calderón, R.; Parnell, S.; Dierkes, H.; Chemin, Y.; Román-Écija, M.; Montes-Borrego, M.; Landa, B.B.; Navas-Cortes, J.A.; Zarco-Tejada, P.J.; et al. Detection of Xylella fastidiosa in almond orchards by synergic use of an epidemic spread model and remotely sensed plant traits. Remote Sens. Environ. 2021, 260, 112420. [Google Scholar] [CrossRef] [PubMed]
  37. Xue, J.; Su, B. Significant remote sensing vegetation indices: A review of developments and applications. J. Sens. 2017, 2017, 1353691. [Google Scholar] [CrossRef] [Green Version]
  38. Carter, G.A.; Miller, R.L. Early detection of plant stress by digital imaging within narrow stress-sensitive wavebands. Remote Sens. Environ. 1994, 50, 295–302. [Google Scholar] [CrossRef]
  39. Chen, B.; Han, H.; Wang, F.; Liu, Z.; Deng, F.; Lin, H.; Yu, Y.; Li, S.; Wang, K.; Xiao, C. Monitoring chlorophyll and nitrogen contents in cotton leaf infected by verticillium wilt with spectra red edge parameters. Acta Agron. Sinica 2013, 39, 319–329. [Google Scholar] [CrossRef]
  40. Czarnik-Matusewicz, B.; Pilorz, S. Study of the temperature-dependent near-infrared spectra of water by two-dimensional correlation spectroscopy and principal components analysis. Vib. Spectrosc. 2006, 40, 235–245. [Google Scholar] [CrossRef]
  41. Khan, H.A.; Nakamura, Y.; Furbank, R.T.; Evans, J.R. Effect of leaf temperature on the estimation of photosynthetic and other traits of wheat leaves from hyperspectral reflectance. J. Exp. Bot. 2021, 72, 1271–1281. [Google Scholar] [CrossRef]
  42. Li, X.; Zhang, Y.N.; Ding, C.; Xu, W.; Wang, X. Temporal patterns of cotton Fusarium and Verticillium wilt in Jiangsu coastal areas of China. Sci. Rep. 2017, 7, 12581. [Google Scholar] [CrossRef] [PubMed] [Green Version]
  43. Abdulridha, J.; Ampatzidis, Y.; Ehsani, R.; de Castro, A.I. Evaluating the performance of spectral features and multivariate analysis tools to detect laurel wilt disease and nutritional deficiency in avocado. Comput. Electron. Agr. 2018, 155, 203–211. [Google Scholar] [CrossRef]
  44. Palma, D.; Blanchini, F.; Montessoro, P.L. A system-theoretic approach for image-based infectious plant disease severity estimation. PLoS ONE 2022, 17, e272002. [Google Scholar] [CrossRef]
  45. Abdulridha, J.; Ampatzidis, Y.; Kakarla, S.C.; Roberts, P. Detection of target spot and bacterial spot diseases in tomato using UAV-based and benchtop-based hyperspectral imaging techniques. Precis. Agric. 2020, 21, 955–978. [Google Scholar] [CrossRef]
  46. Asner, G.P.; Martin, R.E. Spectranomics: Emerging science and conservation opportunities at the interface of biodiversity and remote sensing. Glob. Ecol. Conserv. 2016, 8, 212–219. [Google Scholar] [CrossRef] [Green Version]
  47. Gamon, J.A.; Somers, B.; Malenovský, Z.; Middleton, E.M.; Rascher, U.; Schaepman, M.E. Assessing vegetation function with imaging spectroscopy. Surv. Geophys. 2019, 40, 489–513. [Google Scholar] [CrossRef] [Green Version]
  48. Gutierrez, A.P.; DeVay, J.E.; Pullman, G.S.; Friebertshauser, G.E. A model of Verticillium wilt in relation to cotton growth and development. Phytopathology 1983, 73, 89–95. [Google Scholar] [CrossRef]
Figure 1. Cotton verticillium wilt (VW) disease field. (A) Diseased field, (B) healthy cotton leaves and leaves with four VW severities (SL1–SL4 being classified according to a 10% increase in severity of the disease spots), (C,D) cotton canopies for three periods (on 12, 18, and 25 August 2021), from healthy to VW stress.
Remotesensing 14 05241 g001
Figure 2. Flow chart for the development of early monitoring indicators for VW disease in cotton based on the fusion of hyperspectral indices and multi-physiological traits. (a) Extraction of leaf disease severity, (b) selection of key physiological characteristics, (c) comprehensive evaluation index of verticillium wilt disease degree.
Remotesensing 14 05241 g002
Figure 3. Spectral characteristics of cotton VW leaves. (A) Spectral reflectance of cotton leaves under different VW disease degree between 350 and 2500 nm, (B) spectral reflectance of cotton leaves under different degrees of VW disease in visible light (400–675 nm), (C) spectral reflectance of cotton leaves under different degrees of VW disease at the red edge of visible light (680–750 nm), (D) spectral reflectance of cotton leaves under different degrees of VW disease in short-wave infrared light (1300–2400 nm).
Remotesensing 14 05241 g003
Figure 4. Variation in physiological indicators of cotton leaves at different levels of disease. (A) Equivalent water thickness, (B) leaf thickness, (C) dry matter mass, (D) chlorophyll a content, (E) chlorophyll b content, (F) carotenoid content, (G) leaf temperature. Dots outside each box line plot indicate outliers. Different lowercase and capital letters in the figure indicate significant differences at the level of 0.05 and 0.01, respectively. Letters that are the same indicate non-significant differences, while different letters indicate significant differences. Data marked as AB indicate that there are no significant differences between these data and data marked as A or B.
Remotesensing 14 05241 g004
Figure 5. Multiple ‘symptom’ feature selection based on Boruta’s algorithm. (A) Selection of ‘symptom’ features for different VW severities in cotton leaves; (B) selection of ‘symptom’ features for healthy and mildly affected stages.
Remotesensing 14 05241 g005
Figure 6. Correlation analysis of single wavelengths based on the Relief–F algorithm for VW severity (A), Chla (B), EWT (C), and Leaf_T (D).
Remotesensing 14 05241 g006
Figure 7. Correlation matrix between physiological spectral indices of cotton leaves under VW stress and the degree of VW disease. (A) Chla701, (B) EWT1500, (C) EWT2100.
Remotesensing 14 05241 g007
Figure 8. Quantitative relationship between the physiological characteristics of cotton verticillium wilt under early stress based on spectra. (A,B,D,E) represent the quantitative relationships between spectral indices DSWI1, DSWI2, EWT2100, EWT1500, and equivalent water thickness (EWT); (C,F) represent the quantitative relationships between PSSRa, Chla701, and chlorophyll a (Chla); (G) represent the quantitative relationship between the reflectivity with a spectral wavelength of 1610 nm and the leaf temperature. The blue-shaded area represents the 95% confidence interval of fitting.
Remotesensing 14 05241 g008
Figure 9. Accuracy evaluation of early detection indicators for VW. (A) CVWEI with multiple ‘symptom’ characteristics, (B) Chla701, the best constructed physiological spectral index correlating with severity under VW stress in cotton. The top panels are for the training set (n = 100) and the lower panels are for the validation set (n = 41). The red-shaded area represents the 95% confidence interval of fitting.
Remotesensing 14 05241 g009
Table 1. Classification of disease severity.
DS LevelSeverityDisease SpotSample Size
SL0Healthy0%41
SL1Mild severity0–10%24
SL2Low to moderate
severity
10–20%36
SL3Moderate severity20–30%31
SL4Medium severity30–57%18
Table 2. Definitions of typical spectral vegetation indices (VIs) used in this study. The number in the subscript stands for wavelengths and the unit is nm.
Vegetation IndexFormulaMeaningSource
NDWINDWI = (R830 − R1205)/(R830 + R1205)Normalized difference water index[20]
DSWI1R800/R1600Disease stress water index[21]
DSWI2R1600/R550
HI(R534 − R698)/(R534 + R698) − 0.5 ∗ R704Healthy index[4]
Red_edgeR850/R750 − 1Red-edge chlorophyll index[22]
PRI(R570 − R531)/(R570 + R531)Photochemical reflectance index[23]
PSSRaR800/R675Pigment-specific simple ratio[24]
PSSRbR800/R650
PSSRcR800/R500
Table 3. Correlation between classical vegetation indices and disease levels. * indicates a significant level of 0.05; ** indicates a significant level of 0.01; r0.05 = 0.272; r0.01 = 0.322.
Vegetation IndexFormulaMeaningCorrelation CoefficientSource
NDWINDWI = (R830 − R1205)/(R830 + R1205)Normalized difference water index0.44 **[21]
DSWI1R800/R1600Disease stress water index−0.62 **[22]
DSWI2R1600/R5500.54 **
HI(R534 − R698)/(R534 + R698) − 0.5 ∗ R704Healthy index0.66 **[4]
Red_edgeR850/R750 − 1Red_edge chlorophyll index0.25[23]
PRI(R570 − R531)/(R570 + R531)Photochemical reflectance index0.45 **[24]
PSSRaR800/R675Pigment-specific simple ratio0.21[25]
PSSRbR800/R6500.32 **
PSSRcR800/R5000.25
EWT1500(R770 − R1500)/(R770 − R1922)Water differential ratio index under verticillium wilt stress0.66 **Proposed in this study
EWT2100(R765 − R2100)/(R765 − R1922)0.62 **Proposed in this study
Chla701(R538 − R701)/(R538 − R478)Chlorophyll a difference ratio index under verticillium wilt stress0.81 **Proposed in this study
Table 4. Weights of the individual feature parameters.
Target LayerIndex LayerAHPEWMAHP and EWM TOPSIS
CVWEI(R538 − R701)/(R538 − R478)0.550.160.33
(R770 − R1500)/(R770 − R1922)0.100.310.26
(R765 − R2100)/(R765 − R1922)0.040.190.15
R16100.060.090.09
R18920.070.140.10
R14250.190.110.08
Table 5. Accuracy evaluation of the cotton VW early detection model.
InputEvaluation IndicatorTraining SetValidation Set
DSWI1Accuracy
Kappa
79%83%
0.190.50
R2
RMSE
0.310.35
12.50%20.20%
HIAccuracy
Kappa
66%63%
0.190.34
R2
RMSE
0.430.47
13.41%8.33%
EWT1500Accuracy
Kappa
97%85%
0.910.67
R2
RMSE
0.260.38
13.41%9.07%
Chla701Accuracy
Kappa
94%85%
0.840.66
R2
RMSE
0.580.59
9.63%7.17%
CVWEIAccuracy
Kappa
99%95%
0.970.89
R2
RMSE
0.650.73
8.17%3.15%
Publisher’s Note: MDPI stays neutral with regard to jurisdictional claims in published maps and institutional affiliations.

