Protocol

Landsat 9 Cross Calibration Under-Fly of Landsat 8: Planning, and Execution

1
Science Systems Applications Inc@NASA GSFC, Code 618, Greenbelt, MD 20771, USA
2
NASA GSFC, Code 618, Greenbelt, MD 20771, USA
3
KBR, Contractor to the U.S. Geological Survey Earth Resources Observation and Science Center, Sioux Falls, SD 57198, USA
4
NASA GSFC, Code 595, Greenbelt, MD 20771, USA
5
Chester F. Carlson Center for Imaging Science, Digital Imaging and Remote Sensing Laboratory, 54 Lomb Memorial Drive, Rochester Institute of Technology, Rochester, NY 14623, USA
6
Office of Engineering Research, College of Engineering, South Dakota State University, Brookings, SD 57007, USA
7
A.I. Solutions@NASA GSFC, Code 595, Greenbelt, MD 20771, USA
8
U.S. Geological Survey Earth Resources Observation and Science Center, Sioux Falls, SD 57198, USA
*
Author to whom correspondence should be addressed.
Remote Sens. 2022, 14(21), 5414; https://doi.org/10.3390/rs14215414
Submission received: 23 September 2022 / Revised: 24 October 2022 / Accepted: 25 October 2022 / Published: 28 October 2022

Abstract

:
During the early post-launch phase of the Landsat 9 mission, the Landsat 8 and 9 mission teams conducted a successful under-fly of Landsat 8 by Landsat 9, allowing for the near-simultaneous data collection of common Earth targets by the on-board sensors for cross-calibration. This effort, coordinated by the Landsat Calibration and Validation team, required contributions from various entities across National Aeronautics and Space Administration and U.S. Geological Survey such as Flight Dynamics, Systems, Mission Planning, and Flight Operations teams, beginning about 18 months prior to launch. Plans existed to allow this under-fly for any possible launch date of Landsat 9. This included 16 ascent plans and 16 data acquisition plans, one for every day of the Landsat orbital repeat period, with a minimum of 5 days of useful coverage overlap between the sensors. After the Landsat 9 launch, the plan executed, and led to the acquisition of over 2000 partial to full overlapping scene pairs. Although containing less than the expected number of scenes, this dataset was larger than previous Landsat mission under-fly efforts and more than sufficient for performing cross-calibration of the Landsat 8 and Landsat 9 sensors. The details of the planning process and execution of this under-fly are presented.

1. Background

The Landsat program now has a 50-year history of documenting the Earth’s land surface conditions through multispectral imaging. One of the key recent goals of the Landsat program is to provide a consistent record of radiometrically and geometrically calibrated data over its full mission history. One useful tool in providing radiometric calibration consistency between concurrently operating satellites is near-simultaneous acquisition of image data over common ground reference targets. In their nominal 705 km operational World Reference System Two (WRS-2) orbits, Landsat 8 and 9 satellites are phased to provide 8-day repeat coverage, and thus, near-simultaneous imaging of common ground reference targets is essentially non-existent. However, an opportunity that does exist for providing near-simultaneous coverage is during the commissioning phase of each newly launched satellite. (Note, “commissioning” begins with post-launch satellite deployment, and lasts for several months prior to the declaration of normal operations). The insertion orbit for the Landsat satellites is always lower than the final desired operational altitude, in part, to ensure that the final orbit can be reached without performing retrograde orbit adjustments (orbit lowering adjustments), which for the Landsat satellites, involve a non-nominal attitude. When in a lower altitude orbit during commissioning, the Landsat satellite is off its WRS-2 [1,2] ground tracks that are maintained during nominal operations. As such, the ground track of the newly launched satellite (Landsat 9, by example) will shift in and out of phase with its nominal WRS-2 orbital track, and for certain periods of time will be highly overlapping with the path of the existing satellite (Landsat 8, by example) that results in short-term near-simultaneous (if the equatorial crossing times are the same) imaging. The timing and length of these near-simultaneous “tandem flying” or “under-fly” periods are a function, in part, of altitude difference between the two satellites. The closer in altitude, the slower the drift and thus the longer the period of high imaging overlap and near-simultaneity.

Previous Landsat Missions

Dating back to the commissioning phase for Landsat 2 in 1975, data were collected with both the Landsat 1 and Landsat 2 Multi-Spectral Scanners (MSS) and used to adjust the calibration coefficients to provide visually comparable data products, as the focus at that time was visual interpretation. Similarly for each new satellite, under-fly data were collected. Note that Landsat 4 (and all later Landsat satellites through at least Landsat 9) operated at a lower altitude with a new WRS-2. As such, Landsat 4 was regularly under-flying Landsat 3 and multiple near-simultaneous data collects could be performed if Landsat 3 was still operating.
Another factor considered for an under-fly is the equatorial crossing times of the two satellites being compared. The Landsat satellites were historically allowed to deviate up to 15 min from their nominal mean local crossing times. As thruster fuel ran low, they often were allowed to drift even farther apart. Landsat satellites 1–3 had a nominal equatorial crossing time of 9:30 a.m.; Landsat satellites 4–5 were at 9:45 a.m., and Landsat satellites 7–9 were at 10:00 a.m. For example, by November 2021, Landsat 7, being low on fuel, had been allowed to drift to 8:45 a.m. while still collecting data. So, at the time of launch of Landsat 9, Landsat 7 was at about 9 a.m. mean local crossing time at the equator, and Landsat 9 was at about 10:12 a.m. This resulted in a more than one hour time difference when imaging the same ground area on the same day. By contrast Landsat 8 was at about 10:13 a.m., resulting in only a few minutes difference in imaging the same areas when Landsat 9 was in phase with the operational Landsat 8.
The extent of planning conducted for the early Landsat program under-fly periods is unknown, at least to these authors. Of the references cited, Teillet et al. [3] focus on the cross-calibration process of Landsat 5 to Landsat 7 using under-fly data and provide some information about the under-fly data collections. Mishra et al. [4] likewise discuss cross calibration between Landsat 8 Operational Land Imager (OLI) and Landsat 7 Enhanced Thematic Mapper Plus (ETM+) but do not discuss the planning process in any detail. These historical datasets were extremely valuable in performing cross calibration, although a recurrent challenge was obtaining sufficient cloud free imagery over desirable targets. So, for Landsat 9, substantial effort was put into planning for its under-fly of Landsat 8. As such, the intent of this paper is to document (1) the planning process used to maximize the acquisition and useability of simultaneous and near-simultaneous overlapping imaging during commissioning, (2) the successes and failures, and (3) lessons learned for the future so that users of Landsat 8 and Landsat 9 under-fly datasets can understand what they have and why, and future mission planning can benefit from a documented process.

2. Planning Goals and Strategy

2.1. Goals

Two main radiometric goals that the Landsat calibration/validation team wanted to achieve with near-simultaneous imaging during the Landsat 8 and Landsat 9 under-fly campaign were (1) obtain sufficient coincident to near-coincident datasets to perform radiometric cross calibration of Landsat 8 OLI and Landsat 9 OLI-2 data and (2) obtain sufficient coincident to near-coincident datasets to perform radiometric cross calibration of Landsat 8 Thermal Infrared Sensor (TIRS) and Landsat 9 TIRS-2 data. The guidelines in Table 1 were used to help schedule the datasets for acquisitions.
Defining how much data need to be planned and acquired to meet these cross-calibration needs is difficult given the unknown cloud cover contamination during imaging. This is further complicated by the one-shot nature of the under-fly opportunity, in addition to the challenges encountered during operations early in the mission. As such, the flight operations strategy adopted was to acquire as many near-simultaneous Landsat 8 and Landsat 9 scenes with as much overlap in ground coverage as possible, within the constraints of the multi-mission planning system. The scenes with the most overlap and smallest time and angular differences were given the highest priority.

2.2. Strategy

2.2.1. Planning Constraints

Several technical constraints dictated how the under-fly was conducted as part of the Landsat 9 commissioning, how many scenes could be acquired, and the types of ground sites that could be imaged. The under-fly constraints are detailed in Table 2.

2.2.2. Ascent Planning

To achieve the goals within the bounds of these constraints, the flight dynamics team developed detailed ascent plans. The initial design of the Landsat 9 under-fly of Landsat 8 was based upon the Landsat 8 under-fly of Landsat 7 in 2013 [5]. All these ascent plans achieved ~5-day under-fly intervals (defined as where the two satellites were within 1 WRS-2 path and within 10 min of each other) centered on 47.5 days after launch for all possible launch dates (one for each day of the WRS-2 cycle) (Figure 1).

2.2.3. Scene Acquisition Ramp up to Tandem Flying

As mentioned previously, to maximize the number of scene pairs acquired during the tandem flying, a plan was devised to ramp up the Landsat 9 scene acquisitions to its maximum 740 scenes per day. Starting on the first day of earth imaging on Day 34 (D34) since launch, the ramp up schedule was as follows:
  • D34–36: 200 scenes;
  • D37–38: 500 scenes;
  • D39–40: 700 scenes;
  • D41-onwards: 740 scenes.

2.2.4. Calibration Site Identification
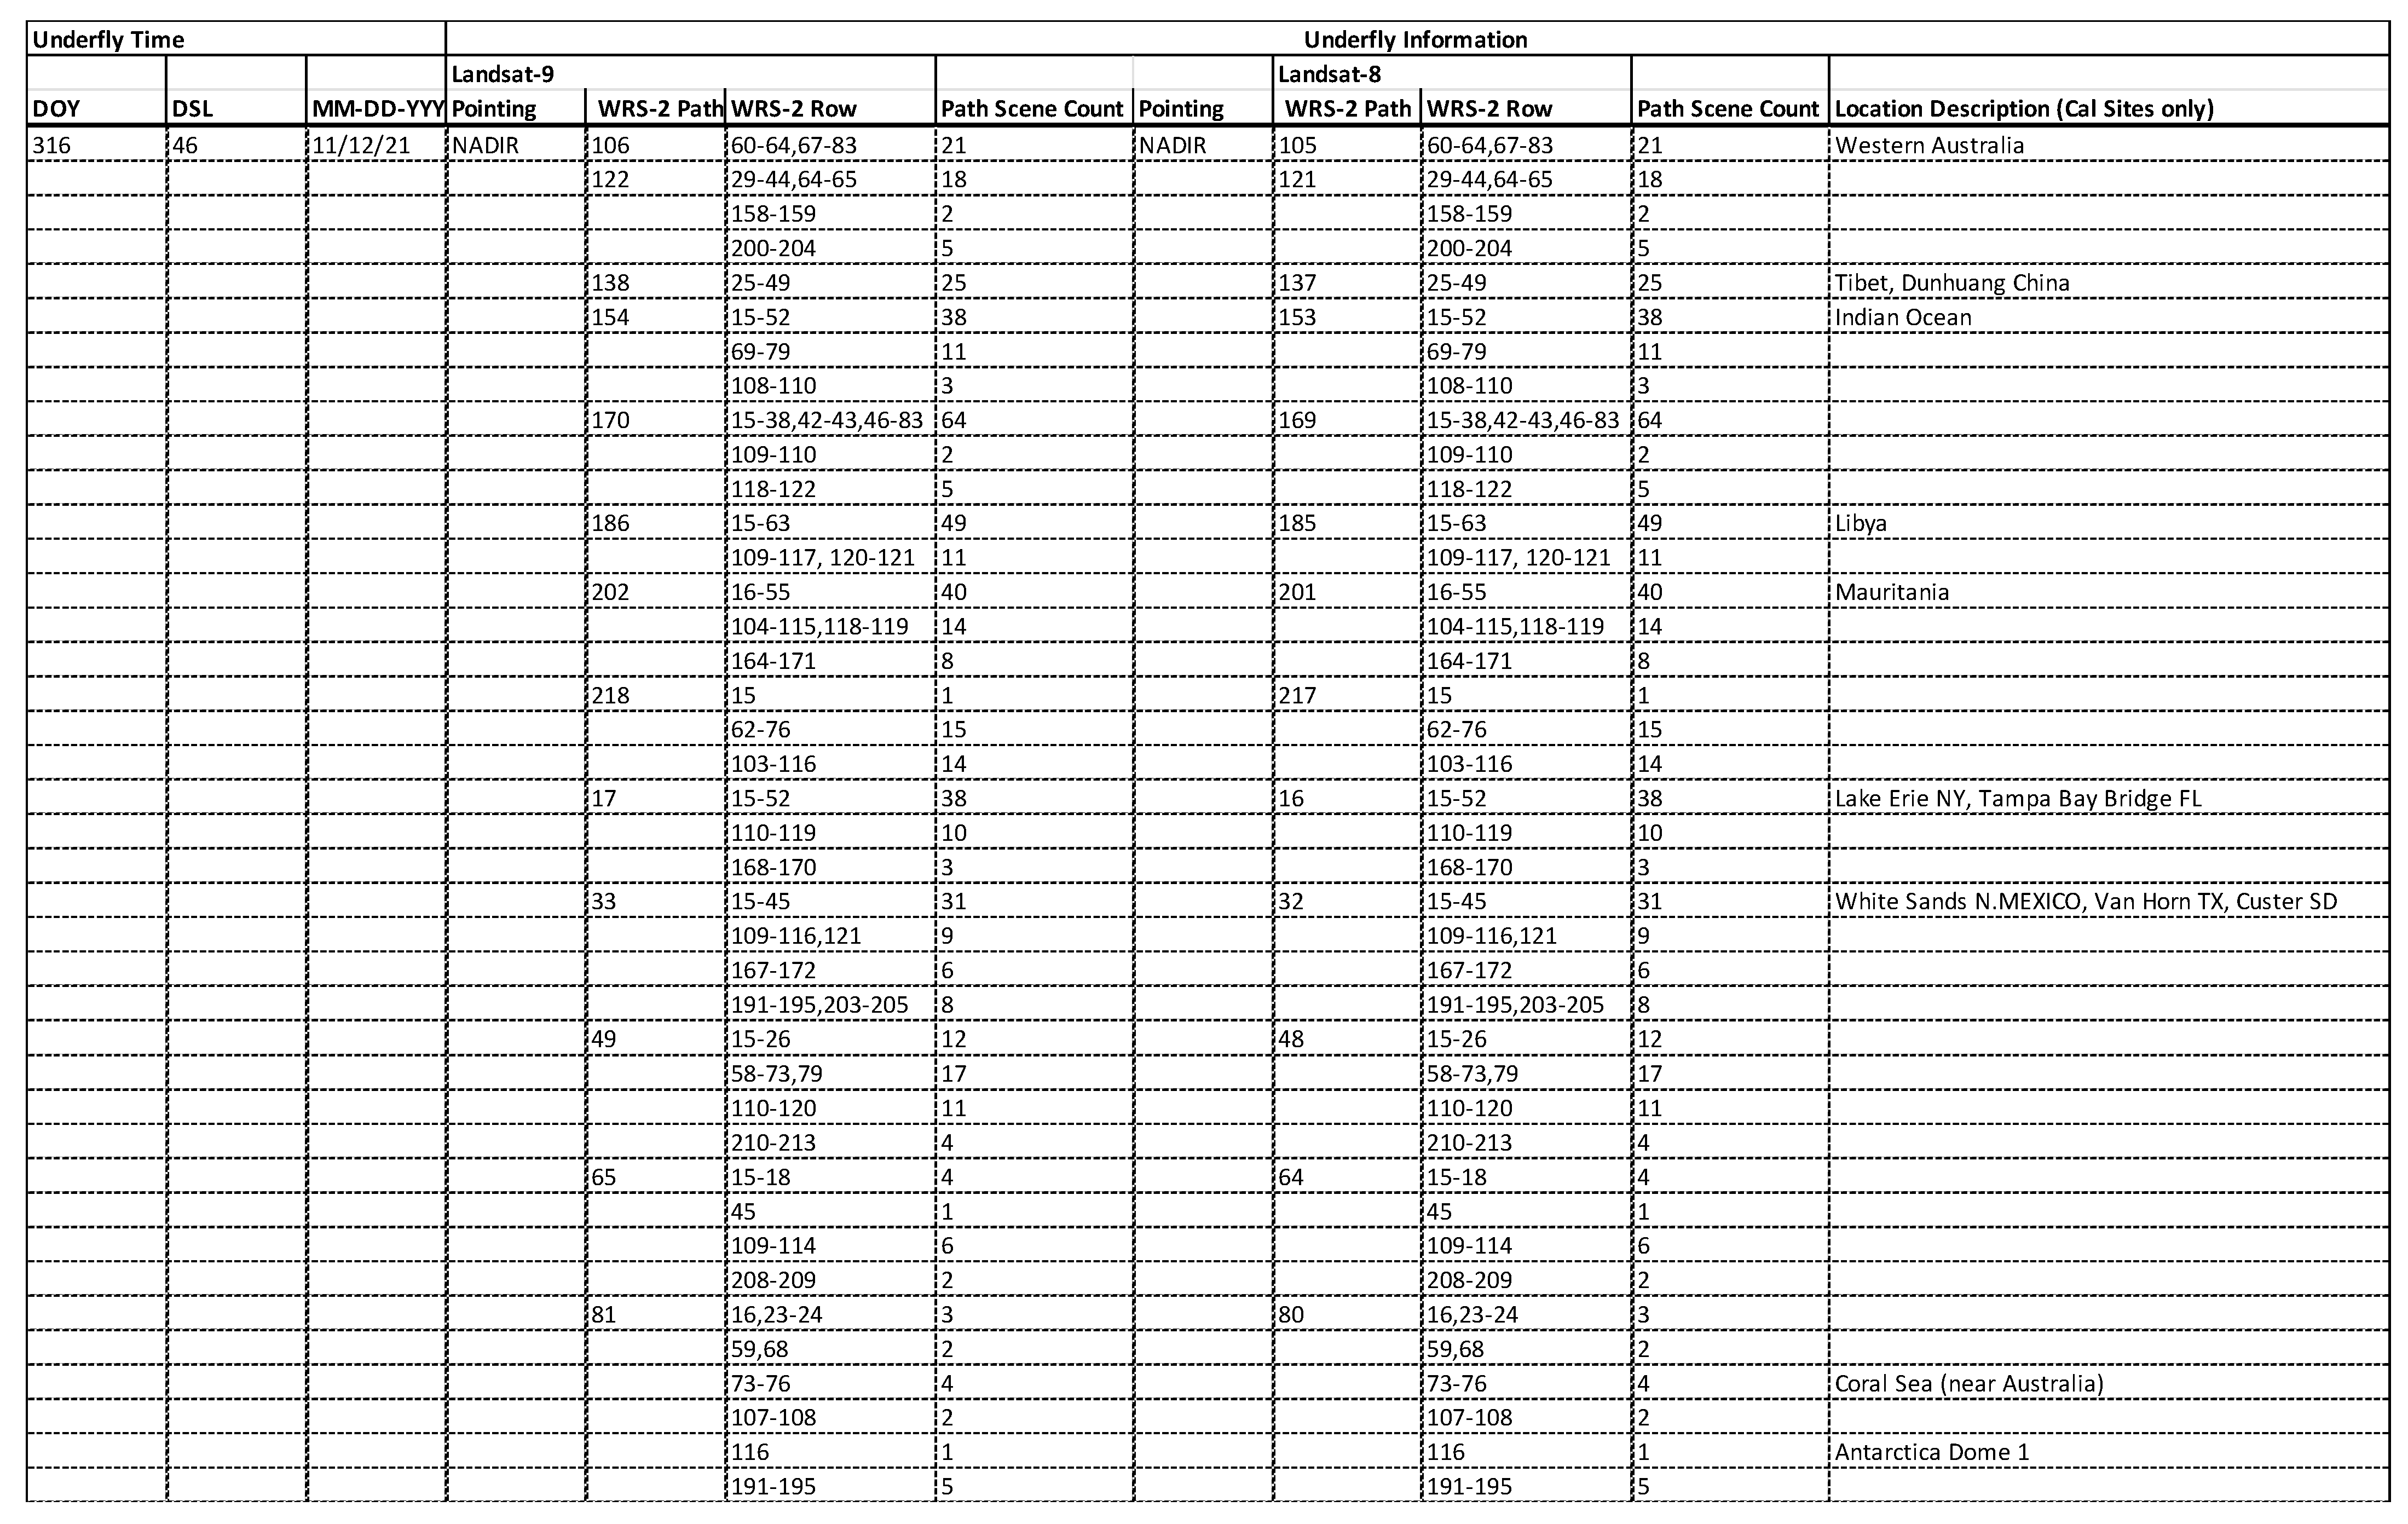
Landsat Calibration and Validation (CalVal) team colleagues from South Dakota State University (SDSU) and the Rochester Institute of Technology (RIT) provided candidate sites for under-fly acquisition for OLI-2 and TIRS-2, respectively. General guidelines included providing candidates that would increase the likelihood of acquiring ‘cloud-free’ scenes, prioritizing them to facilitate building scheduling requests and increasing the likelihood of acquiring the most desirable targets. Given the range of launch dates allowed, a set of targets needed to be identified for all possible launch days within the 16-day cycle. Additional planning details are discussed below.
  • OLI-2
    Acquisition priority was given to cover three different approaches for radiometric evaluation; simulations of the under-fly period for cross calibration, various Pseudo Invariant Calibration Sites (PICS) based approaches for trending and cross calibration, and vicarious calibration team field measurements for absolute and cross calibration. For the under-fly, the following criteria were met; acquire all images within +/− 45 degrees latitude (excluding 0 and -10 degrees), for all land cover types classes derived by SDSU [2] that exhibited less than 1% uncertainty impacts due to spectral and angular corrections, and for similar view angles and solar angles. “Sand” classification targets included PICS and Extended PICS sites (EPICS), e.g., North Africa desert, given their temporal and spectral stability characteristics and broad coverage providing worldwide trending information. Sites were also identified and measured by CalVal members from the U.S. Geological Survey (USGS) Earth Resources Observation and Science (EROS) Center, and international collaborators. USGS EROS coordinated this effort that included Australia and South Africa sites.
  • TIRS-2
    Considering the utility of the open-ocean and near-shore data acquired during the Landsat 8/Landsat 7 under-flight (i.e., these data were critical for the development of the TIRS stray-light mitigation algorithm), an emphasis was placed on identifying similar scenes for the Landsat 9/Landsat 8 under flight. Roughly 75% of the image data acquired by TIRS during the Landsat 8/Landsat 7 under flight were contaminated with clouds. As such, a simple geographic information system (GIS) tool was developed here to better identify potential cloud-free scenes for acquisition, see Figure 2.
    A 20-year temporal average of the Moderate Resolution Imaging Spectroradiometer (MODIS) monthly cloud product (MODIS Standard Atmosphere Level-3 MCD06COSP product) for November was obtained (Figure 2, left) and a threshold of 50% set to identify areas where cloud coverage would be less likely. Figure 2 (right) shows the thresholded image where black represents areas with less than 50% cloud probability based on the MODIS product. (Note that a 25% threshold nearly eliminates all the favorable (black) regions in Figure 2, right). The orbital model “WRS2DATA” file developed by Flight Dynamics System (discussed later) was used to predict where Landsat 9 would be during commissioning and, for this study, the under-flight period from ~13 November 2021 to 17 November 2021. The orange dotted lines in Figure 2 (right) shows where the orbital model and low cloud regions intersect for the first day of the under flight.
    Recommendations for favorable intervals were made based on this analysis with a ‘highest’ priority given to nearshore continental United States (CONUS) path/rows due to the availability of reference data. (Note that the National Oceanic and Atmospheric Administration (NOAA) nearshore buoy network is extensive, and a ground campaign was conducted across the United States by RIT using Tidbit temperature sensors to expand the availability of reference data to support TIRS-2 calibration efforts.) ‘High’ priority was given to world-wide nearshore scenes as the contrast between hot land and cooler water provides potential scenarios where effects due to stray light can be observed in the image data. Near-shore image data acquired with TIRS during the Landsat 8/Landsat 7 under-fly were critical to the development of its stray light correction algorithm. Finally, open ocean scenes were assigned a ‘medium’ priority because reference data are typically not available, and land-geometries are not present to inform on the presence of stray light. In the context of calibration, open ocean scenes also have significant utility for flat-field assessment.

3. Execution

3.1. Launch and Ascent

On 27 September 2021, at one minute into the launch window (18:12 UTC), an Atlas V 401 inserted Landsat 9 into a circular orbit with an altitude of 685 km, in nearly the same orbit plane as Landsat 8. Following a sequence of six maneuvers, Landsat 9 reached its mission orbit of 705 km in equatorial latitude, Mean Local Time-Descending Node crossing of 10:12 (same as Landsat 8). Landsat 9 is 180 deg away from Landsat 8, so that the two observatories image the globe from −81 deg to +81 deg latitude every 8 days.
A pair of Engineering Maneuvers to calibrate thrusters, followed by two pairs of Ascent Maneuvers preceding the under-fly, followed by two additional ascent maneuvers, achieved the ascent goals. The Semi-major Axis history during the Landsat 9 ascent is shown in Figure 3, with the calibration under-fly period highlighted. The first pair of Ascent Maneuvers (ASC-1 and ASC-2) raised Landsat 9 from the insertion orbit to the intermediate orbit, about 10 km below mission orbit. Maneuvers ASC-1 and ASC-2 were timed so that Landsat 9 would be under Landsat 8, in the center of the tandem flying interval, on day 47.5. The timing of ASC-1 and ASC-2 depended on where Landsat 8 was located relative to Landsat 9 at launch. For the launch date on 27 September 2021, at 18:14, ASC-1 was performed on day 25, and ASC-2 was performed on day 28. During mission planning in the years before launch, the day-of-launch was unknown. To be prepared for all possibilities, an ascent was planned at the start of the Launch Window for each day in a 16-day repeat cycle for Landsat 8.
Figure 4 shows the location of Landsat 9 in terms of WRS-2 paths from Landsat 8 during the ascent. The calibration under-fly, from days 45 to 51, is highlighted by a green rectangle. This selection is also highlighted in green in Figure 5. Note that there were two earlier under-fly opportunities, starting near Day of Year (DOY) 277 or L-day (day since Launch) 7 and DOY 291 or L-day 21. The first two under-fly opportunities occurred before the Landsat 9 observatory was ready to perform cross-calibration with Landsat 8. The first two under-fly opportunities were used to prepare for days when Landsat 8 and Landsat 9 would be competing for the same ground station resources. Note also that the first two under-fly opportunity periods were shorter, the altitude difference were larger, and the drift rates were faster than the third.
After the under-fly, the second pair of Ascent Maneuvers, ASC-3, and ASC-4, were performed to reach mission orbit. This second pair of maneuvers was timed to occur when Landsat 9 had drifted from being under Landsat 8 on day 47.5 to being 180 degrees from Landsat 8. The synodic period between the intermediate orbit and the mission orbit was about 32 days, so this drift of 180 degrees took 16 days. Maneuvers ASC-3 and ASC-4 were performed on days 61 and 64 respectively.

3.2. Acquisition Scheduling

The process of scene selection and scheduling was performed manually. This process required using Flight Dynamic predictions of the orbit for each day and selecting calibration sites from predefined lists to populate the acquisition request. After calibration sites were identified, priority was given to CONUS intervals, and scenes from the Land Collection Request (LCR) also known as Long Term Acquisition Plan (LTAP). With a mix of ascending and descending scenes, a file of corresponding path/rows was generated daily and submitted as a “Special Collection Request” (SCR) to the User Portal System (UPE). The Landsat calibration validation team worked closely with Flight Dynamics and Mission Planning & Scheduling teams within the Landsat Multi-Satellite Operations Center (LMOC) system during and after the submission of any acquisition requests. Further details of the scheduling process are described below.

3.2.1. Scheduling Constraints

The SCR constructed for each under-fly day considered a list of scheduling constraints whose main objectives were to mitigate instrument safety concerns and to not compromise science image acquisitions. These constraints were as follows:
  • Maximum number of night acquisitions per orbit is limited to 24 scenes;
  • Maximum off-nadir angle is limited to +/− 15 degrees;
  • Maximum number of scenes within an off-nadir collect is limited to 18 scenes;
  • Maximum number of off-nadir acquisitions per orbit is limited to two;
  • For simultaneous day earth collects, point Landsat 9 off-nadir keeping Landsat 8 nadir to minimize the loss of science acquisitions of the operational satellite;
  • For simultaneous day ocean collects, point Landsat 9 off-nadir keeping Landsat 8 nadir, or point Landsat 8 off-nadir keeping Landsat 9 nadir, whichever is desired depending on the target;
  • For simultaneous night collects, point Landsat 9 off-nadir keeping Landsat 8 nadir, or point Landsat 8 off-nadir keeping Landsat 9 nadir, whichever is desired depending on the target.

3.2.2. Flight Dynamics Products

During the building of special collection requests, flight dynamic products like “WRS2TTT” and “WRSData” files were used extensively. These files were generated based on the orbital prediction of both Landsat 8 and Landsat 9 satellites and provided predicted WRS-2 Path and Rows along with their acquisition times. The WRS2TTT records also provided a corresponding sun elevation angle for each path/row.
The WRS2DATA file proved particularly useful during the tandem flying and provided the time of each descending node, the current longitude, the desired longitude (for the WRS-2), the error, the path number, and the Landsat 8 path number. An example is shown in Figure 6 below. The inputs for this file were the Landsat 9 predicted ephemeris and Landsat 8 ephemeris file, from which the spacecraft orbit positions were determined. For each step in the orbit towards the descending node crossing, an offset was computed from the defined longitude center in degrees (based upon the WRS-2 center) for each satellite. Finally, a corresponding path/row was derived for each step, as well as a path difference and spacecraft separation (SC_SEP) in minutes. These files were routinely updated after each Landsat 9 ascension burn.
This path information along with LTAP and CalVal site lists were the basis of SCR scene selections. During the early days of the imaging ramp up period when only a few scenes were selected for acquisition, CalVal requests and CONUS scenes received higher priority. With the ramp up of the number of acquired scenes, better coverage around the globe was possible.

3.2.3. UPE (User Portal Elements)

Both Landsat 8 and Landsat 9 acquisition requests were submitted through User Portal Element (UPE) interfaces. Figure 7 below shows the Landsat 9 interfaces among various ground subsystems including the UPE (highlighted). Note that Landsat 8 had its own Mission Operations Center (MOC) and planning system until the Spring 2022, when it was merged with Landsat 9 into a single Landsat Multi-Satellite Operations Center (LMOC). Until the merge, separate UPE systems had to be used with slight differences; e.g., acquisition requests were submitted as “ground look calibrations” or “off-nadir calibrations” for Landsat 8, whereas requests were submitted only as “ground look calibrations” for Landsat 9. The inputs for individual nadir requests were the WRS-2 path/row or latitude/longitude and acquisition date. Both UPE’s also provided the option to upload a list containing WRS-2 path row information. Off-nadir acquisition requests required latitude/longitude information for each corresponding path/row of interest. Other criteria for acquisition requests included start date, end date, cloud cover, and priority level. Each SCR submission was assigned a unique ID and flagged by the Mission Planners, Flight Operations Team and/or Flight Dynamics Team. Some SCRs, like off-nadir requests, were evaluated by the Flight Dynamics/Mission Planners to ensure that no instrument constraints would be violated. Final approval of each submission was provided by the Data Acquisition Manager (DAM). Upon approval from the DAM, LMOC mission planners-built acquisition loads to upload to the satellite for execution. Figure 8 below shows the Landsat 9 UPE interface for nadir and off-nadir acquisition requests.

4. Data Collection

A well-coordinated effort with the Flight Dynamics Systems, Flight Operations, and Mission Planning Teams led to achieving the most desirable tandem flying acquisitions, starting on Day of Year 316 (DOY 316 or 12 November 2021). As mentioned previously, to avoid potential disruptions to this acquisition, the CalVal strategy included foregoing any spacecraft maneuvers about one week prior to the heart of the under-fly with 0-path separation. This resulted in nadir (pointing) partial to full overlap collects on DOY 316–317, full overlap collects on DOY 318–319, and off-nadir collects on DOY 320–321.
Scenes scheduled for each day of the tandem flying were derived from the various lists of TIRS ocean, “near-shore” intervals transiting near land, “off-shore” intervals crossing land and water, and buoy sites, as discussed in Section 2. The land calibration sites were identified from lists assembled for Landsat 8 with the remainder of the daily scene acquisitions scheduled from the LTAP. Figure 9 illustrates the path/rows acquired for both Landsat 8 and Landsat 9 within and up to 1 path of each other. The first 3 overlays illustrate the DAY scene acquisitions separated out by periods of the under-fly; i.e., “Early” (DOY 316–317 or 12 November 2021–13 November 2021), “Mid” (DOY 317–319 or 13 November 2021–15 November 2021), “Late” (DOY 319–321 or 15 November 2021–17 November 2021), to better illustrate the overlap between Landsat 9 and Landsat 8. The last overlay illustrates the NIGHT scene acquisitions over the entire under-fly period (i.e., DOY 316–321).
Figure A1 (in Appendix A) provides details on the scene pairs acquired from the SCRs and LTAP. The POINTING column for each satellite indicates its acquisition orientation; i.e., nadir or off-nadir where Landsat 9 off-nadir implies that Landsat 9 was pointing to the Landsat 8 path and vice versa. Additional information includes the scene counts for each PATH interval, as well as LOCATION information for the calibration sites only. Note, these sites were identified using the International Geosphere Biosphere Programme (IGBP) Land Classification to fall with 14 categories, i.e., Dark Soil, Deciduous Needleleaf, Mixed Forest, Open Shrublands, Woody Savanna, Savanna, Grasslands, Croplands, Natural Vegetation/Croplands, Snow, Evergreen Broadleaf, Light Soil, Sand, and Water (TIRS Only).
From all scene pairs, approximately 1000 provided useful data for Landsat 9/Landsat 8 radiometric cross-calibration evaluations [6], approximately 930 scenes were used for geometric calibration assessments [7], and approximately 10 scenes for thermal vicarious calibration.

5. Lessons Learned

It should be noted that Figure A1 lists and Figure 9 shows all the scenes downlinked, but not all that were requested and/or scheduled by SCR or LTAP. In particular, during the center of the under-fly period, Landsat 8 scenes outnumber Landsat 9 scenes by about 3:1. If the under-fly had gone as proposed, about 1300 coincident scenes would have been acquired during the center of this period. The actual number was about 400 and although yielding a valuable dataset for characterization, a post under-fly investigation revealed several factors that contributed to the acquisition shortfall. These shortfalls are outlined below:
  • The SCR scene rejection criteria differed based upon the solar zenith angle. As noted previously, there were two scheduling systems (i.e., Landsat 8 MOC and Landsat 8 and Landsat 9 LMOC) that required inputs and SCR evaluations. As such, each system was found to calculate the solar angle zenith angle differently with Landsat 9 derived from earth-center, and Landsat 8 derived from the earth-surface. This resulted in the loss of some coincident images.
  • Landsat 9 scenes were not acquired due to the overriding priority given to calibration collects (scheduled by SCR) over routine earth collects (scheduled by the Landsat 9 LTAP). Due to a flaw in the Landsat 9 scheduling process, the SCR calibration collects for a given path were scheduled while routine LTAP Earth collects were rejected. Note in Figure 9, in particular, the lack of coverage over Europe and Canada due to the large number of calibration-collects requested over the United States and Africa. By contrast, in the Landsat 8 scheduling system, calibration collects were automatically scheduled based upon a list of predefined acquisition constraints including instrument and/or calibrator configuration, cadence, and location defined to avoid affecting Earth collects.
  • Landsat 9 scenes were missed due to a different (smaller) scene gap size between intervals versus Landsat 8.
  • Incorrect scene PATH reporting information derived for SCR versus LCR acquisitions attributed to an error in the LMOC system. Note that this did not lead to a loss of scenes but rather, a skewed reporting of scenes acquired.
All these issues were addressed after the Landsat 9 commissioning period and point to one of the challenges in conducting a calibration campaign early in a flight mission while still transitioning to “nominal operations.”

6. Conclusions

A radiometric cross-calibration campaign was successfully conducted between the Landsat 8 sensors and the Landsat 9 sensors during the commissioning phase of Landsat 9 when Landsat 9 was under-flying Landsat 8. Close coordination between the Flight Dynamics team, mission operations, data scheduling and acquisition planning, data processing, and the Calibration and Validation team provided the burn planning and execution to achieve about 5 days of useful overlap between the two satellites sensors coverage. Although a few challenges were encountered in the end-to-end MOC and LMOC systems, a valuable dataset was obtained for both OLI and TIRS instruments. Initial results of the cross calibration for OLI [7] has been published, attesting to the value of the Landsat 8 and Landsat 9 under-fly dataset.

Author Contributions

All the authors were involved in the various aspects of the under-fly planning and execution. B.M., the Landsat CalVal Manager, led and coordinated the planning effort. D.D., S.G. and M.S. provided the Flight Dynamics modeling inputs. A.G. and L.L. performed the calibration site assessments for acquisition. M.O.H. and E.K. developed the calibration acquisition plan and generated the special calibration requests for each day of the under-fly, and C.J.C. reviewed and provided final approval for all acquisition requests submitted. All authors have read and agreed to the published version of the manuscript.

Funding

This research received no external funding.

Acknowledgments

Any use of trade, firm, or product names is for descriptive purposes only and does not imply endorsement by the U.S. Government.

Conflicts of Interest

The authors declare no conflict of interest.

Appendix A

Figure A1. Summary of Tandem flying pair acquisitions.
Remotesensing 14 05414 g0a1aRemotesensing 14 05414 g0a1bRemotesensing 14 05414 g0a1c

References

  1. NASA Technical Memorandum (TM). Landsat-4 World Reference System (WRS) Users Guide October 1982; Doc ID:19830013208, NASA-TM-85284; NASA Technical Memorandum: Washington, DC, USA, 2013.
  2. U.S. Geological Survey, WRS-2 Path/Row (Landsats 4, 5 and 7) and UTM Zones. Available online: https://landsat.usgs.gov/sites/default/files/images/wrs2.gif (accessed on 1 October 2022).
  3. Teillet, P.; Barker, J.; Markham, B.; Irish, R.; Fedosejevs, G.; Storey, J. Radiometric cross-calibration of the Landsat-7 ETM+ and Landsat-5 TM sensors based on tandem data sets. Remote Sens. Environ. 2001, 78, 39–54. [Google Scholar] [CrossRef] [Green Version]
  4. Mishra, N.; Haque, M.O.; Leigh, L.; Aaron, D.; Helder, D.; Markham, B. Radiometric cross calibration of Landsat 8 Operational Land Imager (OLI) and Landsat 7 Enhanced Thematic Mapper Plus (ETM+). Can. J. Remote Sens. 2014, 6, 12619–12638. [Google Scholar] [CrossRef] [Green Version]
  5. Mann, L.M.; Nicholson, A.M.; Good, S.M.; Woodard, M.A. Landsat Data Continuity Mission (LDCM) Ascent and Operational Orbit Design. In Proceedings of the 22nd AAS/AIAA Space Flight Mechanics Meeting, AAS 12-254, Charleston, SC, USA, 29 January–2 February 2012. [Google Scholar]
  6. Gross, G.; Helder, D.; Begeman, C.; Leigh, L.; Kaewmanee, M.; Shah, R. Initial Cross-Calibration of Landsat 8, and Landsat 9 Using the Simultaneous Underfly Event. Remote Sens. 2022, 14, 2418. [Google Scholar] [CrossRef]
  7. Choate, M.J.; Rengarajan, R.; Storey, J.C.; Lubke, M. Landsat 9 Geometric Characteristics Using Underfly Data. Remote Sens. 2022, 14, 3781. [Google Scholar] [CrossRef]
Figure 1. Table of Ascent Plans for a 16-day Launch Cycle. For each prospective launch date for Landsat 9, Landsat 8 can be in a different position in its orbit, requiring a different Ascent Plan. Because Landsat 8 has a 16-day Repeat Ground Track, the Flight Dynamics team created 16 Ascent Plans. This figure begins on 16 September 2021 because that was the planned launch date, until circumstances forced a skip until 27 September 2021. This figure indicates possible Engineering Burns (E1–2), Ascent Burns (A1–4) and Under-fly periods (UF) to meet mission constraints and guidelines in Table 2.
Remotesensing 14 05414 g001
Figure 2. (Left) Temporal average of the MODIS monthly cloud product for November (right), and thresholded (50%) image of temporal average (left) with an orbital model overlaid for scene identification.
Remotesensing 14 05414 g002
Figure 3. Landsat 9 Semi-major Axis versus Elapsed Days for launch.
Remotesensing 14 05414 g003
Figure 4. Landsat 9 offset from Landsat 8 in WRS-2 path difference.
Remotesensing 14 05414 g004
Figure 5. Under-fly epoch options with final selection highlighted in green.
Remotesensing 14 05414 g005
Figure 6. Example from WRS2DATA file.
Remotesensing 14 05414 g006
Figure 7. Landsat 9 User Portal Elements Release 7.0.0 Test Subsystems and Interfaces (GNE-Ground Network Element, IC-International Cooperator, DAM-Data Acquisition Manager, SIFMT-Scene to Interval to File Mapping System, L0Ra-Level 0 Reformatted Archive, L0Rp-Level 0 Reformatted Product, A&A-Archive and Access, TRAM-Tracking, Routing and Metrics, FRB-Full Resolution Browser, CPF-Calibration Parameter File, BPF-Bias Parameter File, RLUT-Response Linearization Look Up Table, GCP-Ground Control Point, USNO-U.S. Naval Observatory, TLE-Two Line Element, L1-Level 1, L2-Level 2, S/C-Spacecraft, GS-Ground Systems, DPAS-Data Processing and Archive System).
Remotesensing 14 05414 g007
Figure 8. Landsat 9 User Portal Element (UPE) User Interface.
Remotesensing 14 05414 g008
Figure 9. Landsat 9 and Landsat 8 Path(P)/Rows(R) Acquired During the Tandem flying (Day and Night).
Remotesensing 14 05414 g009
Table 1. Guidelines for Acquiring Data.
InstrumentGuidelines for Acquiring Data
OLI1. Uniform targets of sufficient size (~300 × 300 m). (10 IFOV (Instantaneous Field of View) × 10 IFOV).
  • Cloud free
  • At a range of brightness levels from typical vegetated target radiances to near saturation radiances
  • Instrumented sites, as available
  • Routinely used sites, as available
2. Acquisition time differences of less than 15 min
3. View zenith angle differences of less than 5 degrees.
TIRS1. Uniform targets of sufficient size (~1 × 1 km). (10 IFOV × 10 IFOV).
  • Cloud free
  • At a range of water surface temperatures from approximately 4 °C to 30 °C; land surface from −40 °C to 50 °C
  • Instrumented sites, as available
  • Routinely used sites, as available
2. Acquisition time differences of less than 15 min (water) and 5 min (land)
3. View zenith angle differences of less than 20 degrees.
Table 2. Planning Constraints.
TypeConstraints and Guidelines
Science
  • Maximize the number of scenes with >50% overlap that were within 10 min of Landsat 8 imaging
  • Allocate the final ~30 days of commissioning at the operational altitude to allow the geometry calibration team to complete their work
  • Limit Landsat 8 off-nadir pointing to nighttime (ascending node orbit) acquisitions to preserve its long-term acquisition plan
  • Match final orbit with 8-day phasing between Landsat 9 and Landsat 8 (same location as Landsat 7) at a 10:12 a.m. mean local equatorial crossing time
  • Do not extend the commissioning period (nominally 90 days) more than a few days to complete the under-fly; i.e., all under-fly and orbit raising activities need to occur between instrument activation and approximately 60 days after launch
  • Place no restrictions on the launch date or time
  • Perform engineering thruster burns on mission days 4 and 6
Operational
  • Perform no non-nominal maneuvers (e.g., retrograde or orbit-lowering)
  • Consume no significant extra fuel
  • Fully activate both instruments and complete their initial checkouts (about 35 days from launch)
  • Do not acquire more than the maximum number of scenes of 740 scenes across a 3-day running average
  • Ramp up to full scene acquisitions after instrument activation (required 5+ days)
  • Limit off-nadir pointing to ±15°, equivalent to one WRS-2 path difference; limit number of off-nadir acquisitions allowed each day, and have no off-nadir pointing in sun direction
  • Require the following for ascent burns: minimum of 3 days between ascent burns; perform no ascent burns before mission day 9; perform ascent burns during day shifts, if possible; achieve 50% of ascent in first two burns; achieve 50% in two-second burns (post under-fly)
  • Obtain Tracking Data Relay Satellite (TDRS) coverage during ascent burns, which limits where burns can be performed
  • Allow for early inclination maneuver if launch dispersion is large
Coordination with other missions
  • Require initial orbit of 24 km below the 705 km equatorial altitude constellation to permit phasing into final orbit
  • Maximize separation between full constellation fleet envelope during ascent; i.e., under-fly orbit is chosen to be a frozen orbit with same eccentricity as 705 km constellation
  • Avoid close conjunctions with C-train satellites (CALIPSO and Cloudsat) via launch window cutouts
Collision Avoidance
  • Screen all ascent plan for close conjunctions
  • Perform avoidance maneuvers as necessary
  • Require maneuver plans from flight dynamics as well as no burn and special one burn ephemerides (if more than 2 burns in 7-day screening period)
Publisher’s Note: MDPI stays neutral with regard to jurisdictional claims in published maps and institutional affiliations.

