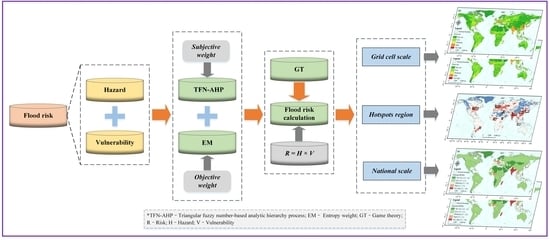
Increasing Global Flood Risk in 2005–2020 from a Multi-Scale Perspective
Abstract
1. Introduction
2. Data
2.1. Global Flood Hazard Data
2.2. Global Flood Vulnerability Data
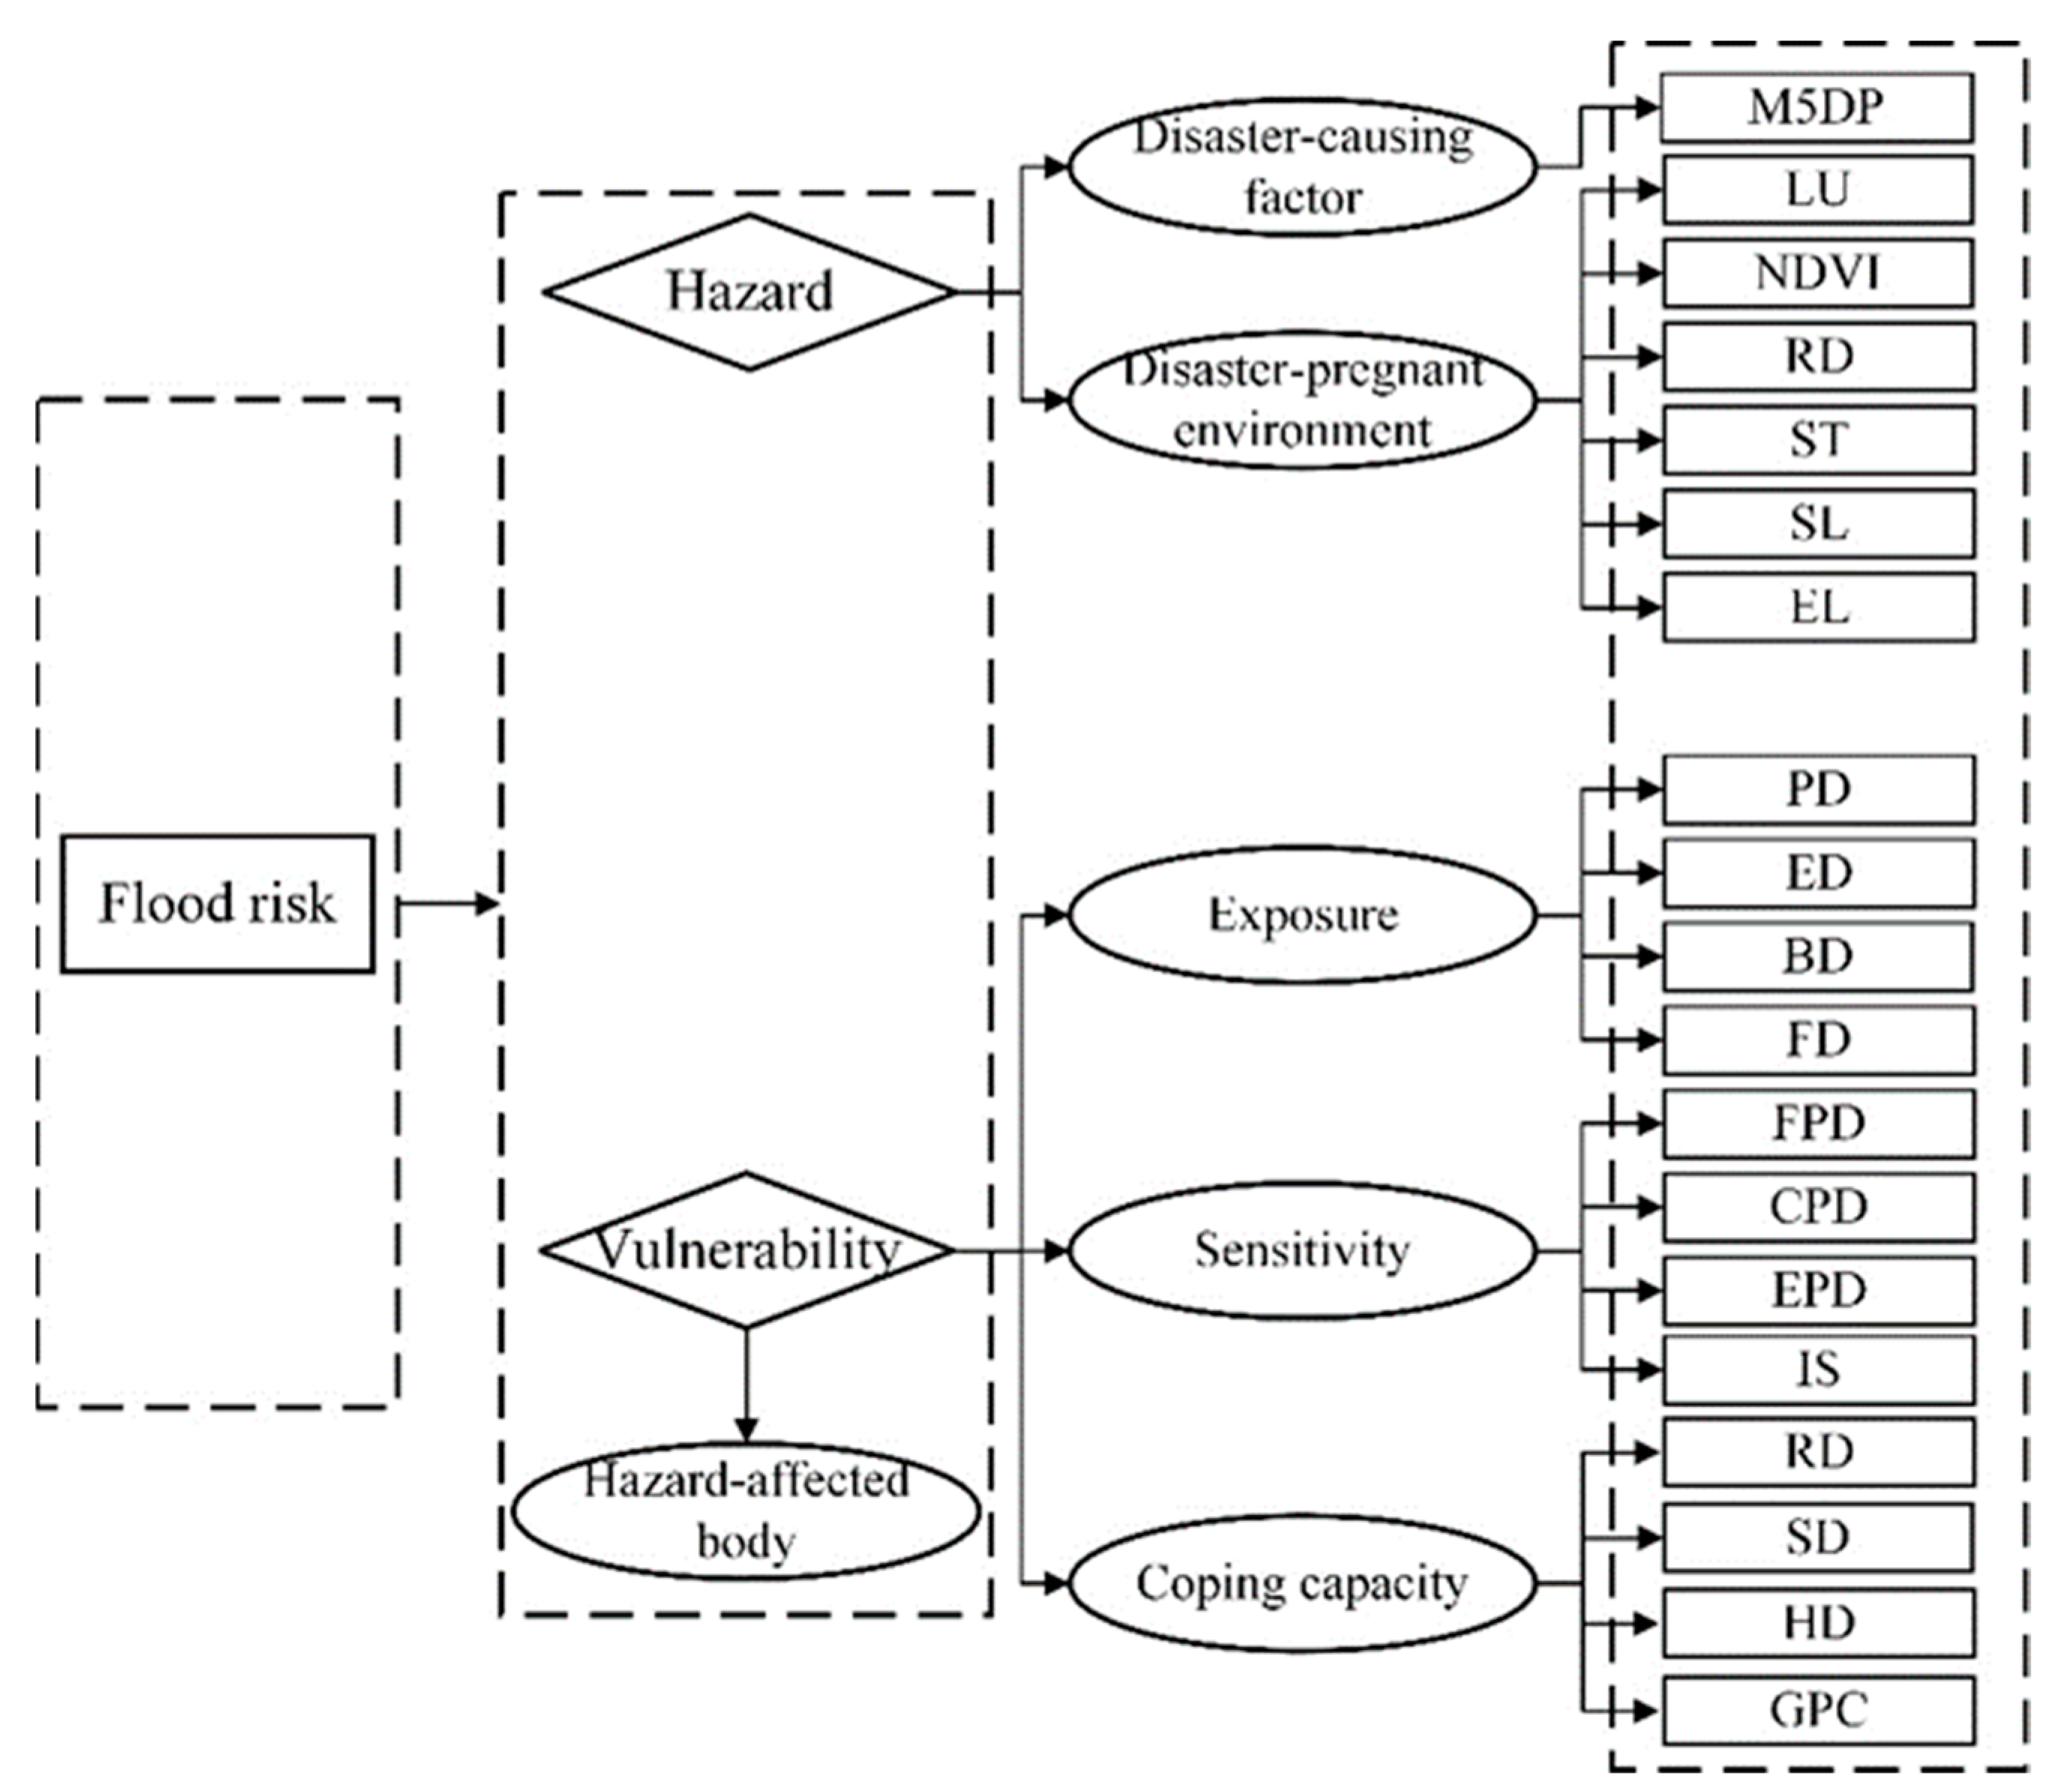
2.3. Flood Risk Index System
3. Methods
3.1. The Triangular Fuzzy Number-Based Analytic Hierarchy Process
3.2. Entropy Weight
3.3. Game Theory
- (1)
- We obtain I weights for n indexes according to I categories of weighting methods, since , i = 1, 2, …, I, and m = 1, 2, …, n. Therefore, we can construct a weight vector: ;
- (2)
- The possible combined weight, , is achieved by collecting and combining information on multiple weighting approaches. From this, we can see that ω* is denoted by W, as shown in Equation (1):
- (3)
- Suppose there exists a most appropriate linear combination of coefficients α*, such that the deviation between ω* and ωi (i = 1, 2, …, I) is minimized to achieve a compromise between the I weights. Thus, the optimization function is to minimize the deviations between ω* and ωi:
- (4)
- The weight coefficients are calculated and then normalized to obtain α*:
3.4. Flood Risk Calculation and Gradation
4. Results and Discussion
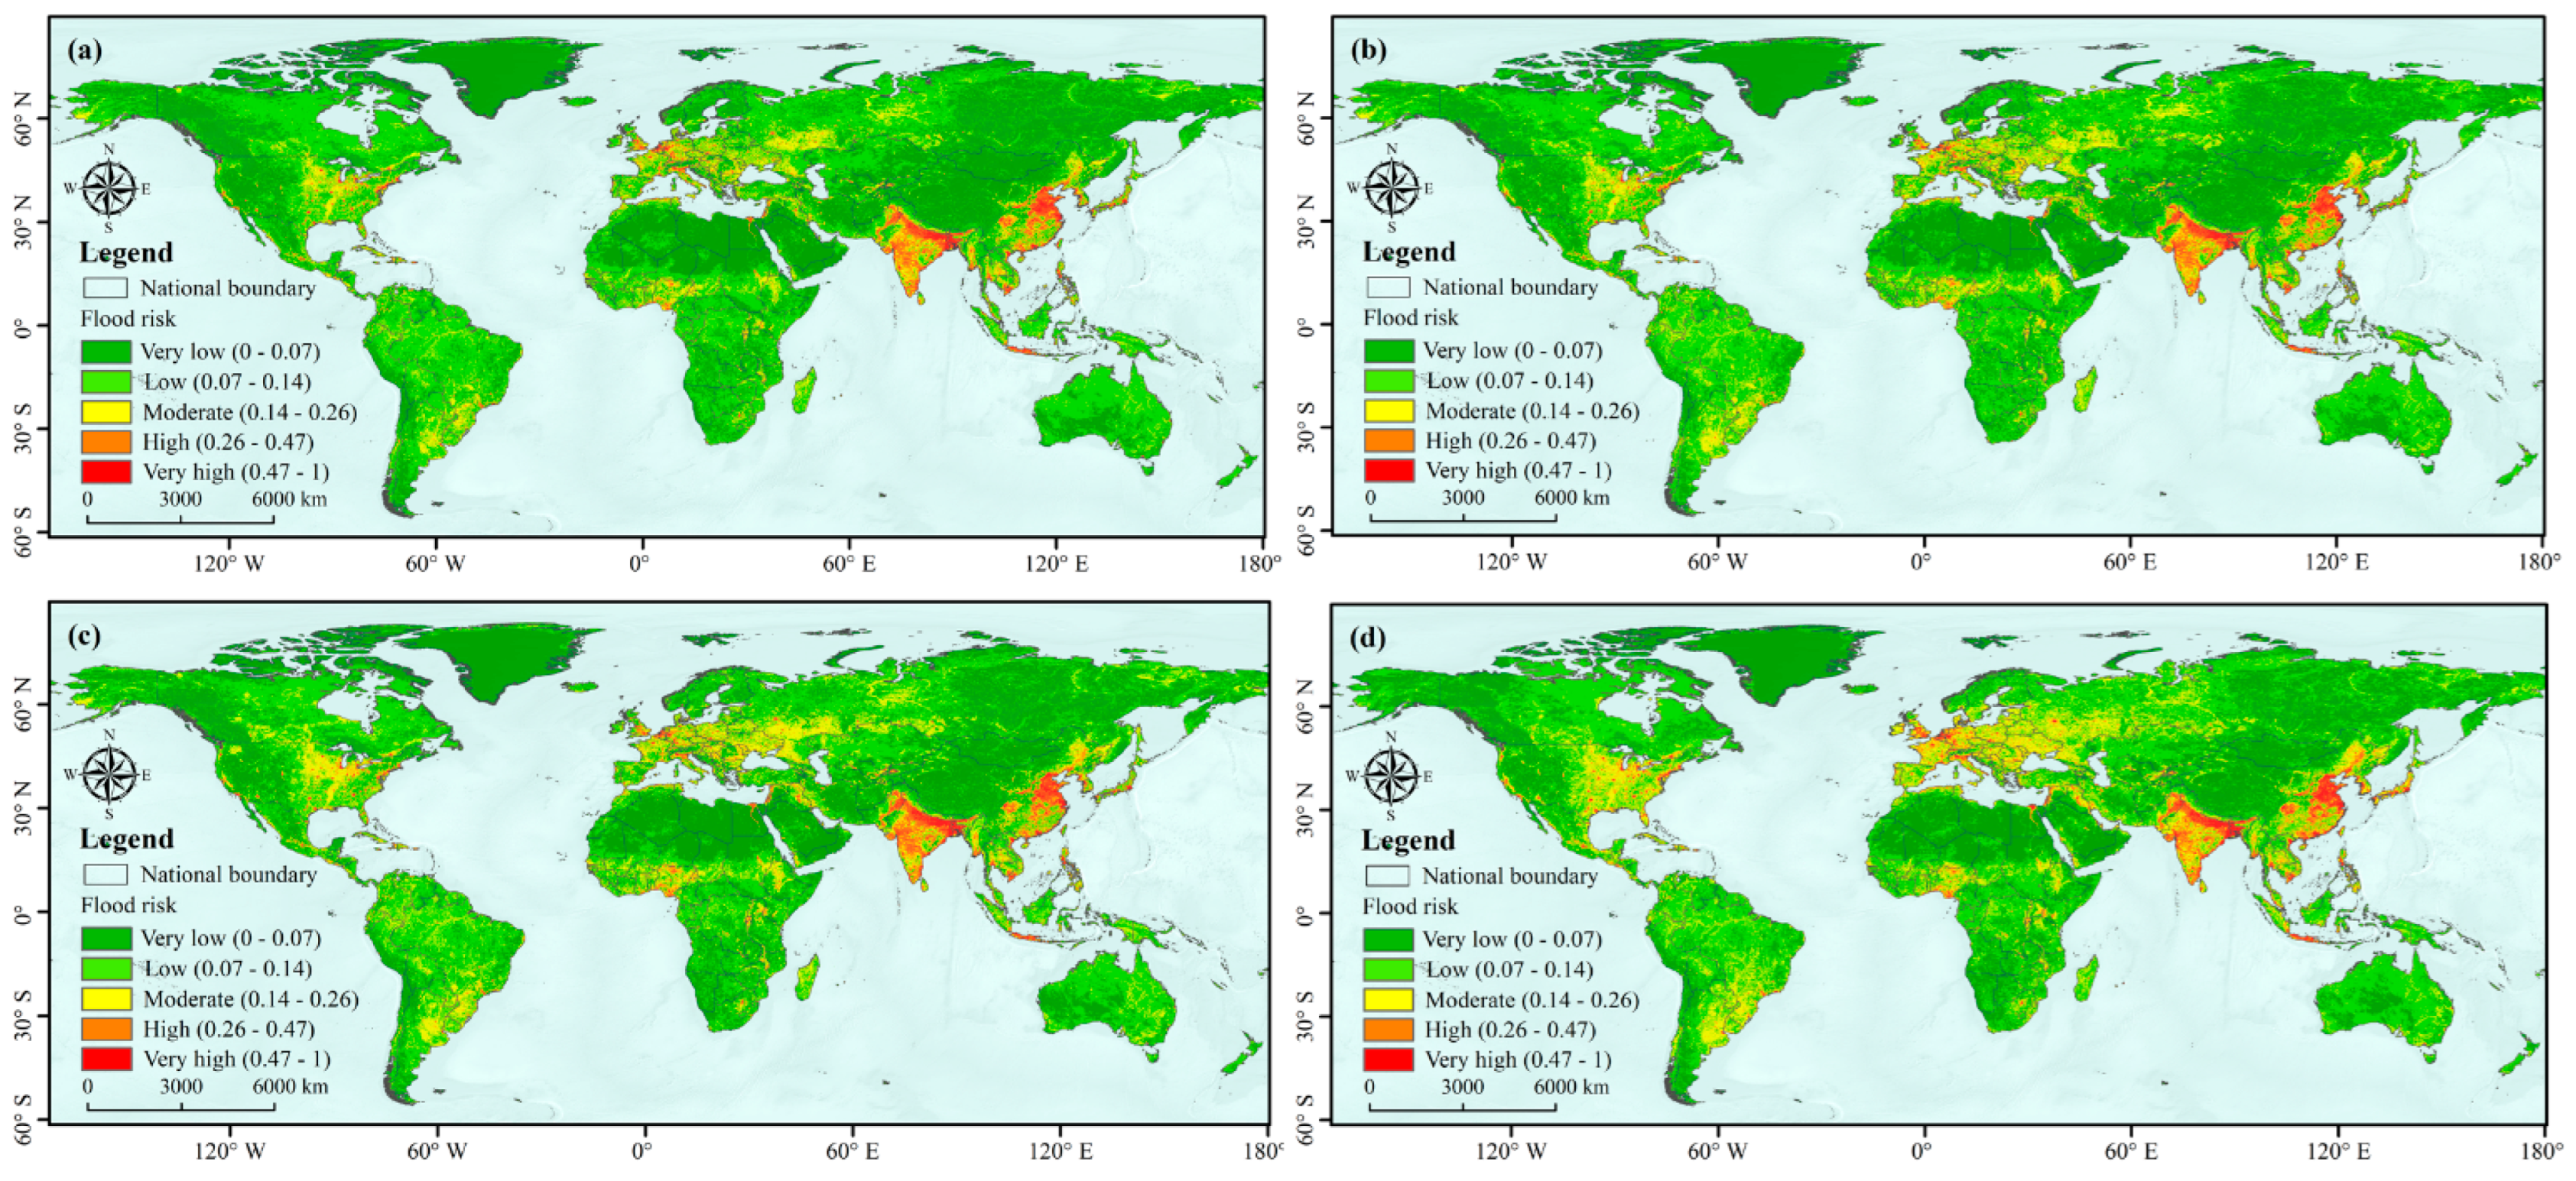
4.1. Spatiotemporal Variations in Global Risk on the Grid Scale
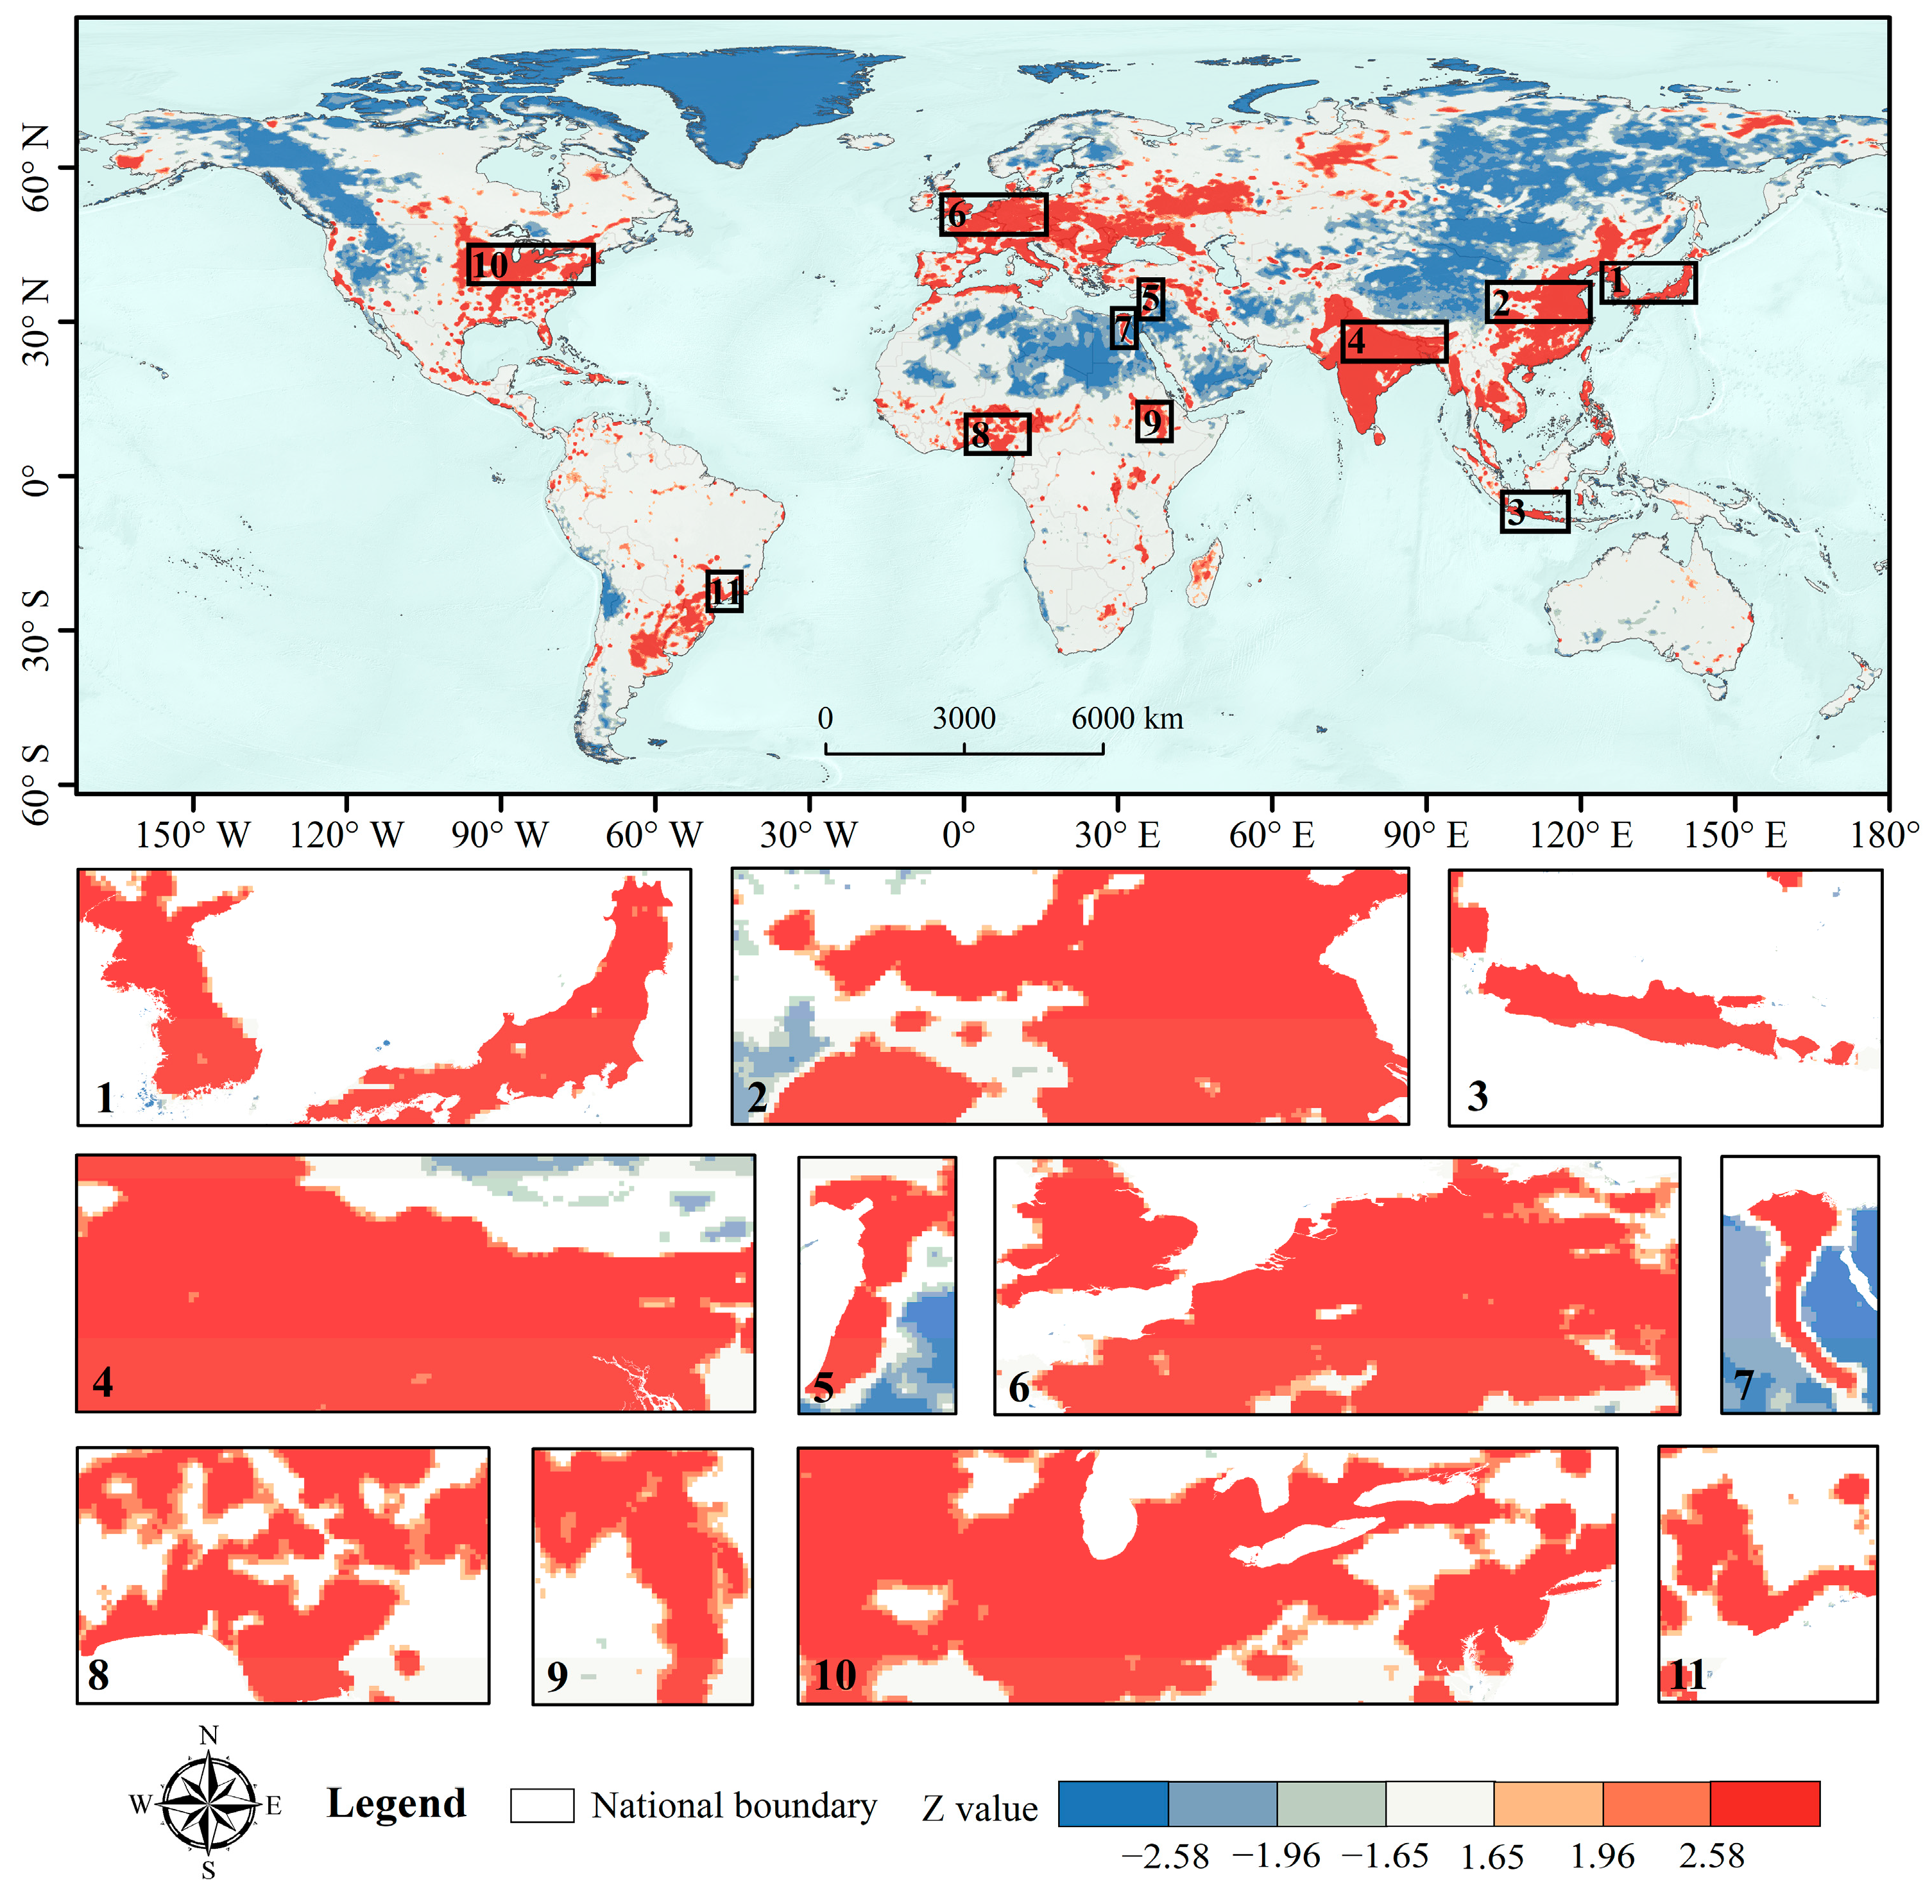
4.2. Spatiotemporal Variations in Global Risk Hotspots
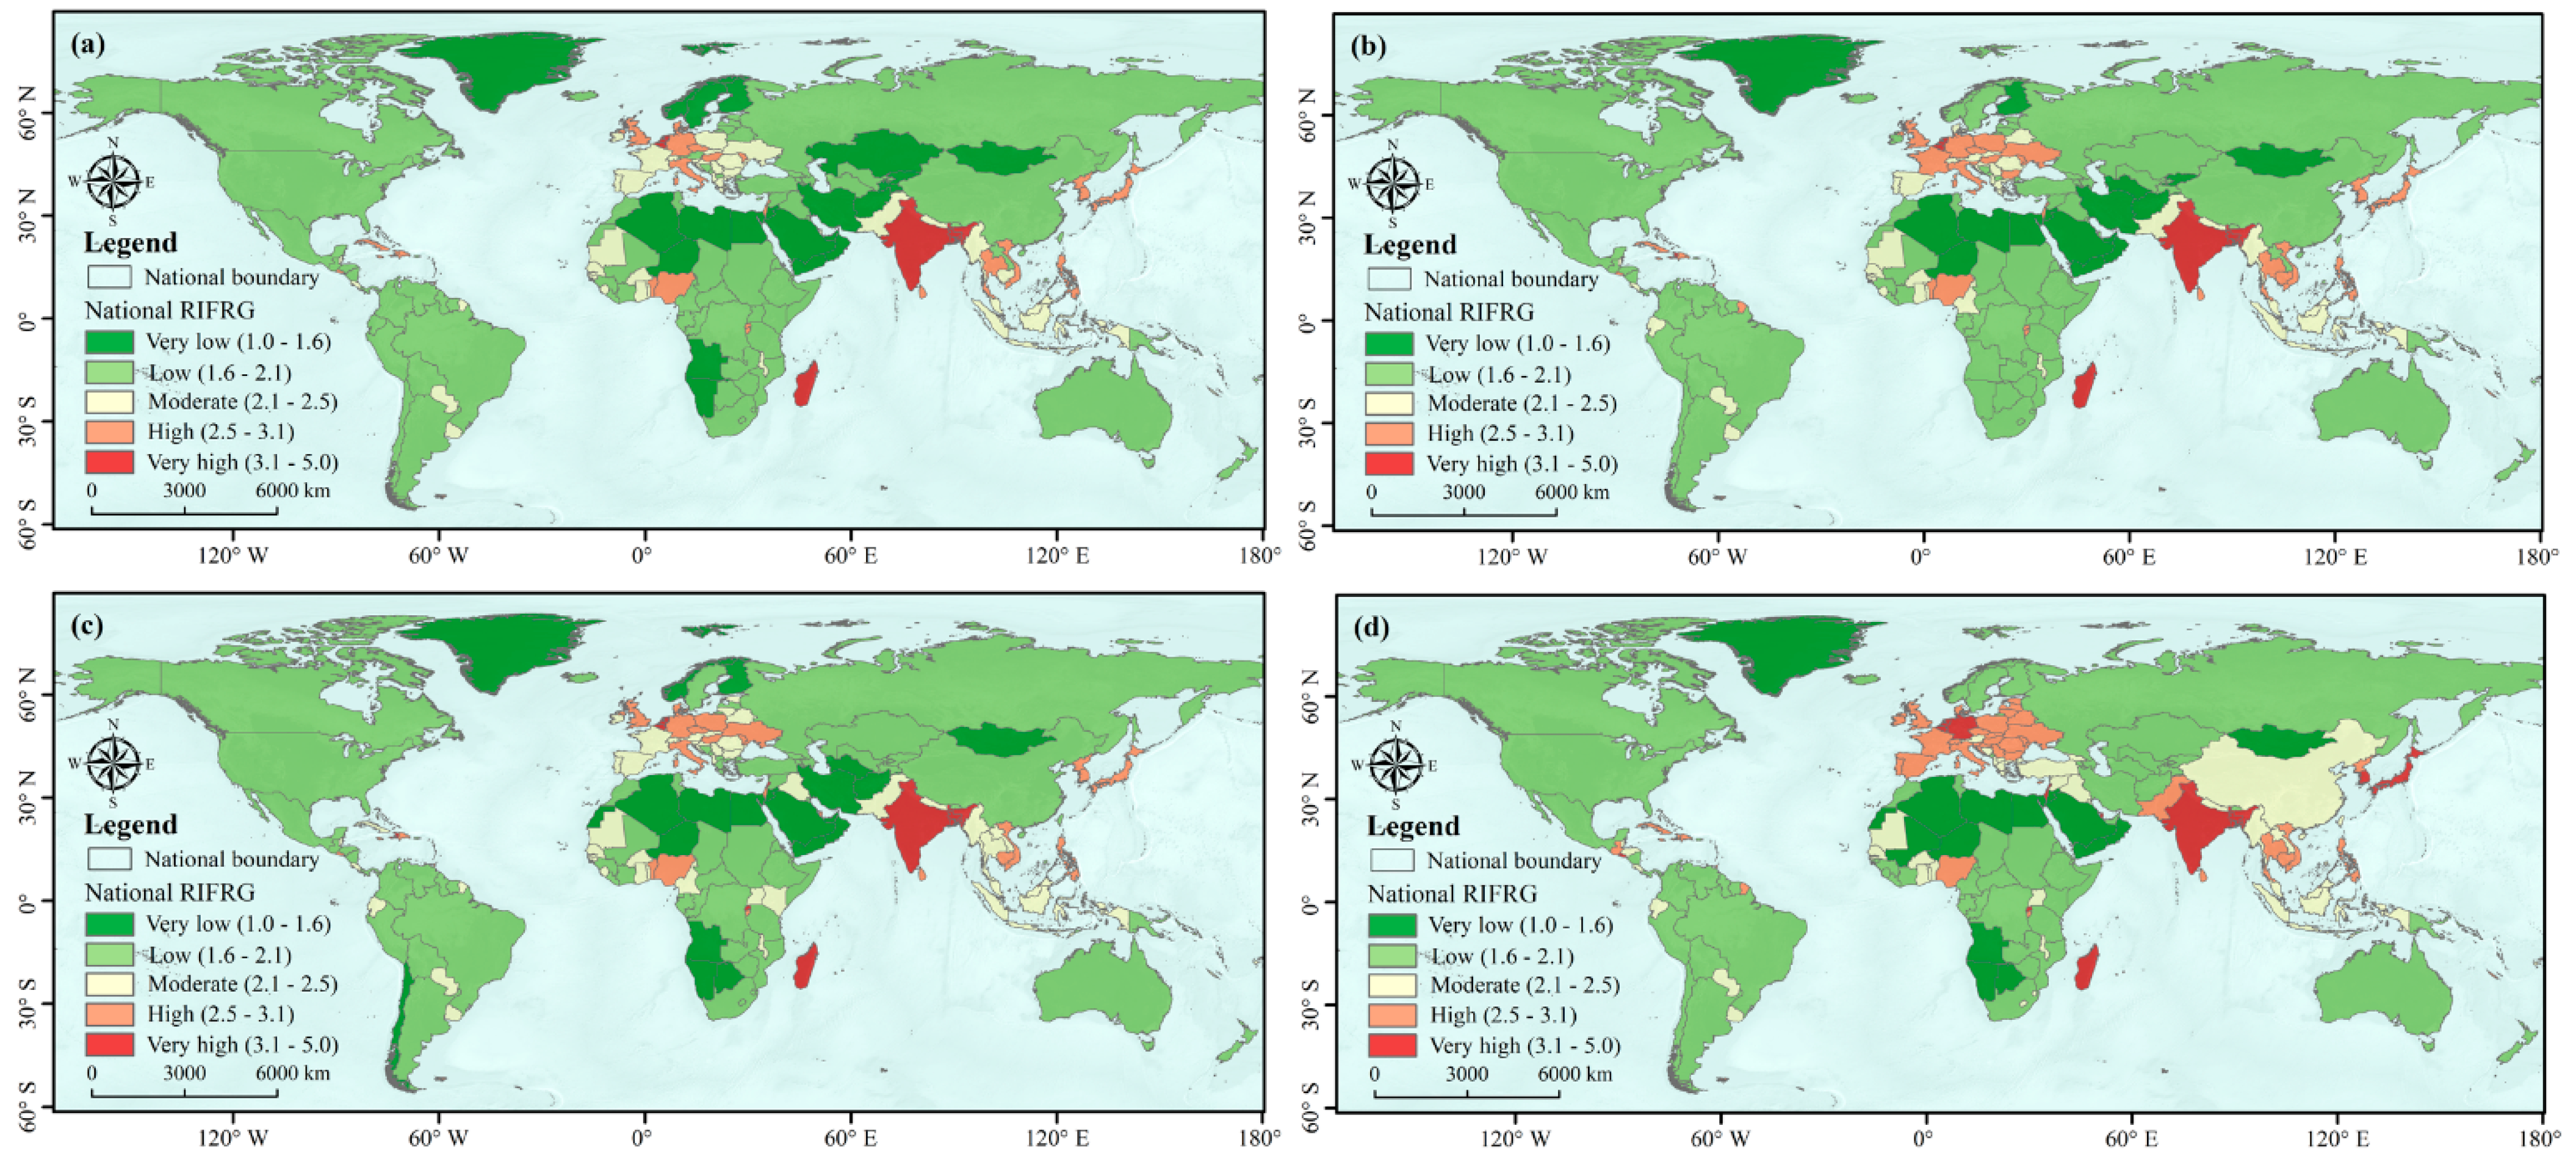
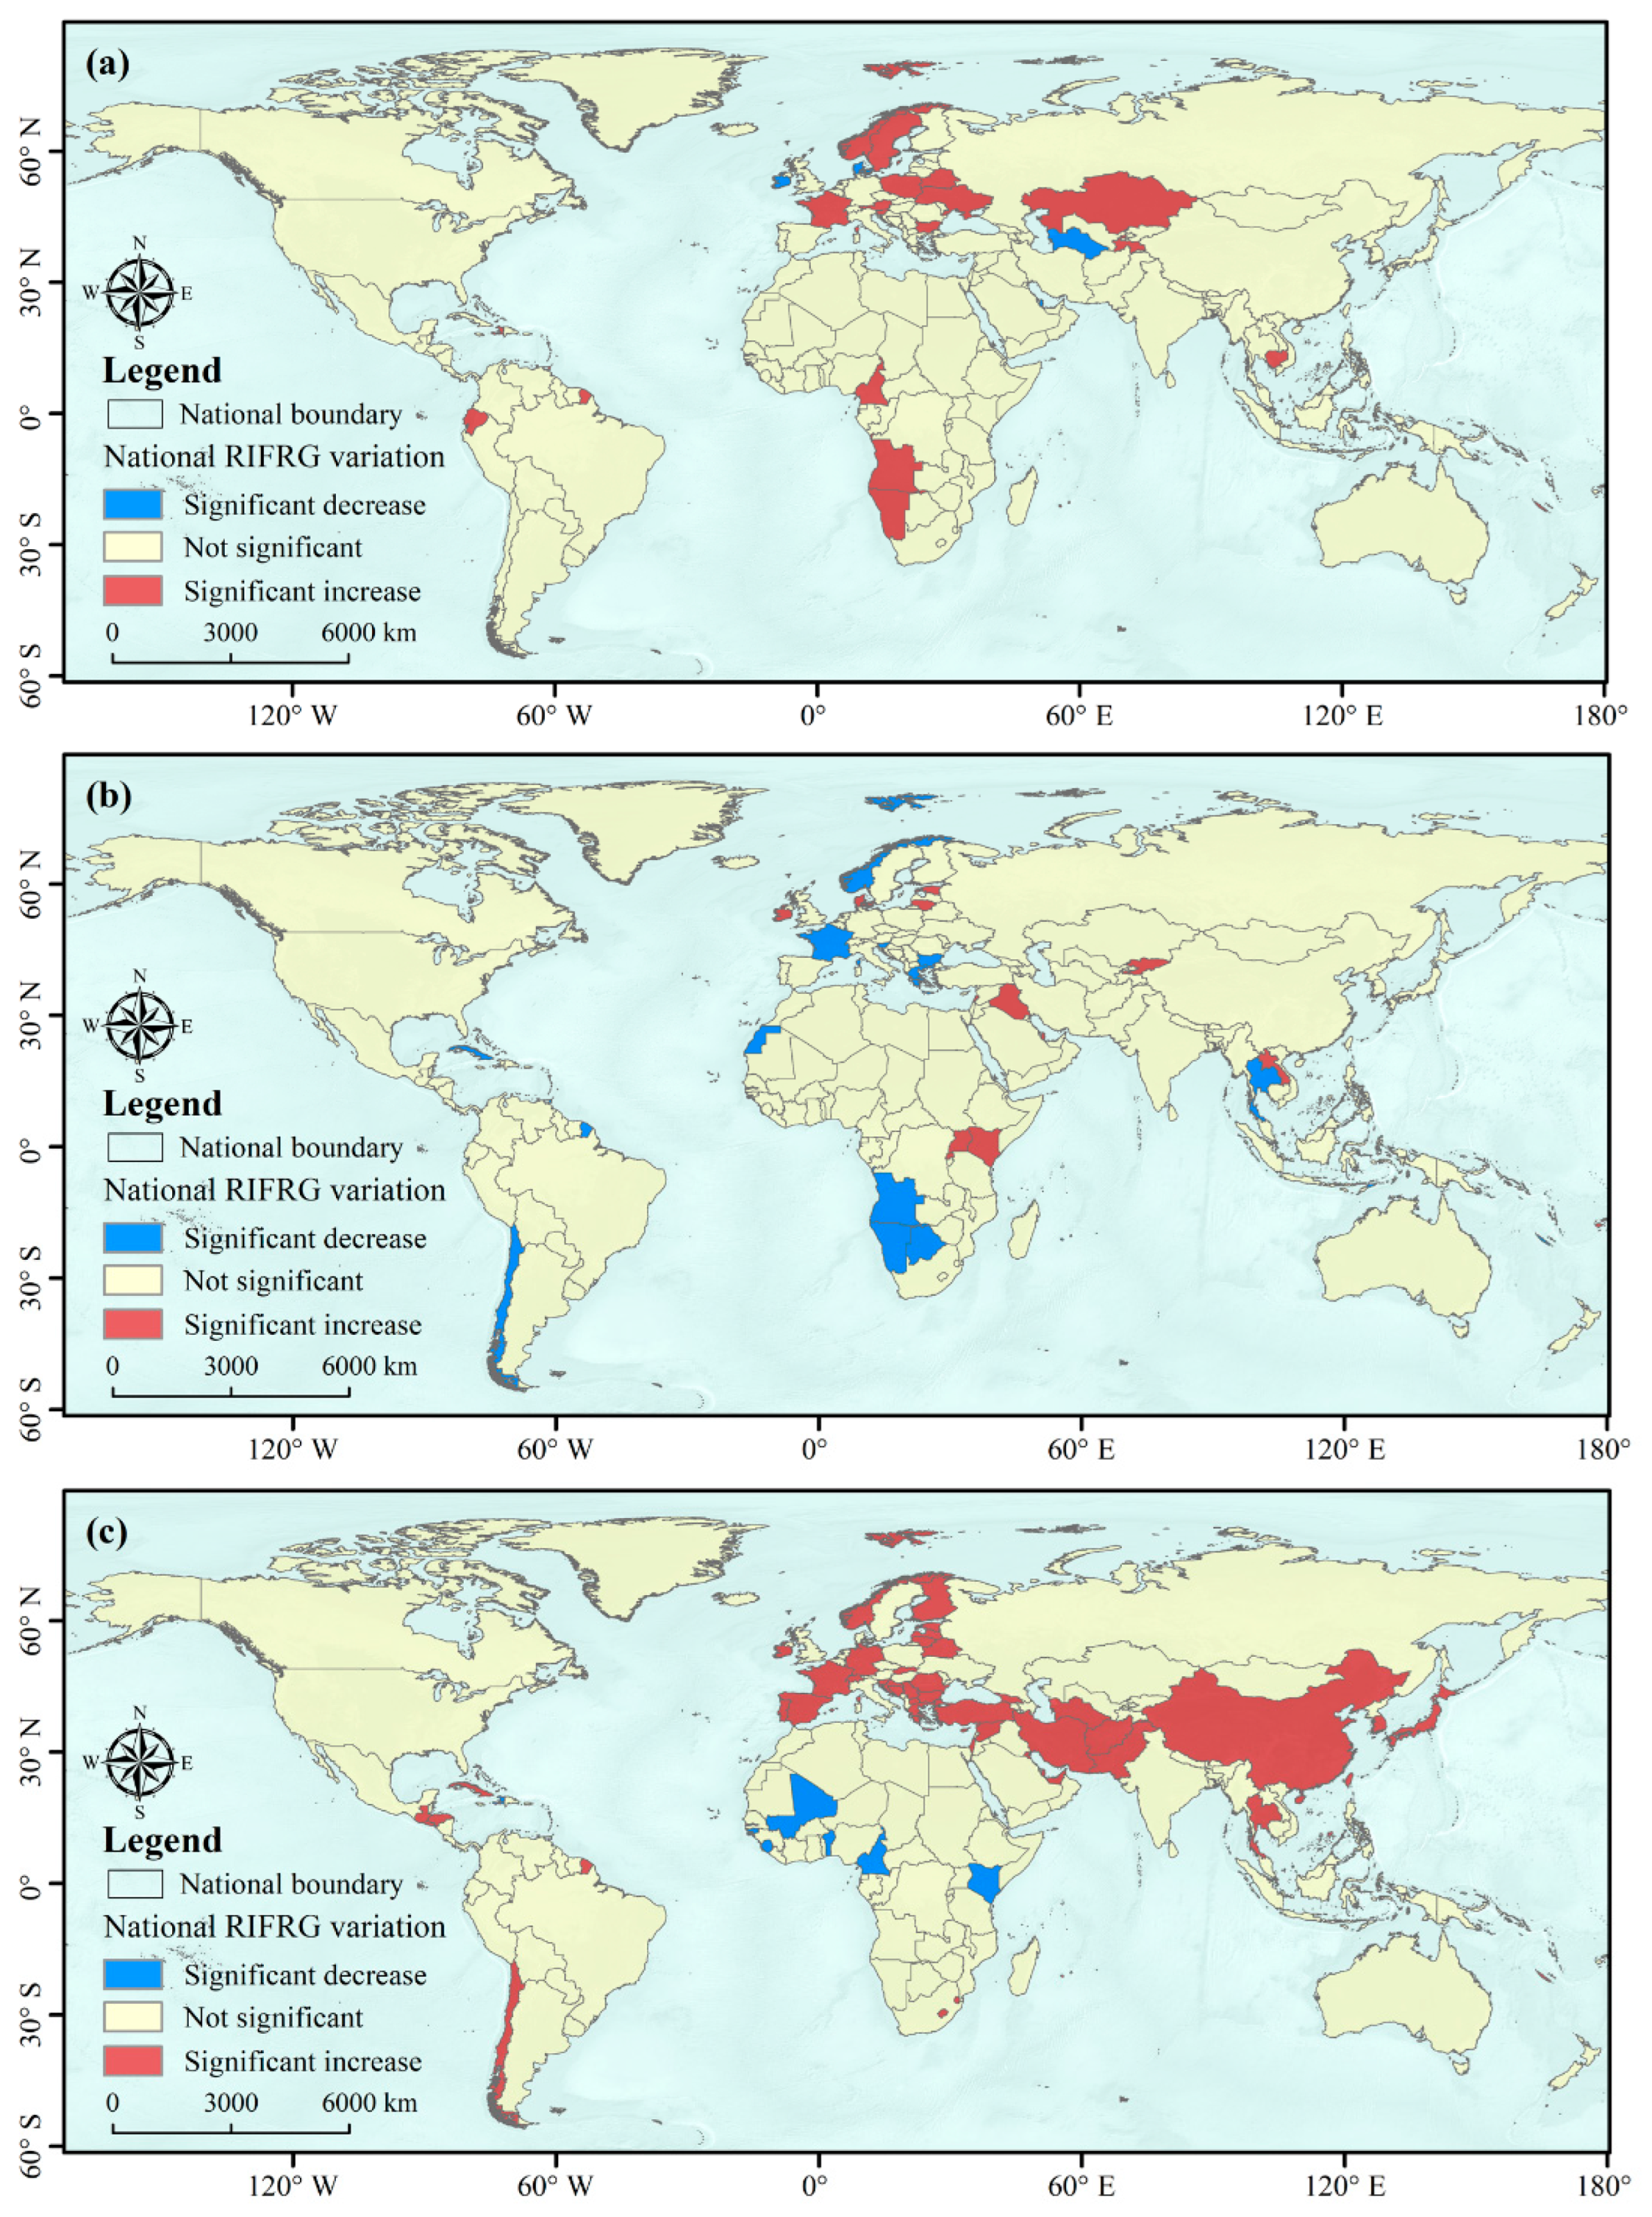
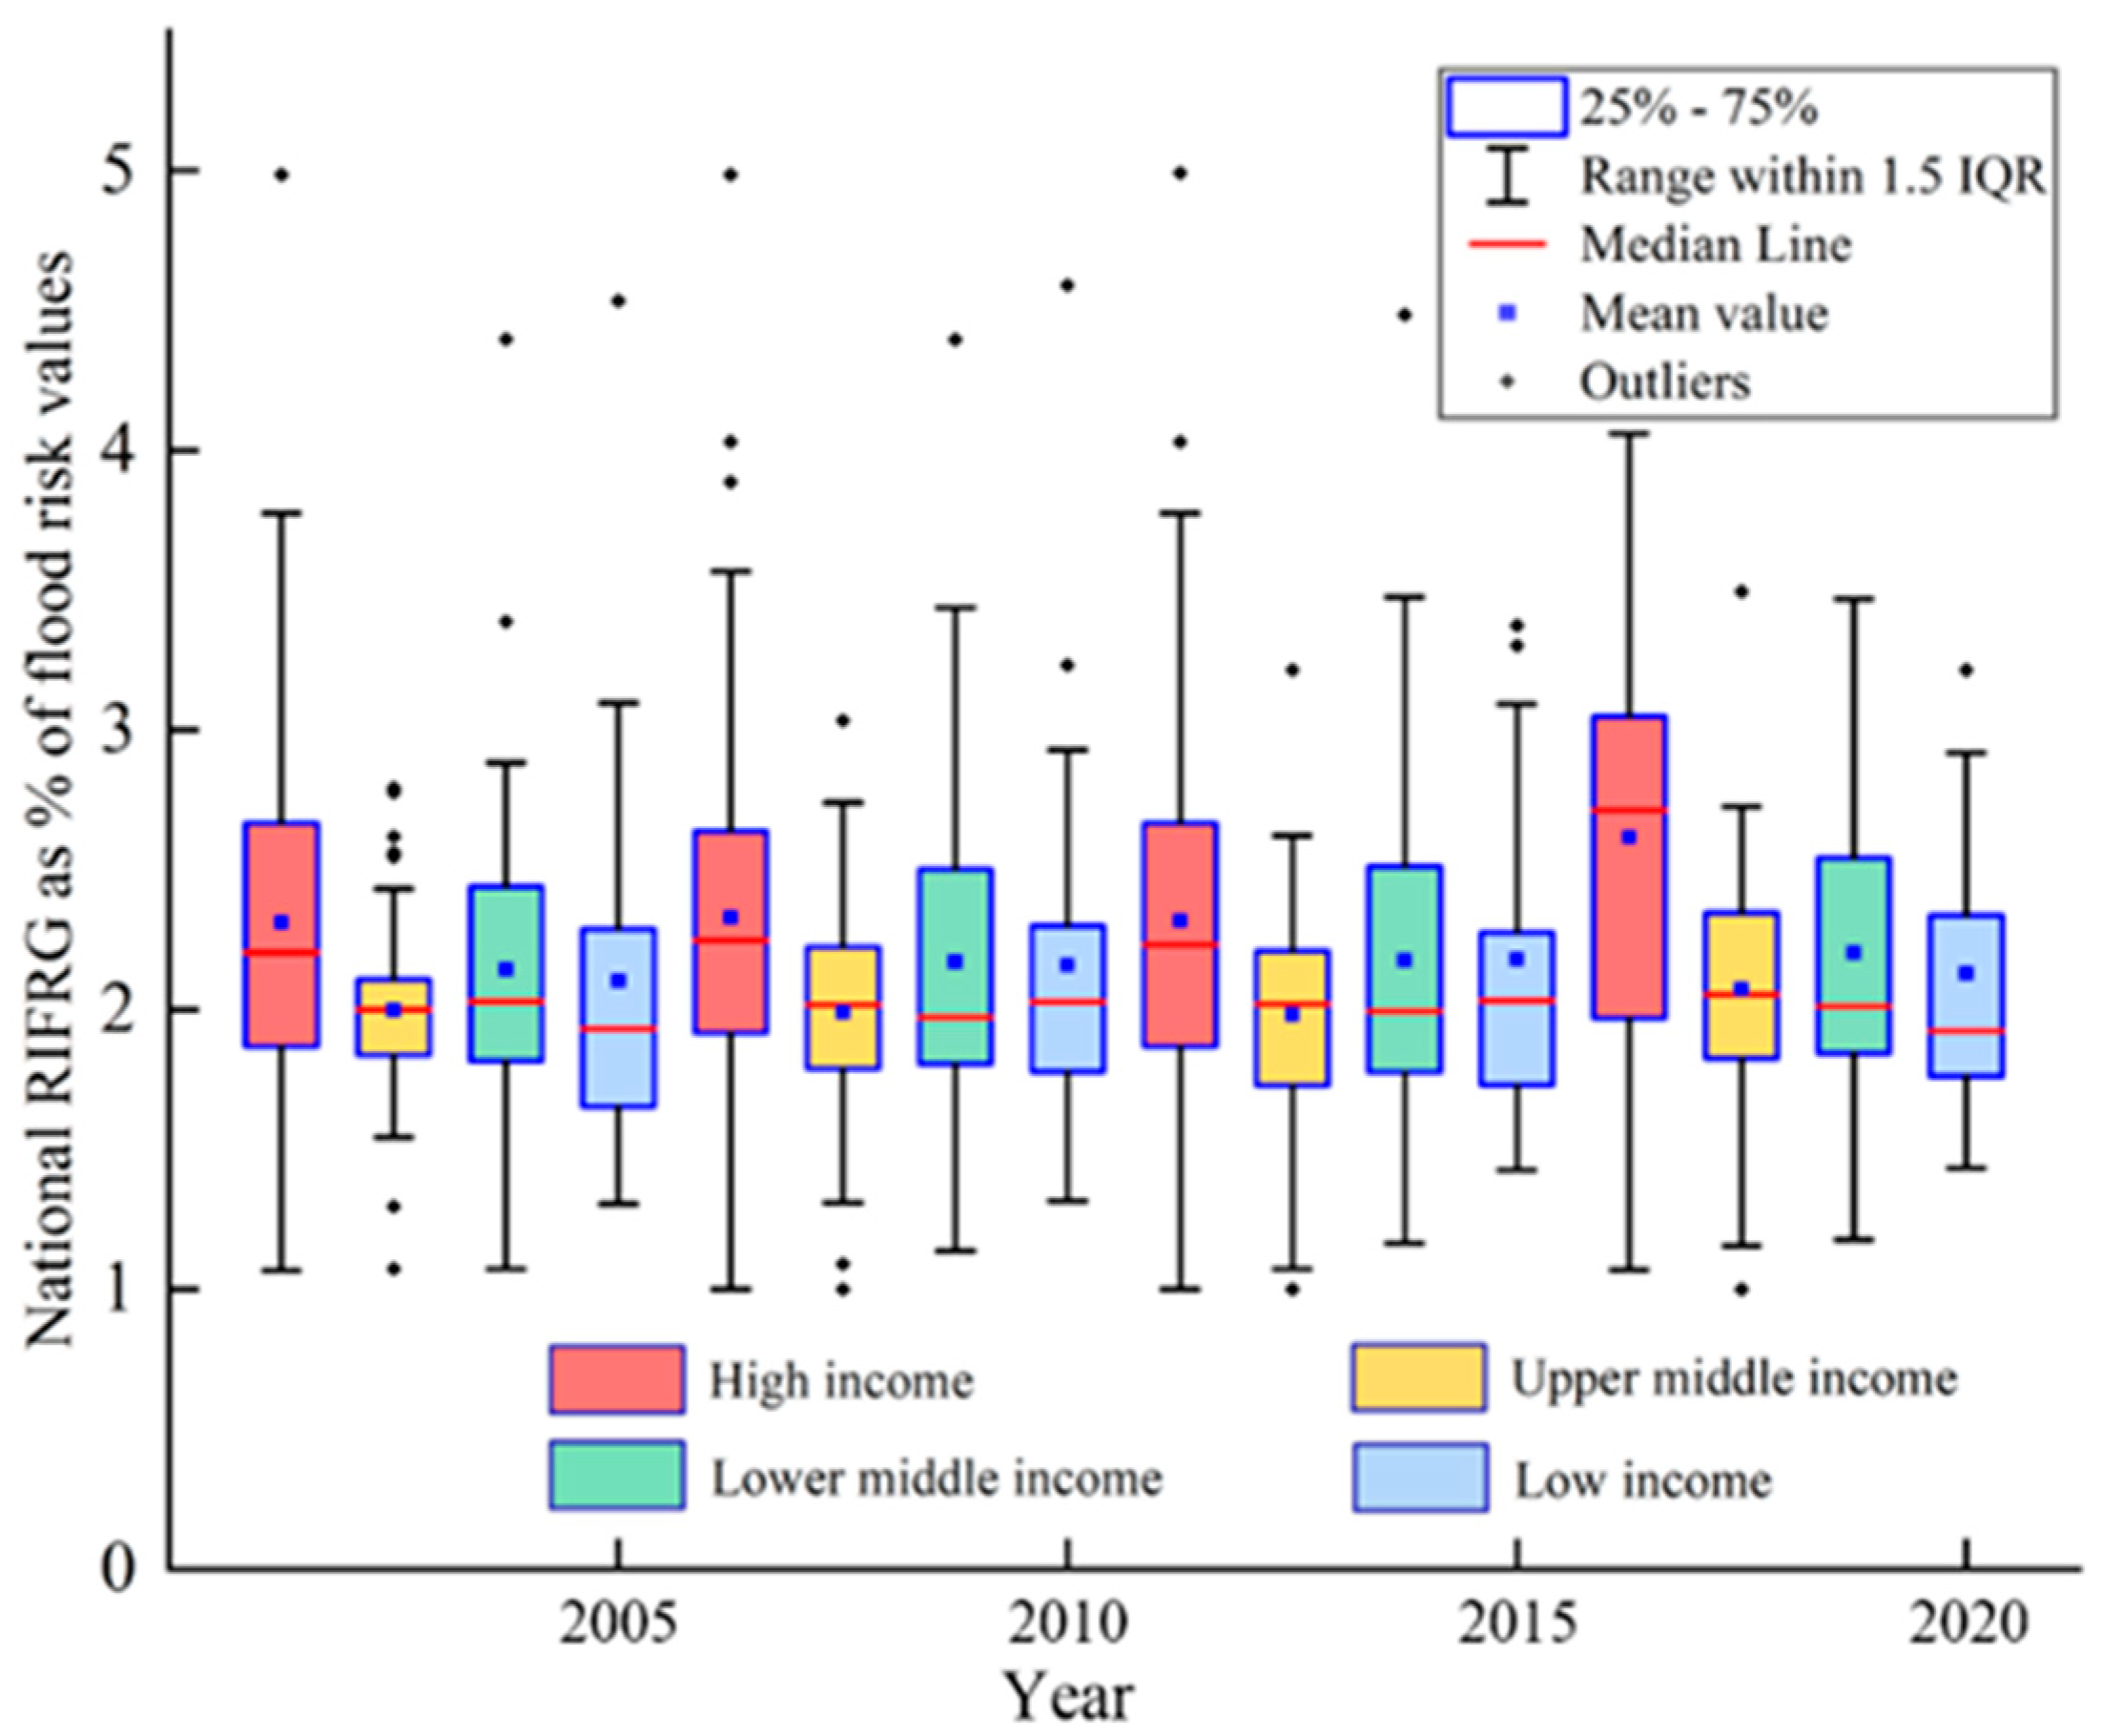
4.3. Spatiotemporal Distribution of Flood Risk on the National Scale
4.4. Temporal Evolution of Flood Risk at the Continental Scale
4.5. Implications and Limitations
5. Conclusions
Author Contributions
Funding
Data Availability Statement
Conflicts of Interest
References
- UNDRR. Human Cost of Disasters: An Overview of the Last 20 Years 2000–2019; United Nations for Disaster Risk Reduction (UNISDR): Geneva, Switzerland, 2020. [Google Scholar]
- Njock, P.G.A.; Shen, S.L.; Zhou, A.; Lyu, H.M. Evaluation of soil liquefaction using AI technology incorporating a coupled ENN/t-SNE model. Soil Dyn. Earthq. Eng. 2020, 130, 105988. [Google Scholar] [CrossRef]
- He, Y.Y.; Zhou, J.Z.; Kou, P.G.; Lu, N.; Zou, Q. A fuzzy clustering iterative model using chaotic differential evolution algorithm for evaluating flood disaster. Expert Syst. Appl. 2011, 38, 10060–10065. [Google Scholar] [CrossRef]
- Jevrejeva, S.; Jackson, L.P.; Grinsted, A.; Lincke, D.; Marzeion, B. Flood damage costs under the sea level rise with warming of 1.5 degrees C and 2 degrees C. Environ. Res. Lett. 2018, 13, 074014. [Google Scholar] [CrossRef]
- Zhang, Q.; Li, J.F.; Singh, V.P.; Xiao, M.Z. Spatio-temporal relations between temperature and precipitation regimes: Implications for temperature-induced changes in the hydrological cycle. Glob. Planet. Change 2013, 111, 57–76. [Google Scholar] [CrossRef]
- Li, J.F.; Chen, Y.D.; Zhang, L.; Zhang, Q.; Chiew, F.H.S. Future Changes in Floods and Water Availability across China: Linkage with Changing Climate and Uncertainties. J. Hydrometeorol. 2016, 17, 1295–1314. [Google Scholar] [CrossRef]
- Jongman, B.; Ward, P.J.; Aerts, J. Global exposure to river and coastal flooding: Long term trends and changes. Glob. Environ. Change-Hum. Policy Dimens. 2012, 22, 823–835. [Google Scholar] [CrossRef]
- Swain, D.L.; Wing, O.E.J.; Bates, P.D.; Done, J.M.; Johnson, K.A.; Cameron, D.R. Increased Flood Exposure Due to Climate Change and Population Growth in the United States. Earths Future 2020, 8, e2020EF001778. [Google Scholar] [CrossRef]
- Rentschler, J.; Salhab, M.; Jafino, B.A. Flood exposure and poverty in 188 countries. Nat. Commun. 2022, 13, 3527. [Google Scholar] [CrossRef]
- Hirabayashi, Y.; Mahendran, R.; Koirala, S.; Konoshima, L.; Yamazaki, D.; Watanabe, S.; Kim, H.; Kanae, S. Global flood risk under climate change. Nat. Clim. Change 2013, 3, 816–821. [Google Scholar] [CrossRef]
- UNISDR. Sendai Framework for Disaster Risk Reduction 2015–2030; UNISDR: Geneva, Switzerland, 2015. [Google Scholar]
- Jongman, B.; Winsemius, H.C.; Aerts, J.; de Perez, E.C.; van Aalst, M.K.; Kron, W.; Ward, P.J. Declining vulnerability to river floods and the global benefits of adaptation. Proc. Natl. Acad. Sci. USA 2015, 112, E2271–E2280. [Google Scholar] [CrossRef]
- Ward, P.J.; Jongman, B.; Aerts, J.; Bates, P.D.; Botzen, W.J.W.; Loaiza, A.D.; Hallegatte, S.; Kind, J.M.; Kwadijk, J.; Scussolini, P.; et al. A global framework for future costs and benefits of river-flood protection in urban areas. Nat. Clim. Change 2017, 7, 642–646. [Google Scholar] [CrossRef]
- Tellman, B.; Sullivan, J.A.; Kuhn, C.; Kettner, A.J.; Doyle, C.S.; Brakenridge, G.R.; Erickson, T.A.; Slayback, D.A. Satellite imaging reveals increased proportion of population exposed to floods. Nature 2021, 596, 80–86. [Google Scholar] [CrossRef] [PubMed]
- Ward, P.J.; Blauhut, V.; Bloemendaal, N.; Daniell, J.E.; de Ruiter, M.C.; Duncan, M.J.; Emberson, R.; Jenkins, S.F.; Kirschbaum, D.; Kunz, M.; et al. Review article: Natural hazard risk assessments at the global scale. Nat. Hazards Earth Syst. Sci. 2020, 20, 1069–1096. [Google Scholar] [CrossRef]
- Fang, J.; Li, M.J.; Wang, J.A.; Shi, P.J. Assessment and mapping of global fluvial flood risk. J. Nat. Disasters 2015, 24, 1–8. [Google Scholar] [CrossRef]
- He, Y.F.; Ma, D.Y.; Xiong, J.N.; Cheng, W.M.; Jia, H.L.; Wang, N.; Guo, L.; Duan, Y.; Liu, J.; Yang, G. Flash flood vulnerability assessment of roads in China based on support vector machine. Geocarto Int. 2022, 37, 6141–6164. [Google Scholar] [CrossRef]
- Lyu, H.M.; Shen, S.L.; Zhou, A.N.; Zhou, W.H. Flood risk assessment of metro systems in a subsiding environment using the interval FAHP-FCA approach. Sustain. Cities Soc. 2019, 50, 101682. [Google Scholar] [CrossRef]
- Pham, B.T.; Luu, C.; Phong, T.V.; Nguyen, H.D.; Le, H.V.; Tran, T.Q.; Ta, H.T.; Prakash, I. Flood risk assessment using hybrid artificial intelligence models integrated with multi-criteria decision analysis in Quang Nam Province, Vietnam. J. Hydrol. 2021, 592, 125815. [Google Scholar] [CrossRef]
- Alfieri, L.; Feyen, L.; Dottori, F.; Bianchi, A. Ensemble flood risk assessment in Europe under high end climate scenarios. Glob. Environ. Change-Hum. Policy Dimens. 2015, 35, 199–212. [Google Scholar] [CrossRef]
- Tyler, J.; Sadiq, A.A.; Noonan, D.S. A review of the community flood risk management literature in the USA: Lessons for improving community resilience to floods. Nat. Hazards 2019, 96, 1223–1248. [Google Scholar] [CrossRef]
- Thaler, T.; Fuchs, S. Financial recovery schemes in Austria: How planned relocation is used as an answer to future flood events. Environ. Hazards-Hum. Policy Dimens. 2020, 19, 268–284. [Google Scholar] [CrossRef]
- Siders, A.R. Social justice implications of US managed retreat buyout programs. Clim. Change 2019, 152, 239–257. [Google Scholar] [CrossRef]
- D’Oria, M.; Maranzoni, A.; Mazzoleni, M. Probabilistic Assessment of Flood Hazard due to Levee Breaches Using Fragility Functions. Water Resour. Res. 2019, 55, 8740–8764. [Google Scholar] [CrossRef]
- Mazzoleni, M.; Mard, J.; Rusca, M.; Odongo, V.; Lindersson, S.; Di Baldassarre, G. Floodplains in the Anthropocene: A Global Analysis of the Interplay Between Human Population, Built Environment, and Flood Severity. Water Resour. Res. 2021, 57, e2020WR027744. [Google Scholar] [CrossRef]
- Haer, T.; Husby, T.G.; Botzen, W.J.W.; Aerts, J. The safe development paradox: An agent-based model for flood risk under climate change in the European Union. Glob. Environ. Change-Hum. Policy Dimens. 2020, 60, 102009. [Google Scholar] [CrossRef]
- Zhao, S.J.; Huang, C.F.; Guo, S.J. Scenario-driven risk analysis of regional natural disasters. J. Nat. Disasters 2012, 21, 9–17. [Google Scholar] [CrossRef]
- Bernhofen, M.V.; Cooper, S.; Trigg, M.; Mdee, A.; Carr, A.; Bhave, A.; Solano-Correa, Y.T.; Pencue-Fierro, E.L.; Teferi, E.; Haile, A.T.; et al. The Role of Global Data Sets for Riverine Flood Risk Management at National Scales. Water Resour. Res. 2022, 58, e2021WR031555. [Google Scholar] [CrossRef]
- Emerton, R.; Cloke, H.; Ficchi, A.; Hawker, L.; de Wit, S.; Speight, L.; Prudhomme, C.; Rundell, P.; West, R.; Neal, J.; et al. Emergency flood bulletins for Cyclones Idai and Kenneth: A critical evaluation of the use of global flood forecasts for international humanitarian preparedness and response. Int. J. Disaster Risk Reduct. 2020, 50, 101811. [Google Scholar] [CrossRef]
- Ward, P.J.; Jongman, B.; Salamon, P.; Simpson, A.; Bates, P.; De Groeve, T.; Muis, S.; de Perez, E.C.; Rudari, R.; Trigg, M.A.; et al. Usefulness and limitations of global flood risk models. Nat. Clim. Change 2015, 5, 712–715. [Google Scholar] [CrossRef]
- Hu, P.; Zhang, Q.; Shi, P.J.; Chen, B.; Fang, J.Y. Flood-induced mortality across the globe: Spatiotemporal pattern and influencing factors. Sci. Total Environ. 2018, 643, 171–182. [Google Scholar] [CrossRef]
- Bates, P.D.; Quinn, N.; Sampson, C.; Smith, A.; Wing, O.; Sosa, J.; Savage, J.; Olcese, G.; Neal, J.; Schumann, G.; et al. Combined Modeling of US Fluvial, Pluvial, and Coastal Flood Hazard Under Current and Future Climates. Water Resour. Res. 2021, 57, e2020WR028673. [Google Scholar] [CrossRef]
- Liu, J.; Wang, J.Y.; Xiong, J.N.; Cheng, W.M.; Li, Y.; Cao, Y.F.; He, Y.F.; Duan, Y.; He, W.; Yang, G. Assessment of flood susceptibility mapping using support vector machine, logistic regression and their ensemble techniques in the Belt and Road region. Geocarto Int. 2022, 1–30. [Google Scholar] [CrossRef]
- Alfieri, L.; Bisselink, B.; Dottori, F.; Naumann, G.; de Roo, A.; Salamon, P.; Wyser, K.; Feyen, L. Global projections of river flood risk in a warmer world. Earths Future 2017, 5, 171–182. [Google Scholar] [CrossRef]
- Mahmoud, S.H.; Gan, T.Y. Multi-criteria approach to develop flood susceptibility maps in arid regions of Middle East. J. Clean Prod. 2018, 196, 216–229. [Google Scholar] [CrossRef]
- Tehrany, M.S.; Pradhan, B.; Jebur, M.N. Spatial prediction of flood susceptible areas using rule based decision tree (DT) and a novel ensemble bivariate and multivariate statistical models in GIS. J. Hydrol. 2013, 504, 69–79. [Google Scholar] [CrossRef]
- Tehrany, M.S.; Pradhan, B.; Jebur, M.N. Flood susceptibility mapping using a novel ensemble weights-of-evidence and support vector machine models in GIS. J. Hydrol. 2014, 512, 332–343. [Google Scholar] [CrossRef]
- Kummu, M.; Taka, M.; Guillaume, J.H.A. Data Descriptor: Gridded global datasets for Gross Domestic Product and Human Development Index over 1990–2015. Sci. Data 2018, 5, 180004. [Google Scholar] [CrossRef]
- Murakami, D.; Yamagata, Y. Estimation of Gridded Population and GDP Scenarios with Spatially Explicit Statistical Downscaling. Sustainability 2019, 11, 2106. [Google Scholar] [CrossRef]
- Duan, Y.; Xiong, J.N.; Cheng, W.M.; Wang, N.; Li, Y.; He, Y.F.; Liu, J.; He, W.; Yang, G. Flood vulnerability assessment using the triangular fuzzy number-based analytic hierarchy process and support vector machine model for the Belt and Road region. Nat. Hazards 2022, 110, 269–294. [Google Scholar] [CrossRef]
- Shi, P.J. Theory on disaster science and disaster dynamics. J. Nat. Disasters 2002, 512, 332–343. [Google Scholar]
- Imamura, Y. Development of a Method for Assessing Country-Based Flood Risk at the Global Scale. Int. J. Disaster Risk Sci. 2022, 13, 87–99. [Google Scholar] [CrossRef]
- Lyu, H.M.; Shen, S.L.; Zhou, A.N.; Yang, J. Risk assessment of mega-city infrastructures related to land subsidence using improved trapezoidal FAHP. Sci. Total Environ. 2020, 717, 135310. [Google Scholar] [CrossRef] [PubMed]
- Lyu, H.M.; Zhou, W.H.; Shen, S.L.; Zhou, A.N. Inundation risk assessment of metro system using AHP and TFN-AHP in Shenzhen. Sustain. Cities Soc. 2020, 56, 102103. [Google Scholar] [CrossRef]
- Shannon, C.E. A Mathematical Theory of Communication. Bell Syst. Tech. J. 1948, 27, 379–423. [Google Scholar] [CrossRef]
- Lin, J.Y.; He, P.T.; Yang, L.; He, X.Y.; Lu, S.Y.; Liu, D.Y. Predicting future urban waterlogging-prone areas by coupling the maximum entropy and FLUS model. Sustain. Cities Soc. 2022, 80, 103812. [Google Scholar] [CrossRef]
- Zeng, Z.P.; Li, Y.J.; Lan, J.Y.; Hamidi, A.R. Utilizing User-Generated Content and GIS for Flood Susceptibility Modeling in Mountainous Areas: A Case Study of Jian City in China. Sustainability 2021, 13, 6929. [Google Scholar] [CrossRef]
- Eini, M.; Kaboli, H.S.; Rashidian, M.; Hedayat, H. Hazard and vulnerability in urban flood risk mapping: Machine learning techniques and considering the role of urban districts. Int. J. Disaster Risk Reduct. 2020, 50, 101687. [Google Scholar] [CrossRef]
- Malekinezhad, H.; Sepehri, M.; Pham, Q.B.; Hosseini, S.Z.; Meshram, S.G.; Vojtek, M.; Vojtekova, J. Application of entropy weighting method for urban flood hazard mapping. Acta Geophys. 2021, 69, 841–854. [Google Scholar] [CrossRef]
- Lai, C.G.; Chen, X.H.; Chen, X.Y.; Wang, Z.L.; Wu, X.S.; Zhao, S.W. A fuzzy comprehensive evaluation model for flood risk based on the combination weight of game theory. Nat. Hazards 2015, 77, 1243–1259. [Google Scholar] [CrossRef]
- Chen, C.H. A Novel Multi-Criteria Decision-Making Model for Building Material Supplier Selection Based on Entropy-AHP Weighted TOPSIS. Entropy 2020, 22, 259. [Google Scholar] [CrossRef]
- Zou, Q.; Liao, L.; Qin, H. Fast Comprehensive Flood Risk Assessment Based on Game Theory and Cloud Model Under Parallel Computation (P-GT-CM). Water Resour. Manag. 2020, 34, 1625–1648. [Google Scholar] [CrossRef]
- Wu, T.Y.; Lee, W.T.; Guizani, N.; Wang, T.M. Incentive mechanism for P2P file sharing based on social network and game theory. J. Netw. Comput. Appl. 2014, 41, 47–55. [Google Scholar] [CrossRef]
- Duan, Y.; Xiong, J.; Cheng, W.; Wang, N.; He, W.; He, Y.; Liu, J.; Yang, G.; Wang, J.; Yang, J. Assessment and spatiotemporal analysis of global flood vulnerability in 2005–2020. Int. J. Disaster Risk Reduct. 2022, 80, 103201. [Google Scholar] [CrossRef]
- IPCC. Summary for Policymakers. In Climate Change 2021: The Physical Science Basis. Contribution of Working Group I to the Sixth Assessment Report of the Intergovernmental Panel on Climate Change; Masson-Delmotte, V., Zhai, P., Pirani, A., Connors, S.L., Péan, C., Berger, S., Caud, N., Chen, Y., Goldfarb, L., Gomis, M.I., et al., Eds.; Cambridge University Press: Cambridge, UK, 2021; in press. [Google Scholar]
- Choubin, B.; Moradi, E.; Golshan, M.; Adamowski, J.; Sajedi-Hosseini, F.; Mosavi, A. An ensemble prediction of flood susceptibility using multivariate discriminant analysis, classification and regression trees, and support vector machines. Sci. Total Environ. 2019, 651, 2087–2096. [Google Scholar] [CrossRef]
- Winsemius, H.C.; Aerts, J.; van Beek, L.P.H.; Bierkens, M.F.P.; Bouwman, A.; Jongman, B.; Kwadijk, J.C.J.; Ligtvoet, W.; Lucas, P.L.; van Vuuren, D.P.; et al. Global drivers of future river flood risk. Nat. Clim. Change 2016, 6, 381–385. [Google Scholar] [CrossRef]
- Chen, W.S.; Liu, L.; Liang, Y.T. Retail center recognition and spatial aggregating feature analysis of retail formats in Guangzhou based on POI data. Geogr. Res. 2016, 35, 703–716. [Google Scholar]
- Yang, P.G.; Hu, J.F.; Ding, B.H.; Song, W.; Li, J. Spatial and temporal characteristics of flood disaster in Asia-Pacific region. J. Shaanxi Norm. Univ. Nat. Sci. Ed. 2013, 41, 74–81. [Google Scholar] [CrossRef]
- Torresan, S.; Furlan, E.; Critto, A.; Michetti, M.; Marcomini, A. Egypt’s Coastal Vulnerability to Sea-Level Rise and Storm Surge: Present and Future Conditions. Integr. Environ. Assess. Manag. 2020, 16, 761–772. [Google Scholar] [CrossRef]
- Cao, W.T.; Zhou, Y.Y.; Guneralp, B.; Li, X.C.; Zhao, K.G.; Zhang, H.G. Increasing global urban exposure to flooding: An analysis of long-term annual dynamics. Sci. Total Environ. 2022, 817, 153012. [Google Scholar] [CrossRef]
- Erena, S.H.; Worku, H. Urban flood vulnerability assessments: The case of Dire Dawa city, Ethiopia. Nat. Hazards 2019, 97, 495–516. [Google Scholar] [CrossRef]
- Glaus, A.; Mosimann, M.; Rothlisberger, V.; Ingold, K. How flood risks shape policies: Flood exposure and risk perception in Swiss municipalities. Reg. Environ. Change 2020, 20, 120. [Google Scholar] [CrossRef]
- Du, S.Q.; He, C.Y.; Huang, Q.X.; Shi, P.J. How did the urban land in floodplains distribute and expand in China from 1992-2015? Environ. Res. Lett. 2018, 13, 120. [Google Scholar] [CrossRef]
- Tellman, B.; Saiers, J.E.; Cruz, O.A.R. Quantifying the impacts of land use change on flooding in data-poor watersheds in El Salvador with community-based model calibration. Reg. Environ. Change 2016, 16, 1183–1196. [Google Scholar] [CrossRef]
- Luu, C.; von Meding, J.; Mojtahedi, M. Analyzing Vietnam’s national disaster loss database for flood risk assessment using multiple linear regression-TOPSIS. Int. J. Disaster Risk Reduct. 2019, 40, 101153. [Google Scholar] [CrossRef]
- Li, X.N.; Yan, D.H.; Wang, K.; Weng, B.; Qin, T.L.; Liu, S.Y. Flood Risk Assessment of Global Watersheds Based on Multiple Machine Learning Models. Water 2019, 11, 1654. [Google Scholar] [CrossRef]
- Piontek, F.; Muller, C.; Pugh, T.A.M.; Clark, D.B.; Deryng, D.; Elliott, J.; Gonzalez, F.D.C.; Florke, M.; Folberth, C.; Franssen, W.; et al. Multisectoral climate impact hotspots in a warming world. Proc. Natl. Acad. Sci. USA 2014, 111, 3233–3238. [Google Scholar] [CrossRef]
- Visser, H.; Petersen, A.C.; Ligtvoet, W. On the relation between weather-related disaster impacts, vulnerability and climate change. Clim. Change 2014, 125, 461–477. [Google Scholar] [CrossRef]



| Data Category | Specific Criterium | Resource | Time | Resolution |
|---|---|---|---|---|
| Precipitation | Maximum 5-day precipitation (mm) | NASA | 2003–2020 | 0.1° × 0.1° |
| Land use | Land use | NASA | 2005, 2010, 2015 | 0.5 km × 0.5 km |
| GLOBELAND30 | 2020 | 30 m × 30 m | ||
| NDVI | NDVI | NASA | 2005, 2010, 2015, 2020 | 0.05° × 0.05° |
| River | River density (km/km2) | OpenStreetMap | 2021 | 1:50,000 |
| Soil | Soil texture | FAO | 2008 | 1 km × 1 km |
| DEM | Elevation (m) | SRTM | 2010 | 1 km × 1 km |
| Slope (°) |
| Number | Hazard Index | Classes | Rating |
|---|---|---|---|
| 1 | Maximum 5-day precipitation | 0–24.53 | 1 |
| 24.53–40.31 | 2 | ||
| 40.31–61.33 | 3 | ||
| 61.33–89.37 | 4 | ||
| 89.37–446.86 | 5 | ||
| 2 | Land use | Forest | 1 |
| Grasslands | 2 | ||
| Farmland | 3 | ||
| Permanent wetlands | 4 | ||
| Build up areas | 5 | ||
| Water bodies | 5 | ||
| 3 | NDVI | −0.16–0.07 | 5 |
| 0.07–0.13 | 4 | ||
| 0.13–0.22 | 3 | ||
| 0.22–0.32 | 2 | ||
| 0.32–0.72 | 1 | ||
| 4 | River density | 0–0.09 | 1 |
| 0.09–0.19 | 2 | ||
| 0.19–0.28 | 3 | ||
| 0.28–0.43 | 4 | ||
| 0.43–4.72 | 5 | ||
| 5 | Soil texture | Silt loam | 1 |
| Clay loam | 1 | ||
| Loam sand | 1 | ||
| Silty clay | 2 | ||
| Sandy loam | 2 | ||
| Silty clay loam | 2 | ||
| Sand | 2 | ||
| Loam | 3 | ||
| Clay | 3 | ||
| Sandy clay loam | 4 | ||
| Clay(heavy) | 5 | ||
| 6 | Slope | 0–1.39 | 5 |
| 1.39–4.45 | 4 | ||
| 4.45–8.90 | 3 | ||
| 8.90–15.29 | 2 | ||
| 15.29–70.91 | 1 | ||
| 7 | Elevation | −415–104.94 | 5 |
| 104.94–278.25 | 4 | ||
| 278.25–520.89 | 3 | ||
| 520.89–1075.50 | 2 | ||
| 1075.50–8424 | 1 |
| Data Category | Specific Criterium | Resource | Time | Resolution |
|---|---|---|---|---|
| Population | Population density (person/km2) | World Pop | 2005, 2010, 2015, 2020 | 1 km × 1 km |
| Female population density (person/km2) | ||||
| Child population density (person/km2) | ||||
| Elderly population density (person/km2) | ||||
| Economy | Economic density (dollar/km2) | Dryad | 2005, 2010, 2015 | 5′ × 5′ |
| CGER | 2020 | 0.5° × 0.5° | ||
| Land use | Building density (%) | NASA, | 2005, 2010 | 0.05° × 0.05° |
| Farmland density (%) | GLOBELAND30 | 2015, 2020 | 30 m × 30 m | |
| Infrastructure | Shelter density (number/km2) | OpenStreetMap | 2021 | 1:50,000 |
| Hospital density (number/km2) | ||||
| Impervious surface | Impervious surface (%) | GHSL | 2014 | 30 m × 30 m |
| Road | Road density (km/km2) | OpenStreetMap | 2021 | 1:50,000 |
| Year | Method | Hazard Index | ||||||
|---|---|---|---|---|---|---|---|---|
| M5DP | LU | NDVI | RD | ST | SL | EL | ||
| 2005 | TFN-AHP | 0.258 | 0.165 | 0.116 | 0.197 | 0.149 | 0.040 | 0.075 |
| EM | 0.127 | 0.204 | 0.125 | 0.202 | 0.115 | 0.106 | 0.121 | |
| GT | 0.246 | 0.169 | 0.116 | 0.198 | 0.146 | 0.046 | 0.079 | |
| 2010 | TFN-AHP | 0.258 | 0.165 | 0.116 | 0.197 | 0.149 | 0.040 | 0.075 |
| EM | 0.126 | 0.202 | 0.128 | 0.203 | 0.115 | 0.105 | 0.121 | |
| GT | 0.246 | 0.169 | 0.117 | 0.197 | 0.146 | 0.046 | 0.079 | |
| 2015 | TFN-AHP | 0.258 | 0.165 | 0.116 | 0.197 | 0.149 | 0.040 | 0.075 |
| EM | 0.126 | 0.199 | 0.127 | 0.204 | 0.116 | 0.105 | 0.123 | |
| GT | 0.247 | 0.168 | 0.117 | 0.198 | 0.146 | 0.045 | 0.079 | |
| 2020 | TFN-AHP | 0.258 | 0.165 | 0.116 | 0.197 | 0.149 | 0.040 | 0.075 |
| EM | 0.123 | 0.212 | 0.126 | 0.201 | 0.114 | 0.104 | 0.120 | |
| GT | 0.239 | 0.172 | 0.117 | 0.198 | 0.144 | 0.049 | 0.081 | |
| Year | Method | Exposure | Sensitivity | Coping Capacity | |||||||||
|---|---|---|---|---|---|---|---|---|---|---|---|---|---|
| PD | ED | BD | FD | FP | CP | OP | IS | RD | SD | HD | GPC | ||
| 2005 | TFN-AHP | 0.337 | 0.263 | 0.215 | 0.185 | 0.252 | 0.183 | 0.231 | 0.334 | 0.373 | 0.250 | 0.170 | 0.207 |
| EM | 0.224 | 0.288 | 0.297 | 0.191 | 0.218 | 0.216 | 0.223 | 0.343 | 0.079 | 0.491 | 0.246 | 0.184 | |
| GT | 0.295 | 0.273 | 0.245 | 0.187 | 0.237 | 0.197 | 0.228 | 0.338 | 0.173 | 0.414 | 0.222 | 0.191 | |
| 2010 | TFN-AHP | 0.337 | 0.263 | 0.215 | 0.185 | 0.252 | 0.183 | 0.231 | 0.334 | 0.373 | 0.250 | 0.170 | 0.207 |
| EM | 0.226 | 0.284 | 0.298 | 0.192 | 0.219 | 0.217 | 0.219 | 0.345 | 0.080 | 0.497 | 0.250 | 0.173 | |
| GT | 0.297 | 0.271 | 0.245 | 0.187 | 0.235 | 0.201 | 0.224 | 0.340 | 0.173 | 0.419 | 0.224 | 0.184 | |
| 2015 | TFN-AHP | 0.337 | 0.263 | 0.215 | 0.185 | 0.252 | 0.183 | 0.231 | 0.334 | 0.373 | 0.251 | 0.170 | 0.206 |
| EM | 0.227 | 0.283 | 0.299 | 0.191 | 0.220 | 0.214 | 0.220 | 0.346 | 0.080 | 0.497 | 0.249 | 0.174 | |
| GT | 0.298 | 0.270 | 0.245 | 0.187 | 0.234 | 0.200 | 0.225 | 0.341 | 0.173 | 0.418 | 0.224 | 0.185 | |
| 2020 | TFN-AHP | 0.337 | 0.263 | 0.215 | 0.185 | 0.252 | 0.183 | 0.231 | 0.334 | 0.373 | 0.250 | 0.170 | 0.207 |
| EM | 0.278 | 0.313 | 0.223 | 0.186 | 0.218 | 0.213 | 0.230 | 0.339 | 0.067 | 0.420 | 0.211 | 0.302 | |
| GT | 0.307 | 0.290 | 0.233 | 0.170 | 0.245 | 0.189 | 0.231 | 0.335 | 0.180 | 0.357 | 0.196 | 0.267 | |
| Risk Grade | 2005 | 2010 | ||||
|---|---|---|---|---|---|---|
| GN | AP | RIFRG | GN | AP | RIFRG | |
| Very low | 265,777 | 36.81 | 1.819 | 250,110 | 34.64 | 1.865 |
| Low | 361,158 | 50.02 | 360,941 | 49.99 | ||
| Medium | 64,044 | 8.87 | 78,629 | 10.89 | ||
| High | 22,094 | 3.06 | 22,960 | 3.18 | ||
| Very high | 8953 | 1.24 | 9387 | 1.30 | ||
| Risk grade | 2015 | 2020 | ||||
| GN | AP | RIFRG | GN | AP | RIFRG | |
| Very low | 259,713 | 35.97 | 1.867 | 230,976 | 31.99 | 1.935 |
| Low | 341,374 | 47.28 | 354,299 | 49.07 | ||
| Medium | 87,726 | 12.15 | 100,506 | 13.92 | ||
| High | 23,682 | 3.28 | 25,488 | 3.53 | ||
| Very high | 9532 | 1.32 | 10,758 | 1.49 | ||
| Country | RIFRG | Rate of Change (%) | |||||
|---|---|---|---|---|---|---|---|
| 2005 | 2010 | 2015 | 2020 | 2005–2010 | 2010–2015 | 2015–2020 | |
| Singapore | 4.987 | 4.987 | 4.993 | 4.993 | 0 | 0.12% | 0 |
| Madagascar | 4.534 | 4.591 | 4.239 | 4.323 | 1.26% | −7.67% | 1.98% |
| Bangladesh | 4.399 | 4.397 | 4.485 | 4.571 | −0.05% | 2.00% | 1.92% |
| Mauritius | 3.776 | 3.888 | 3.776 | 4.060 | 2.97% | −2.88% | 7.52% |
| Netherlands | 3.658 | 3.567 | 3.453 | 3.918 | −2.49% | −3.20% | 13.47% |
| Bahrain | 3.632 | 4.031 | 4.031 | 4.017 | 10.99% | 0 | −0.35% |
| Belgium | 3.478 | 3.350 | 3.376 | 3.872 | −3.68% | 0.78% | 14.69% |
| India | 3.388 | 3.438 | 3.475 | 3.470 | 1.48% | 1.08% | −0.14% |
| Haiti | 3.096 | 3.232 | 3.375 | 2.920 | 4.39% | 4.42% | −13.48% |
| Liechtenstein | 3.041 | 2.776 | 2.888 | 2.888 | −8.71% | 4.03% | 0 |
| Trinidad and Tobago | 2.994 | 3.110 | 2.840 | 3.087 | 3.87% | −8.68% | 8.70% |
| Japan | 2.972 | 2.864 | 2.828 | 3.260 | −3.63% | −1.26% | 15.28% |
| South Korea | 2.944 | 2.975 | 2.961 | 3.380 | 1.05% | −0.47% | 14.15% |
| Rwanda | 2.944 | 2.928 | 3.302 | 3.215 | −0.54% | 12.77% | −2.63% |
| Germany | 2.900 | 2.876 | 2.857 | 3.264 | −0.83% | −0.66% | 14.25% |
| El Salvador | 2.884 | 2.774 | 2.787 | 3.318 | −3.81% | 0.47% | 19.05% |
| Philippines | 2.845 | 2.901 | 3.014 | 2.952 | 1.97% | 3.90% | −2.06% |
| Sri Lanka | 2.840 | 2.846 | 2.836 | 3.059 | 0.21% | −0.35% | 7.86% |
| Israel | 2.826 | 2.862 | 2.850 | 3.110 | 1.27% | −0.42% | 9.12% |
| Vietnam | 2.815 | 2.818 | 2.872 | 2.955 | 0.11% | 1.92% | 2.89% |
| Continent | RIFRG | Interannual Variation | |||||
|---|---|---|---|---|---|---|---|
| 2005 | 2010 | 2015 | 2020 | 2005–2010 | 2010–2015 | 2015–2020 | |
| Africa | 1.770 | 1.817 | 1.766 | 1.777 | 0.047 | −0.051 | 0.011 |
| Asia | 1.989 | 2.027 | 2.072 | 2.181 | 0.038 | 0.045 | 0.109 |
| Oceania | 1.796 | 1.806 | 1.813 | 1.836 | 0.010 | 0.0073 | 0.0233 |
| Europe | 1.775 | 1.854 | 1.852 | 1.995 | 0.079 | −0.002 | 0.143 |
| North America | 1.717 | 1.735 | 1.760 | 1.837 | 0.018 | 0.025 | 0.077 |
| South America | 1.911 | 1.983 | 1.963 | 1.977 | 0.072 | −0.020 | 0.014 |
Publisher’s Note: MDPI stays neutral with regard to jurisdictional claims in published maps and institutional affiliations. |
© 2022 by the authors. Licensee MDPI, Basel, Switzerland. This article is an open access article distributed under the terms and conditions of the Creative Commons Attribution (CC BY) license (https://creativecommons.org/licenses/by/4.0/).
Share and Cite
Duan, Y.; Xiong, J.; Cheng, W.; Li, Y.; Wang, N.; Shen, G.; Yang, J. Increasing Global Flood Risk in 2005–2020 from a Multi-Scale Perspective. Remote Sens. 2022, 14, 5551. https://doi.org/10.3390/rs14215551
Duan Y, Xiong J, Cheng W, Li Y, Wang N, Shen G, Yang J. Increasing Global Flood Risk in 2005–2020 from a Multi-Scale Perspective. Remote Sensing. 2022; 14(21):5551. https://doi.org/10.3390/rs14215551
Chicago/Turabian StyleDuan, Yu, Junnan Xiong, Weiming Cheng, Yi Li, Nan Wang, Gaoyun Shen, and Jiawei Yang. 2022. "Increasing Global Flood Risk in 2005–2020 from a Multi-Scale Perspective" Remote Sensing 14, no. 21: 5551. https://doi.org/10.3390/rs14215551
APA StyleDuan, Y., Xiong, J., Cheng, W., Li, Y., Wang, N., Shen, G., & Yang, J. (2022). Increasing Global Flood Risk in 2005–2020 from a Multi-Scale Perspective. Remote Sensing, 14(21), 5551. https://doi.org/10.3390/rs14215551


