
3D Data Fusion for Historical Analyses of Heritage Buildings Using Thermal Images: The Palacio de Colomina as a Case Study


Abstract
:1. Introduction
2. Materials and Methods
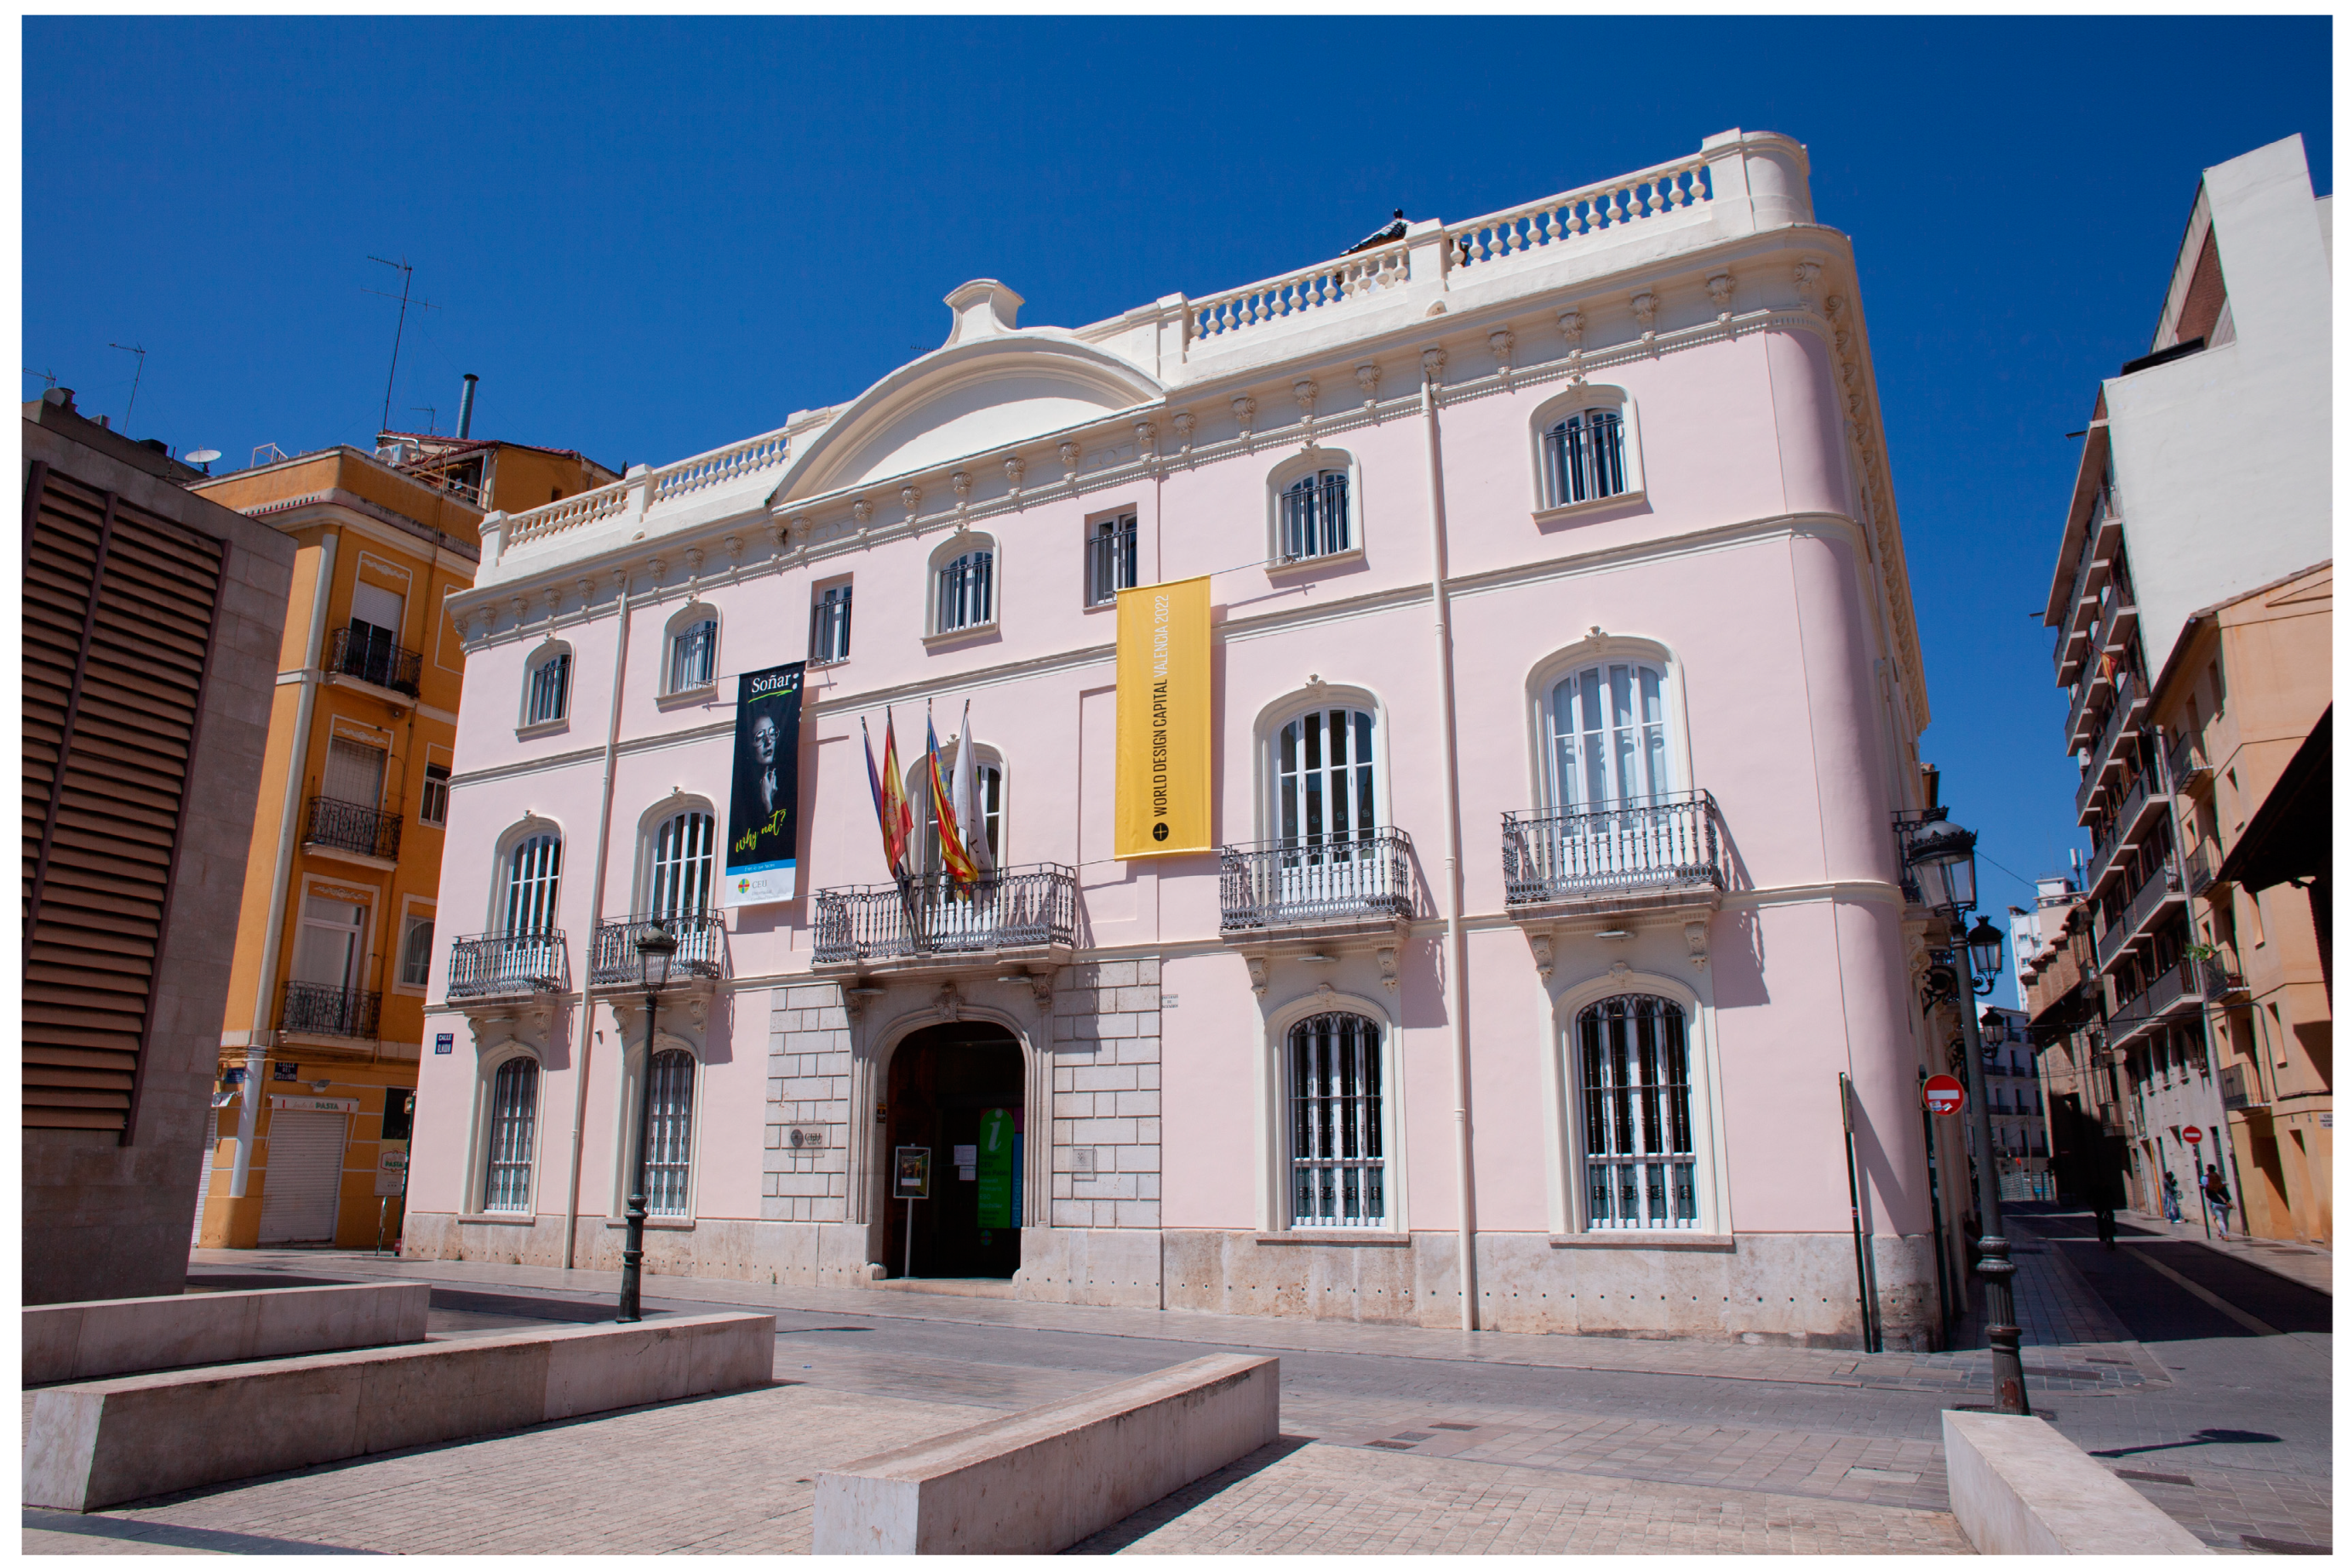
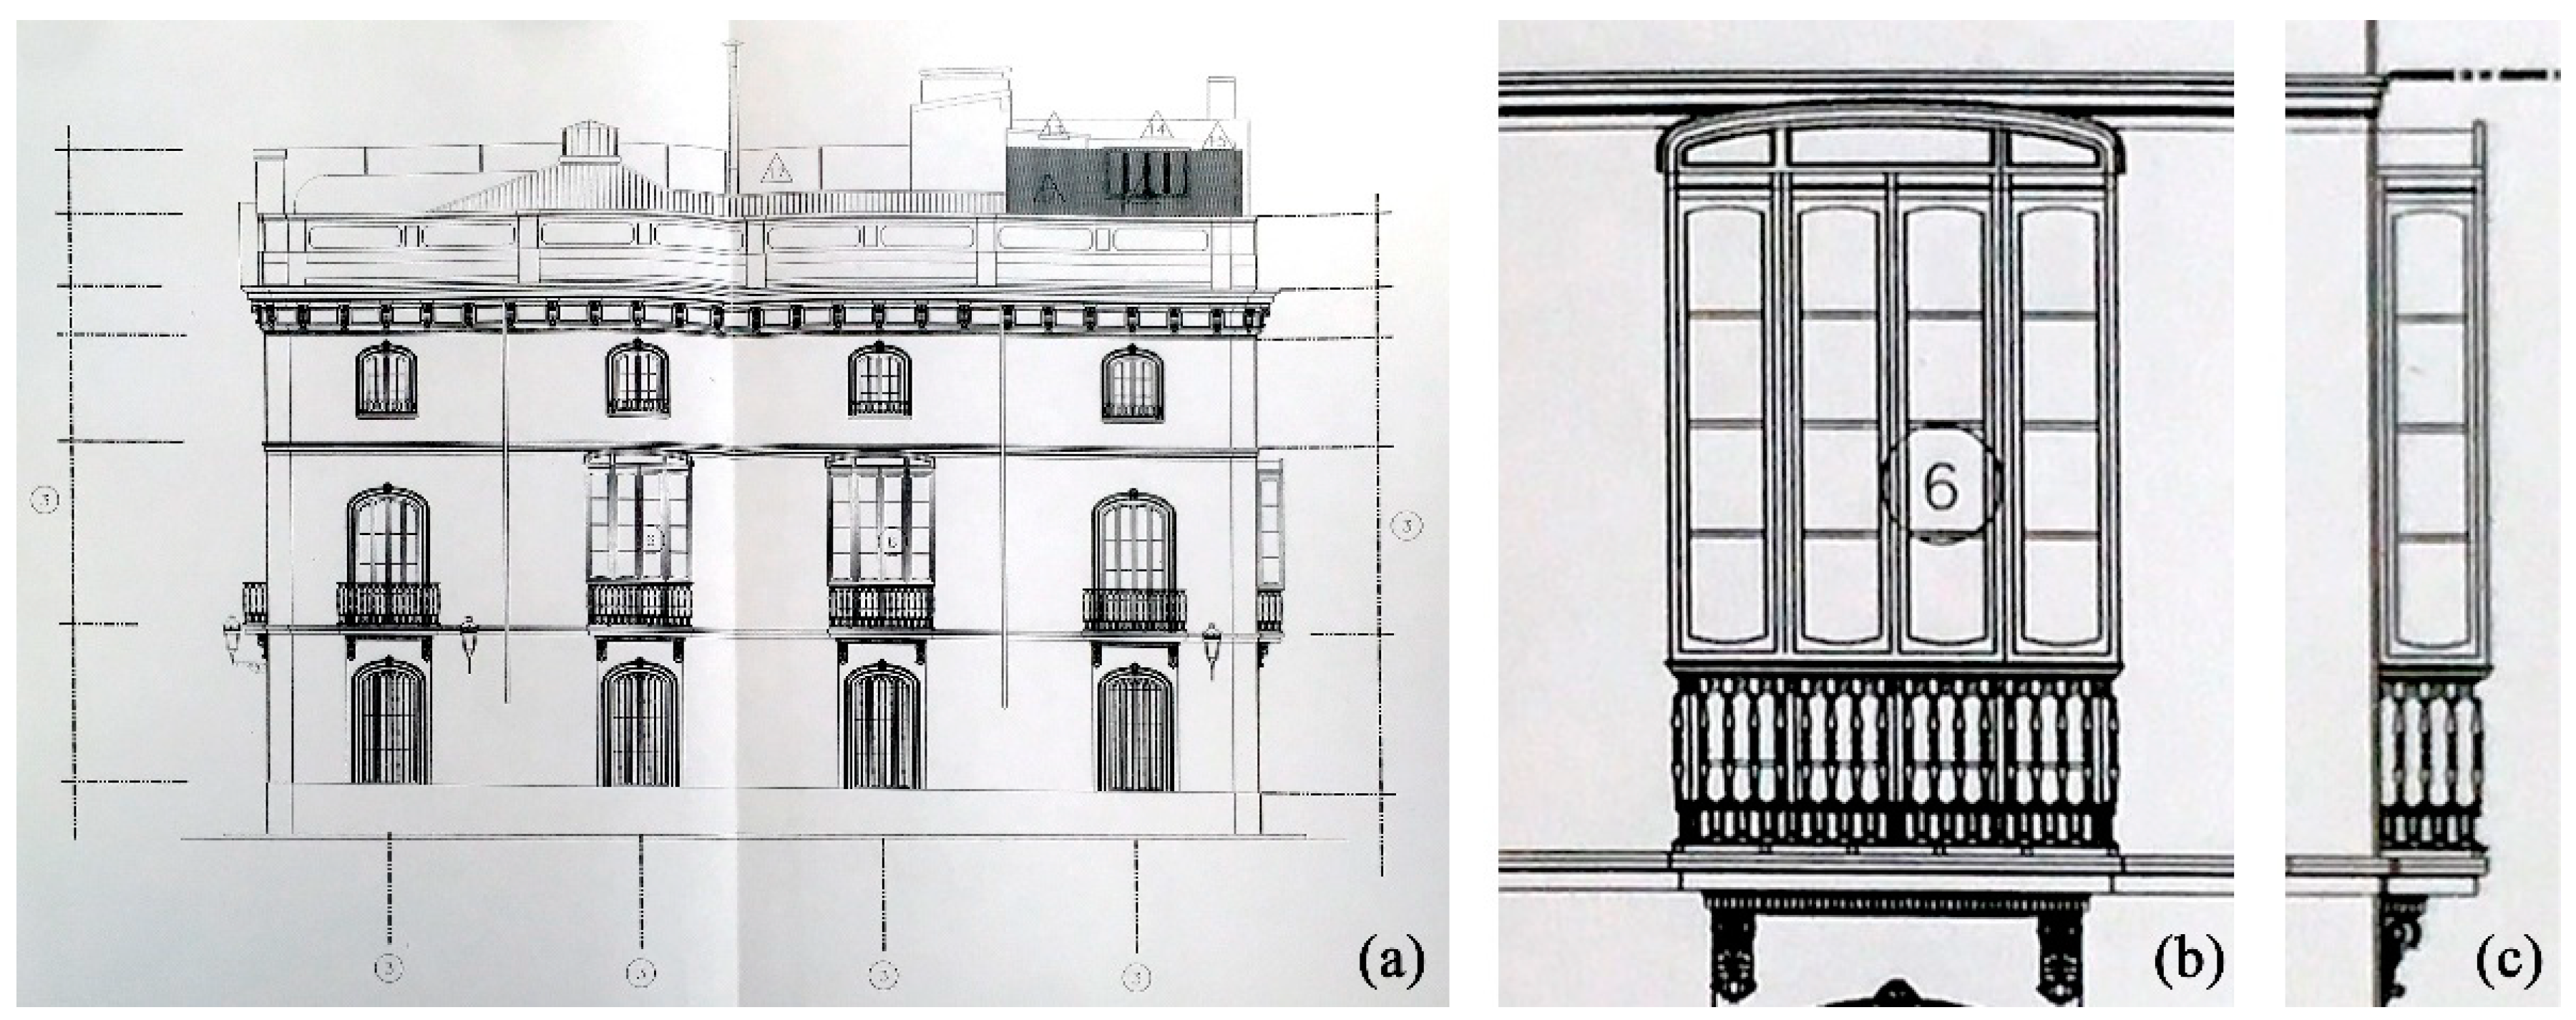
2.1. Case Study
2.2. Data Acquisition
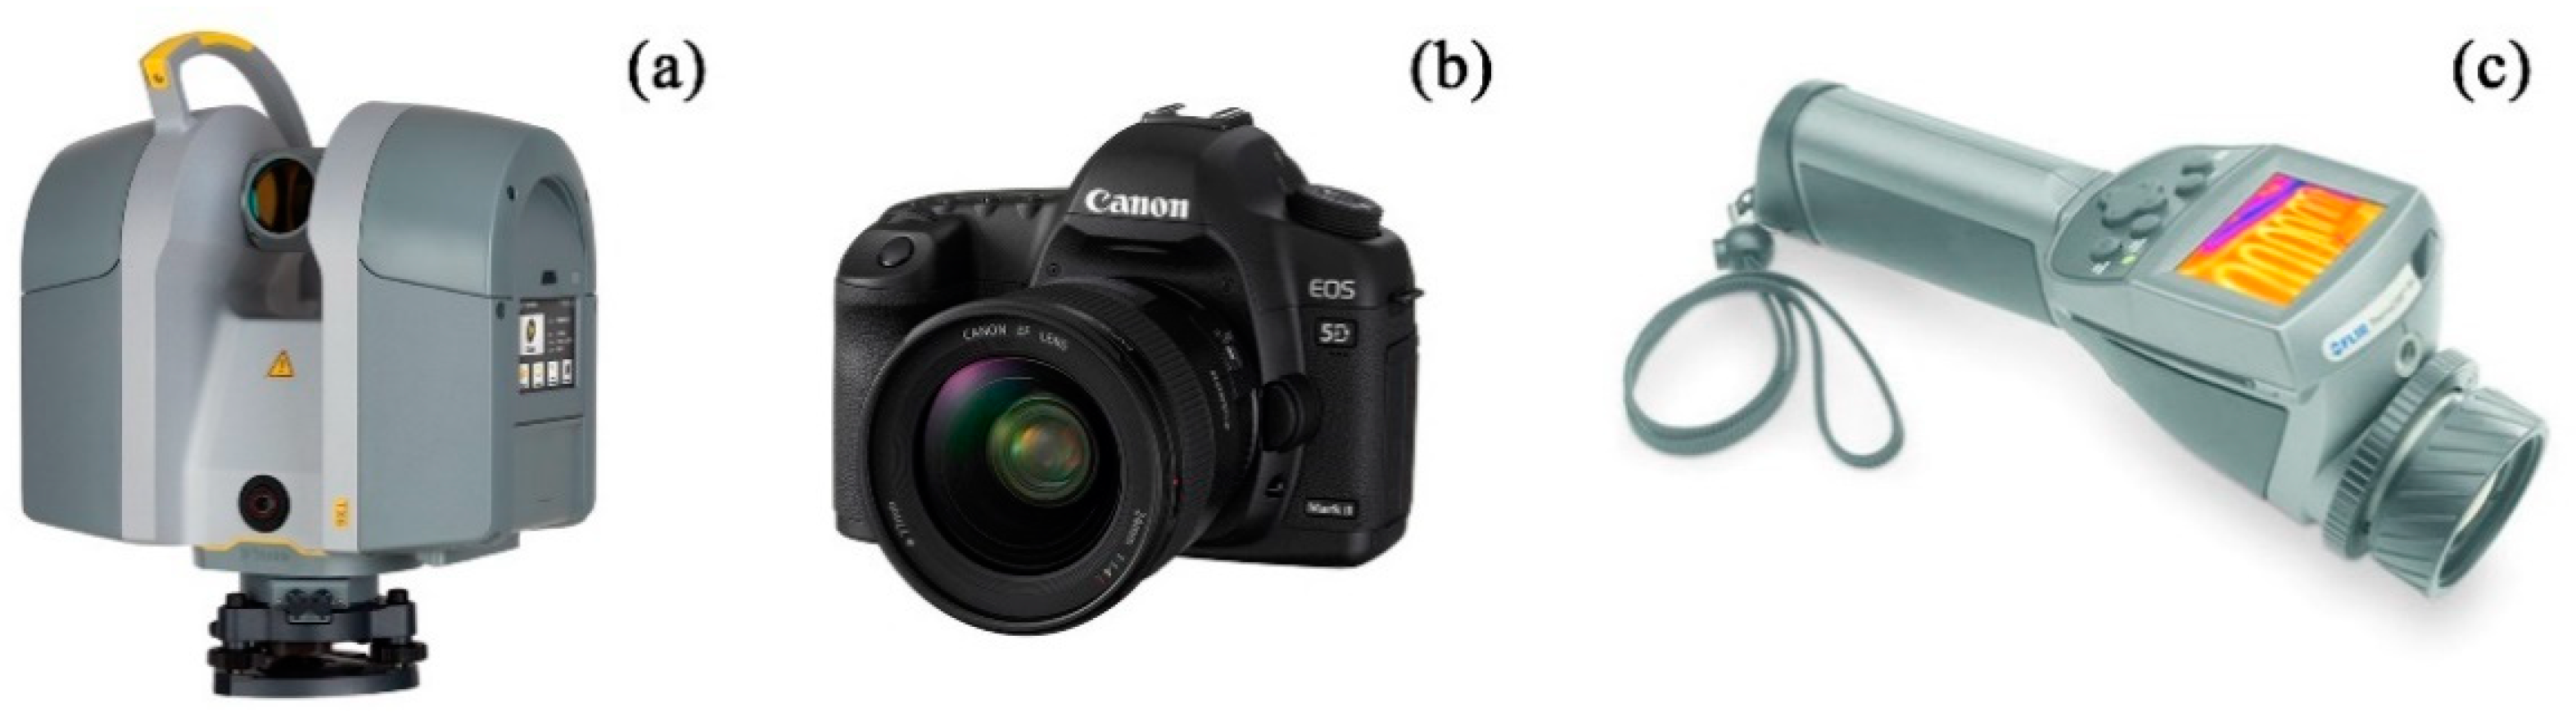
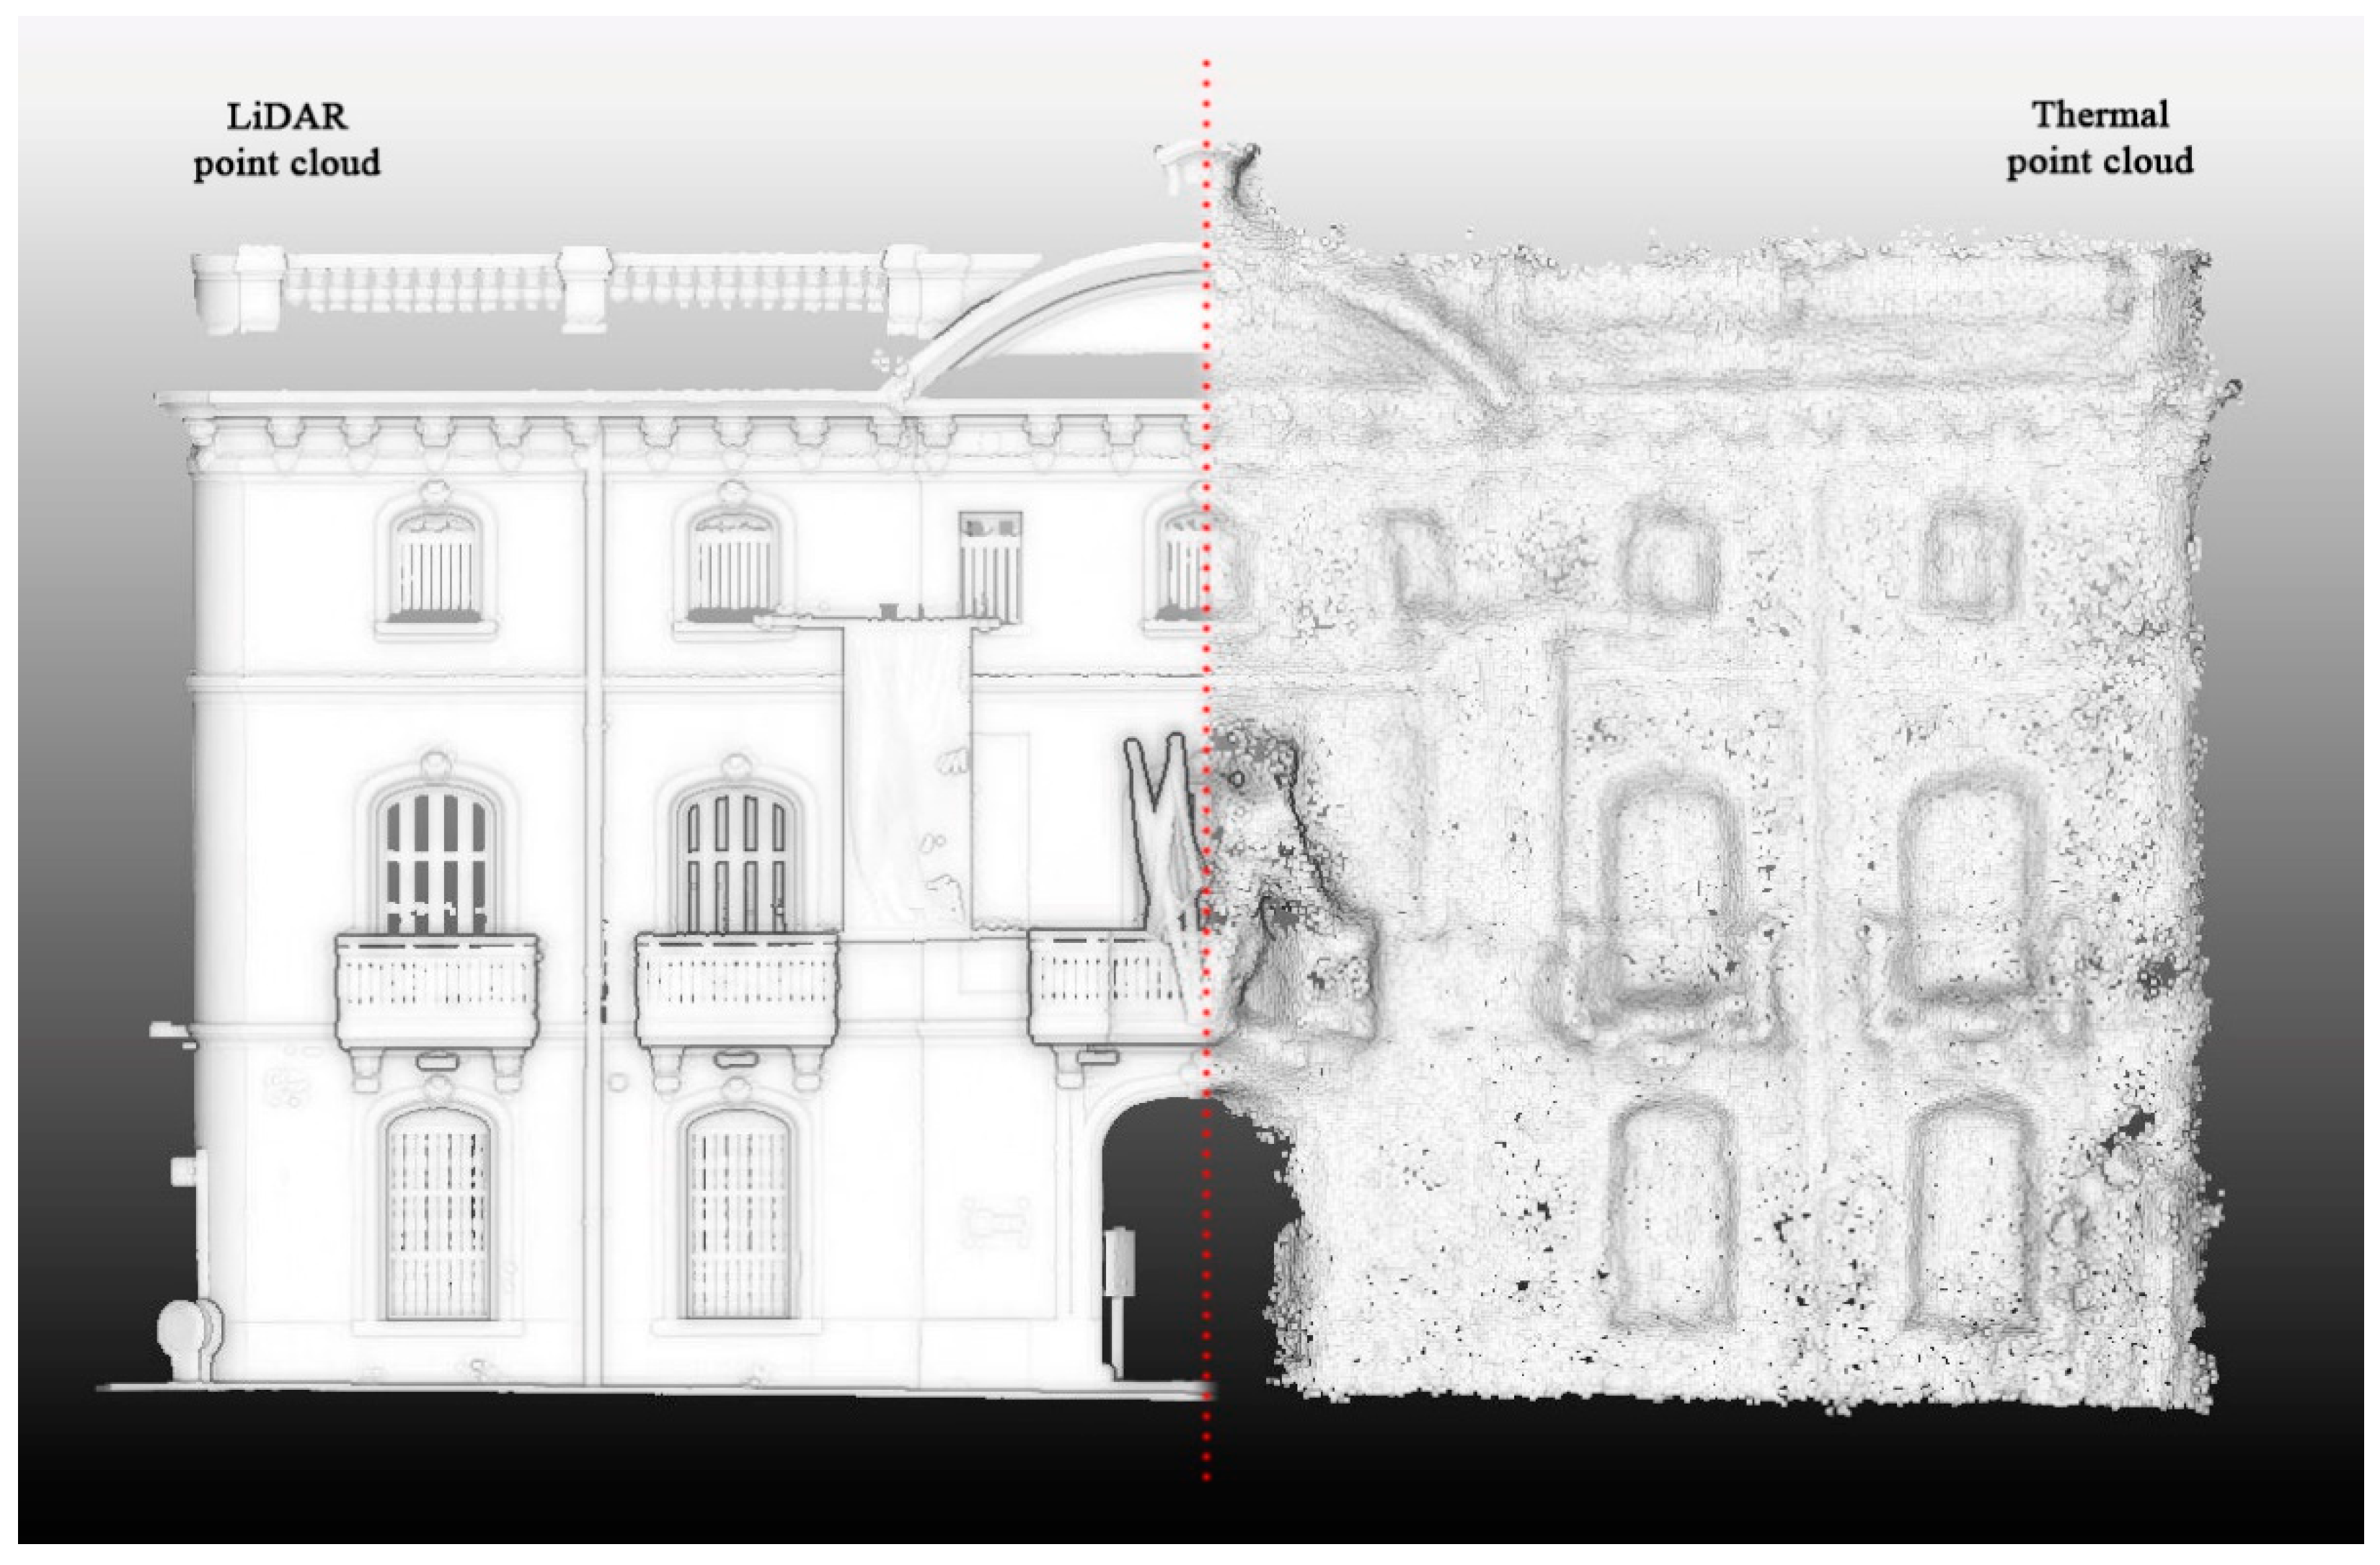
- 8 LiDAR scans, using a Trimble TX6 laser scanner (Figure 3a) in order to provide high-resolution point clouds to accurately describe the external geometries of the Palacio;
- 455 colour digital images, using a DSLR camera (model: Canon EOS 5D Mark II) (Figure 3b) to document the visible range of the electromagnetic spectrum;
- 308 TIR images, using a terrestrial thermal camera (model: FLIR ThermaCAMTM B4) (Figure 3c) to detect anomalies or phenomena that are not visible to the human eye, but noticeable in long wave infrared (LWIR—8–14.000 nm).
2.2.1. LiDAR Scans Acquisition
2.2.2. Visible Colour Images Acquisition
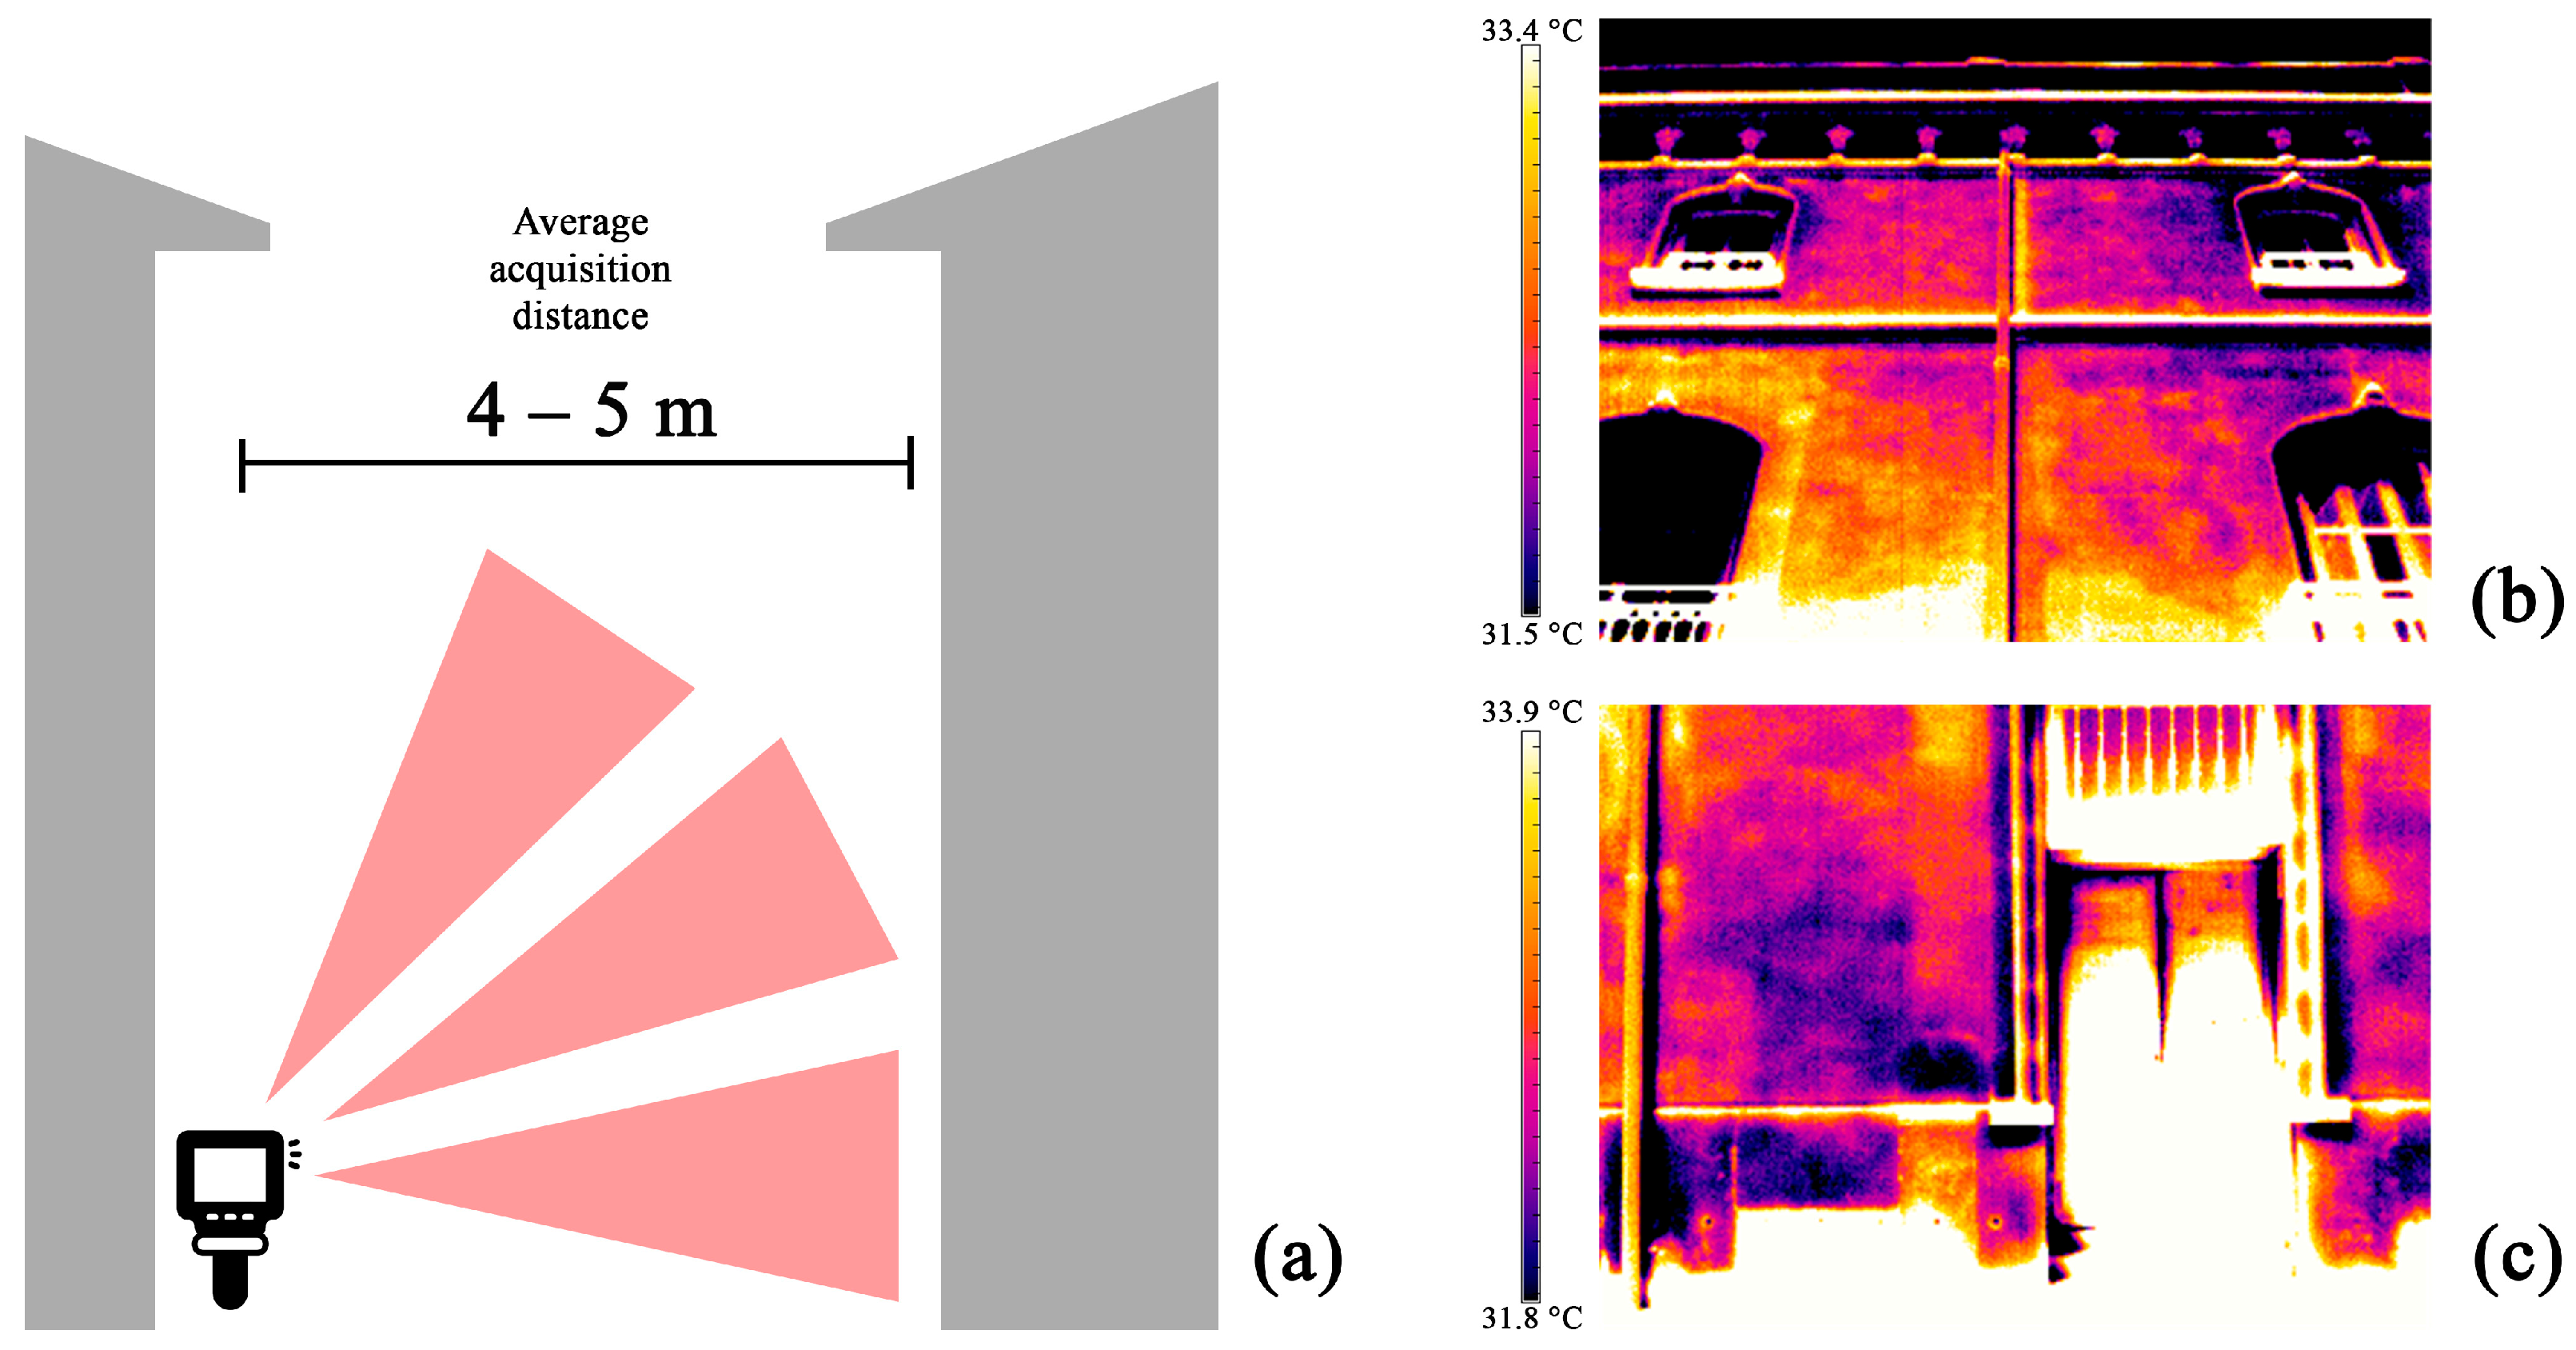
2.2.3. TIR Images Acquisition
2.3. Data Processing
- The LiDAR scans were registered using an automatic plane-based registration;
- The colour digital images were processed following a photogrammetric SfM-based procedure;
- The TIR images were processed following two different pipelines: when possible (i.e., when the thermograms were acquired following photogrammetric criteria), a standard photogrammetric SfM-based workflow was followed, similar to colour processing; the second workflow consisted of projecting the thermal images on the 3D mesh derived from LiDAR—characterised by a very high spatial resolution—to generate a thermal texture;
- These procedures will be further described in the following sections. The workflows carried out in this study can be observed in Figure 6.
2.3.1. Terrestrial Laser Scanning Processing
2.3.2. Visible Colour Image Processing
- Internal camera orientation;
- Relative external orientation and tie points generation;
- Absolute external orientation using GCPs;
- Evaluation of the metric accuracy using ChPs.
2.3.3. TIR Images Processing (Photogrammetric SfM-Based Workflow)
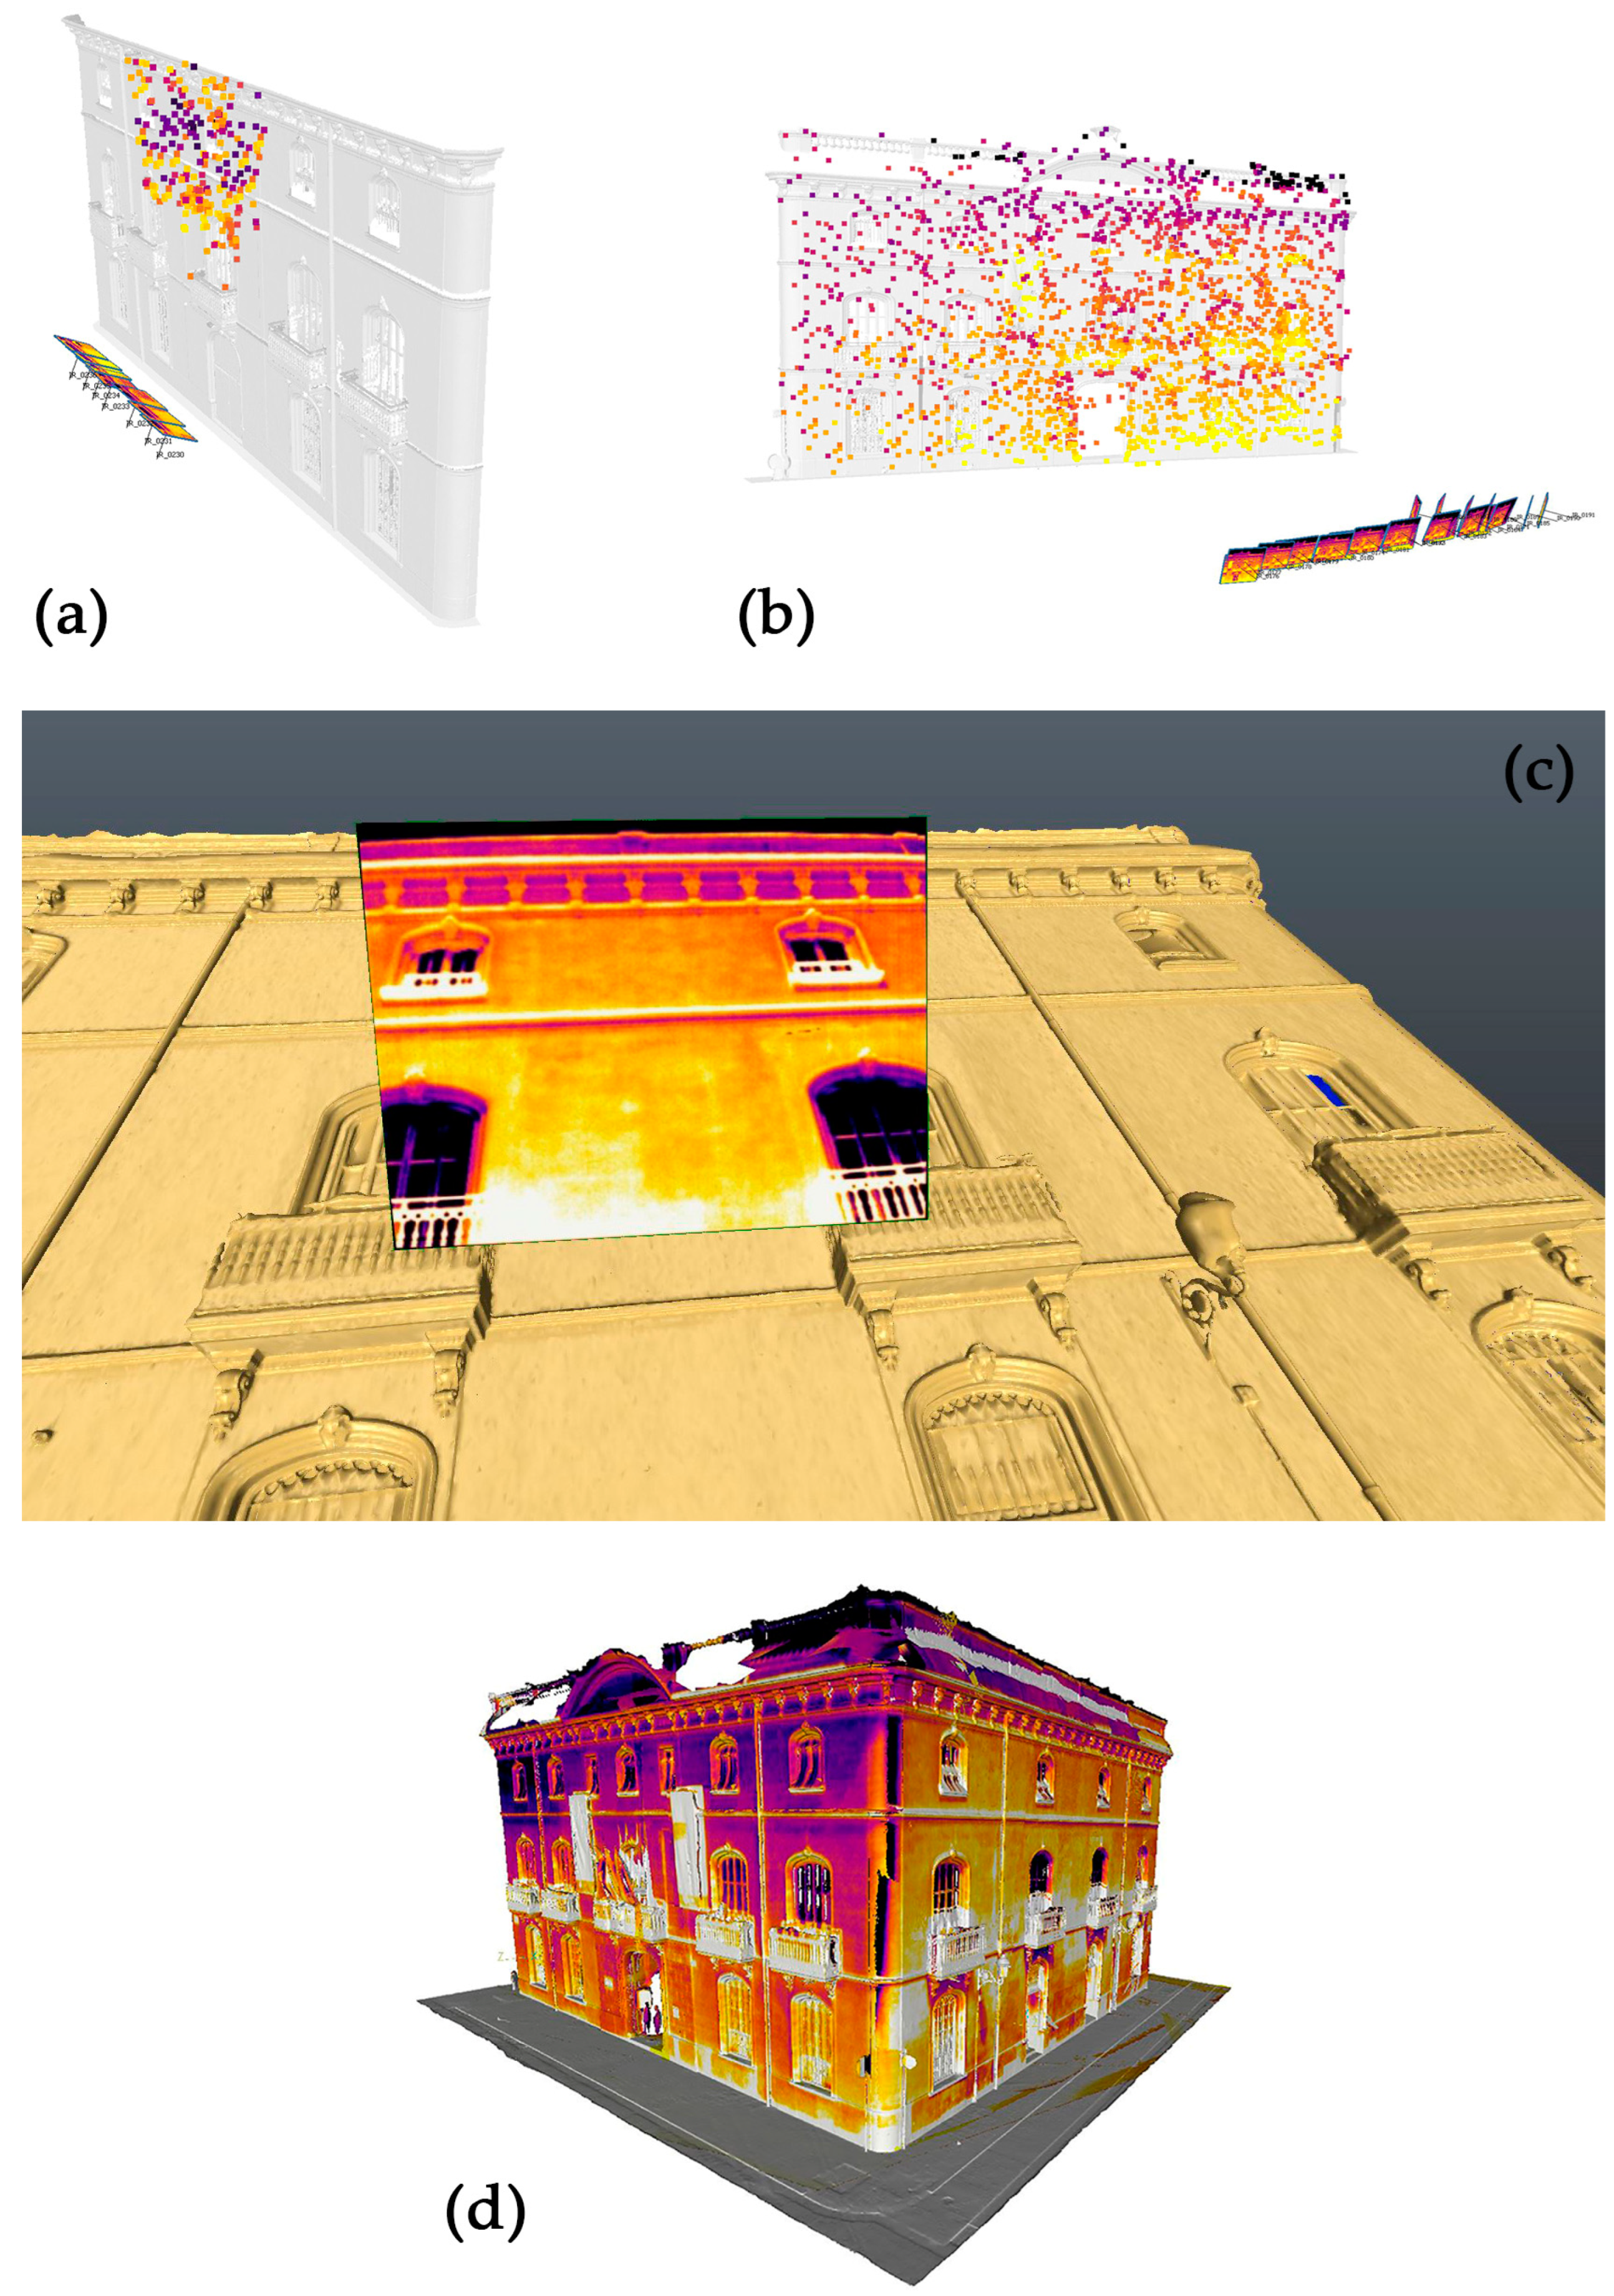
2.3.4. TIR Images Processing (Texture Projection)
- Preliminary selection of the TIR images. In this case, ca. 60 TIR images were selected—from those collected during the different acquisitions—with the aim of covering all the façades of the building;
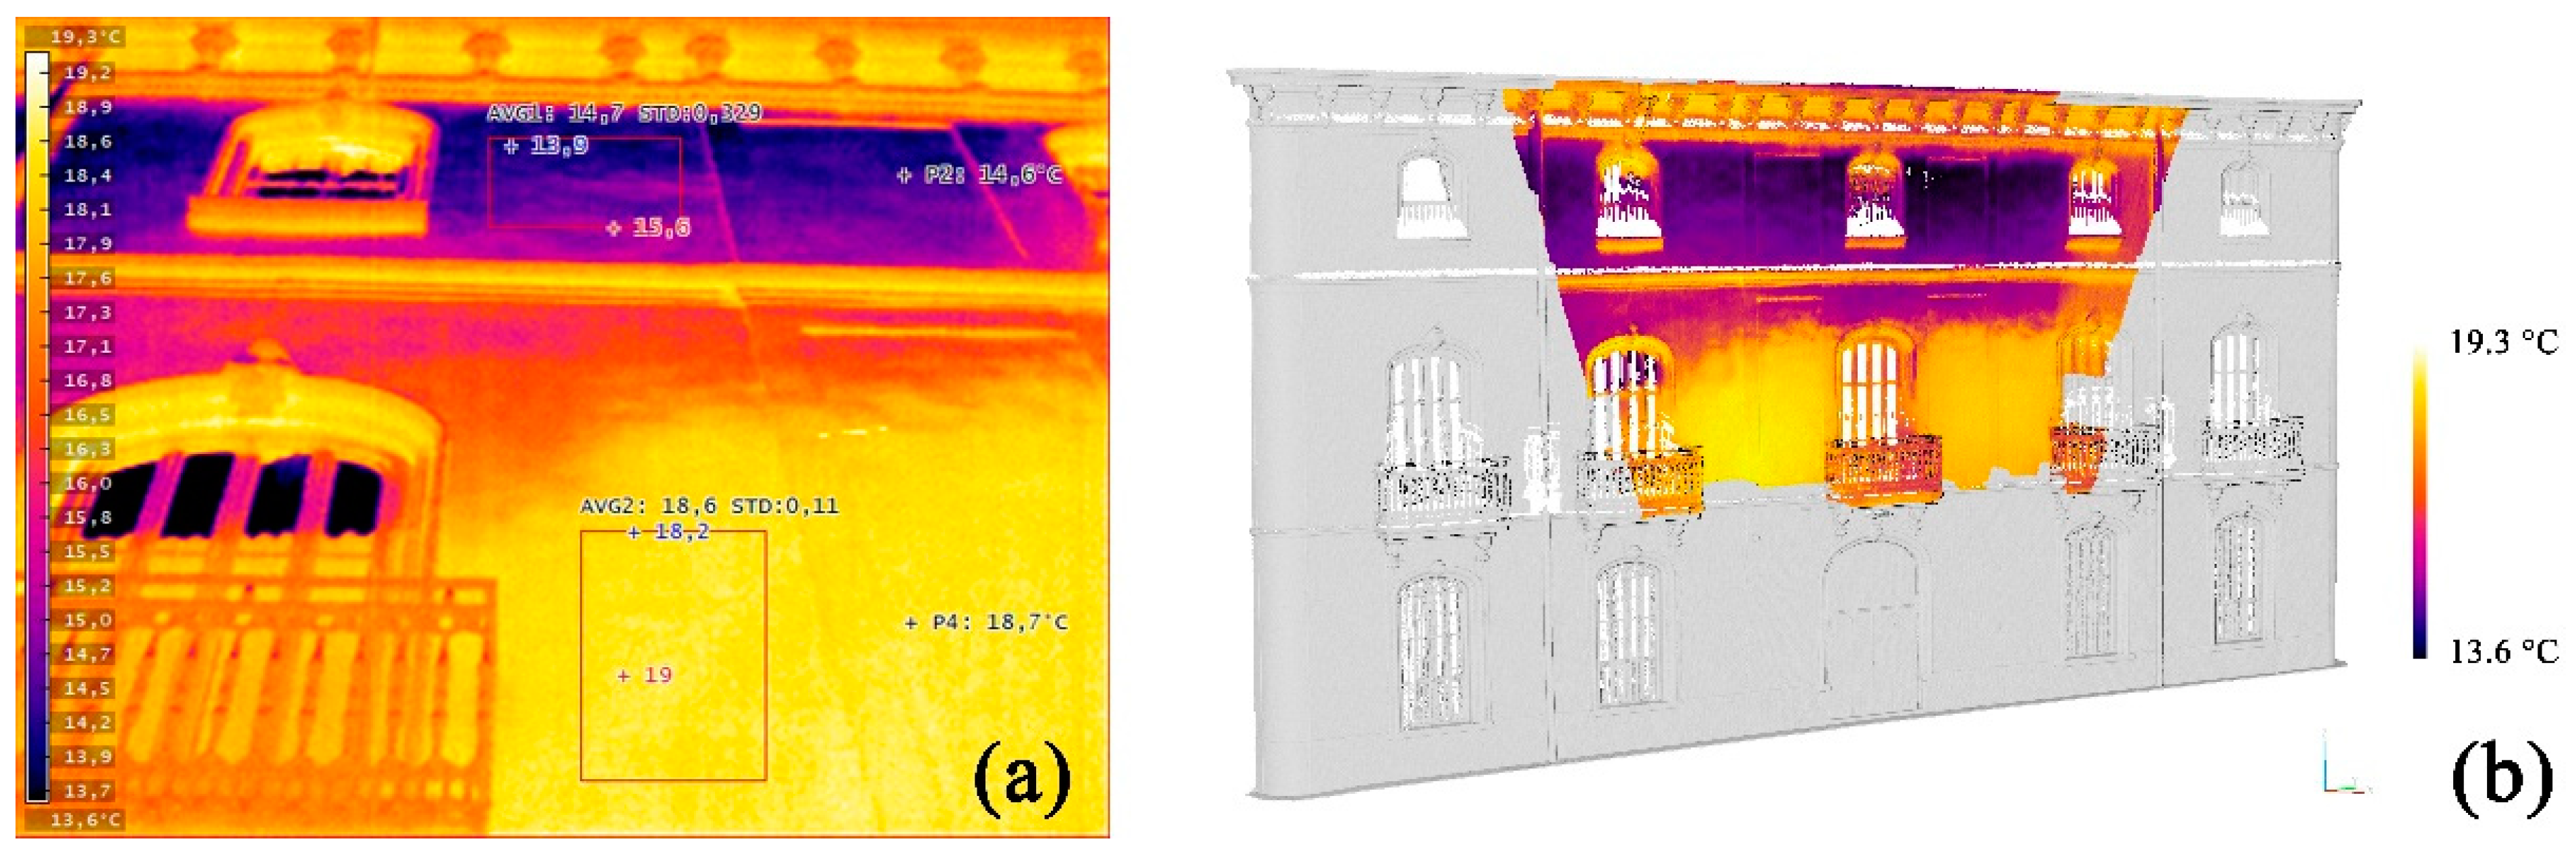
- Pre-processing of the thermograms. During this preliminary phase, the thermal images were pre-processed. Starting from the raw panchromatic image, where the digital number embedded in each pixel represented the detected absolute temperature, each thermogram was converted into a rendered .jpg where the temperature range was represented through a predefined false colour palette. For each façade, the selected set of images was exported after setting the same colour palette and temperature range (southern façade: 32.0–23.0 °C; eastern façade: 34.0–29.2 °C; northern façade 27.0–14.0 °C; western façade: 26.0–18.0 °C);
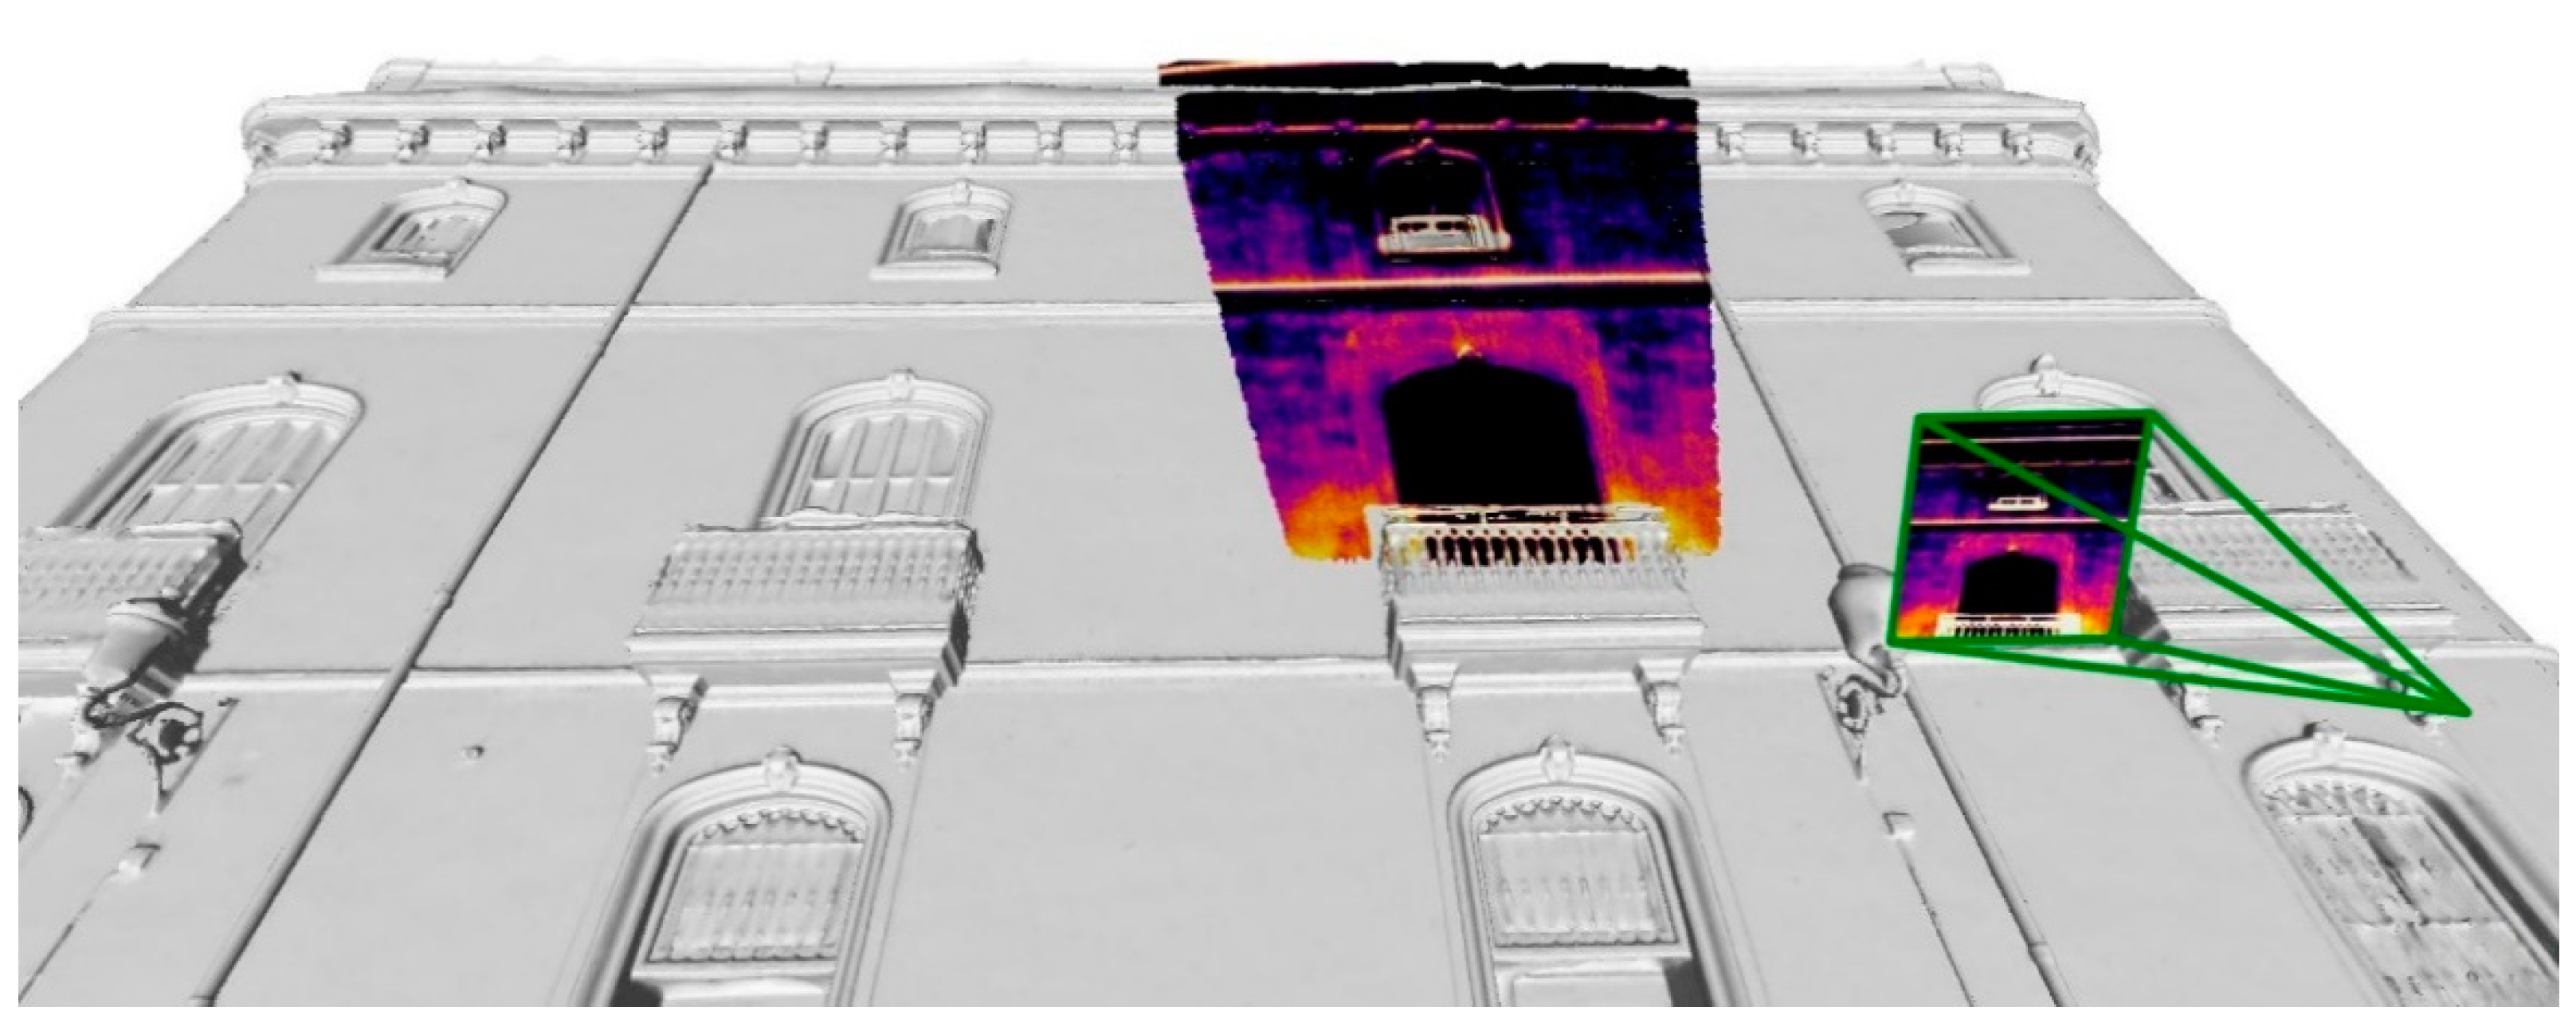
- Generation of a thermal texture. From the previous mosaicking procedure, where all the TIR images were oriented, a thermal texture was generated and projected onto the 3D mesh (Figure 7d);
- Editing of the texture. The generated texture was edited to fix some misprojected areas, fill any gaps and lack of information, or refine the edges between the adjacent images.
3. Results
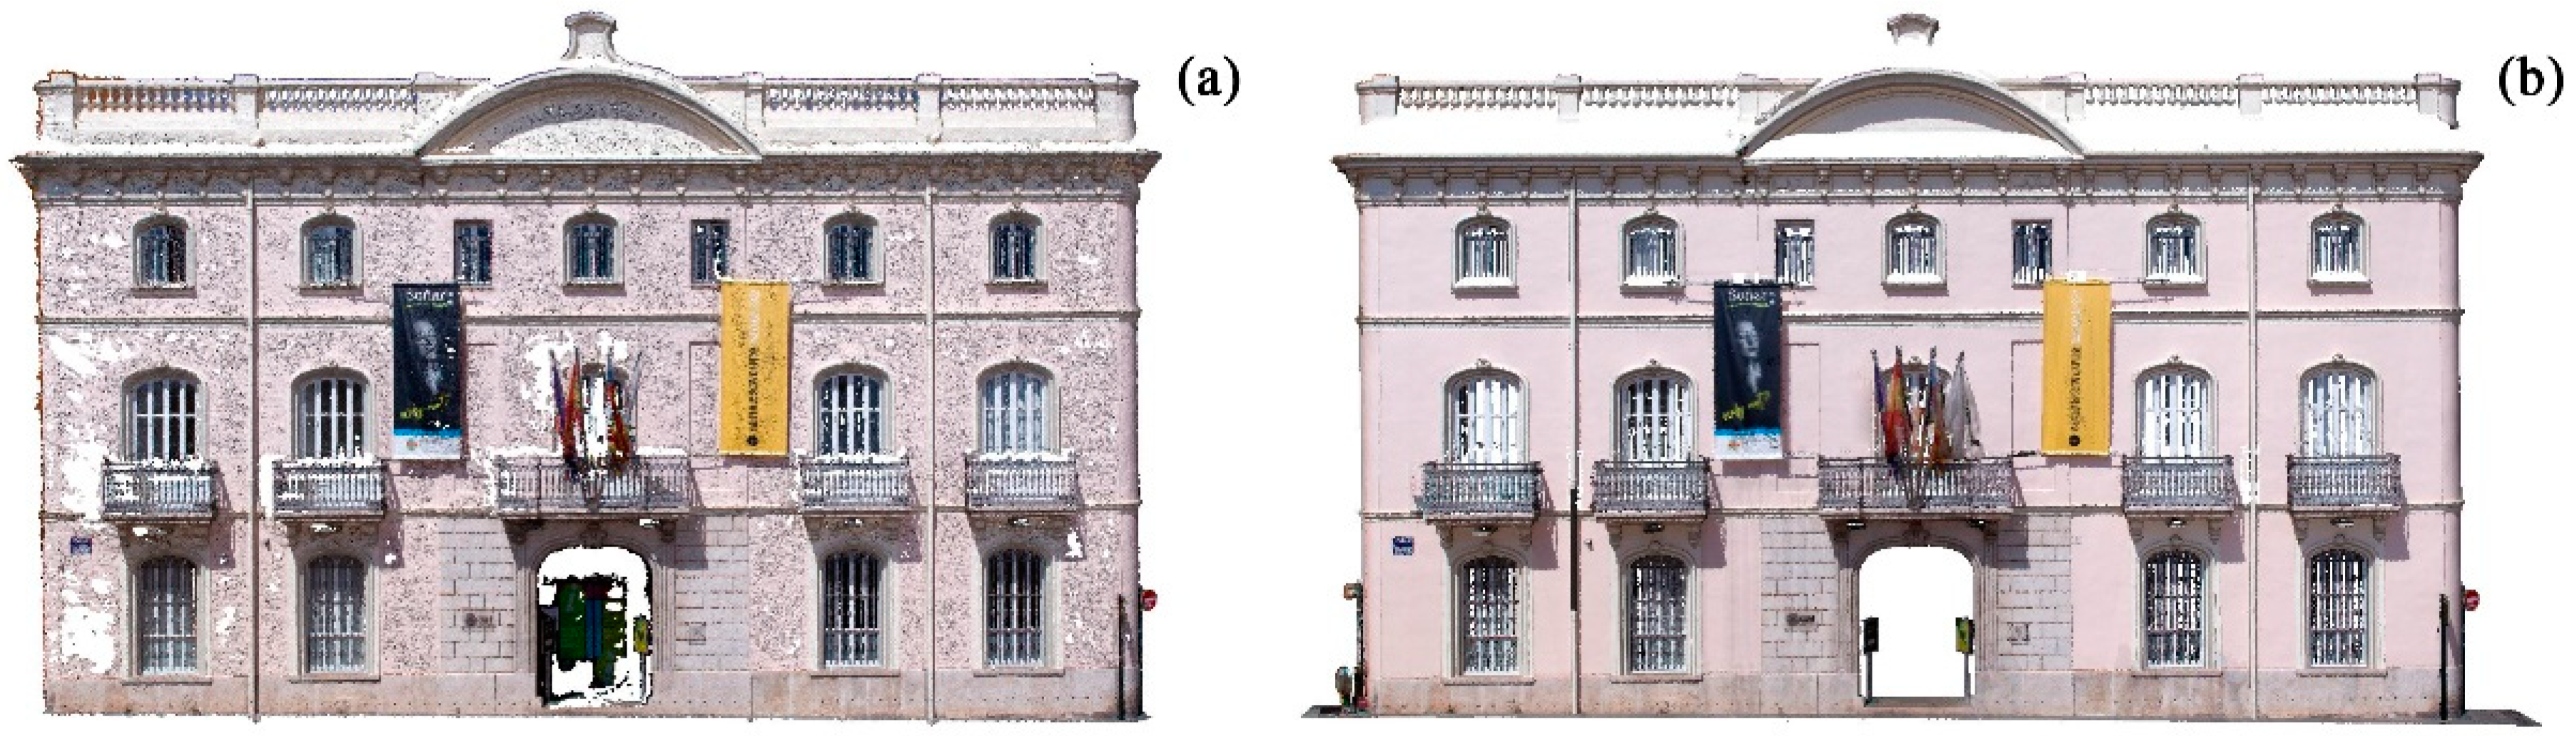
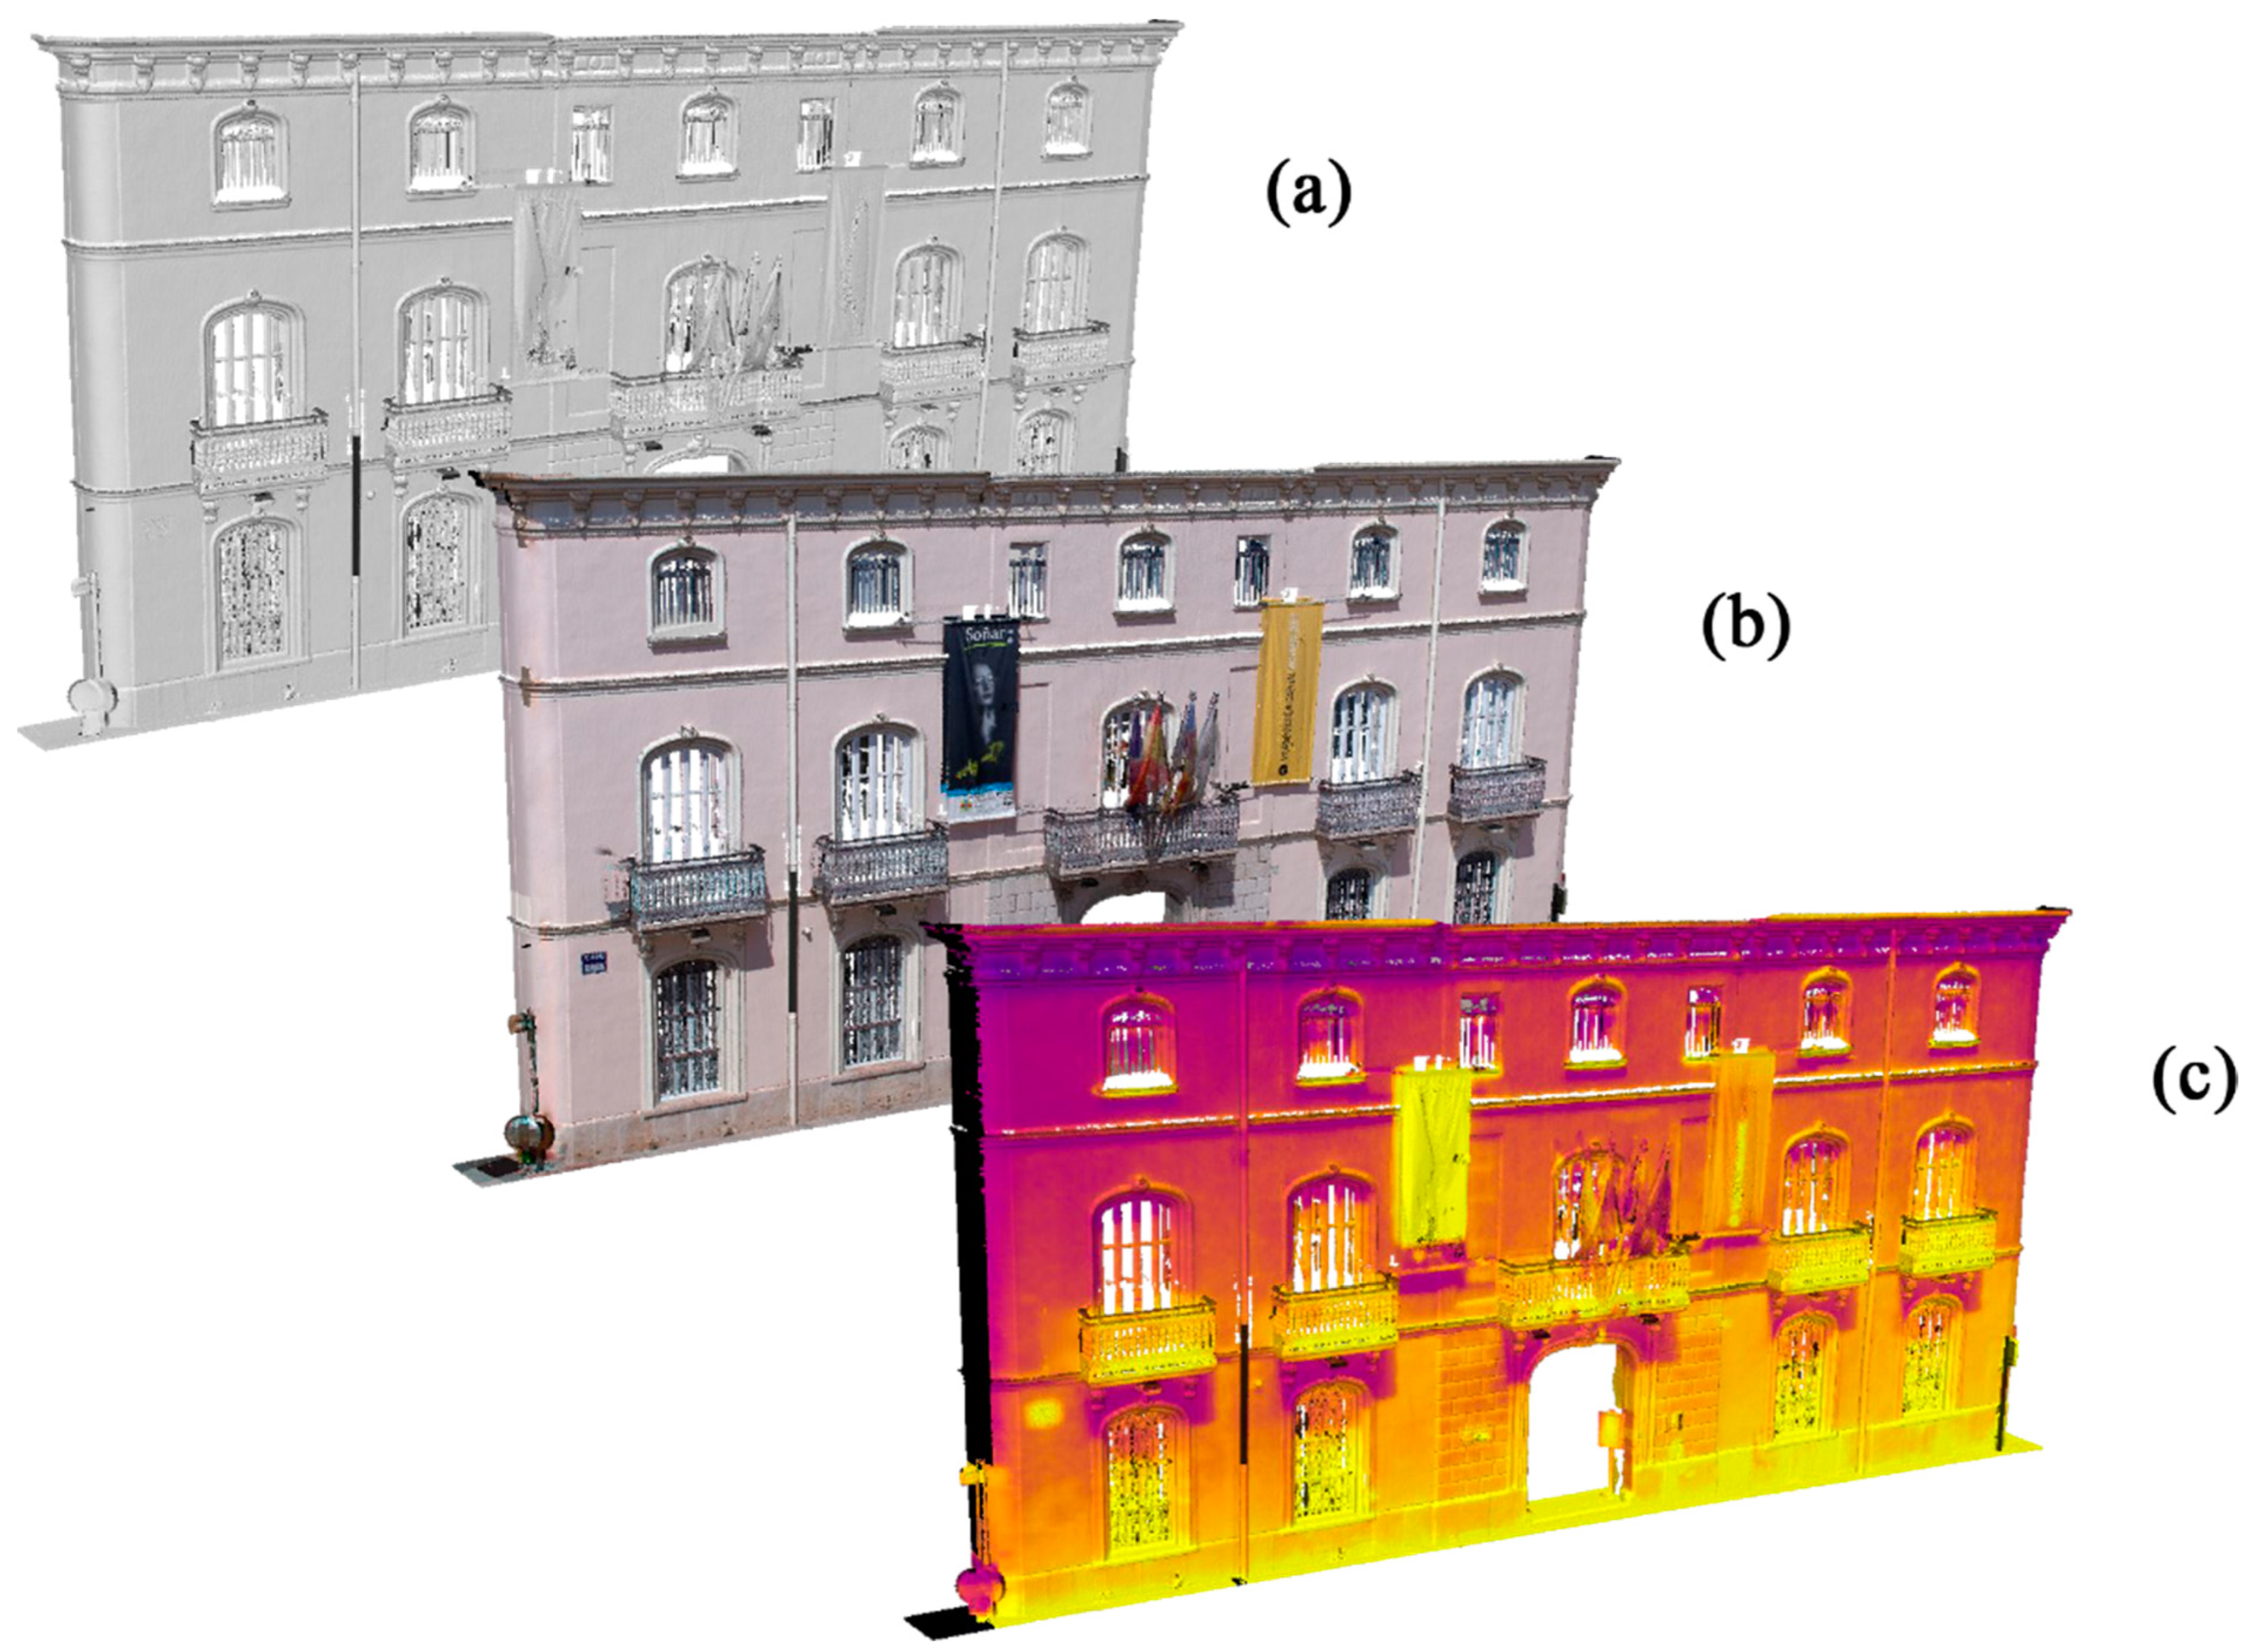
3.1. 3D Data Fusion for Enriched Models Generation
- TIR-colourised LiDAR point cloud;
- True colour-colourised LiDAR point cloud;
- High-resolution TIR-texturised 3D mesh;
- High-resolution true colour-texturised 3D mesh;
- High-resolution TIR orthoimagery;
- High-resolution true-colour orthoimagery.
3.2. Parametric Modelling
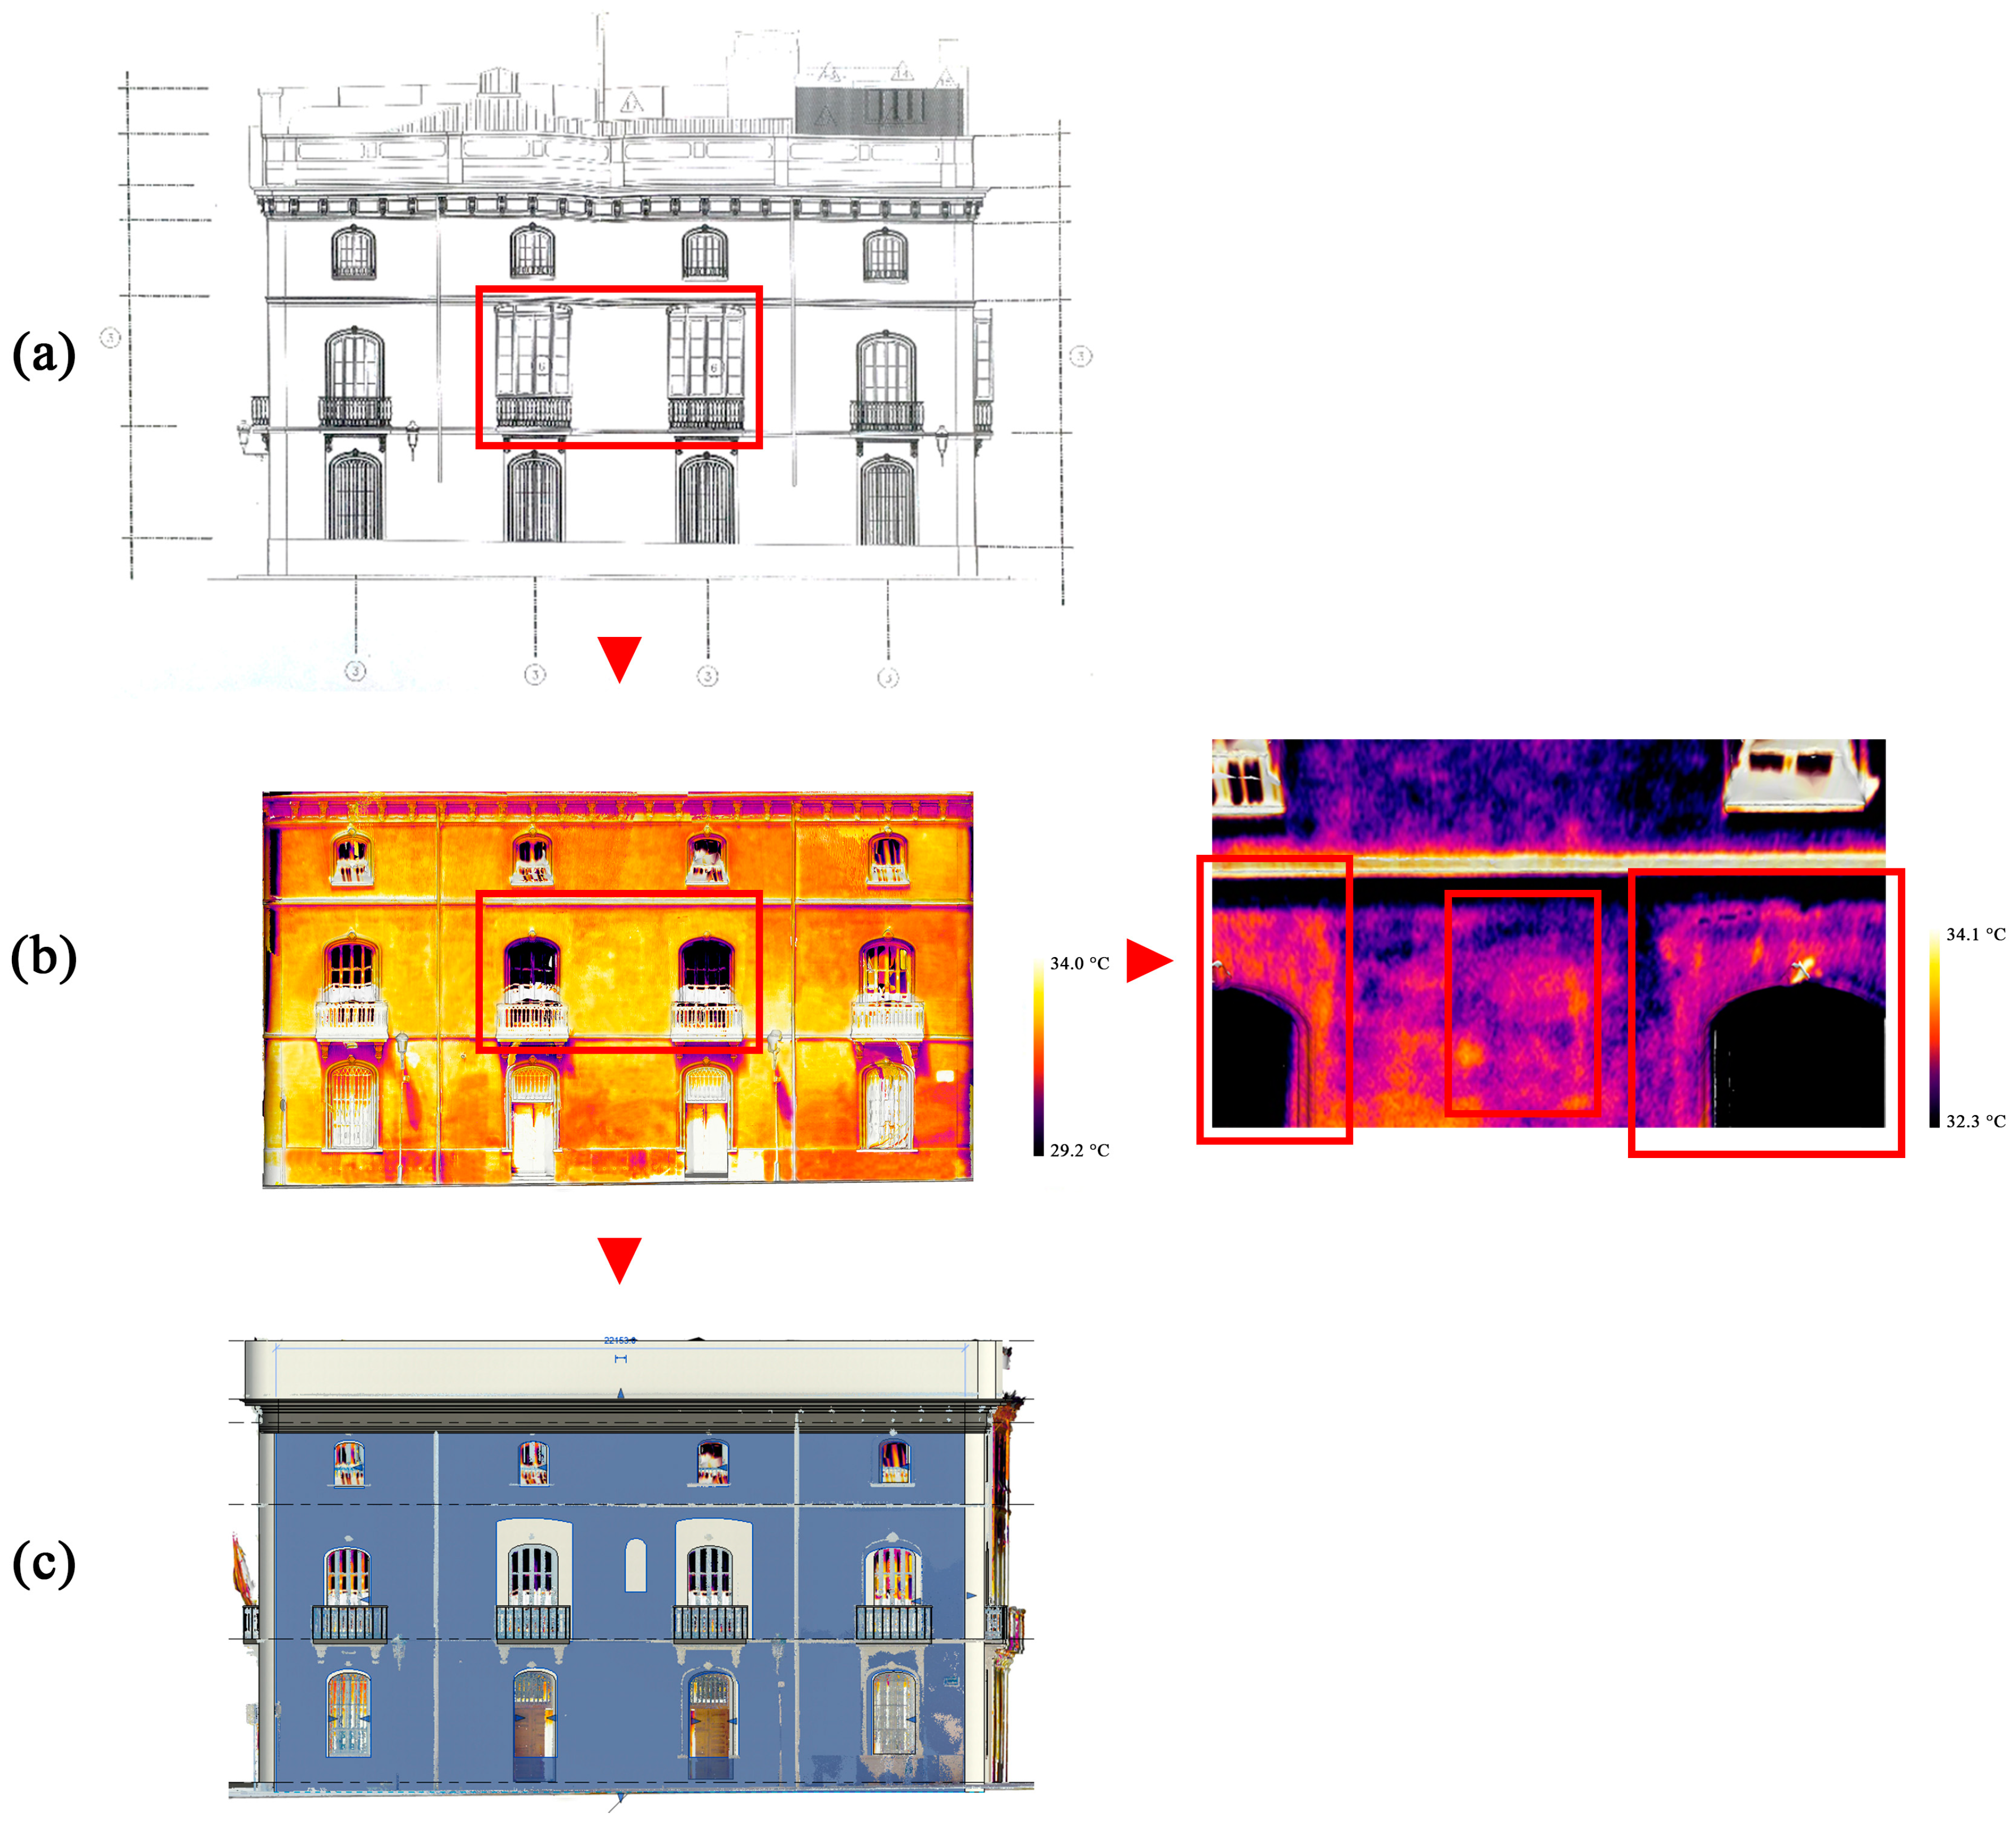
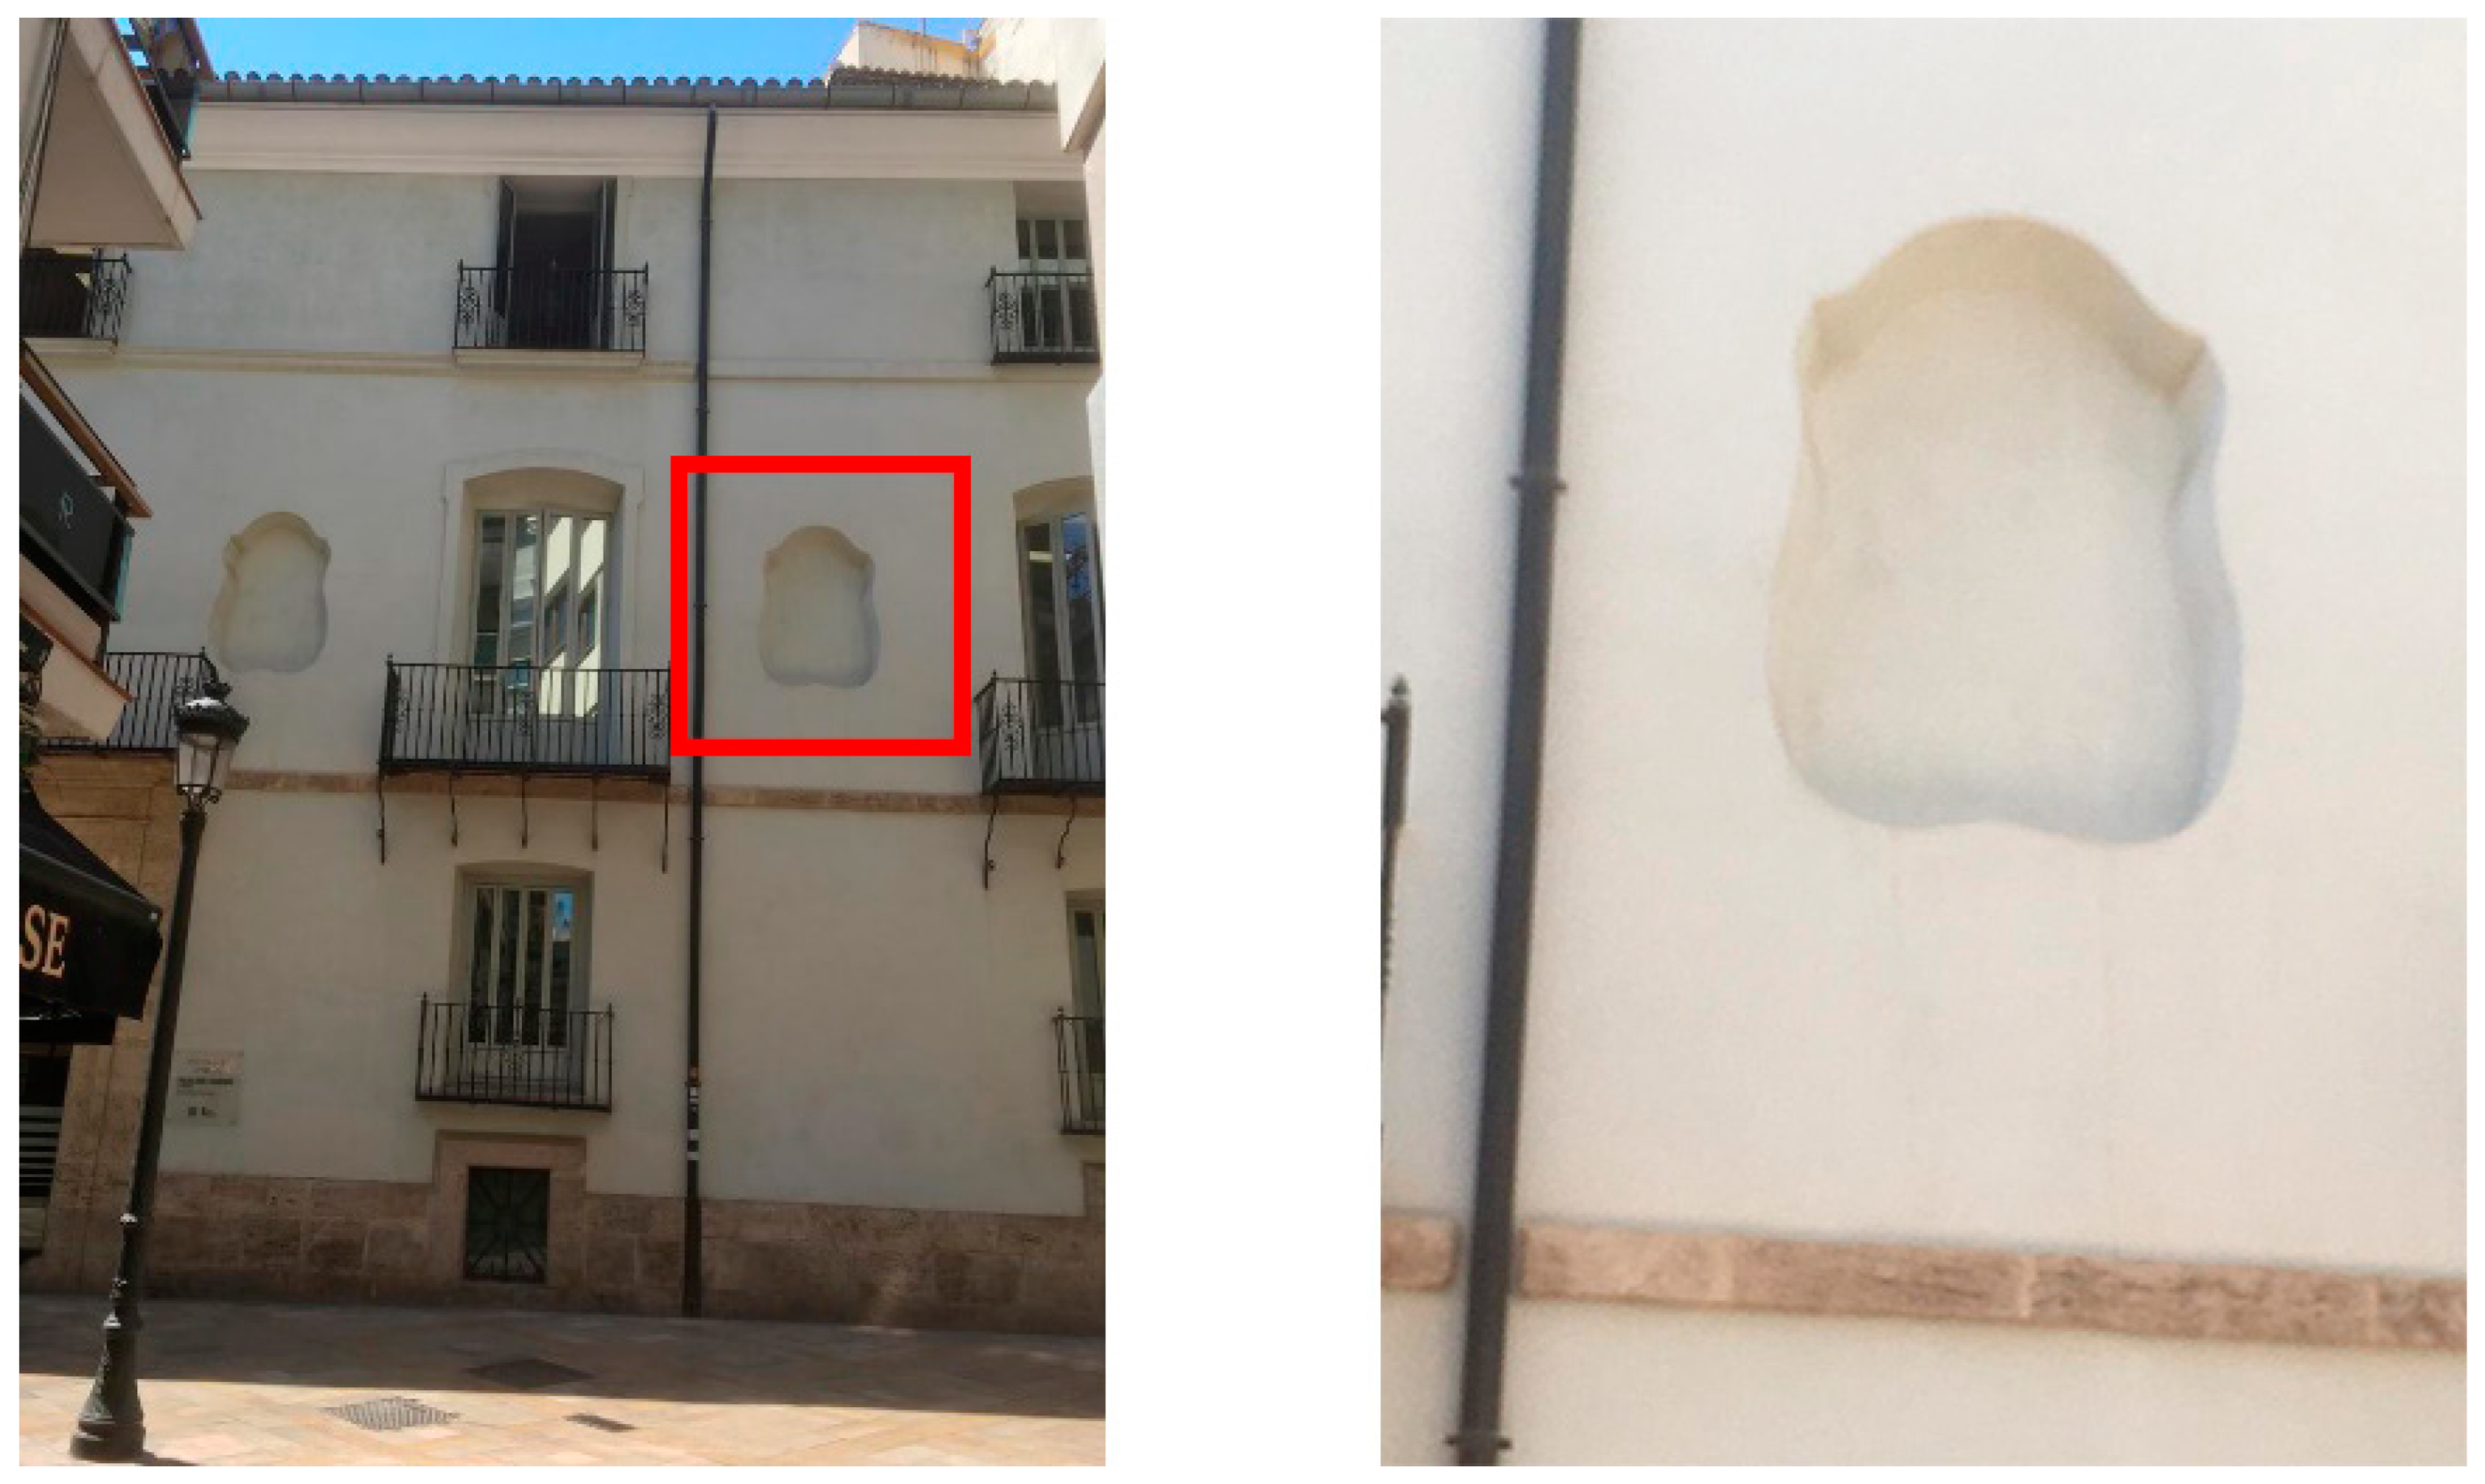
4. Discussion
- Traces that are consistent with the presence of architectural elements obliterated by subsequent building interventions (Figure 14);
- Possible clues of drastic modifications regarding the volume of the building.
5. Conclusions
Author Contributions
Funding
Conflicts of Interest
References
- Moropoulou, A.; Avdelidis, N.P.; Karoglou, M.; Delegou, E.T.; Alexakis, E.; Keramidas, V. Multispectral Applications of Infrared Thermography in the Diagnosis and Protection of Built Cultural Heritage. Appl. Sci. 2018, 8, 284. [Google Scholar] [CrossRef]
- Jones, C.; Duffy, C.; Gibson, A.; Terras, M. Understanding multispectral imaging of cultural heritage: Determining best practice in MSI analysis of historical artefacts. J. Cult. Herit. 2020, 45, 339–350. [Google Scholar] [CrossRef]
- Adamopoulos, E.; Rinaudo, F. Close-range Sensing and Data Fusion for Built Heritage Inspection and Monitoring. Remote Sens. 2021, 13, 3936. [Google Scholar] [CrossRef]
- Tucci, G.; Bonora, V.; Conti, A.; Fiorini, L. Digital workflow for the acquisition and elaboration of 3D data in a monumental complex: The Fortress of Saint John the Babtist in Florence. Int. Arch. Photogramm. Remote Sens. Spatial Inf. Sci. 2017, XLII-2/W5, 679–686. [Google Scholar] [CrossRef] [Green Version]
- Costantino, C.; Prati, D.; Predari, G.; Bartolomei, C. 3D laser scanner survey for cultural heritage. A flexible methodology to otpimize data collection. Int. Arch. Photogramm. Remote Sens. Spatial Inf. Sci. 2020, XLIII-B2-2020, 821–828. [Google Scholar] [CrossRef]
- Aliberti, L.; Iglesias Picazo, P. Close-range photogrammetry practice: Graphic documentation of the interior of the walls of Avila (Spain). Int. Arch. Photogramm. Remote Sens. Spatial Inf. Sci. 2019, XLII-2/W15, 49–53. [Google Scholar] [CrossRef] [Green Version]
- Nex, F.; Remondino, F. UAV for 3D mapping applications: A review. Appl. Geomat. 2013, 6, 1–15. [Google Scholar] [CrossRef]
- Stylianidis, E.; Remondino, F. (Eds.) 3D Recording, Documentation and Management of Cultural Heritage; Whittles Publishing: Caithness, UK, 2016. [Google Scholar]
- Santan Quintero, M.; Eppich, R. Chapter 1: Introduction—Current Trends in Cultural Heritage and Documentation. In 3D Recording, Documentation and Management of Cultural Heritage; Stylianidis, E., Remondino, F., Eds.; Whittles Publishing: Caithness, UK, 2016; pp. 1–14. [Google Scholar]
- Murtiyoso, A.; Grussenmeyer, P.; Suwardhi, D.; Awalludin, R. Multi-Scale and Multi-Sensor 3D Documentation of Heritage Complexes in Urban Areas. ISPRS Int. J. Geo-Inf. 2018, 7, 483. [Google Scholar] [CrossRef] [Green Version]
- Barsanti, S.G.; Remondino, F.; Jiménez Fenández-Palacios, B.; Visintini, D. Critical Factors and Guidelines for 3D Surveying and Modelling in Cultural Heritage. Int. J. Herit. Dig. Era 2014, 3, 141–158. [Google Scholar] [CrossRef] [Green Version]
- Grinzato, E.; Bison, P.G.; Marinetti, S. Monitoring of ancient buildings by the thermal method. J. Cult. Her. 2002, 3, 21–29. [Google Scholar] [CrossRef]
- Mercuri, F.; Cicero, C.; Orazi, N.; Paoloni, S.; Marinelli, M.; Zammit, U. Infrared Thermography Applied to the Study of Cultural Heritage. Int. J. Thermophys. 2015, 36, 1189–1194. [Google Scholar] [CrossRef]
- Trevisiol, F.; Barbieri, S.; Bitelli, G. Multitemporal Thermal Imagery Acquisition and Data Processing on Historical Masonry: Experimental Application on a Case Study. Sustainability 2022, 14, 10559. [Google Scholar] [CrossRef]
- Castillo, R.; Pérez-Lara, M.; Rivera-Muñoz, E.; Arjona, J.; Rodríguez-García, M.; Acosta-Osorio, A.; Galván-Ruiz, M. Thermal Imaging as a Non Destructive Testing Implemented in Heritage Conservation. J. Geograph. Geolog. 2012, 4, 102–113. [Google Scholar] [CrossRef]
- Luib, A. Infrared-Thermography in Building Archaeology. Possible Applications and Limitations; University of Bamberg Press: Bamberg, Germany, 2021; (In German). [Google Scholar] [CrossRef]
- Cabrelles, M.; Galcerá, S.; Navarro, S.; Lerma, J.L.; Akasheh, T.; Haddad, N. Integration of 3D laser scanning, photogrammetry and thermography to record architectural monuments. In Proceedings of the 22nd CIPA Symposium, Kyoto, Japan, 11–15 October 2009. [Google Scholar]
- Lin, D.; Jarzabek-Rychard, M.; Tong, X.; Maas, H.G. Fusion of thermal imagery with point clouds for building façade thermal attribute mapping. ISPRS J. Photogramm. Remote Sens. 2019, 151, 162–175. [Google Scholar] [CrossRef]
- Previtali, M.; Barazzetti, L.; Redaelli, V.; Scaioni, M.; Rosina, E. Rigorous procedure for mapping thermal infrared images on three-dimensional models of building façades. J. Appl. Remote Sens. 2013, 7, 073503. [Google Scholar] [CrossRef] [Green Version]
- Dlesk, A.; Vach, K.; Pavelka, K. Photogrammetric Co-Processing of Thermal Infrared Images and RGB Images. Sensors 2022, 22, 1655. [Google Scholar] [CrossRef]
- Patrucco, G.; Cortese, G.; Tonolo Giulio, F.; Spanò, A. Thermal and optical data fusion supporting built heritage analyses. Int. Arch. Photogramm. Remote Sens. Spat. Inf. Sci. 2020, XLIII-B3-2020, 619–626. [Google Scholar] [CrossRef]
- Patrucco, G.; Giulio Tonolo, F.; Sammartano, G.; Spanò, A. SfM-based 3D reconstruction of heritage assets using UAV thermal images. Int. Arch. Photogramm. Remote Sens. Spat. Inf. Sci. 2022, XLIII-B1-2022, 399–406. [Google Scholar] [CrossRef]
- Costantino, D.; Pepe, M.; Restuccia, A. Scan-to-HBIM for conservation and preservation of Cultural Heritage building: The case study of San Nicola in Montedoro church (Italy). Appl. Geomat. 2021, 1–15. [Google Scholar] [CrossRef]
- Pybus, C.; Graham, K.; Doherty, J.; Arellano, N.; Fai, S. New realities for Canada’s Parliament: A workflow for preparing Heritage BIM for game engines and virtual reality. Int. Arch. Photogramm. Remote Sens. Spatial Inf. Sci. 2019, XLII-2/W15, 945–952. [Google Scholar] [CrossRef] [Green Version]
- Reina Ortiz, M.; Yang, C.; Weigert, A.; Dhanda, A.; Min, A.; Gyi, M.; Su, S.; Fai, S.; Santana Quintero, M. Integrating heterogeneous datasets in HBIM of decorated surfaces. Int. Arch. Photogramm. Remote Sens. Spatial Inf. Sci. 2019, XLII-2/W15, 981–988. [Google Scholar] [CrossRef] [Green Version]
- Martinez Sánchez, R. El almudín de Valencia: Una restauración oportuna para la ciudad. Inf. Constr. 1998, 49, 29–49. [Google Scholar] [CrossRef] [Green Version]
- Alonso, L.; Perdigón Fernández, A.; Alberto, L. Cartografía Histórica de la Ciudad de Valencia (1608–1944); Universitat Politècnica de València: Valencia, Spain, 2010. [Google Scholar]
- Lerma, J.L.; Cabrelles, M.; Akasheh, T.S.; Haddad, N.A. Documentation of Weathered Architectural Heritage with Visible, Near Infrared, Thermal and Laser Scanning Data. Int. J. Herit. Digit. Era 2012, 1, 251–275. [Google Scholar] [CrossRef]
- Scaioni, M.; Rosina, E.; L’Erario, A.; Dìaz-Vilariño, L. Integration of infrared thermography and photogrammetric surveying of built landscape. Int. Arch. Photogramm. Remote Sens. Spatial Inf. Sci. 2017, XLII-5/W1, 153–160. [Google Scholar] [CrossRef] [Green Version]
- Akçay, Ö. Photogrammetric analysis of multispectral and thermal close-range images. Mersin Photogramm. J. 2021, 3, 29–36. [Google Scholar] [CrossRef]
- Javadnejad, F.; Gillins, D.T.; Parrish, C.E.; Slocum, R.K. A Photogrammetric Approach to Fusing Natural Colour and Thermal Infrared UAS imagery in 3D Point Cloud Generation. Int. J. Remote Sens. 2019, 41, 211–237. [Google Scholar] [CrossRef]
- Hill, A.; Jakoby Laugier, E.; Casana, J. Archaeological Remote Sensing Using Multi-Temporal, Drone-Acquired Thermal and Near Infrared (NIR) Imagery: A Case Study at the Enfield Shaker Village, New Hampshire. Remote Sens. 2020, 12, 690. [Google Scholar] [CrossRef] [Green Version]
- Adamopoulos, E.; Patrucco, G.; Volinia, M.; Girotto, M.; Rinaudo, F.; Giulio Tonolo, F.; Spanò, A. 3D Thermal Mapping of Architectural Heritage. Up-to-Date Workflows for the Production of Three-Dimensional Thermographic Models for Built Heritage NDT. In Progress in Cultural Heritage: Documentation, Preservation, and Protection; Ioannides, M., Fink, E., Cantoni, L., Champion, E., Eds.; Springer: Cham, Switzerland, 2021; pp. 26–37. [Google Scholar] [CrossRef]
- Barazzetti, L. Parametrica as-built model generation of complex shapes from point clouds. Adv. Eng. Inform. 2016, 30, 298–311. [Google Scholar] [CrossRef]
- Nieto Julián, J.E.; Moyano Campos, J.J.; Rico Delgado, F.; Antón García, D.B. Management of built heritage via HBIM project: A case study of flooring and tiling. Virtual Archaeol. Rev. 2016, 7, 1–12. [Google Scholar] [CrossRef]
- Simeone, D.; Cursi, S.; Toldo, I.; Carrara, G. BIM and Knowledge Management for Building Heritage. In Proceedings of the 34th Annual Conference of the Association for Computer Aided Design in Architecture (ACADIA), Los Angeles, CA, USA, 23–25 October 2014. [Google Scholar]
- Murphy, M.; McGovern, E.; Pavia, S. Historic Building Information Modelling—Adding intelligence to laser and image based surveys of European classical architecture. ISPRS J. Photogramm. Remote Sens. 2013, 76, 89–102. [Google Scholar] [CrossRef]
- Laefer, D.F.; Truong-Hong, L. Toward automatic generation of 3D steel structures for building information modelling. Autom. Constr. 2017, 74, 66–77. [Google Scholar] [CrossRef]
- Jarząbek-Rychard, M.; Lin, D.; Maas, H.G. Supervised detection of façade openings in 3D point clouds with thermal attributes. Remote Sens. 2020, 12, 543. [Google Scholar] [CrossRef] [Green Version]
- Croce, P.; Landi, F.; Puccini, B.; Martino, M.; Maneo, A. Parametric HBIM Procedure for the Structural Evaluation of Heritage Masonry Buildings. Buildings 2022, 12, 194. [Google Scholar] [CrossRef]
- Colosi, F.; Malinverni, E.S.; Leon Trujillo, F.J.; Pierdicca, R.; Orazi, R.; Di Stefano, F. Exploiting HBIM for Historical Mud Architecture: The Huaca Arco Iris in Chan Chan (Peru). Heritage 2022, 5, 2062–2082. [Google Scholar] [CrossRef]
- Patrucco, G.; Perri, S.; Sammartano, G.; Fillia, E.; Matteini, I.; Lenticchia, E.; Ceravolo, R.; Spanò, A. 3D models and non-destructive investigations: Towards a meeting in digital twins. Int. Arch. Photogramm. Remote Sens. Spatial Inf. Sci. 2022, XLIII-B2-2022, 845–852. [Google Scholar] [CrossRef]
- Brumana, R.; Della Torre, S.; Previtali, M.; Barazzetti, L.; Cantini, L.; Oreni, D.; Banfi, F. Generative HBIM modelling to embody complexity (LOD, LOG, LOA, LOI): Surveying, preservation, site intervention—The Basilica di Collemaggio (L’Aquila). Appl. Geomat. 2018, 10, 545–567. [Google Scholar] [CrossRef]
- Garcia-Gago, J.; Sánchez-Aparicio, L.J.; Soilán, M.; González-Aguilera, D. HBIM for supporting the diagnosis of historical buildings: Case study of the Master Gate of San Francisco in Portugal. Autom. Constr. 2022, 141, 104453. [Google Scholar] [CrossRef]


| Trimble TX6 Laser Scanner | |
|---|---|
| Distance measurements | Phase shift |
| Wavelength | 1.5 µm |
| Extended range | 120 m |
| Horizontal and vertical range | 360°/317° |
| Distance accuracy | <2 mm (1 sigma) |
| Acquisition speed | 500.000 pts/sec |
| Camera | RGB |
| Canon EOS 5D Mark II | |
| Sensor | CMOS 21.1 Mpx |
| Sensor size | Full frame (36 × 24 mm) |
| Image size | 5616 × 3744 pixels |
| Focal length | 24 mm |
| FLIR ThermaCAMTM B4 | |
| Thermal imager | Focal Plane Array (FPA), uncooled microbolometer |
| Focal length | 45 mm |
| Image size | 320 × 240 pixels |
| Spectral band | 7.5 to 13 µm |
| Temperature range | −20 °C to +50 °C |
| Thermal accuracy | ±2 °C, ±2% |
| Thermal sensitivity | 0.08 °C at 30 °C |
| Parametric Model | LiDAR Point Cloud | Thermal Orthophoto | Historical Plan, 1863 | Condition Mapping, 1995 | |
|---|---|---|---|---|---|
| North façade |  |  |  | 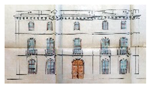 | 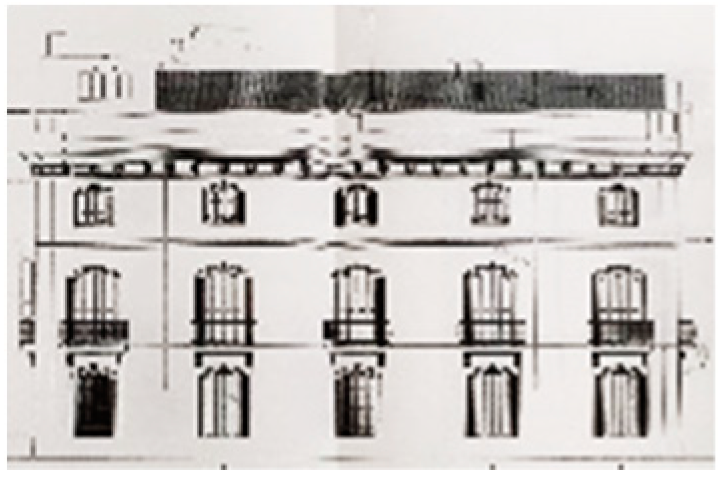 |
| Eastfaçade |  |  |  | 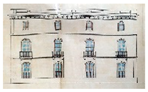 | 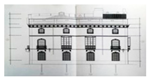 |
| South façade |  |  |  | 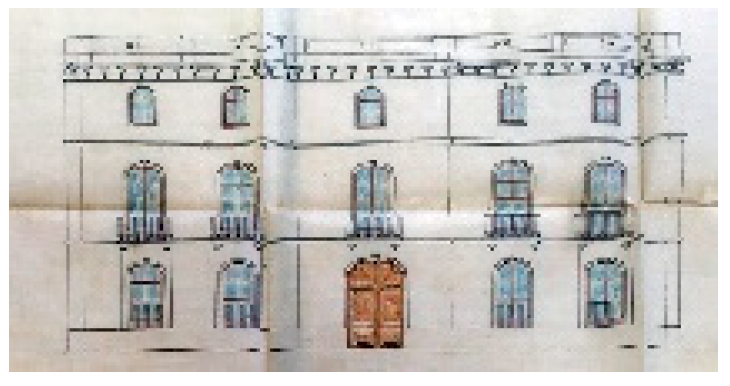 | 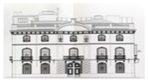 |
| West façade | 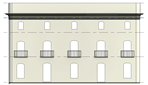 | 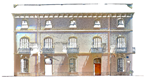 | 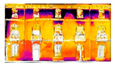 | 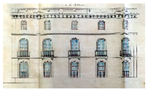 |  |
Publisher’s Note: MDPI stays neutral with regard to jurisdictional claims in published maps and institutional affiliations. |
© 2022 by the authors. Licensee MDPI, Basel, Switzerland. This article is an open access article distributed under the terms and conditions of the Creative Commons Attribution (CC BY) license (https://creativecommons.org/licenses/by/4.0/).
Share and Cite
Patrucco, G.; Gómez, A.; Adineh, A.; Rahrig, M.; Lerma, J.L. 3D Data Fusion for Historical Analyses of Heritage Buildings Using Thermal Images: The Palacio de Colomina as a Case Study. Remote Sens. 2022, 14, 5699. https://doi.org/10.3390/rs14225699
Patrucco G, Gómez A, Adineh A, Rahrig M, Lerma JL. 3D Data Fusion for Historical Analyses of Heritage Buildings Using Thermal Images: The Palacio de Colomina as a Case Study. Remote Sensing. 2022; 14(22):5699. https://doi.org/10.3390/rs14225699
Chicago/Turabian StylePatrucco, Giacomo, Antonio Gómez, Ali Adineh, Max Rahrig, and José Luis Lerma. 2022. "3D Data Fusion for Historical Analyses of Heritage Buildings Using Thermal Images: The Palacio de Colomina as a Case Study" Remote Sensing 14, no. 22: 5699. https://doi.org/10.3390/rs14225699