


System Structure–Based Drought Disaster Risk Assessment Using Remote Sensing and Field Experiment Data

Abstract
:
1. Introduction
2. Materials and Methods
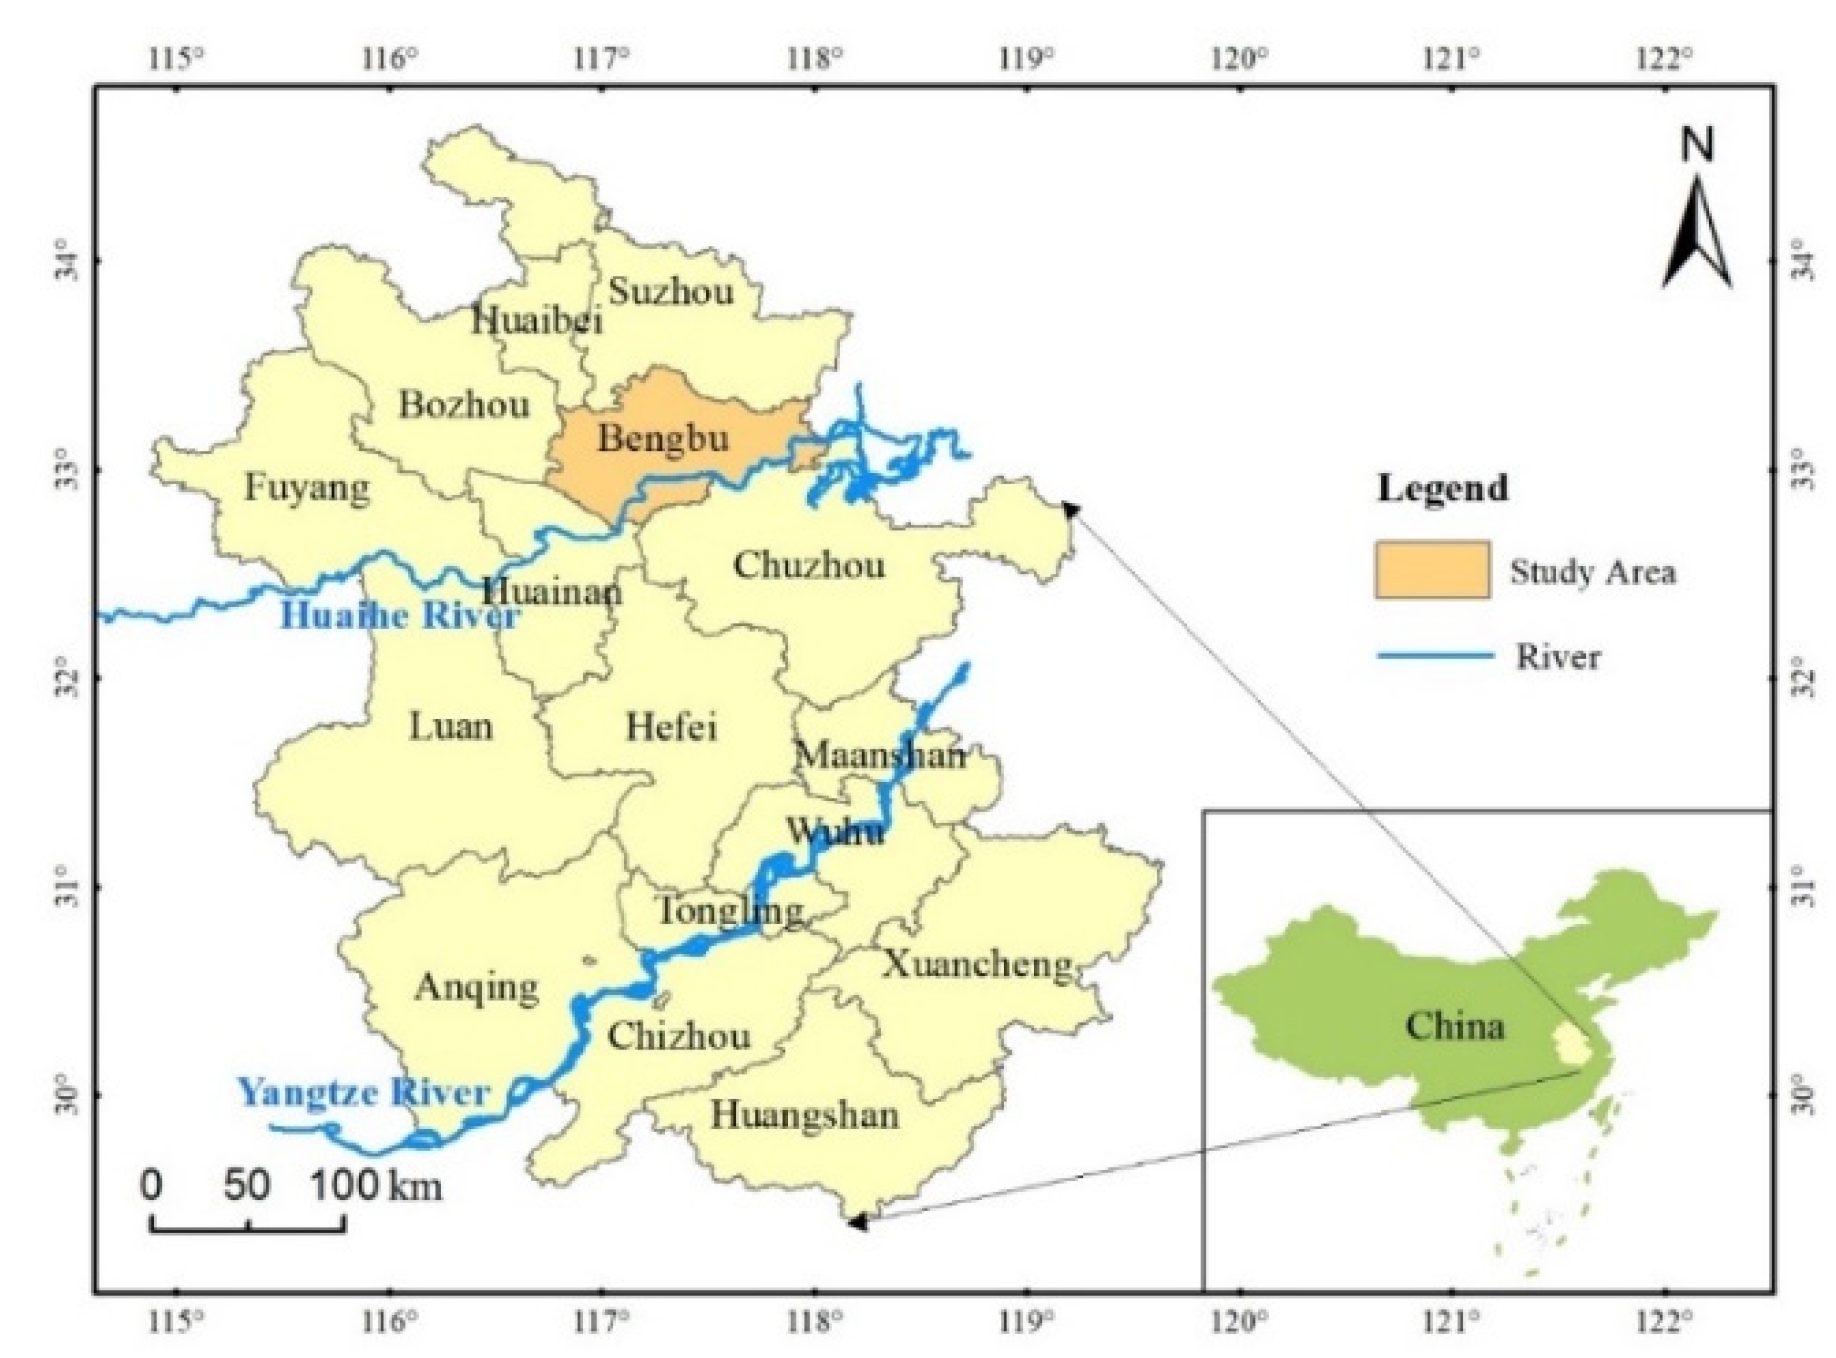
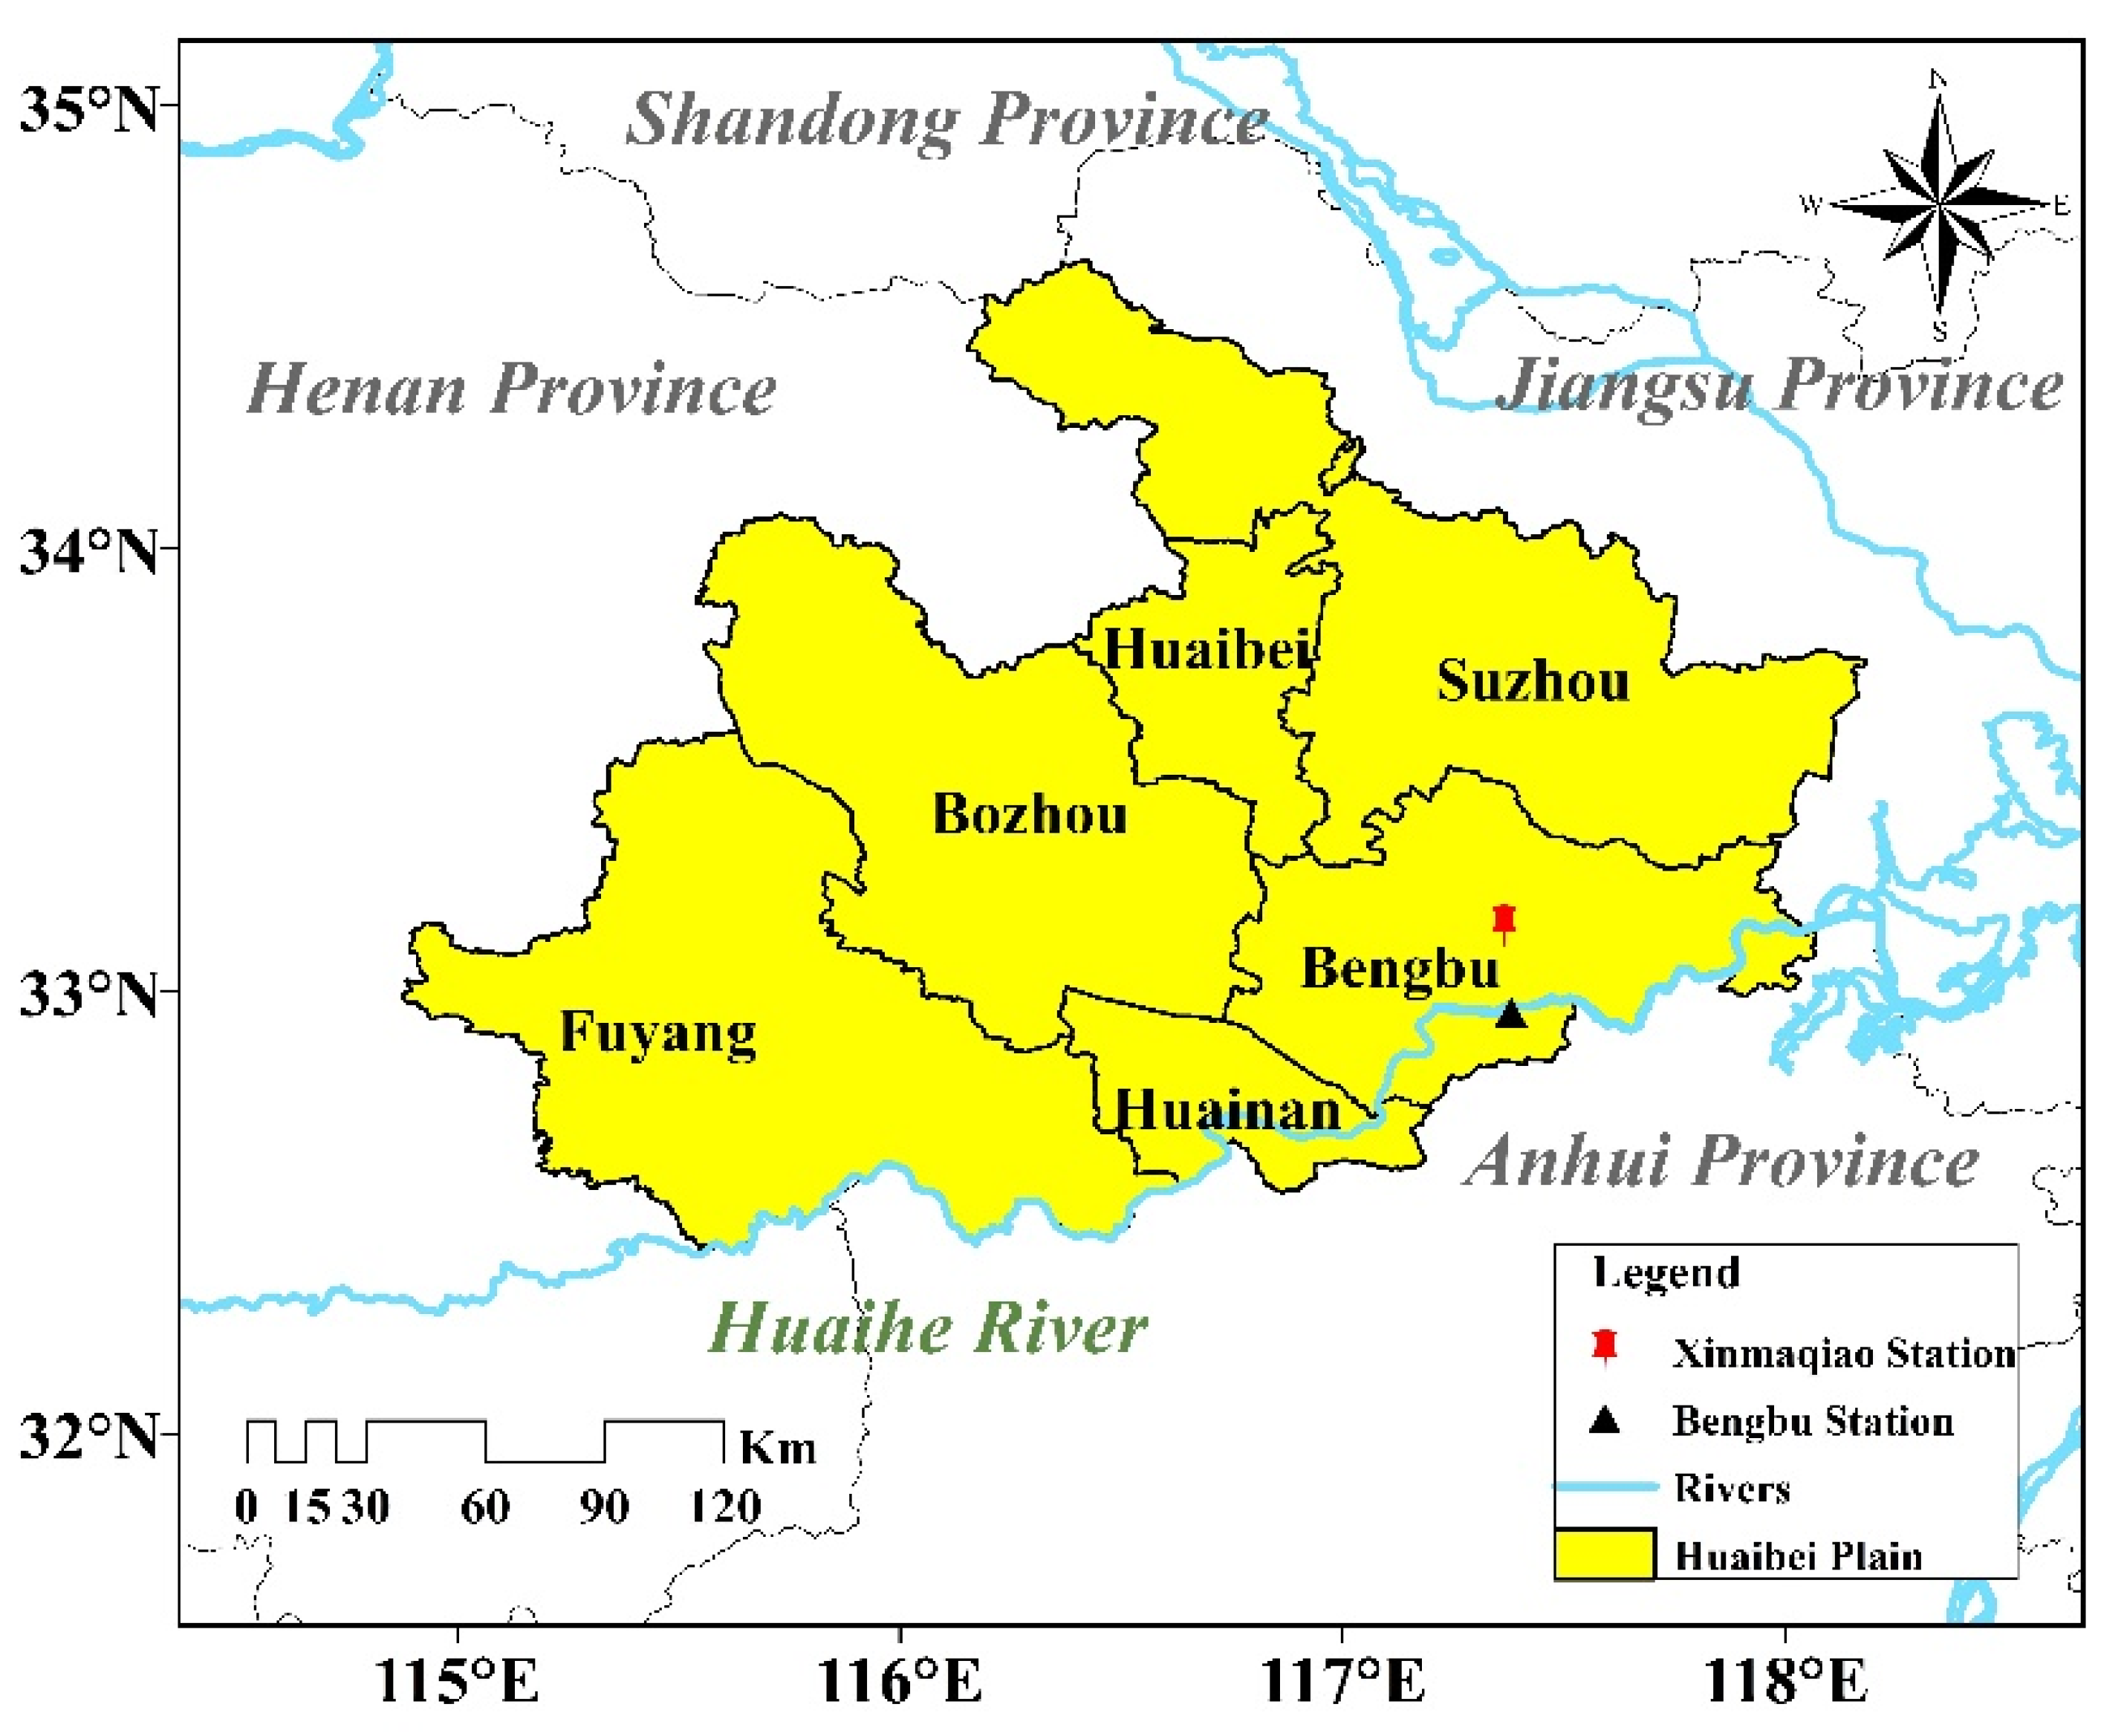
2.1. Study Area
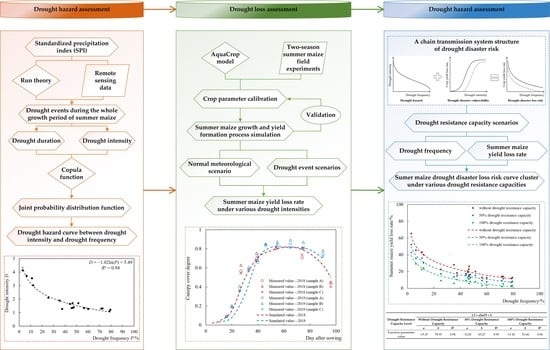
2.2. Establishment of Summer Maize Drought Disaster Risk Assessment Model
- (a)
- Drought frequency calculation
- (b)
- Drought resistance capacity simulation
- (c)
- AquaCrop model parameter calibration
- (d)
- Summer maize drought loss assessment
- (e)
- Summer maize drought disaster loss risk curve establishment
2.3. Remote Sensing Data and Techniques
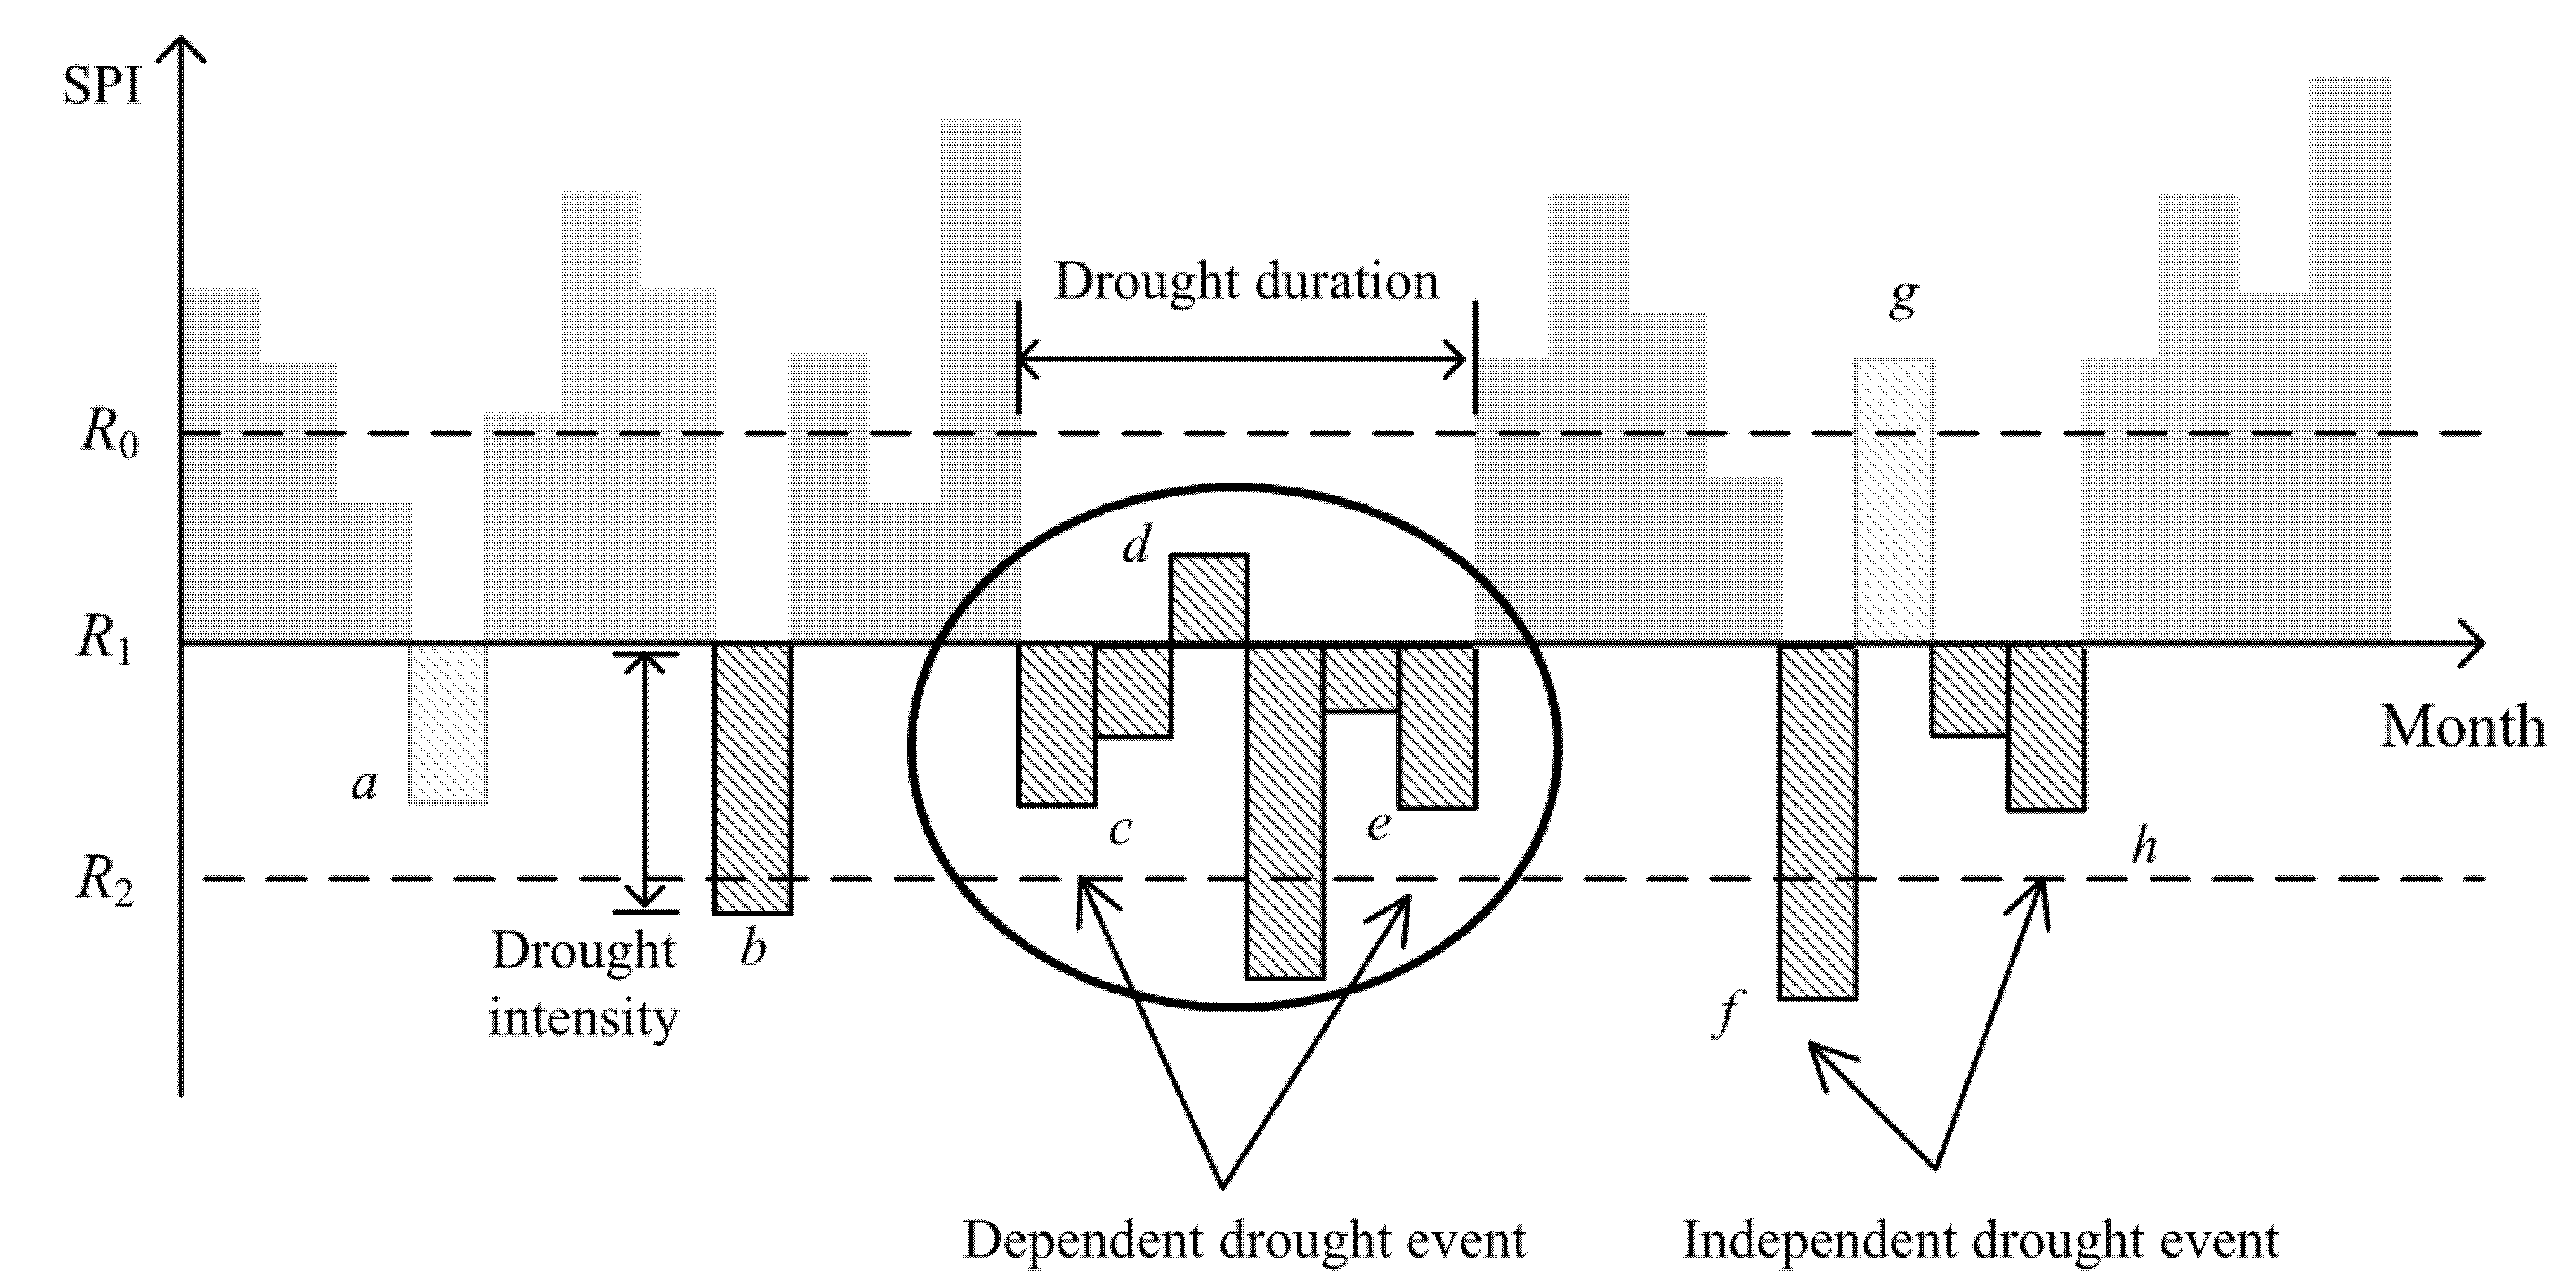
2.4. Drought Frenquency Calculation
- (1)
- When the SPI value was lower than R1, it was preliminarily determined that a drought event occurred in this month (such as a, b, c, e, f, and h in Figure 3). Otherwise, there were no droughts (such as g).
- (2)
- Then, for the drought event that lasted for only one month, when the SPI value was less than R2, it was finally considered that there was a drought event in that month (such as b and f). Otherwise, there were no droughts (such as a).
- (3)
- Furthermore, for two adjacent drought events with an interval of only one month, when the SPI value in the month of the interval was lower than R0, these two adjacent droughts were merged into one event. The drought duration was the sum of these two drought durations plus 1; the drought intensity was the sum of two drought intensities (such as c, d, and e). Otherwise, there were two independent droughts (such as f and h).
2.5. Summer Maize Field Experiments
2.5.1. Canopy Cover Degree
2.5.2. Aboveground Biomass
2.5.3. Seed Yield
2.6. Summer Maize Drought Loss Assessment
2.6.1. Input of AquaCrop Model
- (a)
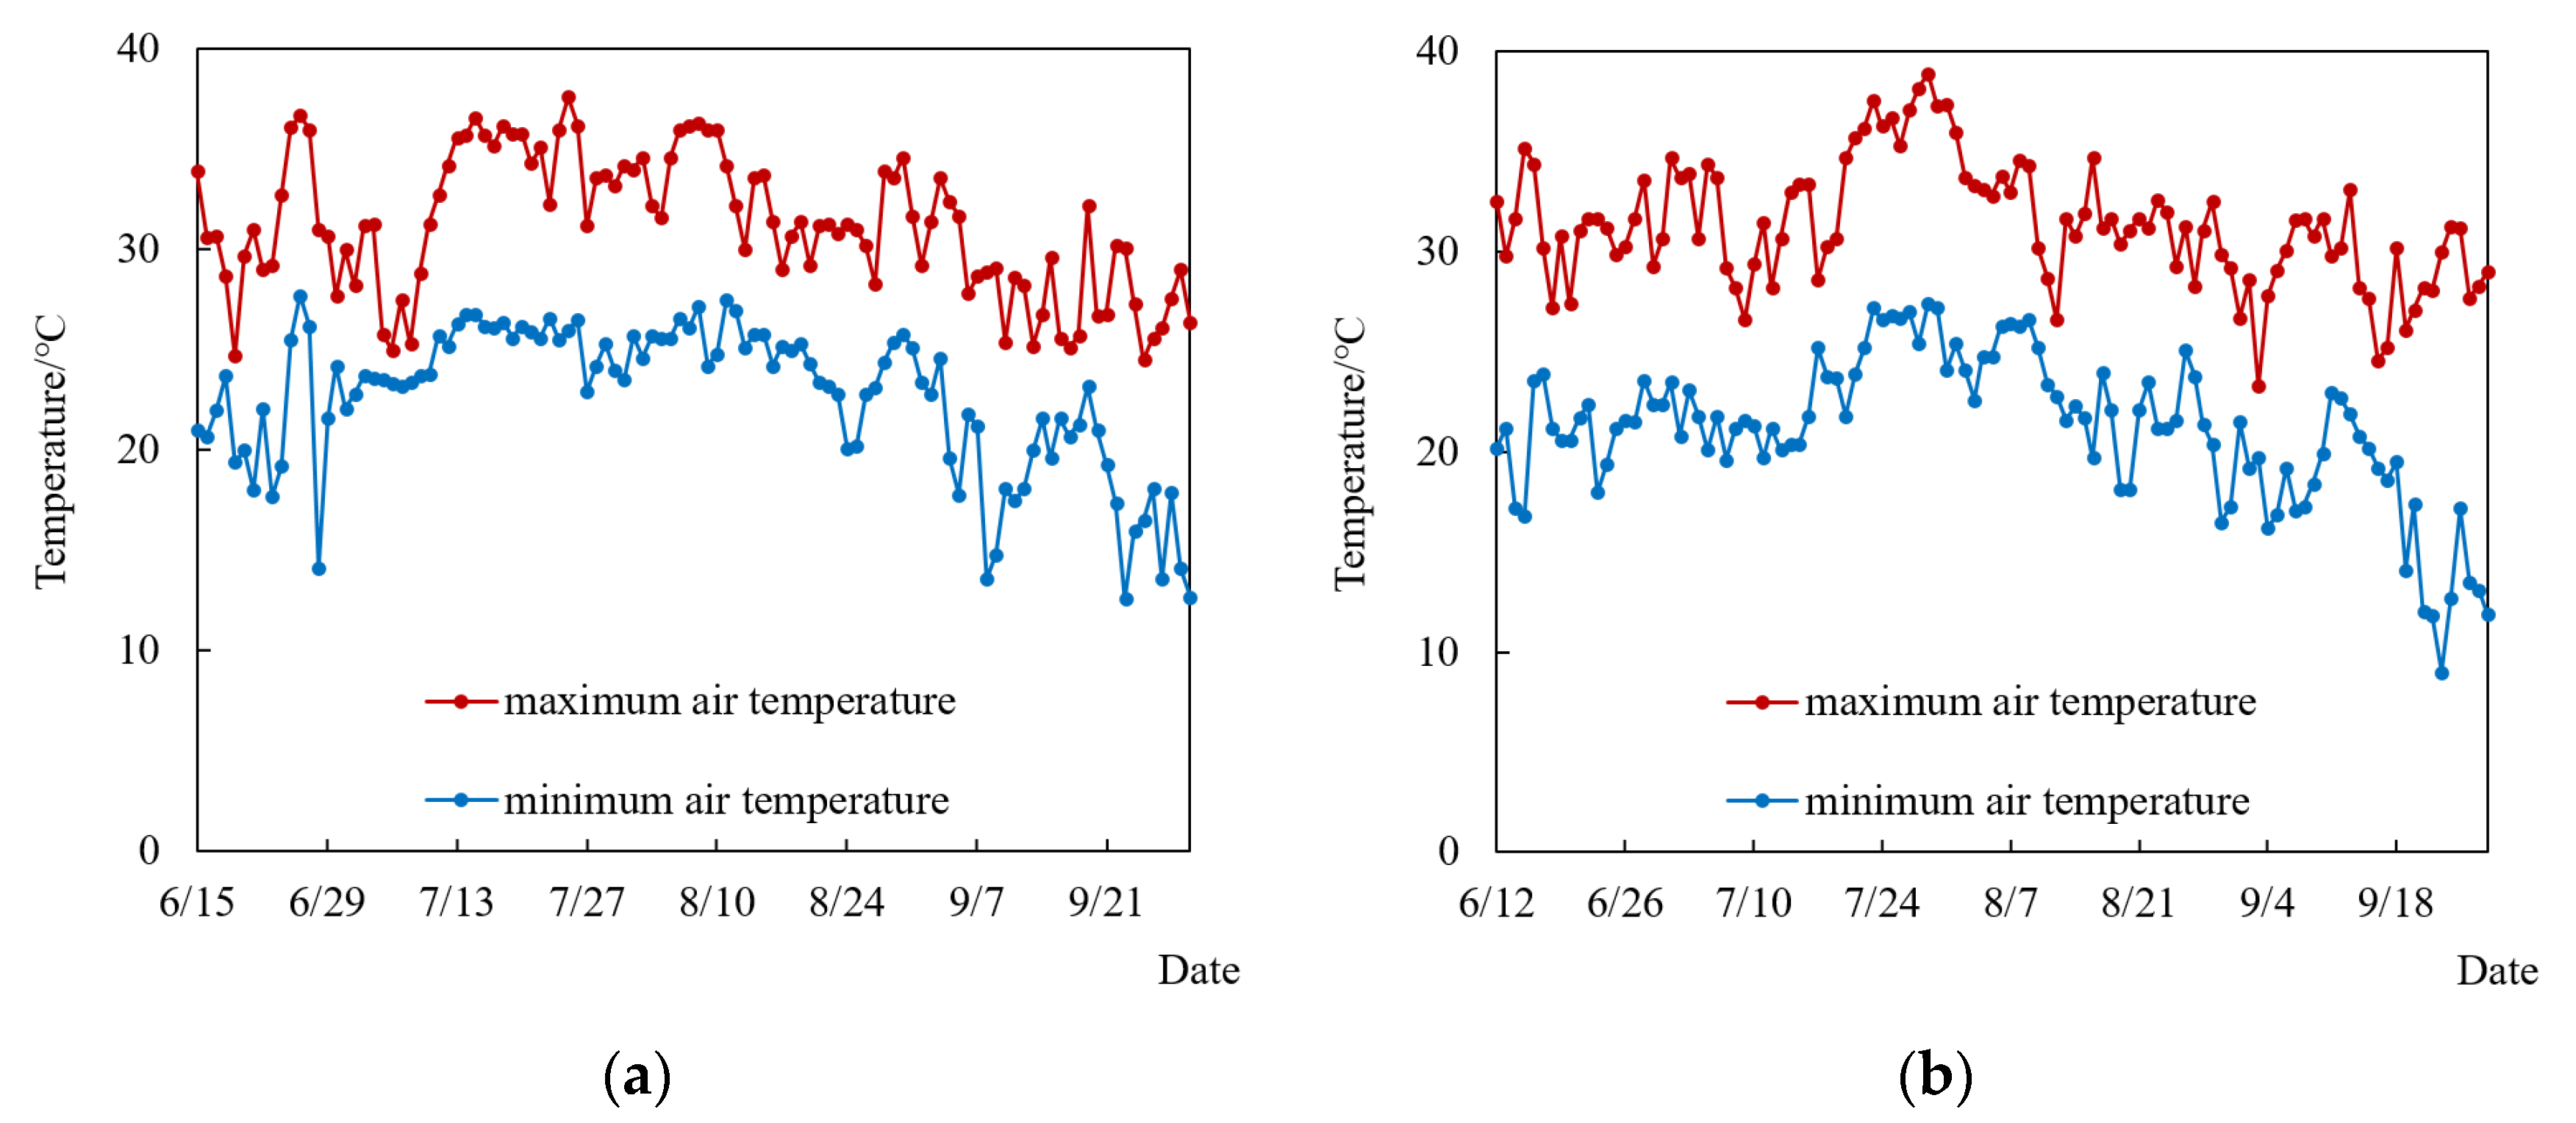
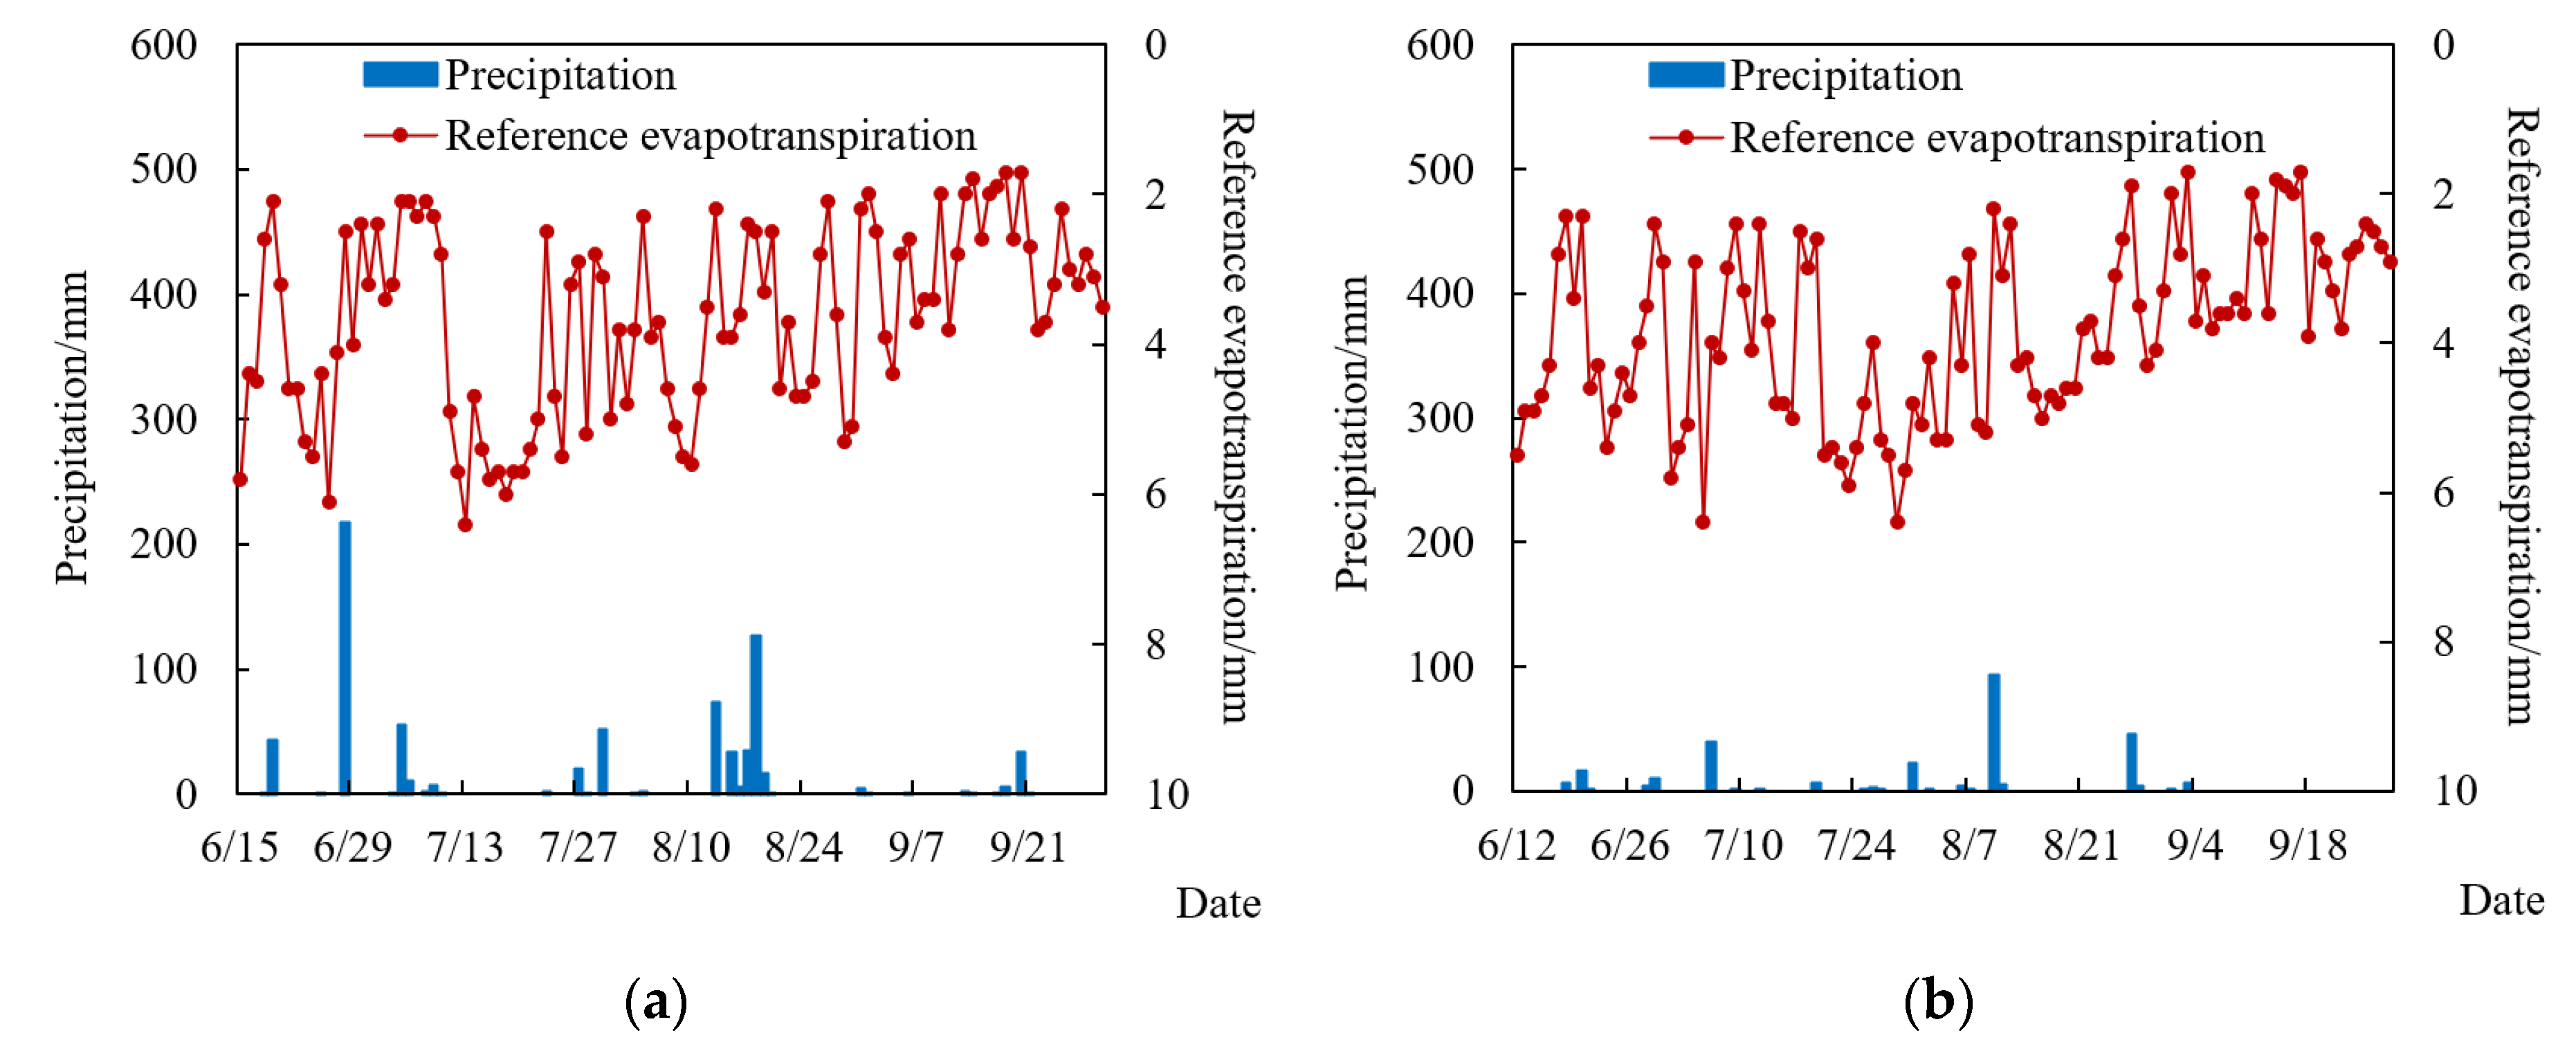
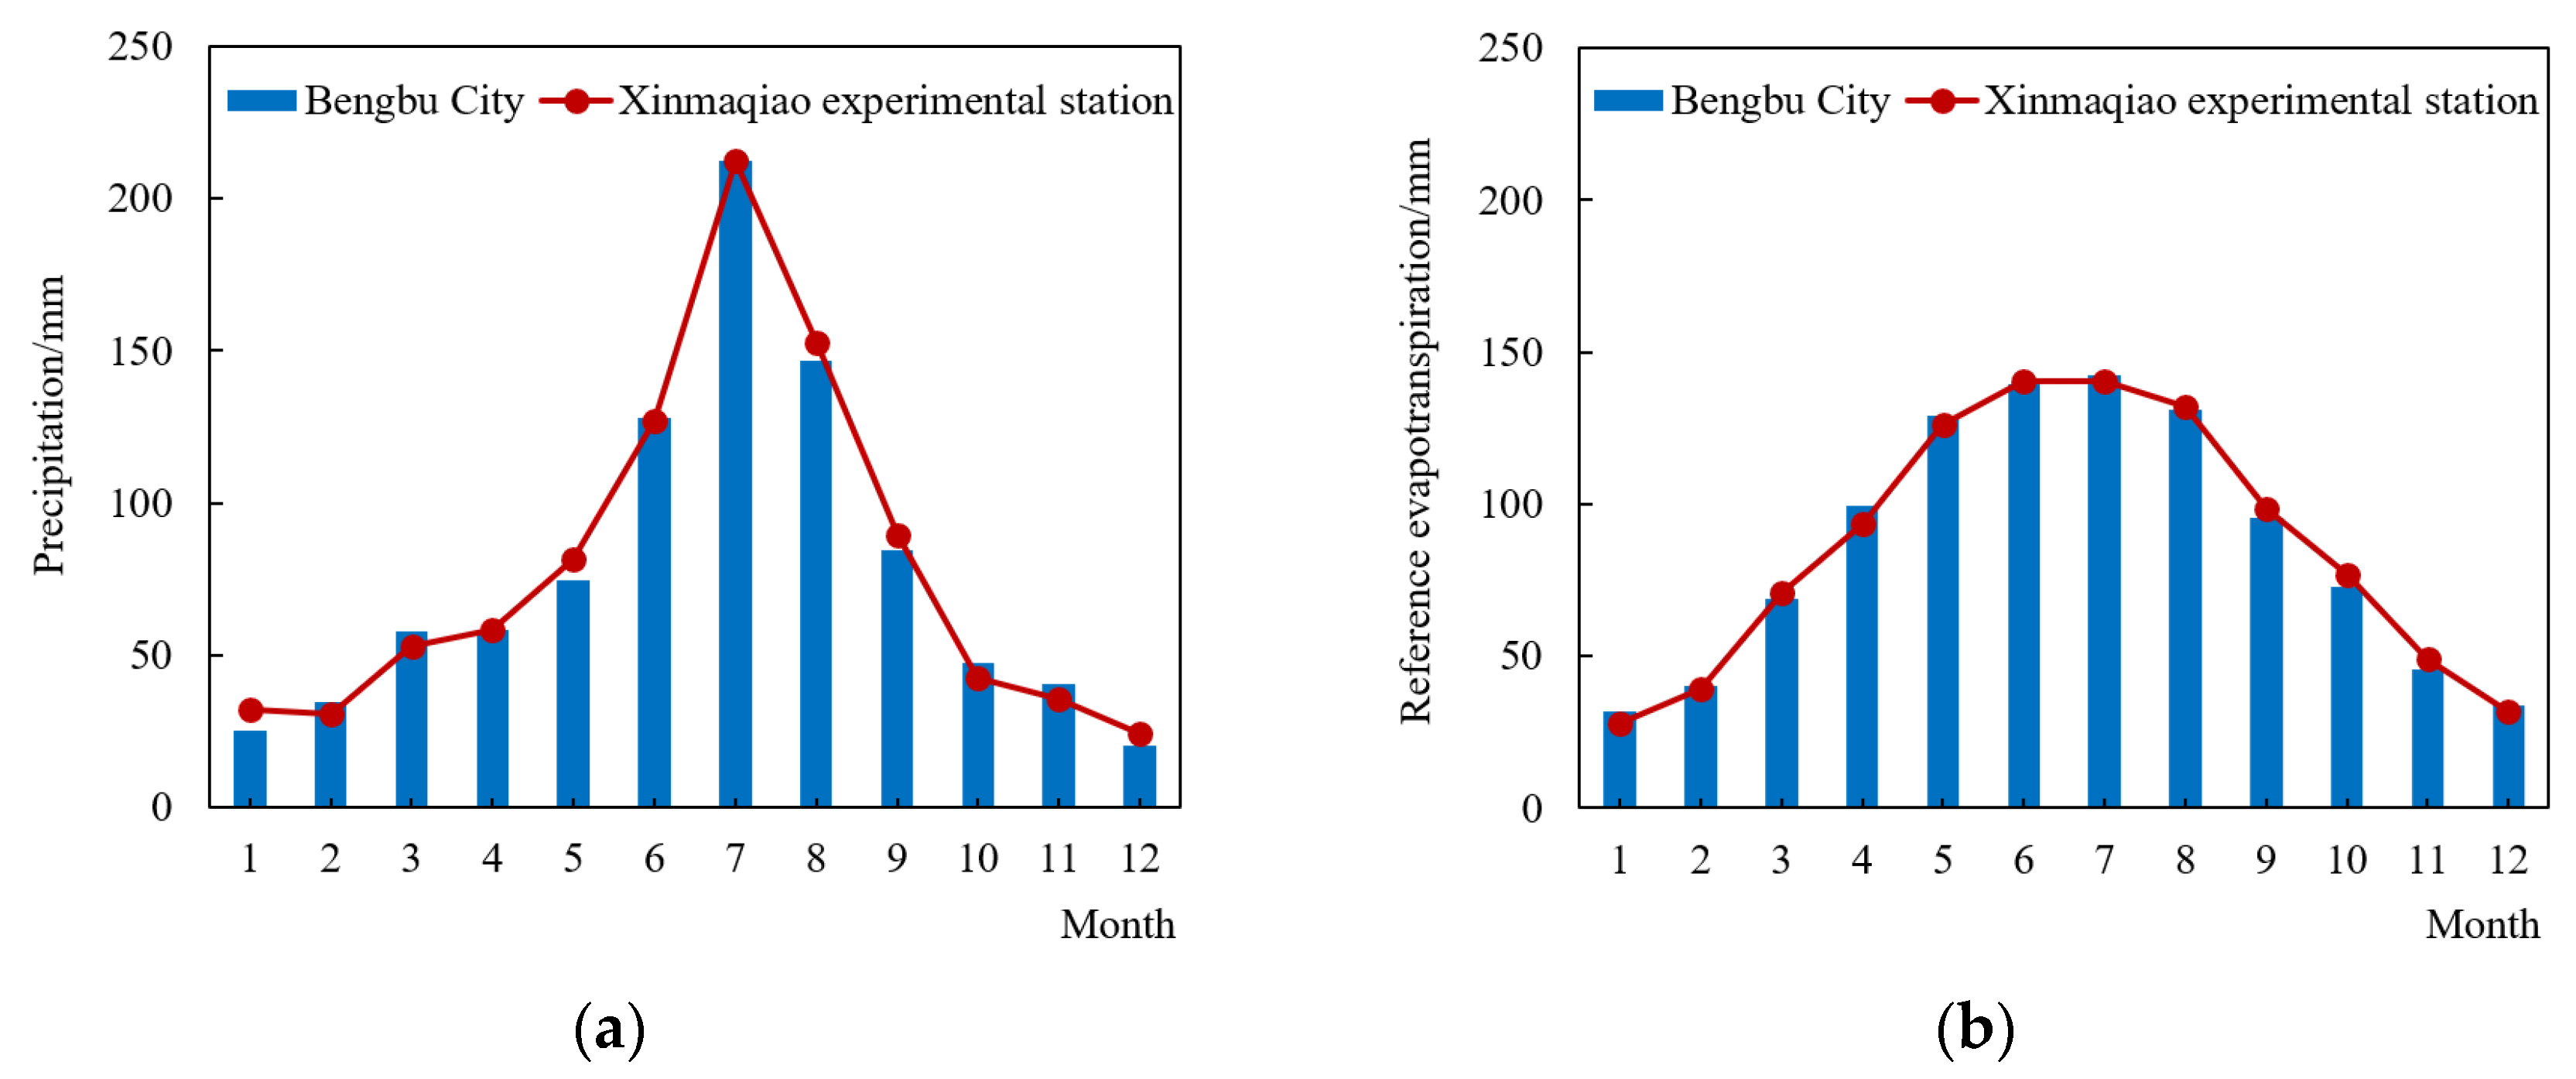
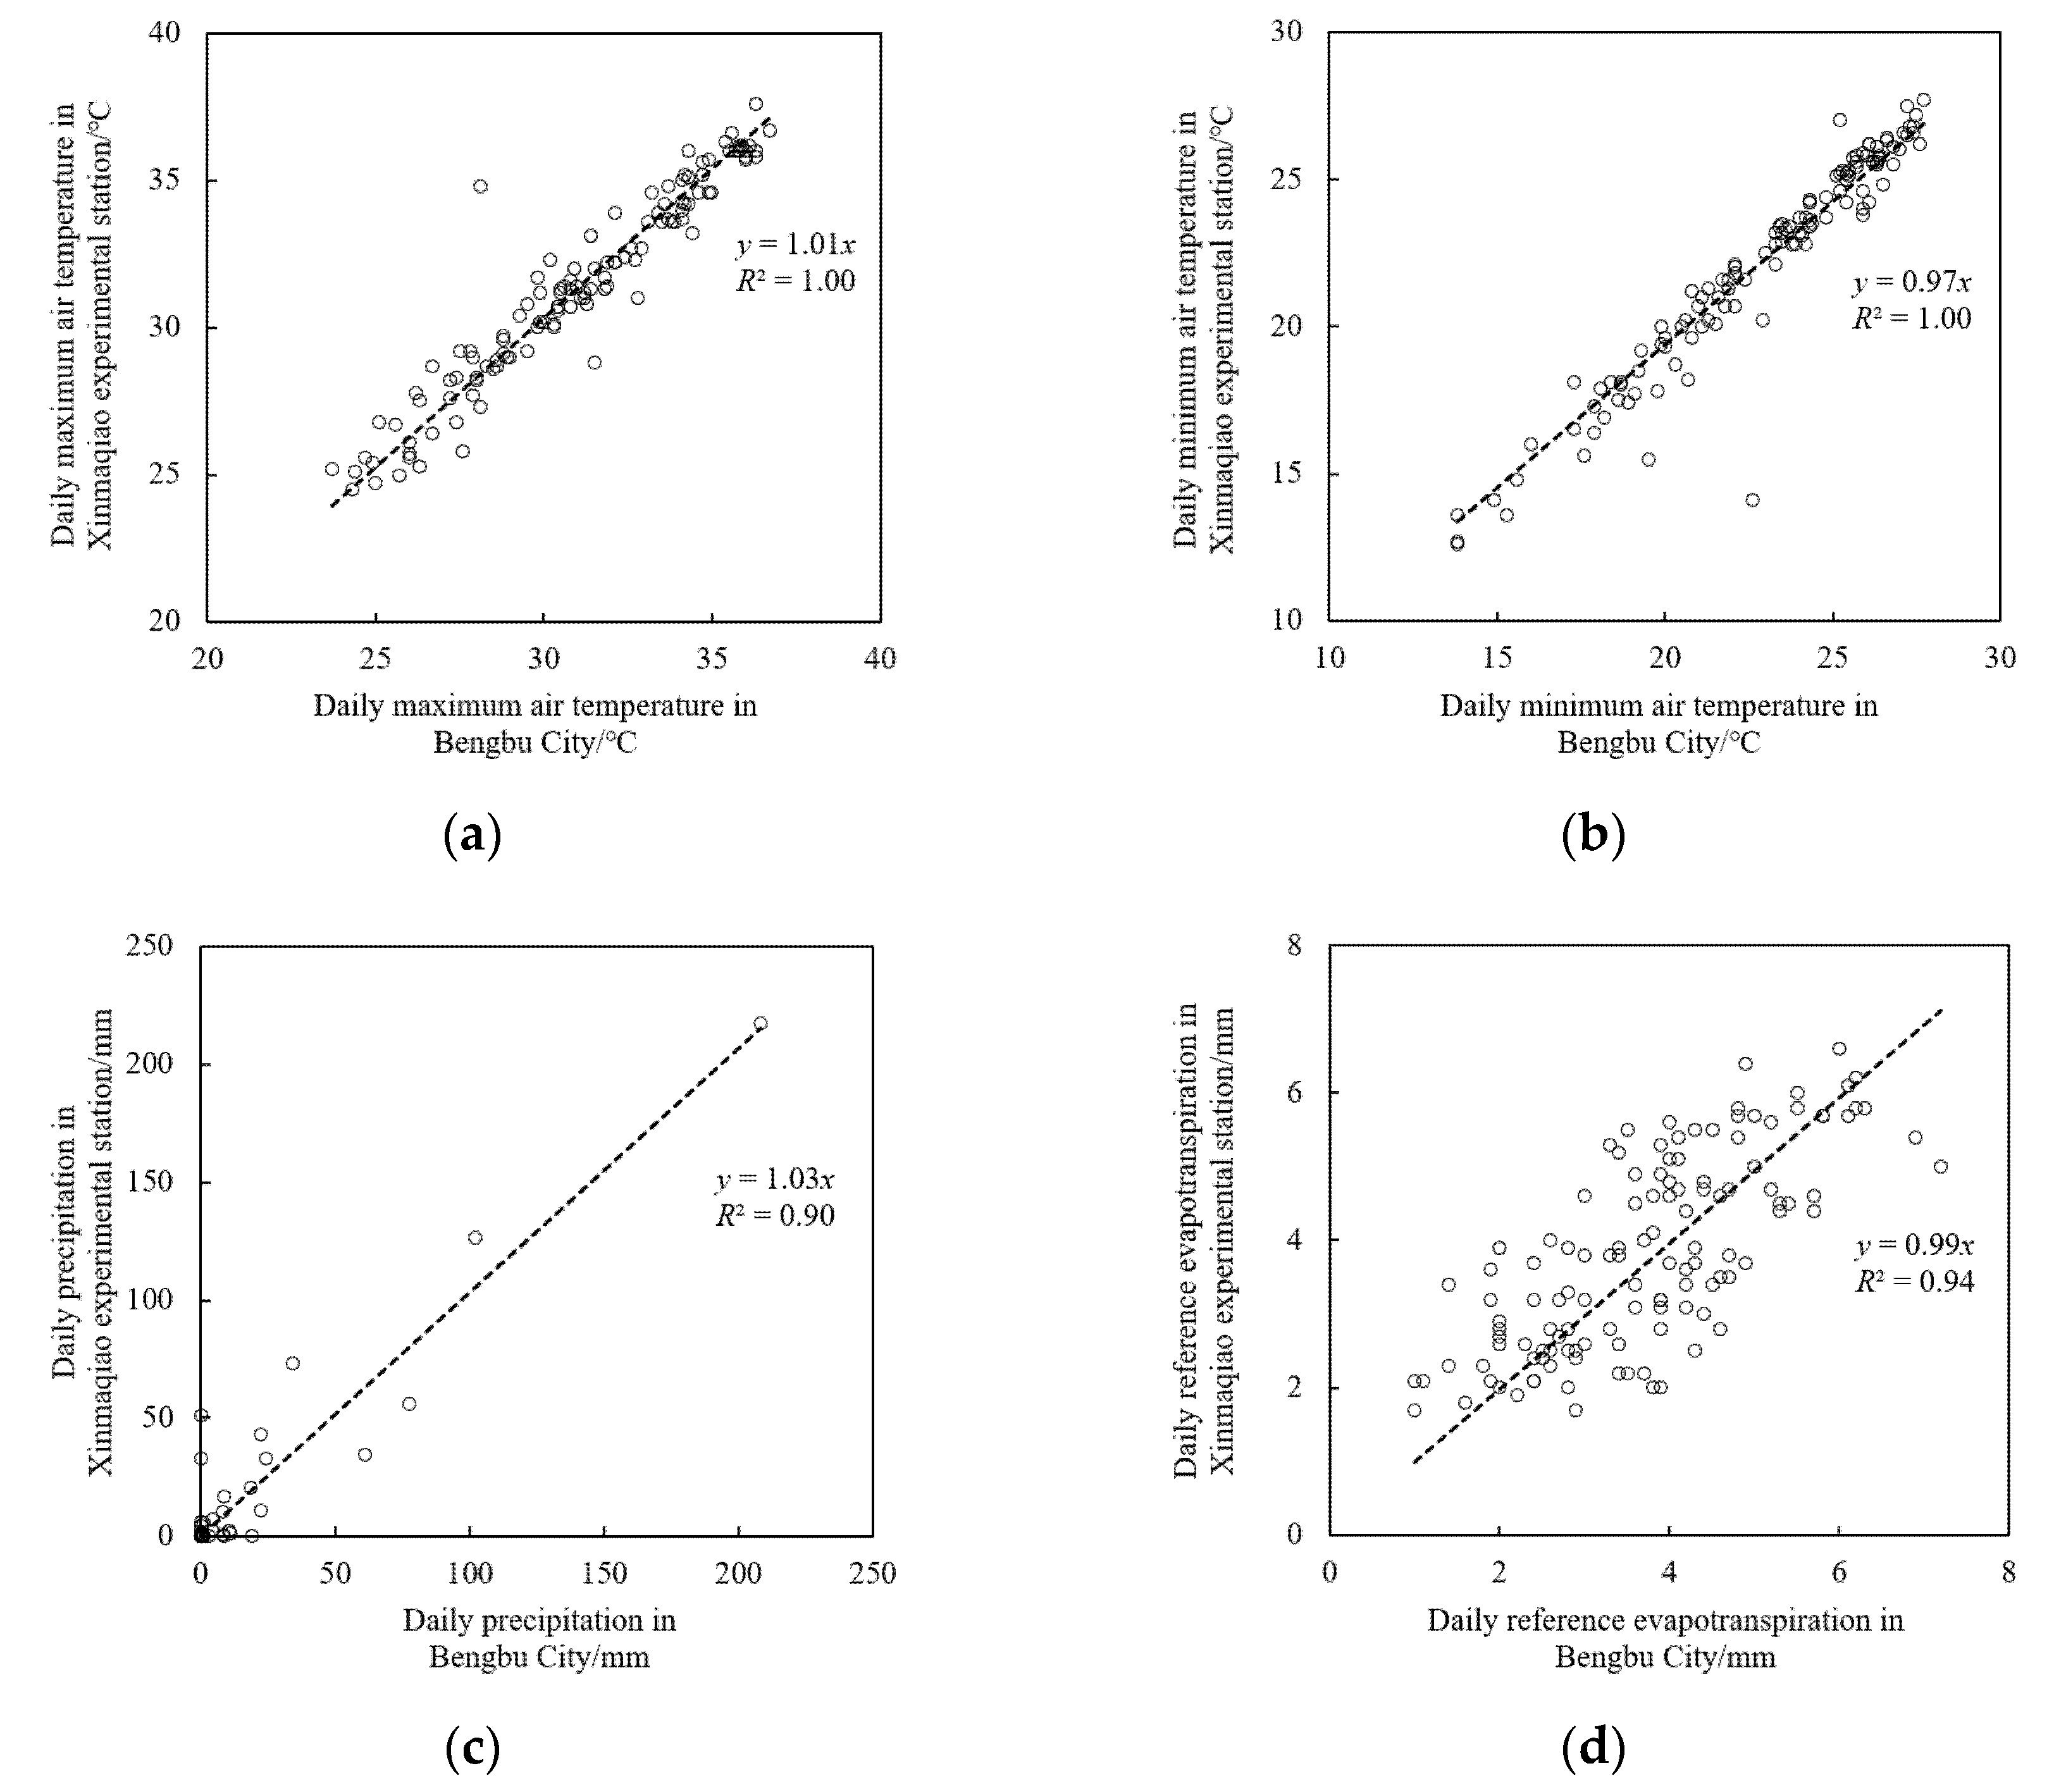
- Meteorological parameters
- (b)
- Crop parameters
- (c)
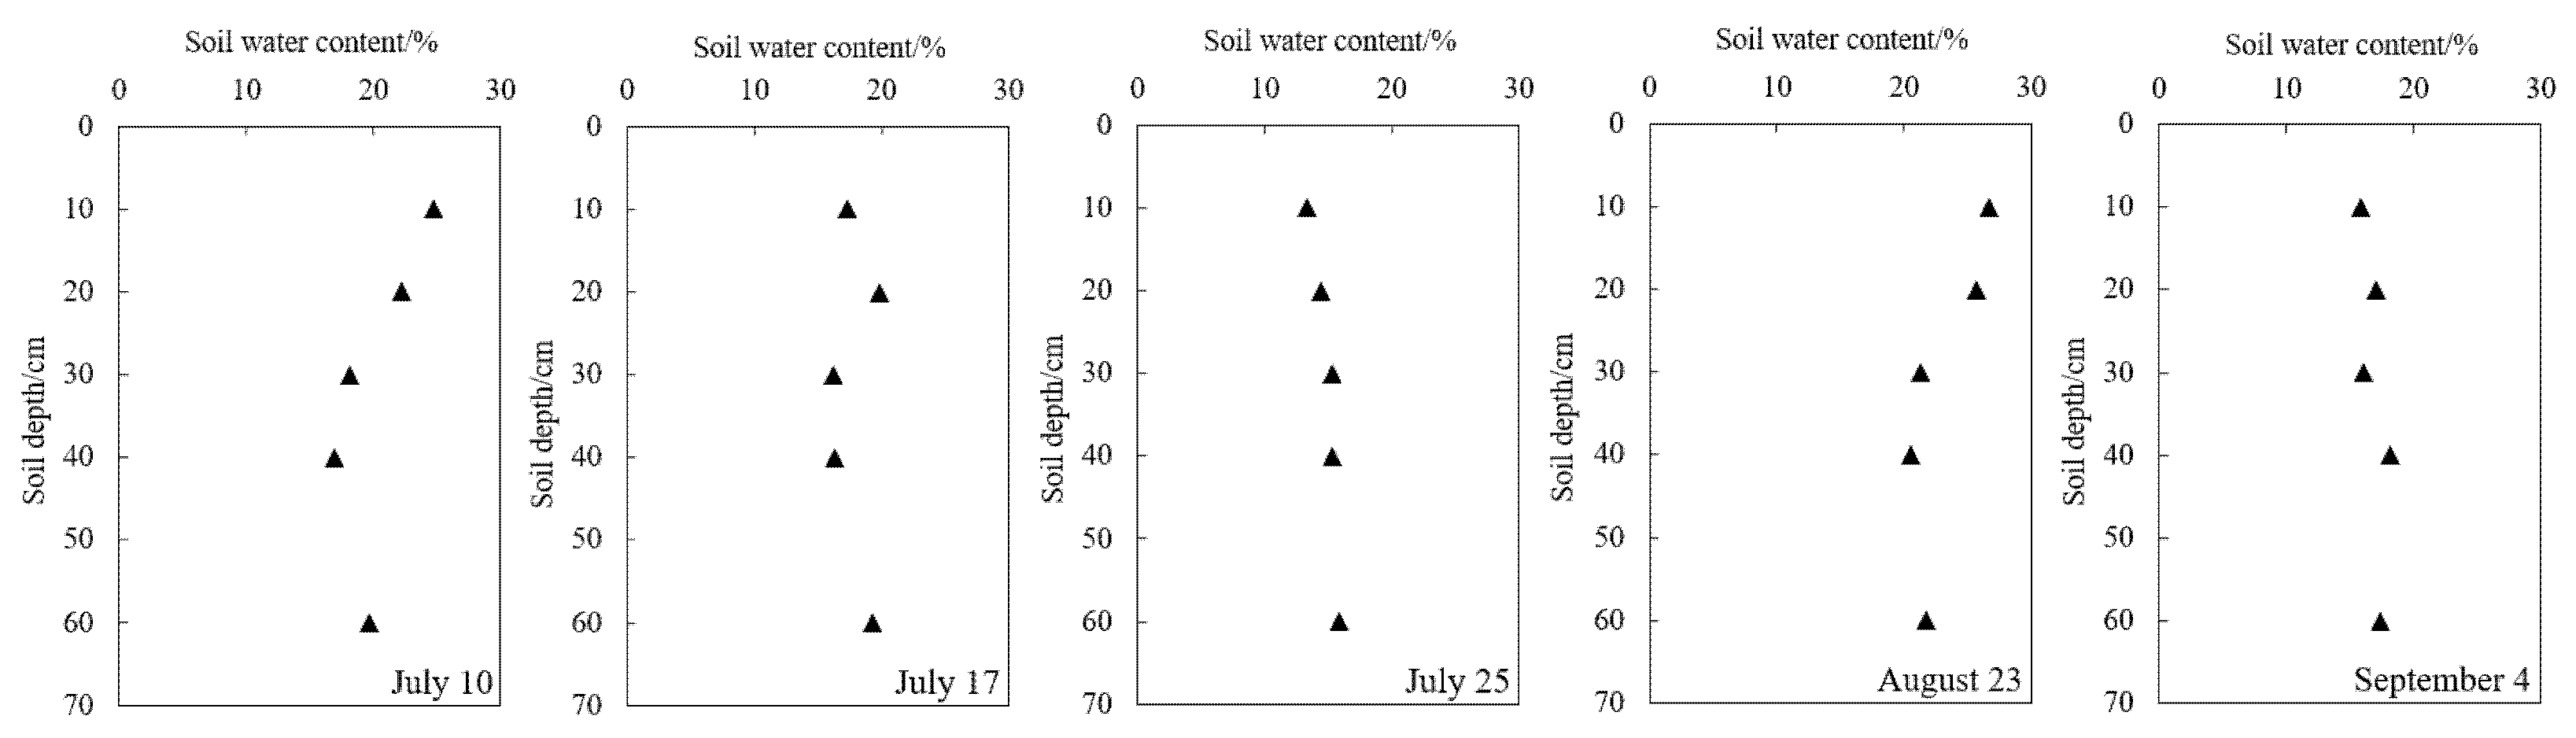
- Soil parameters
- (d)
- Field management parameters
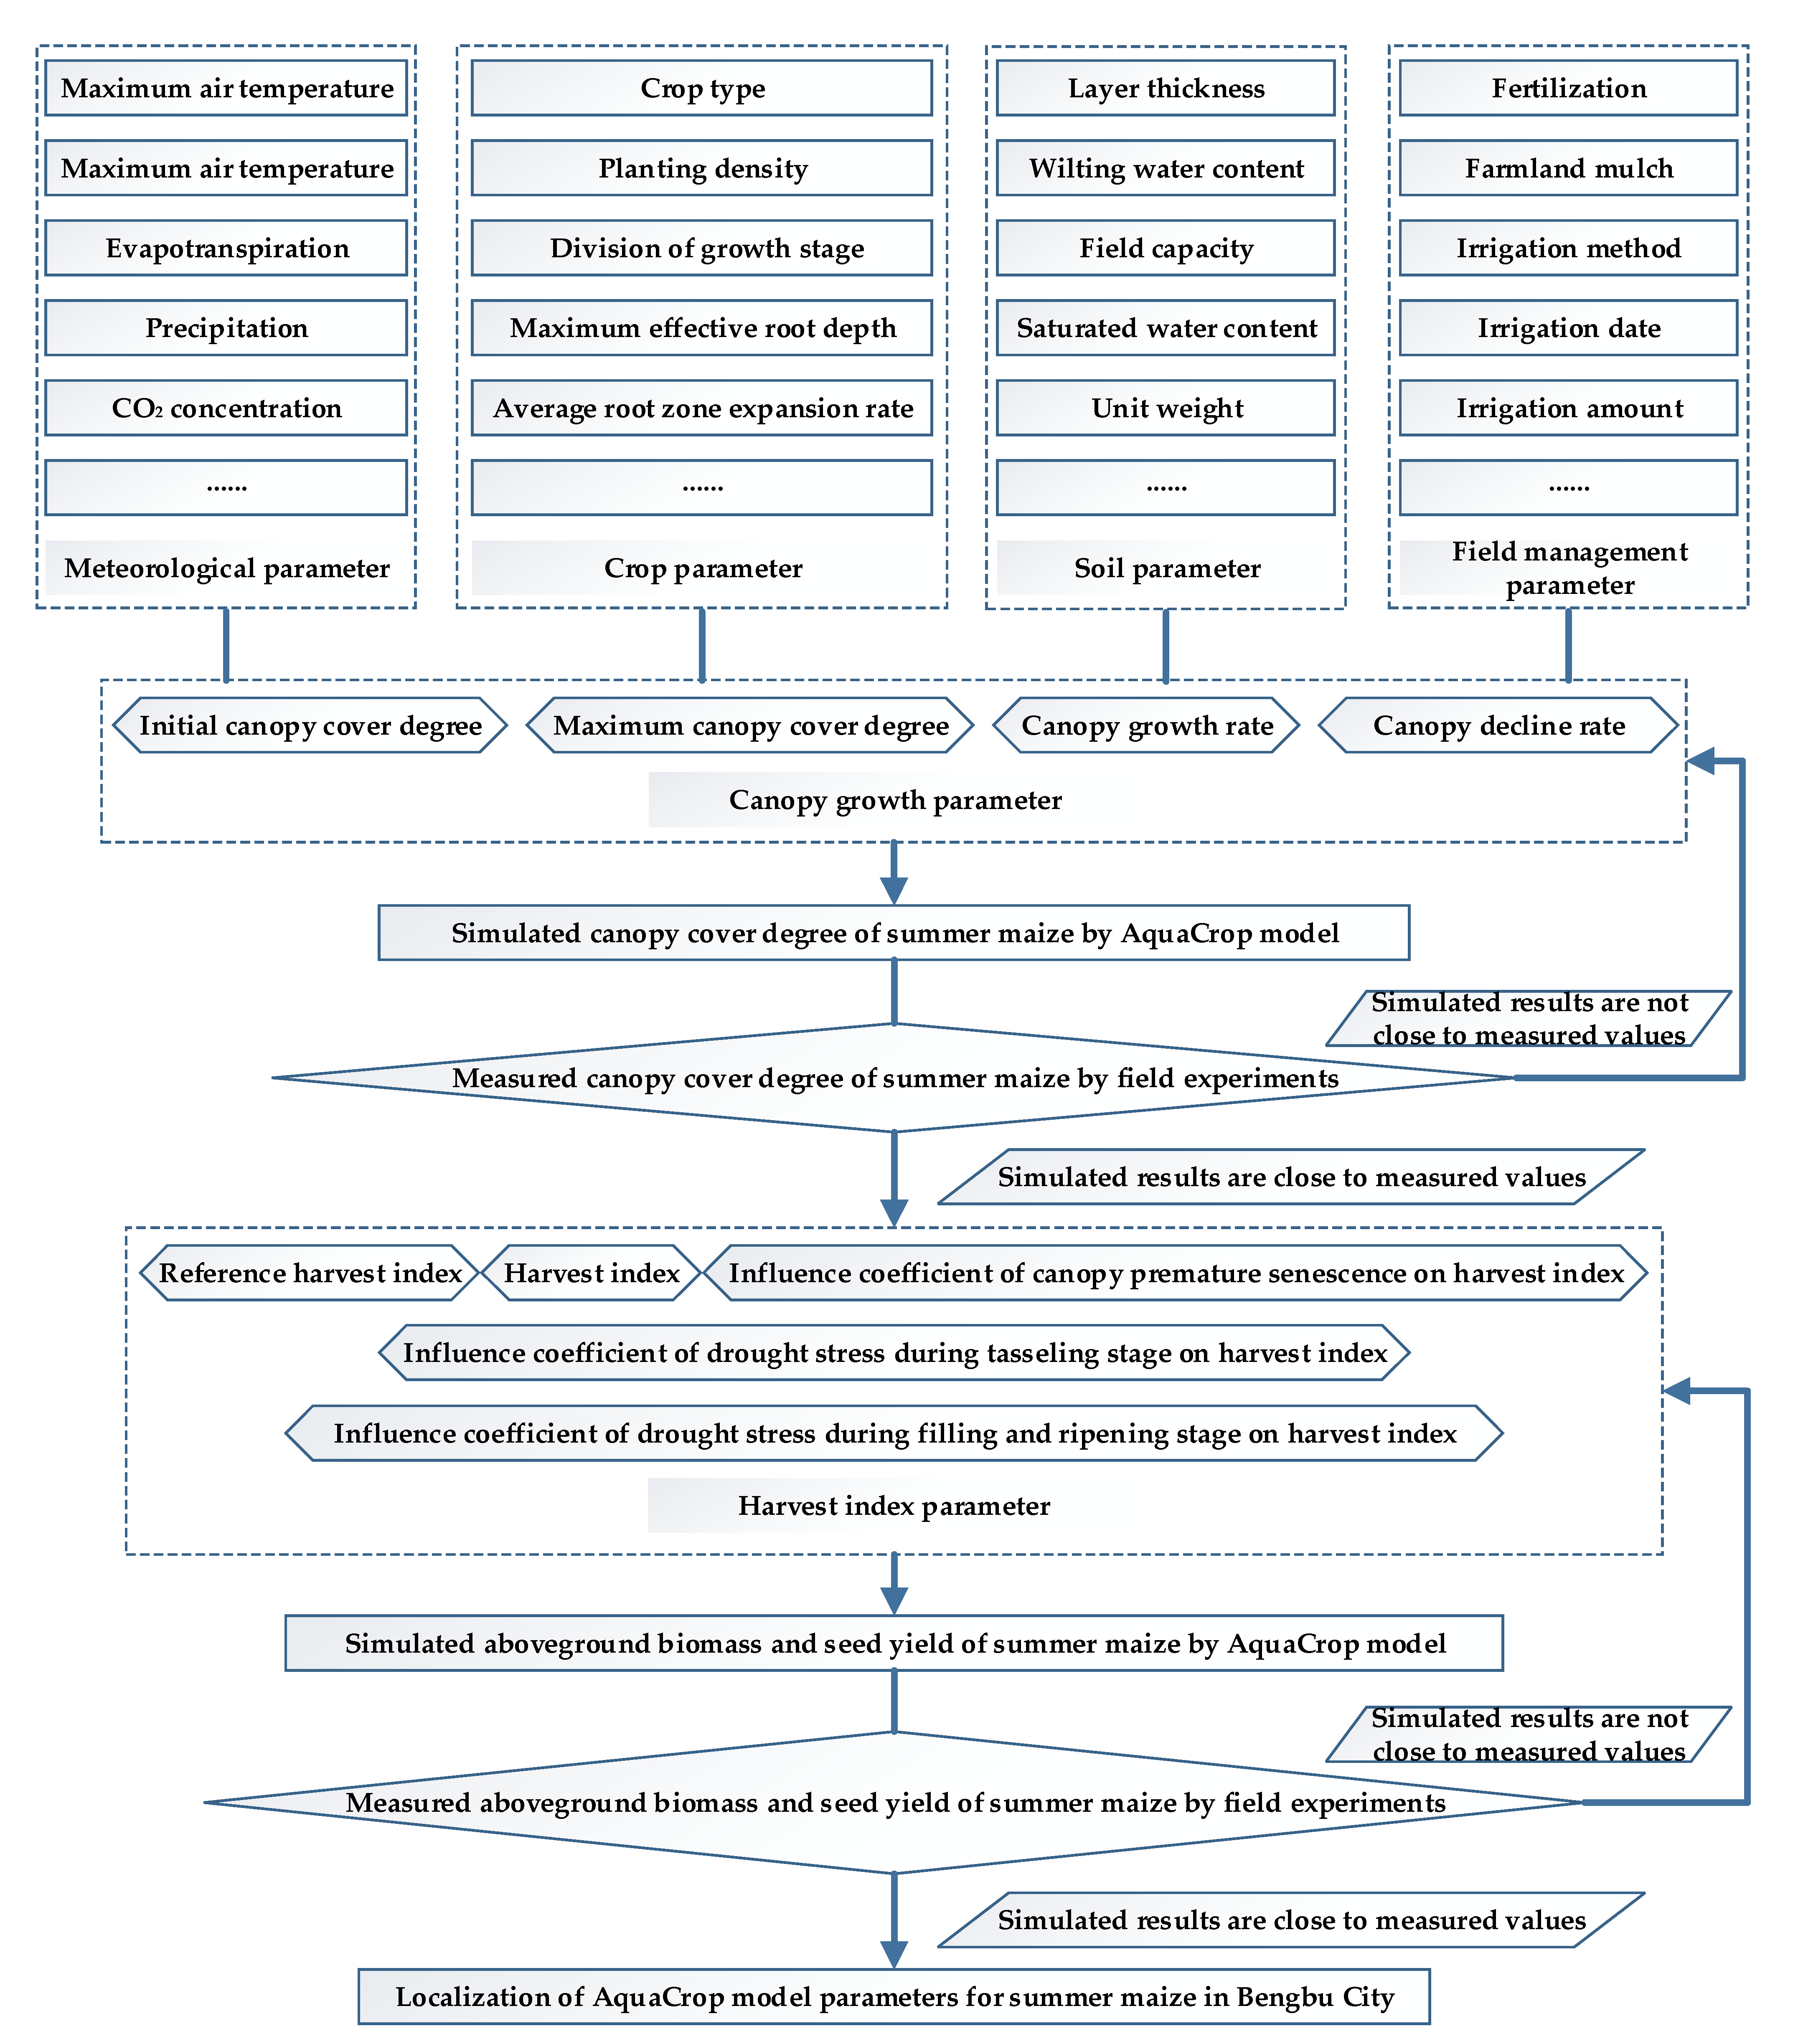
2.6.2. AquaCrop Model Parameter Calibration
2.6.3. Validity Test of AquaCrop Model
2.6.4. Summer Maize Yield Loss Rate Calculation
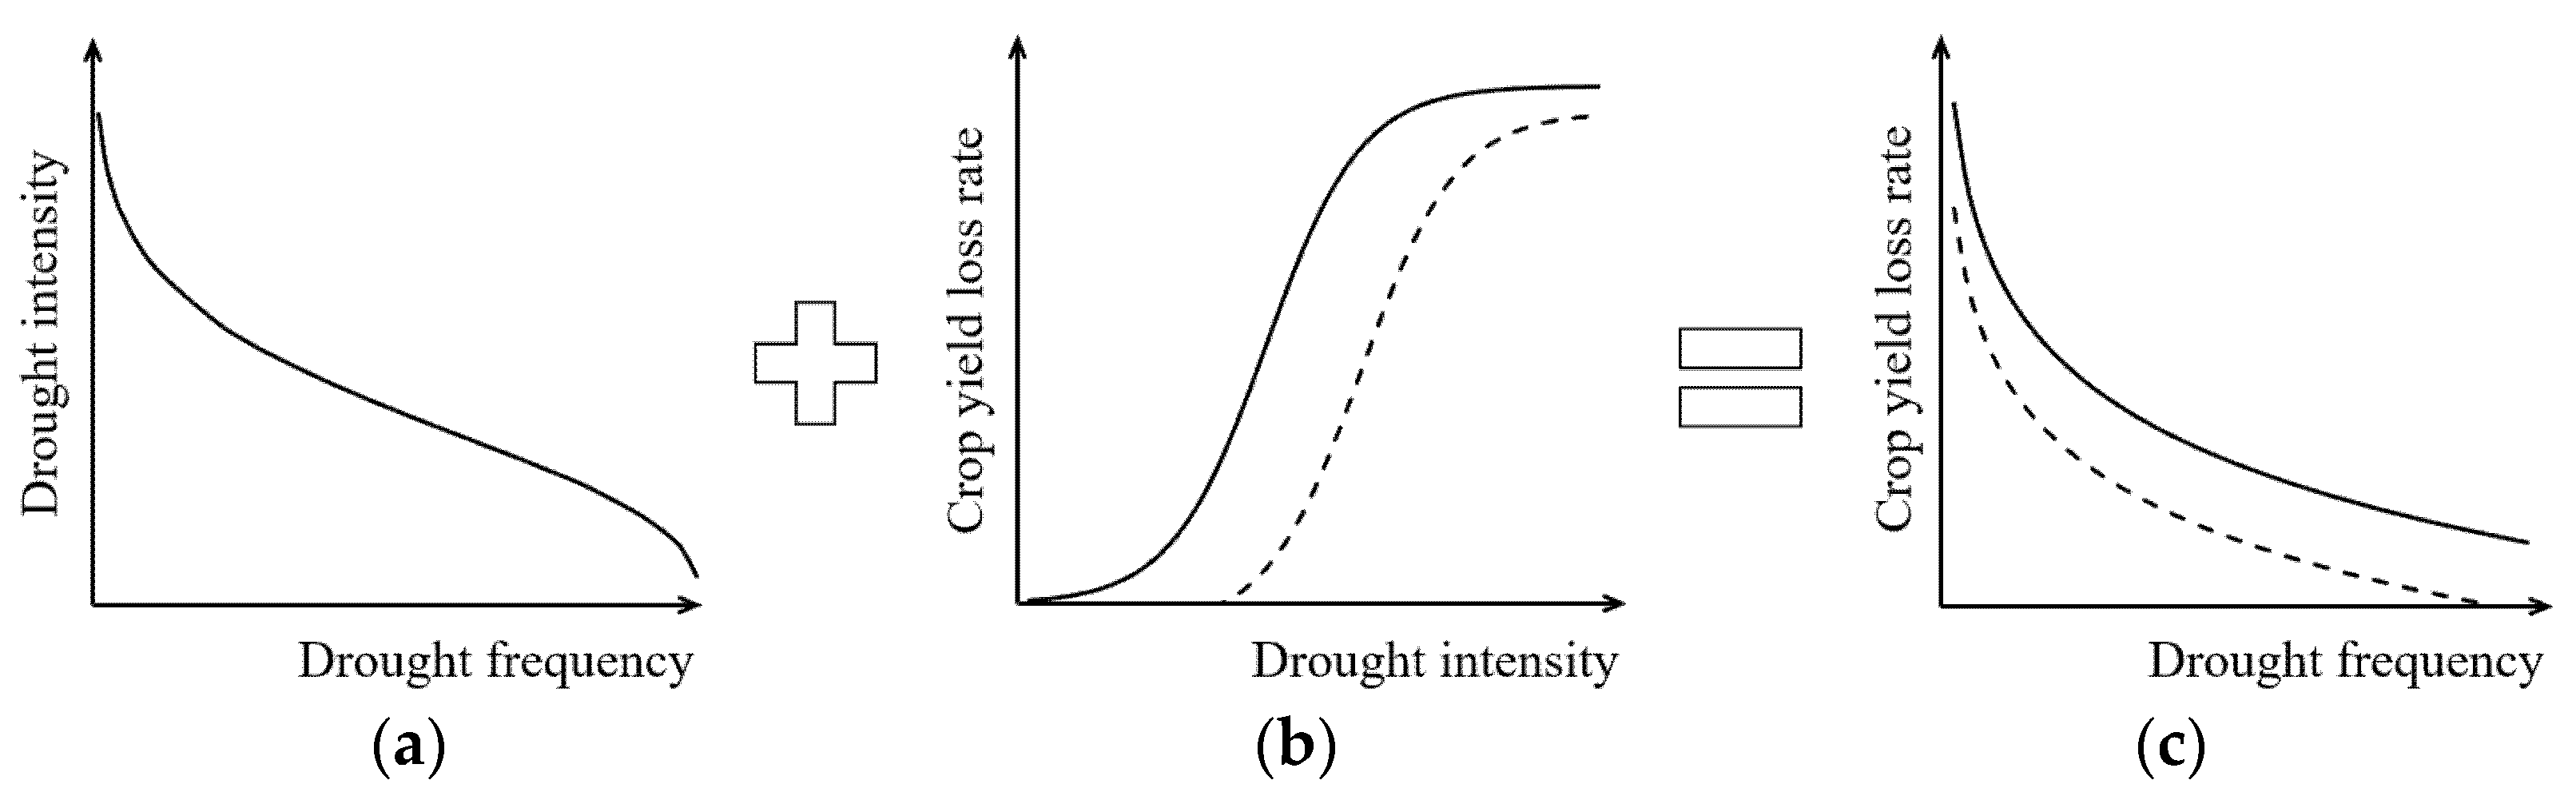
2.7. Summer Maize Drought Diasater Loss Risk Curve Establishment
3. Results
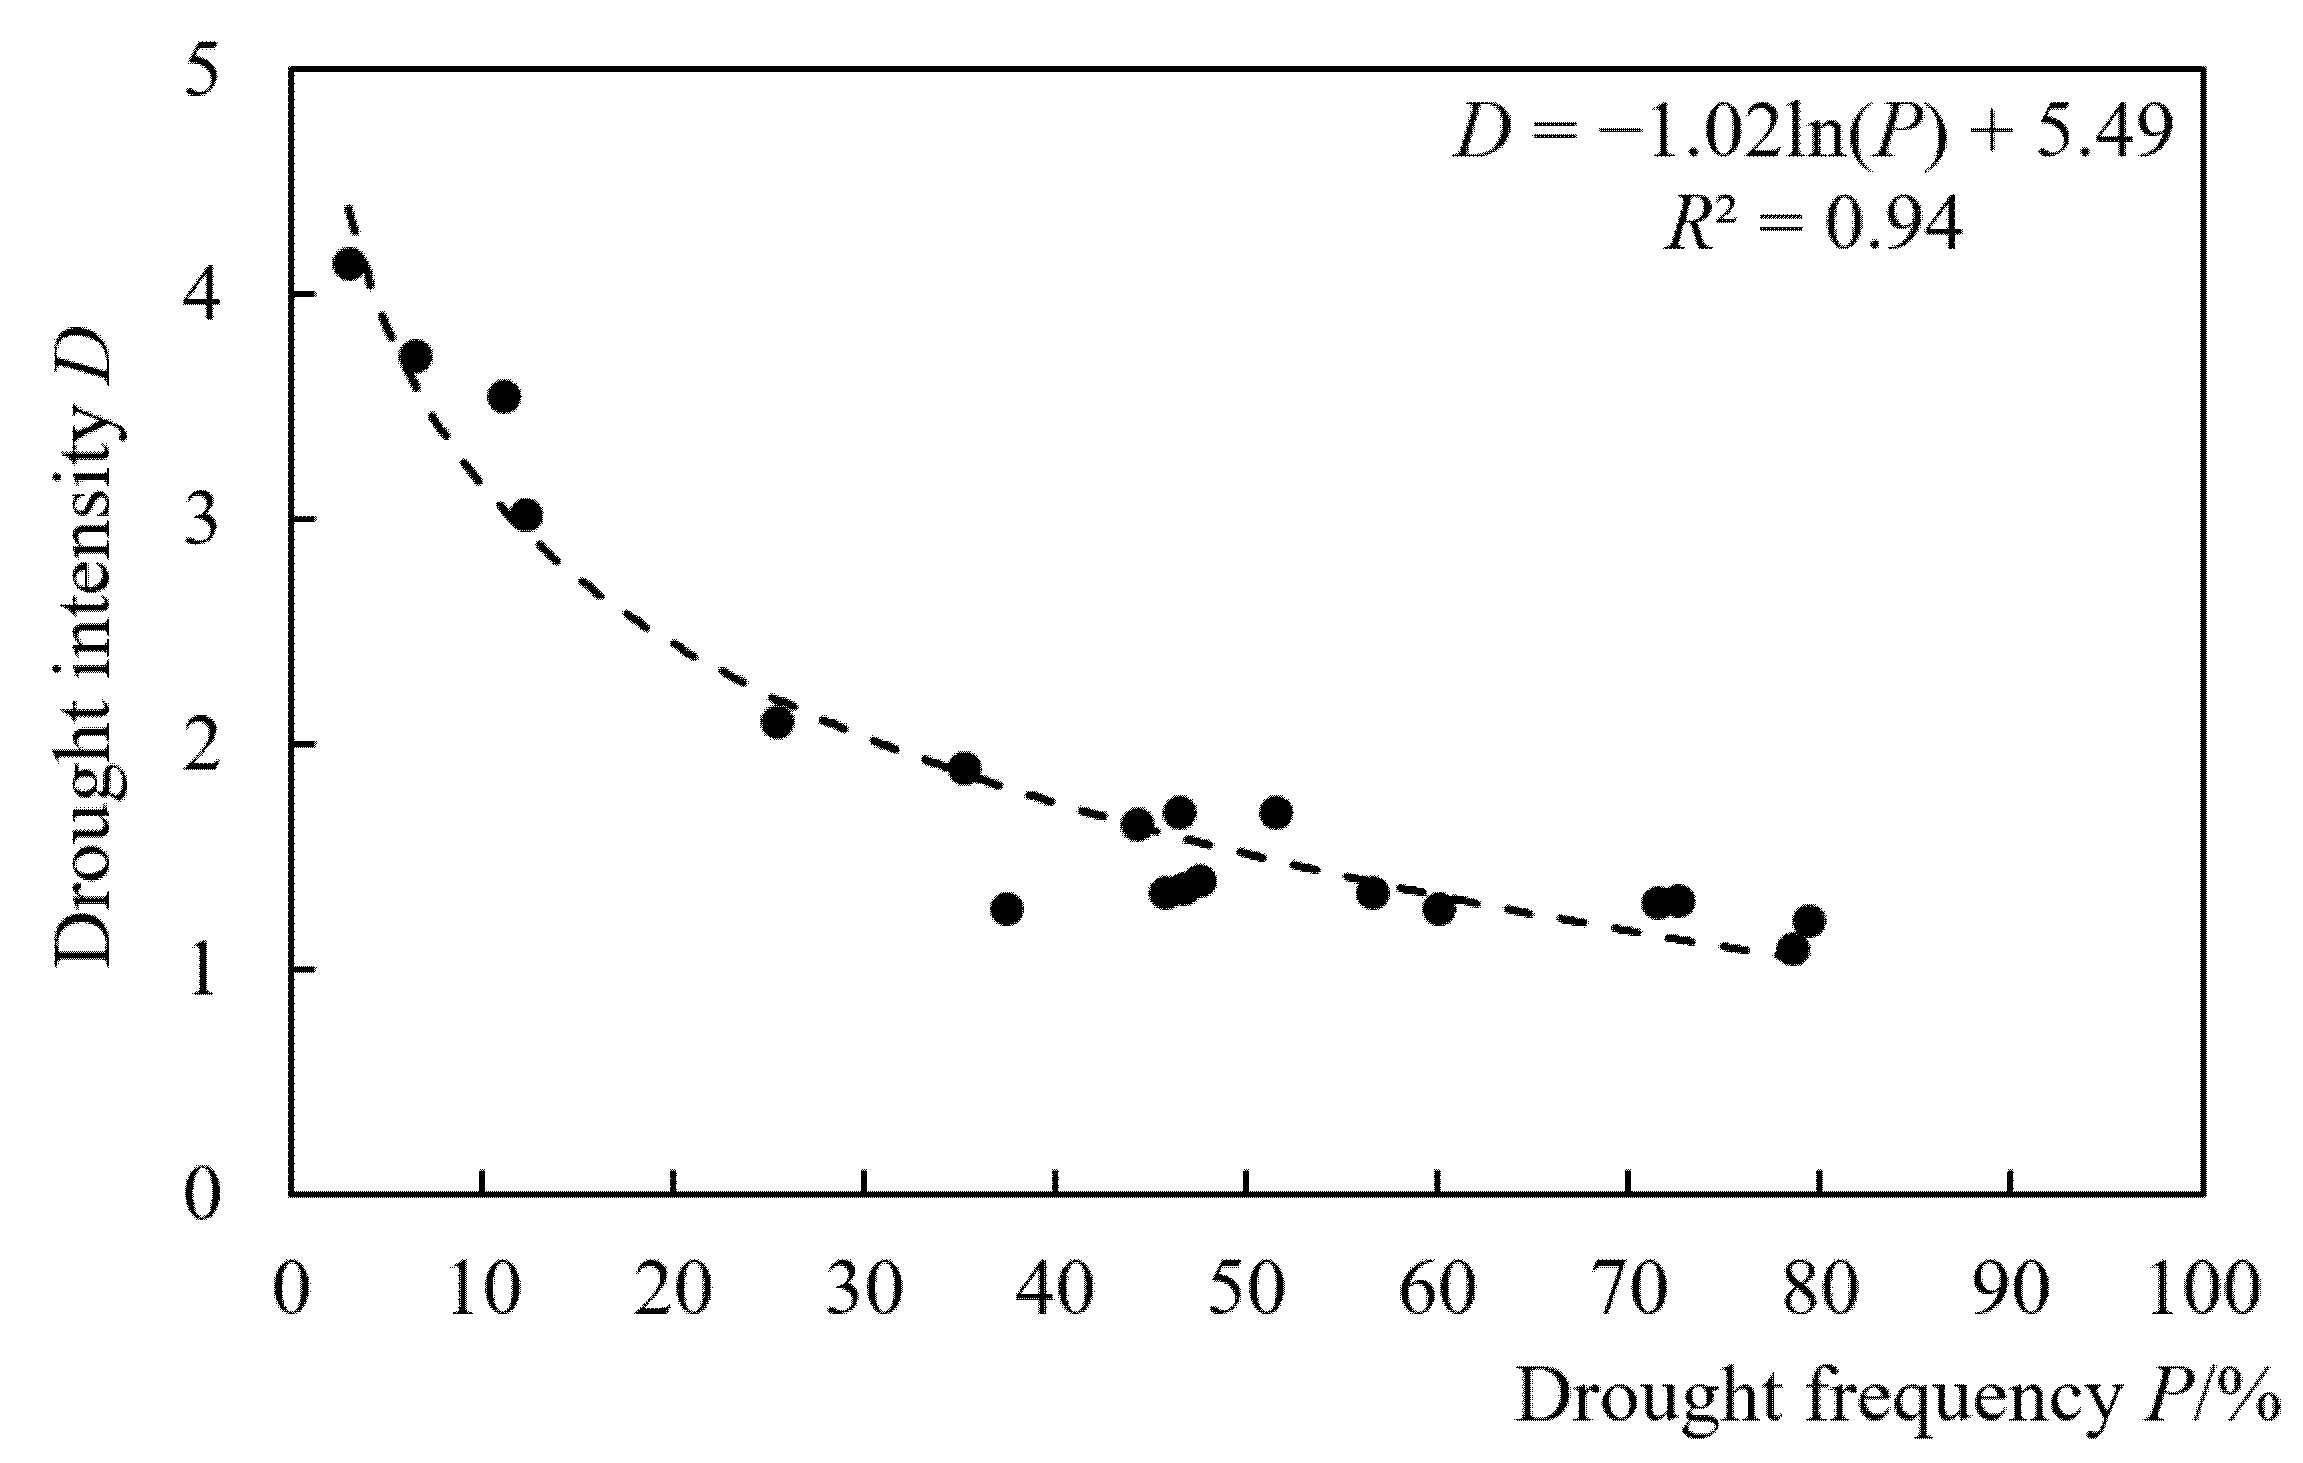
3.1. Drought Frequency Analysis
3.2. AquaCrop Model Simulation Analysis
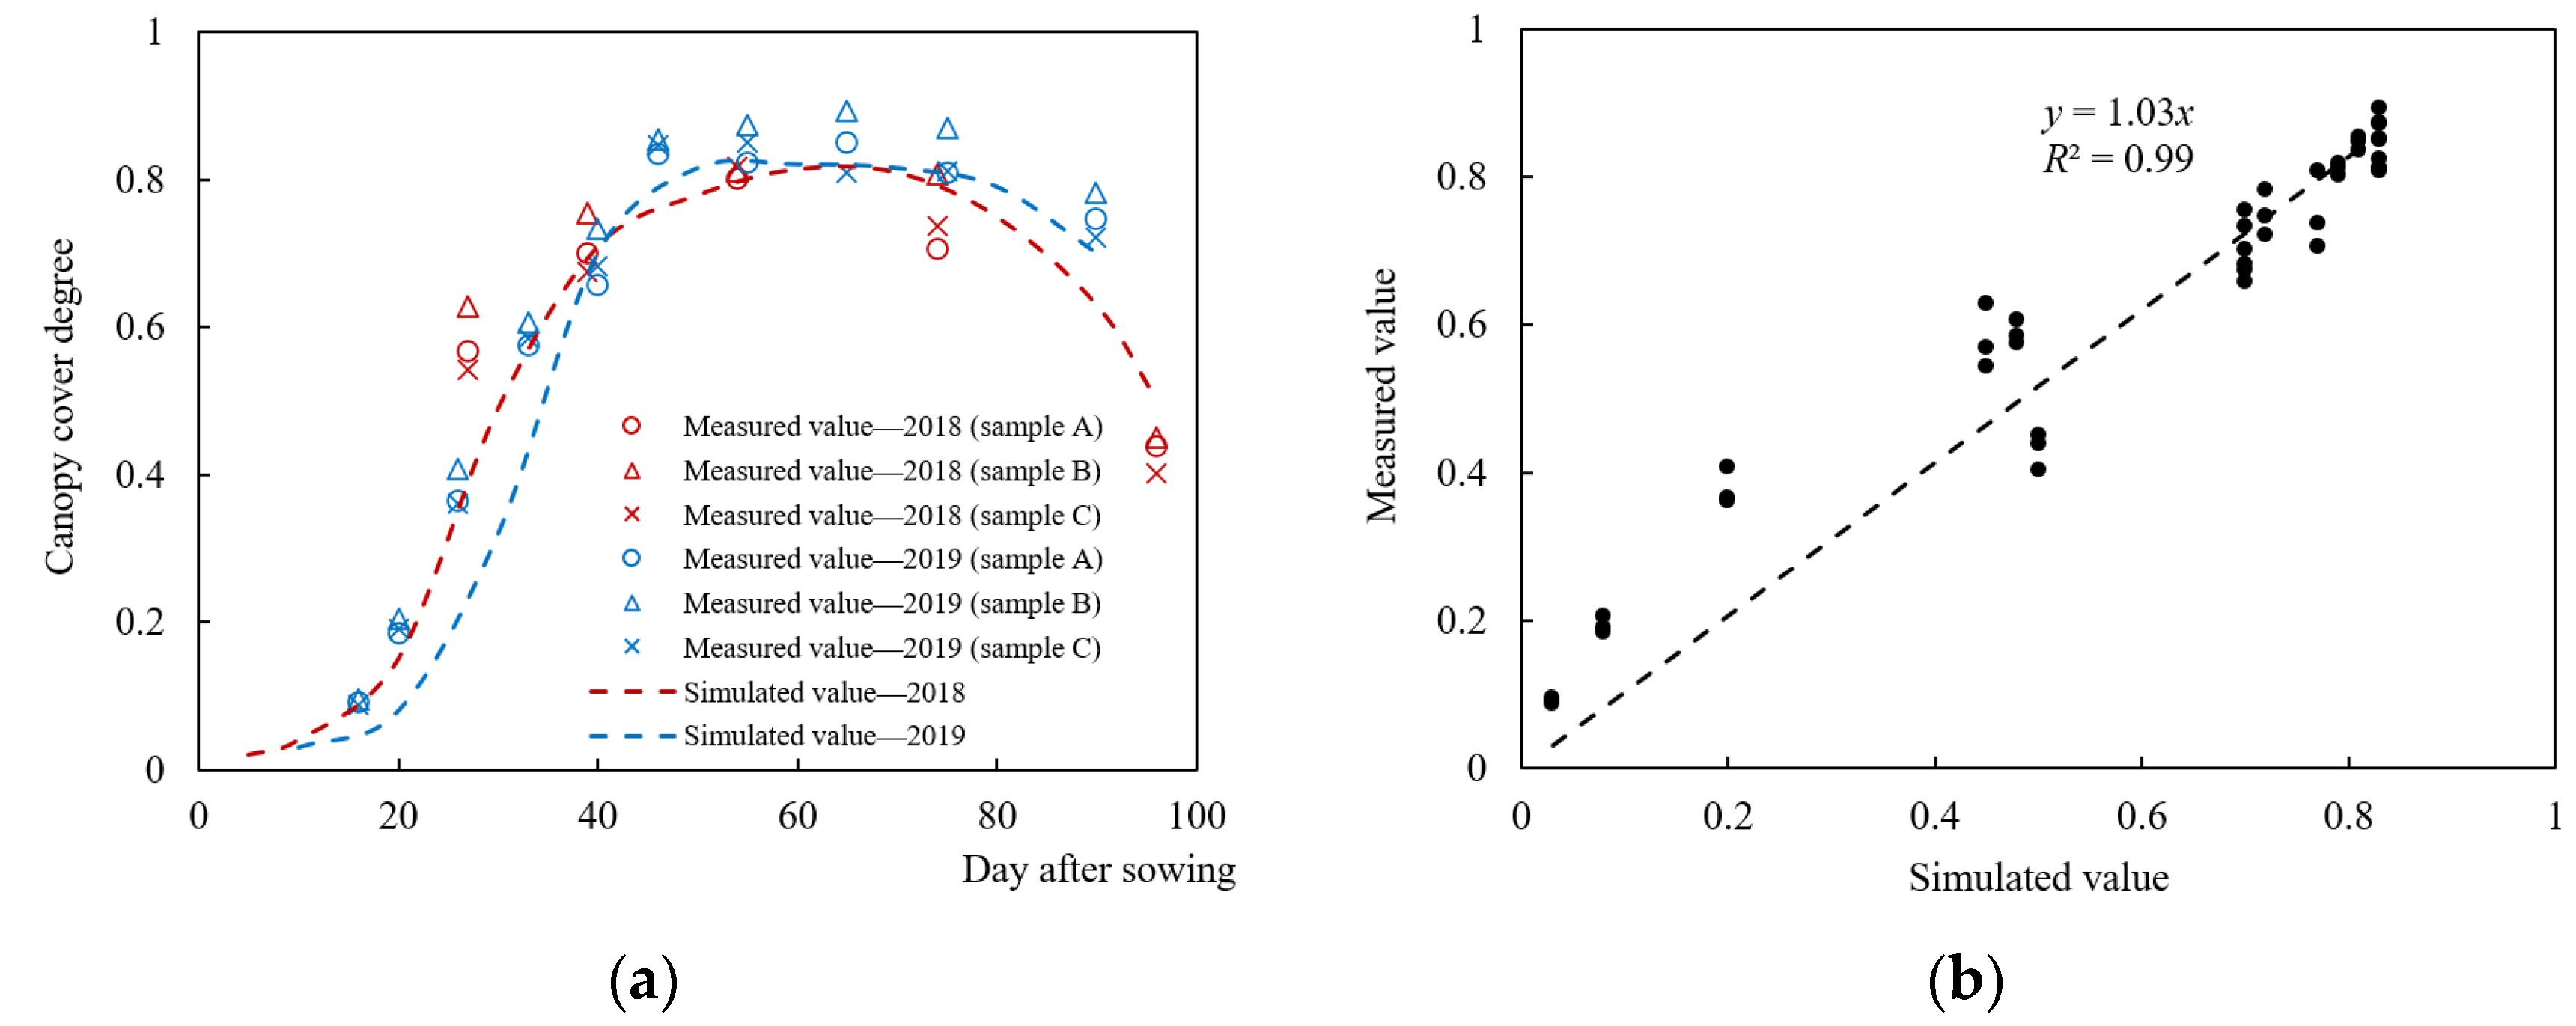
3.2.1. Canopy Growth Process Simulation Analysis
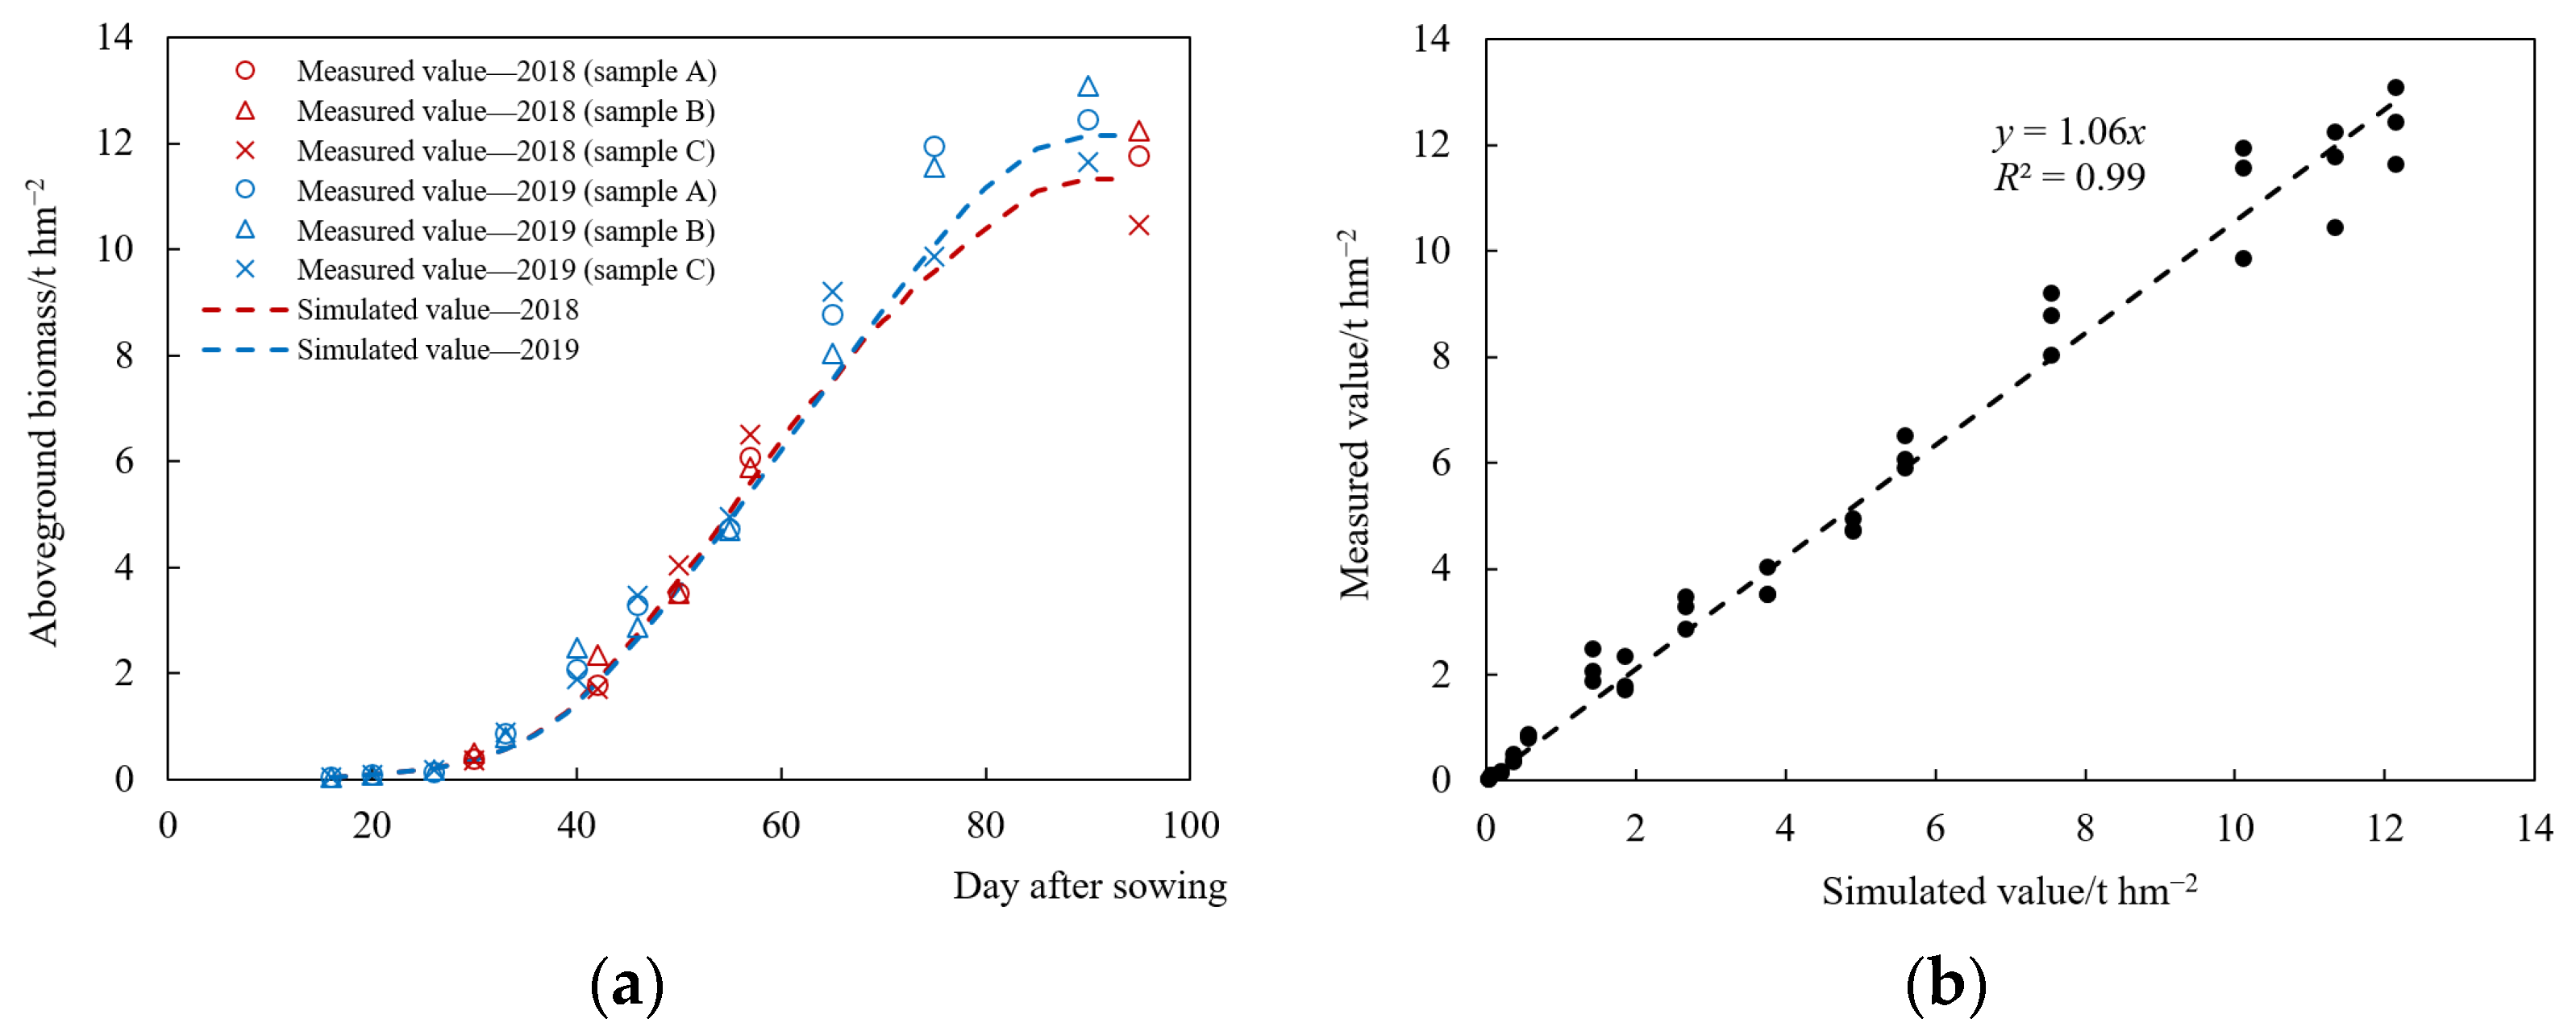
3.2.2. Aboveground Biomass Accumulative Process Simulation Analysis
3.2.3. Yield Simulation Analysis
3.3. Summer Maize Drought Loss Simulation Analysis
3.3.1. Determination of Data under Normal Meteorological Conditions
3.3.2. Summer Maize Yield Loss Simulation Analysis
3.4. Summer Maize Drought Disaster Risk Loss Curve Analysis
4. Discussions
5. Conclusions
- (1)
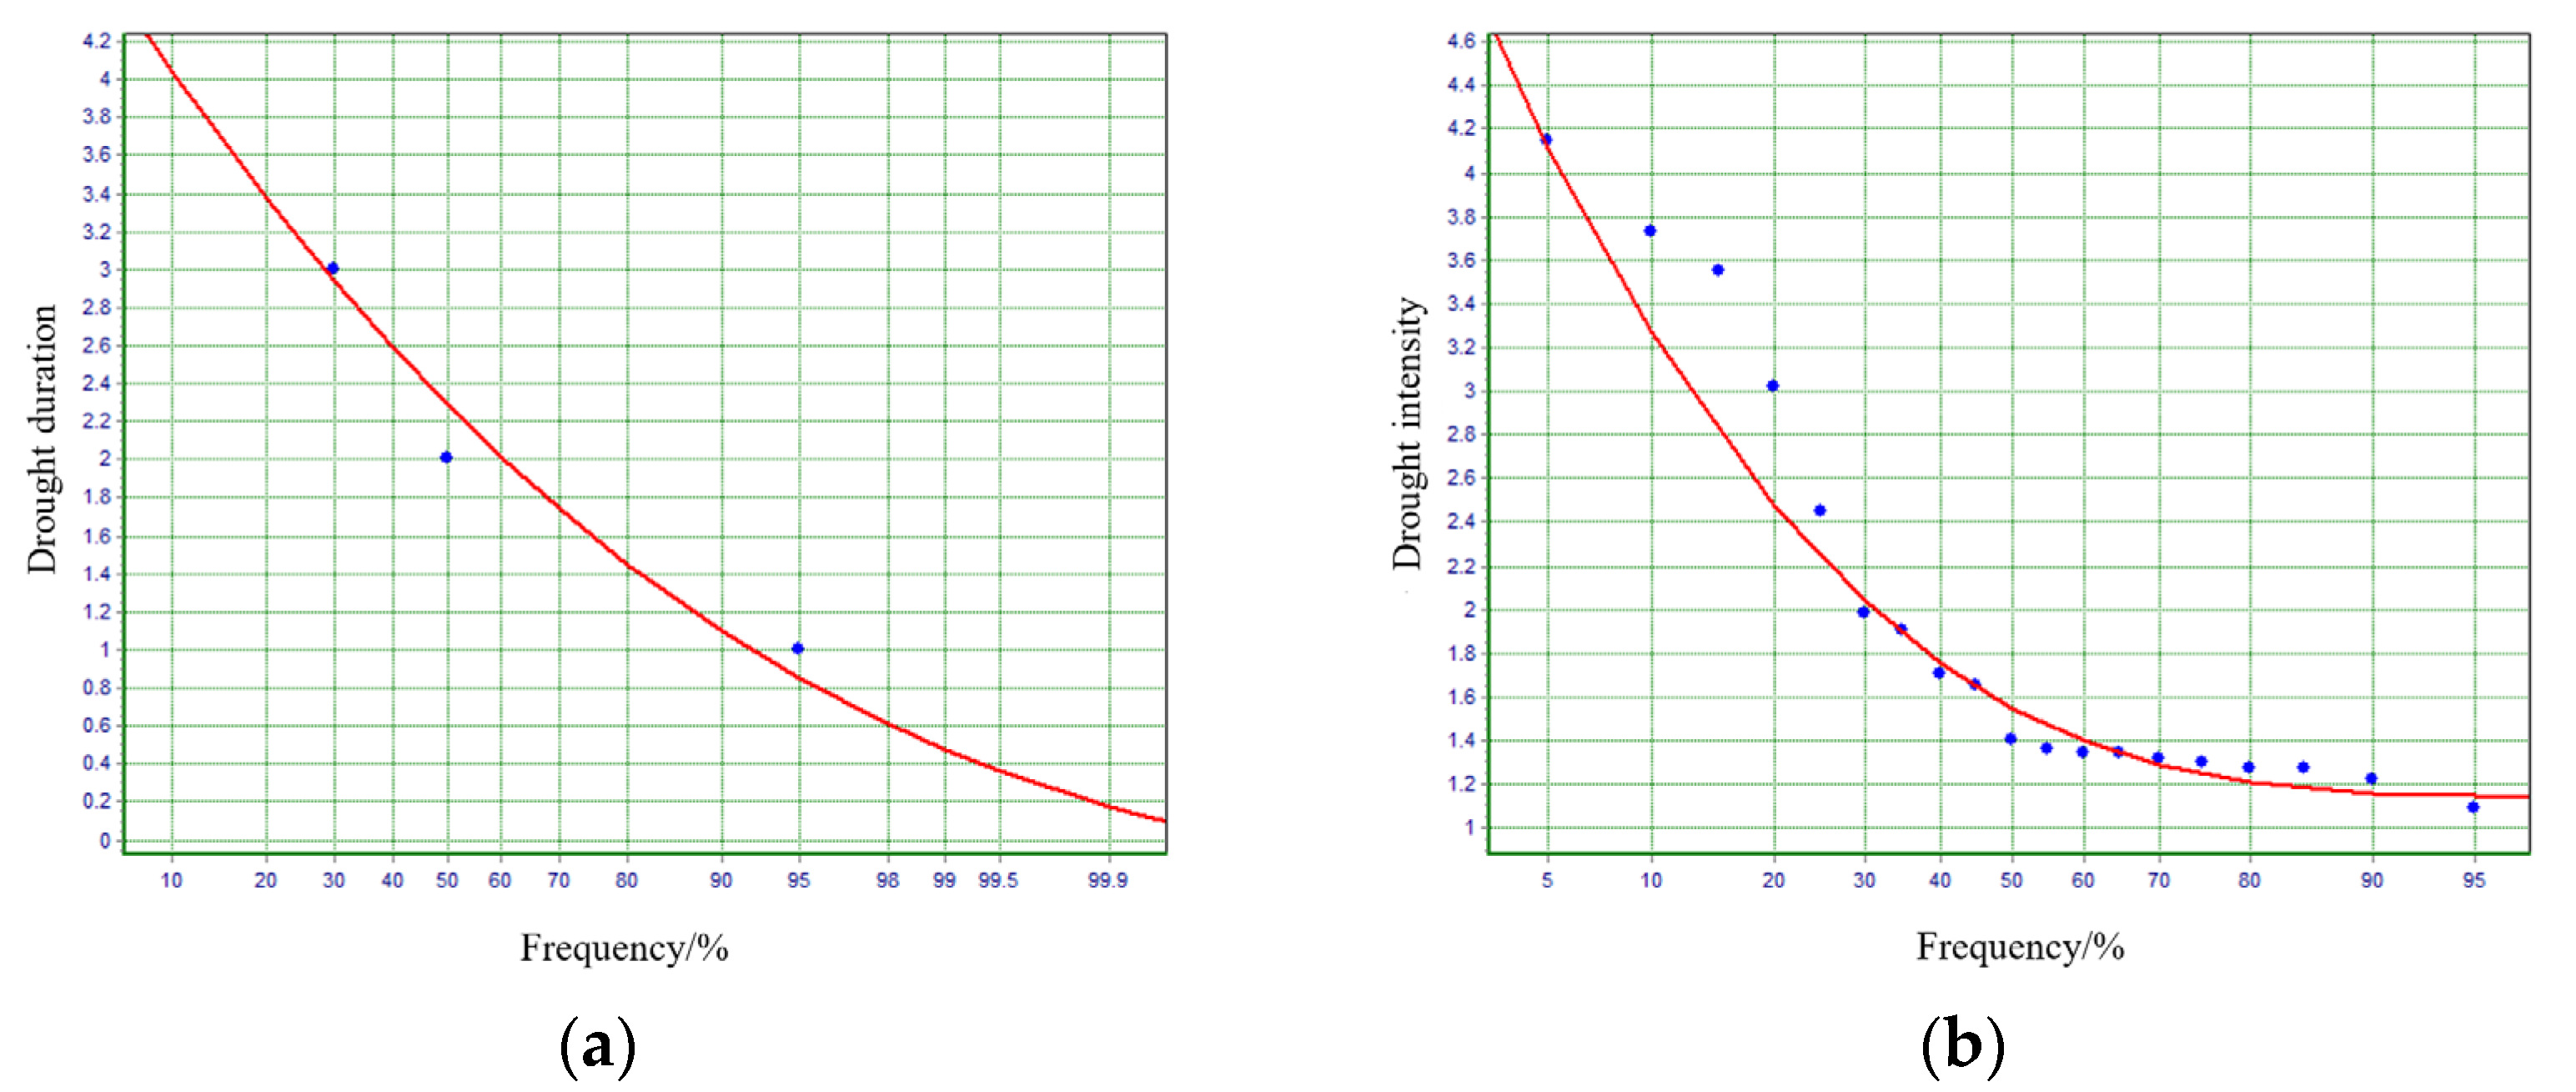
- The P-III distribution curve method well fitted the univariate probability distributions of drought duration and drought intensity. Furthermore, the semilogarithmic function quantitatively described the drought hazard curve between drought duration–drought intensity joint drought frequency and drought intensity. Among 19 drought events, there were 15 events whose drought frequency was 0.2–0.8. Moreover, the drought intensity was basically below 2.0; the events whose intensity was larger than 3.0 were less. Therefore, droughts occurred frequently during the growth period of summer maize in Bengbu, though most of them were mild droughts with low intensity.
- (2)
- The RMSE of simulated maize canopy cover degree by the AquaCrop model relative to the field measured results in 2018 and 2019 was 0.067 and 0.079, respectively. The RMSE of aboveground biomass was 0.755 and 0.966. In addition, the relative error (RE) between the simulated and measured aboveground biomass at harvest in 2018 and 2019 was 1.38% and 1.79%, respectively. The RE of yield per unit area was 0.67% and 0.31%. Therefore, the optimized crop parameters were effective; the calibrated AquaCrop model accurately simulated the growth and yield formation process of summer maize in Bengbu.
- (3)
- The simulated average yield loss per unit area under 19 drought events identified during the growth period of summer maize in Bengbu from 1982 to 2017 was 1.455 t/hm2, and the yield loss rate was 24.51%. Droughts caused a severe impact on the summer maize production in Bengbu, resulting in significant yield losses. In addition, serious yield reduction happened in 1988, 1992, 1994, 2001, and 2004, and the largest yield loss rate was in 2001, at up to 65.58%. Therefore, the simulated yield losses were consistent with the actual drought situations in maize production for Bengbu.
- (4)
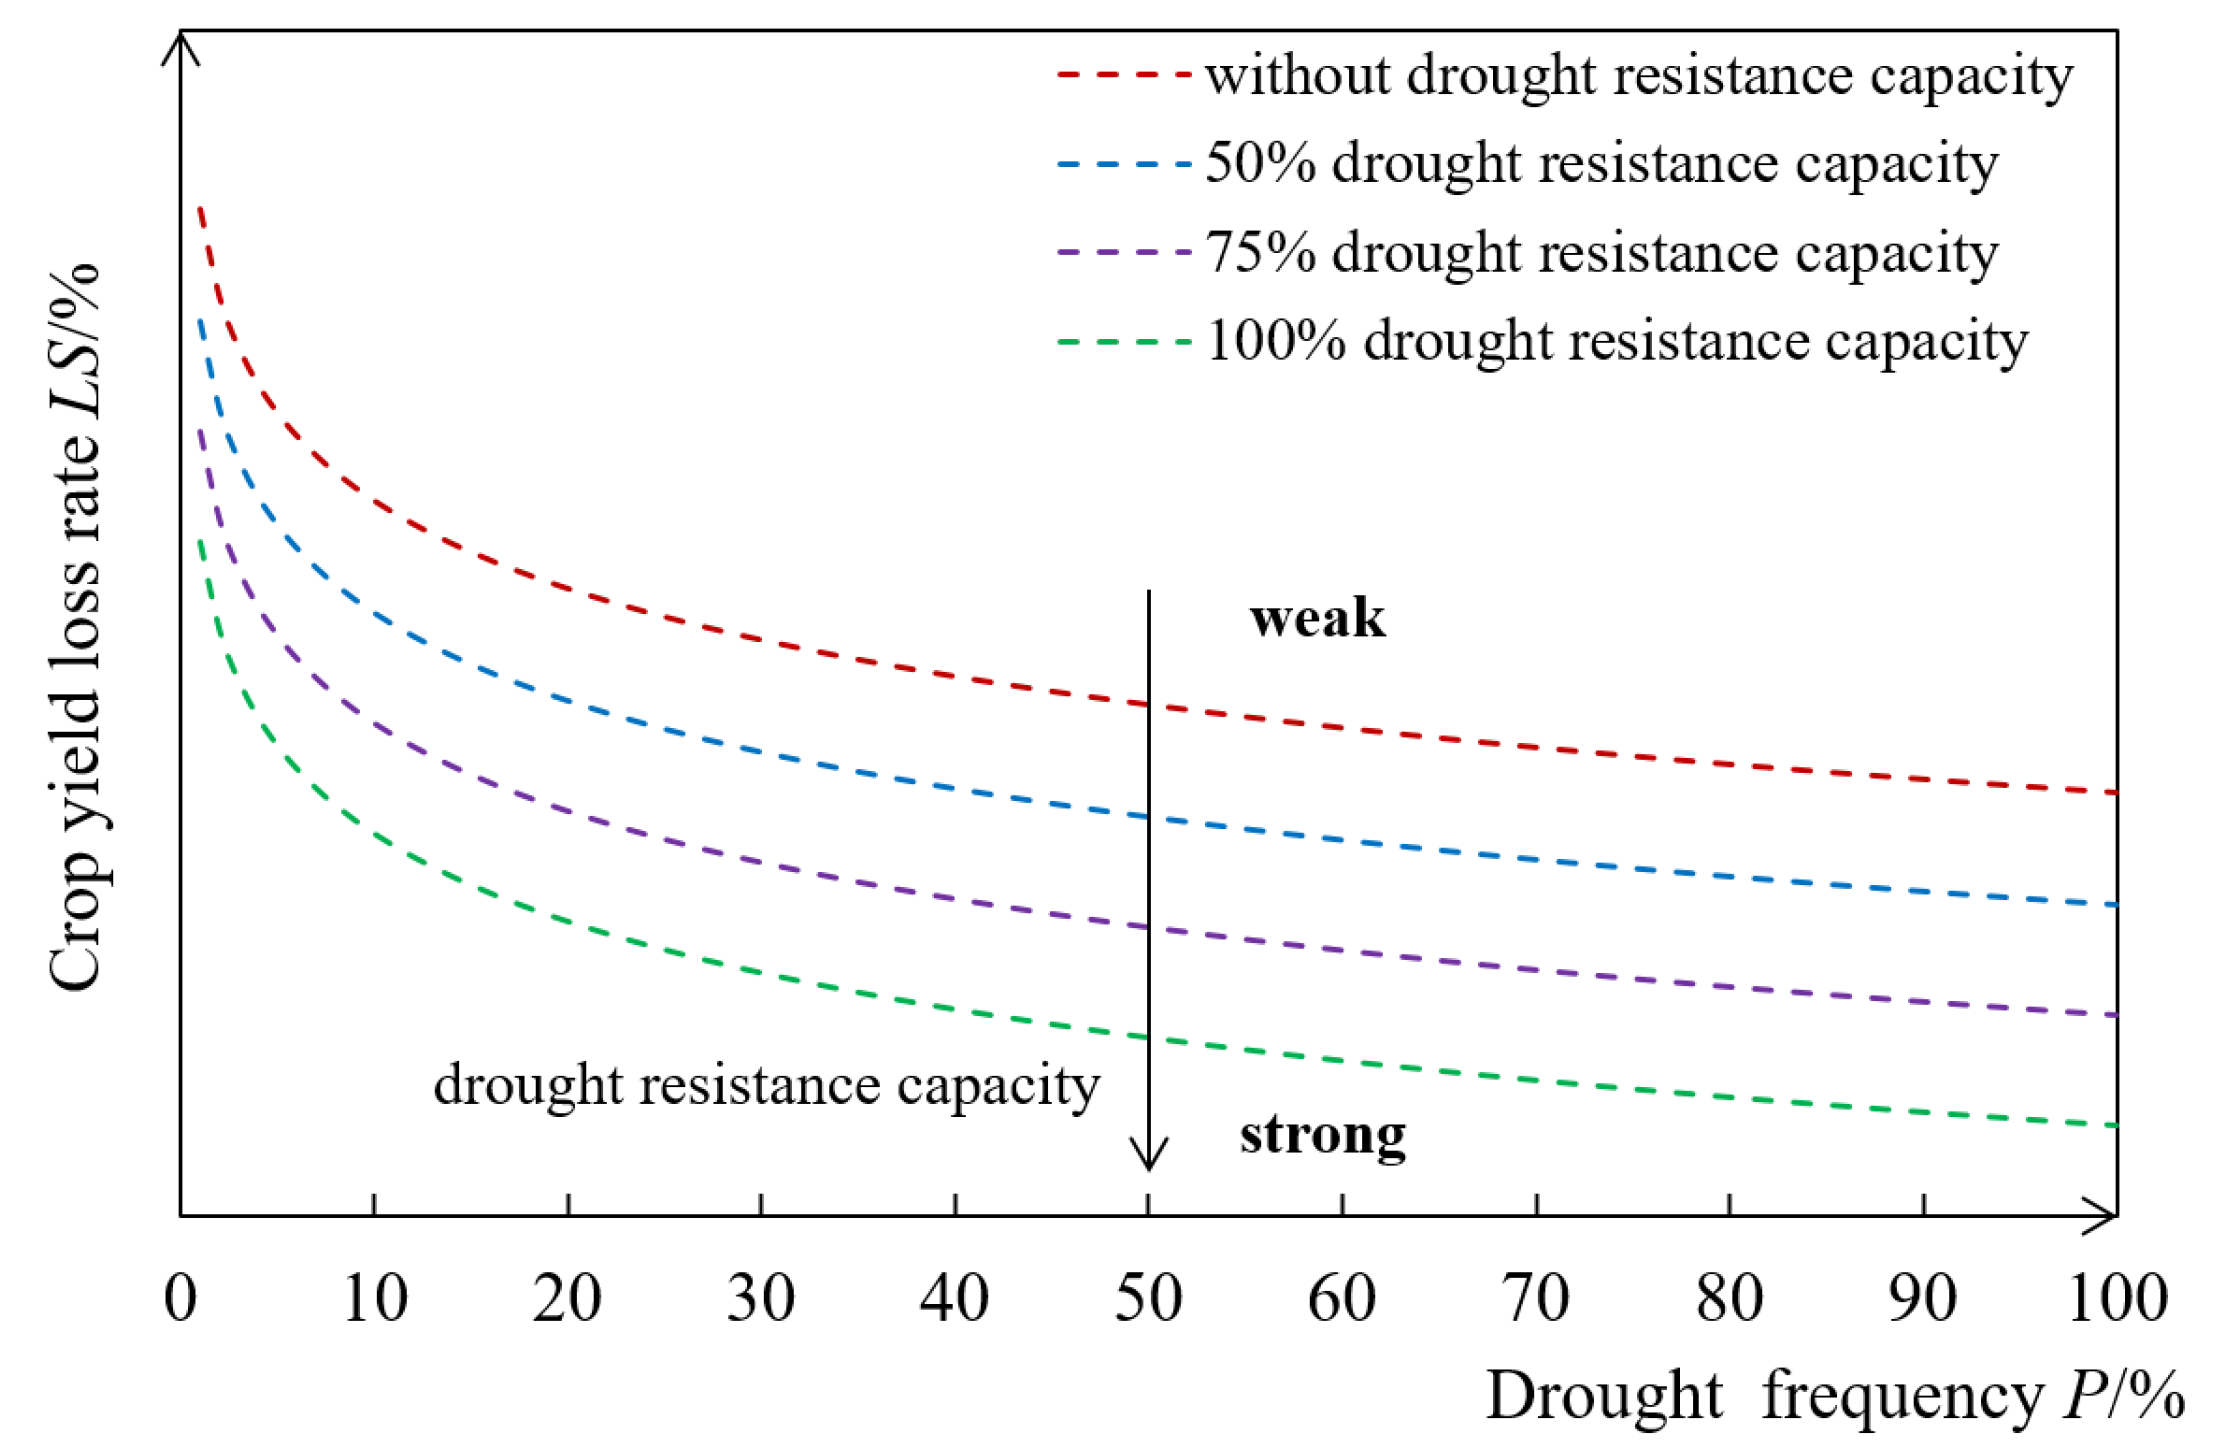
- The semilogarithmic function accurately depicted the summer maize drought disaster loss risk curve in Bengbu City. Under the same drought hazard condition, as the drought resistance capacity increased, the maize loss risk reduced significantly. Furthermore, for the droughts with frequency between 0.2–0.8, 100% irrigation reduced the yield loss rate of maize to below 10%. Especially when the frequency was higher than 0.8, 100% irrigation basically prevented the loss. Therefore, for the droughts with high frequency and low intensity in Bengbu, adding timely irrigation was a key measure to reduce the yield loss of maize. Nevertheless, for the droughts with frequency lower than 0.2, the loss reduction effect of irrigation was far less than that for the droughts with high frequency. This study provides an effective approach for quantifying the regional drought disaster loss risk and supporting the decisions of regional drought disaster risk management.
Author Contributions
Funding
Data Availability Statement
Conflicts of Interest
References
- Kchouk, S.; Melsen, L.A.; Walker, D.W.; van Oel, P.R. A geography of drought indices: Mismatch between indicators of drought and its impacts on water and food securities. Nat. Hazards Earth Syst. Sci. 2022, 22, 323–344. [Google Scholar] [CrossRef]
- Hameed, M.; Ahmadalipour, A.; Moradkhani, H. Drought and food security in the Middle East: An analytical framework. Agric. For. Meteorol. 2020, 281, 107816. [Google Scholar] [CrossRef]
- Farrukh, M.U.; Bashir, M.K.; Hassan, S.; Adil, S.A.; Kragt, M.E. Mapping the food security studies in India, Pakistan and Bangladesh: Review of research priorities and gaps. Glob. Food Secur. 2020, 26, 100370. [Google Scholar] [CrossRef]
- Sheffield, J.; Wood, E.F.; Roderick, M.L. Little change in global drought over the past 60 years. Nature 2012, 491, 435–438. [Google Scholar] [CrossRef] [PubMed]
- Mccabe, G.J.; Wolock, D.M. Variability and trends in global drought. Earth Space Sci. 2015, 2, 223–228. [Google Scholar] [CrossRef]
- IPCC (Intergovernmental Panel on Climate Change). Managing the Risks of Extreme Events and Disasters to Advance Climate Change Adaptation: Special Report of the Intergovernmental Panel on Climate Change; Cambridge University Press: Cambridge, UK, 2012. [Google Scholar]
- Kim, J.S.; Park, S.Y.; Hong, H.P.; Chen, J.; Choi, S.J.; Kim, T.W.; Lee, J.H. Drought risk assessment for future climate projections in the Nakdong River Basin, Korea. Int. J. Climatol. 2020, 40, 4528–4540. [Google Scholar] [CrossRef]
- Qu, Y.P.; Hui, G.; Lv, J.; Su, Z.C.; Cheng, X.T.; Sun, H.Q. Agricultural drought disaster risk assessment in China based on the regional disaster system theory. J. Hydraul. Eng. 2015, 46, 908–917. [Google Scholar]
- Cui, Y.; Jin, J.L.; Bai, X.; Ning, S.W.; Zhang, L.B.; Wu, C.G.; Zhang, Y.L. Quantitative evaluation and obstacle factor diagnosis of agricultural drought disaster risk using connection number and information entropy. Entropy 2022, 24, 872. [Google Scholar] [CrossRef]
- Xie, Z.T.; Xu, J.P.; Deng, Y.F. Risk analysis and evaluation of agricultural drought disaster in the major grain-producing areas, China. Geomat. Nat. Hazards Risk 2016, 7, 1691–1706. [Google Scholar] [CrossRef]
- Yu, X.B.; Li, C.L.; Huo, T.Z.; Ji, Z.H. Information diffusion theory-based approach for the risk assessment of meteorological disasters in the Yangtze River Basin. Nat. Hazards 2021, 107, 2337–2362. [Google Scholar]
- Ma, Y.N.; Guga, S.; Xu, J.; Liu, X.P.; Tong, Z.J.; Zhang, J.Q. Assessment of maize drought risk in Midwestern Jilin Province: A comparative analysis of TOPSIS and VIKOR models. Remote Sens. 2022, 14, 2399. [Google Scholar] [CrossRef]
- Villani, L.; Castelli, G.; Piemontese, L.; Penna, D.; Bresci, E. Drought risk assessment in Mediterranean agricultural watersheds: A case study in Central Italy. Agric. Water Manag. 2022, 271, 107748. [Google Scholar] [CrossRef]
- Zhang, F.; Chen, Y.N.; Zhang, J.Q.; Guo, E.L.; Wang, R.; Li, D.J. Dynamic drought risk assessment for maize based on crop simulation model and multi-source drought indices. J. Clean. Prod. 2019, 233, 100–114. [Google Scholar] [CrossRef]
- Wei, Y.Q.; Jin, J.L.; Cui, Y.; Ning, S.W.; Fei, Z.Y.; Wu, C.G.; Zhou, Y.L.; Zhang, L.B.; Liu, L.; Tong, F. Quantitative assessment of soybean drought risk in Bengbu city based on disaster loss risk curve and DSSAT. Int. J. Disaster Risk Reduct. 2021, 56, 102126. [Google Scholar] [CrossRef]
- Schwarz, M.; Landmann, T.; Cornish, N.; Wetzel, K.-F.; Siebert, S.; Franke, J. A spatially transferable drought hazard and drought risk modeling approach based on remote sensing data. Remote Sens. 2020, 12, 237. [Google Scholar] [CrossRef] [Green Version]
- Zhang, Q.; Zhang, J.Q.; Wang, C.Y. Risk assessment of drought disaster in typical area of corn cultivation in China. Theor. Appl. Climatol. 2017, 128, 533–540. [Google Scholar] [CrossRef]
- Yoo, J.; Kim, D.; Kim, H.; Kim, T.-W. Application of copula functions to construct confidence intervals of bivariate drought frequency curve. J. Hydro-Environ. Res. 2016, 11, 113–122. [Google Scholar] [CrossRef]
- Sun, P.; Zhang, Q.; Singh, V.P.; Xiao, M.Z.; Zhang, X.Y. Transitional variations and risk of hydro-meteorological droughts in the Tarim River basin, China. Stoch. Environ. Res. Risk Assess. 2017, 31, 1515–1526. [Google Scholar] [CrossRef]
- Wang, Z.Q.; Jiang, J.Y.; Ma, Q. The drought risk of maize in the farming–pastoral ecotone in Northern China based on physical vulnerability assessment. Nat. Hazards Earth Syst. Sci. 2016, 16, 2697–2711. [Google Scholar] [CrossRef] [Green Version]
- Zhong, S.B.; Wang, X.L.; Yang, Y.S.; Huang, Q.Y. Risk assessment of drought in Yun-Gui-Guang of China jointly using the Standardized Precipitation Index and vulnerability curves. Geomat. Nat. Hazards Risk 2018, 9, 892–918. [Google Scholar] [CrossRef]
- Cui, Y.; Jiang, S.M.; Jin, J.L.; Ning, S.W.; Feng, P. Quantitative assessment of soybean drought loss sensitivity at different growth stages based on S-shaped damage curve. Agric. Water Manag. 2019, 213, 821–832. [Google Scholar] [CrossRef]
- Yin, Y.Y.; Zhang, X.M.; Lin, D.G.; Yu, H.; Wang, J.A.; Shi, P.J. GEPIC-V-R model: A GIS-based tool for regional crop drought risk assessment. Agric. Water Manag. 2014, 144, 107–119. [Google Scholar] [CrossRef]
- Wang, Y.X.; Lv, J.; Wang, Y.C.; Sun, H.Q.; Hannaford, J.; Su, Z.C.; Barker, L.J.; Qu, Y.P. Drought risk assessment of spring maize based on APSIM crop model in Liaoning province, China. Int. J. Disaster Risk Reduct. 2020, 45, 101483. [Google Scholar] [CrossRef]
- Steduto, P.; Hsiao, T.C.; Raes, D.; Fereres, E. AquaCrop-the FAO crop model to simulate yield response to water: I. concepts and underlying principles. Agron. J. 2009, 101, 426–437. [Google Scholar] [CrossRef] [Green Version]
- Paredesa, P.; Wei, Z.; Liu, Y.; Xu, D.; Xin, Y.; Zhang, B.; Pereira, L.S. Performance assessment of the FAO AquaCrop model for soil water, soil evaporation, biomass and yield of soybeans in North China Plain. Agric. Water Manag. 2015, 152, 57–71. [Google Scholar] [CrossRef] [Green Version]
- Katerji, N.; Campi, P.; Mastrorilli, M. Productivity, evapotranspiration, and water use efficiency of corn and tomato crops simulated by AquaCrop under contrasting water stress conditions in the Mediterranean region. Agric. Water Manag. 2015, 152, 57–71. [Google Scholar] [CrossRef]
- Ahmadi, S.H.; Mosallaeepour, E.; Kamgar-Haghighi, A.A.; Sepaskhah, A.R. Modeling maize yield and soil water content with AquaCrop under full and deficit irrigation managements. Water Resour. Manag. 2015, 29, 2837–2853. [Google Scholar] [CrossRef]
- Mashaba-Munghemezulu, Z.; Chirima, G.J.; Munghemezulu, C. Mapping smallholder maize farms using multi-temporal Sentinel-1 data in support of the sustainable development goals. Remote Sens. 2021, 13, 1666. [Google Scholar] [CrossRef]
- Jia, H.C.; Wang, J.A.; Cao, C.X.; Pan, D.H.; Shi, P.J. Maize drought disaster risk assessment of China based on EPIC model. Int. J. Digit. Earth 2012, 5, 488–515. [Google Scholar] [CrossRef]
- Zampieri, M.; Ceglar, A.; Dentener, F.; Dosio, A.; Naumann, G.; van den Berg, M.; Toreti, A. When will current climate extremes affecting maize production become the norm? Earth’s Future 2019, 7, 113–122. [Google Scholar] [CrossRef]
- Zhang, S.; Bai, Y.; Zhang, J.H. Remote sensing-based quantification of the summer maize yield gap induced by suboptimum sowing dates over North China Plain. Remote Sens. 2021, 13, 3582. [Google Scholar] [CrossRef]
- Zhu, B.X.; Chen, S.B.; Cao, Y.J.; Xu, Z.Y.; Yu, Y.; Han, C. A regional maize yield hierarchical linear model combining Landsat 8 vegetative indices and meteorological data: Case study in Jilin Province. Remote Sens. 2021, 13, 356. [Google Scholar] [CrossRef]
- He, Q.J.; Zhou, G.S.; Lü, X.M.; Zhou, M.Z. Climatic suitability and spatial distribution for summer maize cultivation in China at 1.5 and 2.0 °C global warming. Sci. Bull. 2019, 64, 690–697. [Google Scholar] [CrossRef] [Green Version]
- Wang, R.; Zhang, J.Q.; Wang, C.Y.; Guo, E.L. Characteristic analysis of droughts and waterlogging events for maize based on a new comprehensive index through coupling of multisource data in Midwestern Jilin Province, China. Remote Sens. 2020, 12, 60. [Google Scholar] [CrossRef] [Green Version]
- Wu, X.; Wang, P.J.; Ma, Y.P.; Gong, Y.D.; Wu, D.R.; Yang, J.Y.; Huo, Z.G. Standardized relative humidity index can be used to identify agricultural drought for summer maize in the Huang-Huai-Hai Plain, China. Ecol. Indic. 2021, 131, 108222. [Google Scholar] [CrossRef]
- Cheng, H.; Wang, W.; van Oel, P.R.; Lu, J.X.; Wang, G.; Wang, H.J. Impacts of different human activities on hydrological drought in the Huaihe River Basin based on scenario comparison. J. Hydrol. Reg. Stud. 2021, 37, 100909. [Google Scholar] [CrossRef]
- Anhui Statistical Bureau; NBS Survey Office in Anhui. Anhui Statistical Yearbook 2021; China Statistics Press: Beijing, China, 2021. [Google Scholar]
- Duan, K.; Mei, Y.D. Comparison of meteorological, hydrological and agricultural drought responses to climate change and uncertainty assessment. Water Resour. Manag. 2014, 28, 5039–5054. [Google Scholar] [CrossRef]
- Gao, C.; Li, X.W. Precipitation thresholds of drought disaster for maize in areas in front of Bengbu Sluice, Huaihe River Basin, China. Water 2018, 10, 1395. [Google Scholar] [CrossRef] [Green Version]
- China Meteorological Administration. Yearbook of Meteorological Disasters in China 2014; China Meteorological Press: Beijing, China, 2015. [Google Scholar]
- China Meteorological Administration. Yearbook of Meteorological Disasters in China 2020; China Meteorological Press: Beijing, China, 2021. [Google Scholar]
- Wei, T.; Song, S.B. Copula-based composite likelihood approach for frequency analysis of short annual precipitation records. Hydrol. Res. 2018, 49, 1498–1512. [Google Scholar] [CrossRef]
- Du, M.C.; Zhang, J.Y.; Yang, Q.L.; Wang, Z.L.; Bao, Z.X.; Liu, Y.L.; Jin, J.L.; Liu, C.S.; Wang, G.Q. Spatial and temporal variation of rainfall extremes for the North Anhui Province Plain of China over 1976–2018. Nat. Hazards 2021, 105, 2777–2797. [Google Scholar] [CrossRef]
- Tosunoglu, F.; Kisi, O. Joint modelling of annual maximum drought severity and corresponding duration. J. Hydrol. 2016, 543, 406–422. [Google Scholar] [CrossRef]
- Lu, G.H.; Yan, G.X.; Wu, Z.Y.; Kang, Y.X. Regional drought analysis approach based on copula function. Adv. Water Sci. 2010, 21, 188–193. [Google Scholar]
- Hsiao, T.C.; Heng, L.; Steduto, P.; Rojas-Lara, B.; Raes, D.; Fereres, E. AquaCrop-the FAO crop model to simulate yield response to water: III. parameterization and testing for maize. Agron. J. 2009, 101, 448–459. [Google Scholar] [CrossRef]
- Dai, J.Y.; Gu, W.L. Studies on the relationship between root growth and yield in maize II: The interaction of root system and leaves of maize and its relation with yield. Acta Agron. Sin. 1998, 14, 310–314. [Google Scholar]
- Song, H.X.; Li, S.X. Effect of root growing space of on maize its absorbing characteristics. Sci. Agric. Sin. 2003, 36, 899–904. [Google Scholar]
- Yang, Q.H.; Gao, E.M.; Ma, X.M. Study on growing dynamic of maize root system in Shajiang black soil. Acta Agron. Sin. 2000, 26, 587–593. [Google Scholar]
- Zhang, Y.F.; Wang, Y.F.; Liu, L.X. Function mechanism between the drought and waterlogging disaster and the soil-structure of the Shajiang soil in Huaibei Plain. Prog. Geogr. 2001, 20, 169–176. [Google Scholar]
- Wang, Z.L. Study on “Four Waters” Transformation Mechanism in the Huaibei Plain. Ph.D. Thesis, Hohai University, Nanjing, China, 2017. [Google Scholar]
- Zhang, C.L.; Ye, J.Y.; Qiu, X.M. Characteristics of drought and flood in Bengbu City in recent 45 years based on standardized precipitation index. Water Resour. Power 2013, 31, 9–12, 135. [Google Scholar]
- Sun, P.; Zhang, Q.; Cheng, C.; Singh, V.P.; Shi, P.J. ENSO-induced drought hazards and wet spells and related agricultural losses across Anhui province, China. Nat. Hazards 2017, 89, 963–983. [Google Scholar] [CrossRef]
- Zhou, Y.L.; Zuo, Y.L.; Zhang, Y.L.; Jin, J.L.; Zhou, P.; Wu, C.G.; Cui, Y.; Ning, S.W. Identification and characteristics analysis of Meiyu in Anhui Province based on the National Standard of Meiyu monitoring indices. Hydrol. Res. 2021, 52, 975–989. [Google Scholar] [CrossRef]
- Tang, G.M.; Wang, Y.Z. Optimization irrigation procedure and economic irrigation norm of main arid crops. J. Irrig. Drain. 2006, 25, 24–29. [Google Scholar]
- Cui, Y.; Jiang, S.M.; Feng, P.; Jin, J.L.; Yuan, H.W. Winter wheat evapotranspiration estimation under drought stress during several growth stages in Huaibei Plain, China. Water 2018, 10, 1208. [Google Scholar] [CrossRef] [Green Version]
- Cui, Y.; Ning, S.W.; Jin, J.L.; Jiang, S.M.; Zhou, Y.L.; Wu, C.G. Quantitative lasting effects of drought stress at a growth stage on soybean evapotranspiration and aboveground biomass. Water 2021, 13, 18. [Google Scholar] [CrossRef]
- Wei, Y.Q.; Jin, J.L.; Jiang, S.M.; Ning, S.W.; Cui, Y.; Zhou, Y.L. Simulated assessment of summer maize drought loss sensitivity in Huaibei Plain, China. Agronomy 2019, 9, 78. [Google Scholar] [CrossRef] [Green Version]
- Cui, Y.; Jin, J.L.; Jiang, S.M.; Zhou, Y.L.; Wu, C.G.; Ning, S.W. Study on response relationship between evapotranspiration and aboveground growth matter of soybean under different drought stress. J. Catastrophology 2021, 36, 79–87. [Google Scholar]
- Jin, J.L.; Ma, Q.; Cui, Y.; Bai, X.; Jiang, S.M.; Zhou, Y.L.; Zhou, R.X. Analysis on comprehensive prevention mechanism of actual risk of regional drought based on ternary chain transmission structure. J. Catastrophology 2022, 37, 6–12. [Google Scholar]
- Han, C.Y.; Zhang, B.Z.; Chen, H.; Liu, Y.; Wei, Z. Novel approach of upscaling the FAO AquaCrop model into regional scale by using distributed crop parameters derived from remote sensing data. Agric. Water Manag. 2020, 240, 106288. [Google Scholar] [CrossRef]
- Wolka, K.; Biazin, B.; Martinsen, V.; Mulder, J. Soil and water conservation management on hill slopes in southwest Ethiopia. II. Modeling effects of soil bunds on surface runoff and maize yield using AquaCrop. J. Environ. Manag. 2021, 296, 113187. [Google Scholar] [CrossRef]
- Wu, H.; Yue, Q.; Guo, P.; Xu, X.Y.; Huang, X. Improving the AquaCrop model to achieve direct simulation of evapotranspiration under nitrogen stress and joint simulation-optimization of irrigation and fertilizer schedules. Agric. Water Manag. 2022, 266, 107599. [Google Scholar] [CrossRef]
- Abedinpour, M.; Sarangi, A.; Rajput, T.B.S.; Singh, M.; Pathak, H.; Ahmad, T. Performance evaluation of AquaCrop model for maize crop in a semi-arid environment. Agric. Water Manag. 2012, 110, 55–66. [Google Scholar] [CrossRef]
- Nyakudya, I.W.; Stroosnijder, L. Effect of rooting depth, plant density and planting date on maize (Zea mays L.) yield and water use efficiency in semi-arid Zimbabwe: Modelling with AquaCrop. Agric. Water Manag. 2014, 146, 280–296. [Google Scholar] [CrossRef]
- Ran, H.; Kang, S.Z.; Li, F.S.; Tong, L.; Ding, R.S.; Du, T.S.; Li, S.E.; Zhang, X.T. Performance of AquaCrop and SIMDualKc models in evapotranspiration partitioning on full and deficit irrigated maize for seed production under plastic film-mulch in an arid region of China. Agric. Syst. 2017, 151, 20–32. [Google Scholar] [CrossRef]
- Li, F.W.; Liu, Y.; Yan, W.H.; Zhao, Y.; Jiang, R.G. Effect of future climate change on summer maize growth in Shijin Irrigation District. Theor. Appl. Climatol. 2020, 139, 33–44. [Google Scholar] [CrossRef]


| Soil Layer | Thickness | Bulk Density (g cm−3) | Wilting Water Content (cm3 cm−3) | Field Capacity (cm3 cm−3) | Saturated Water Content (cm3 cm−3) |
|---|---|---|---|---|---|
| 1 | 0–40 cm | 1.18 | 0.13 | 0.33 | 0.42 |
| 2 | 40–80 cm | 1.35 | 0.14 | 0.35 | 0.39 |
| 3 | 80–120 cm | 1.48 | 0.17 | 0.37 | 0.41 |
| Parameter Type | Parameter Meaning | Unit | Value |
|---|---|---|---|
| Canopy | initial canopy cover degree | % | 0.35 |
| soil cover degree of single plant when germination rate reaches 90% | cm2 per plant | 5.0 | |
| planting density | plant per hm2 | 0.65 × 10⁵ | |
| canopy growth rate | % per day, relative increase in canopy cover | 14.2 | |
| maximum canopy cover degree | % | 78 | |
| canopy decline rate | % per day, relative decrease in canopy cover | 12.5 | |
| Crop transpiration | crop transpiration coefficient | 1.00 | |
| Doot zone | maximum effective root depth | m | 1.20 |
| root zone expansion rate | cm per day | 1.9 | |
| Yield | reference harvest index | % | 48 |
| duration of harvest index | day | 35 | |
| duration of flowering period | day | 13 | |
| Drought stress | lower threshold for influence coefficient of drought stress on canopy growth | 0.12 | |
| upper threshold for influence coefficient of drought stress on canopy growth | 0.70 | ||
| influence coefficient of drought stress on stomatal control | 5.5 | ||
| influence coefficient of drought stress on canopy senescence | 3.5 | ||
| upper threshold for influence coefficient of drought stress on pollination | 0.68 |
| Drought Characteristic Variable | Drought Duration | Drought Intensity | ||||||
|---|---|---|---|---|---|---|---|---|
| Mean Value | Cv | Cs | R2 | Mean Value | Cv | Cs | R2 | |
| P-III function parameter value | 2.46 | 0.48 | 0.87 | 0.96 | 1.95 | 0.55 | 2.65 | 0.93 |
| Function Type | Power Fucntion D = aPb | Exponential Function D = aebP | Semilogarithmic Function D = aln(P) + b | ||||||
|---|---|---|---|---|---|---|---|---|---|
| a | b | R2 | a | b | R2 | a | b | R2 | |
| Function parameter value | 8.17 | −0.44 | 0.91 | 3.51 | −0.02 | 0.83 | −1.02 | 5.49 | 0.94 |
| Simulation Variable | 2018 Season | 2019 Season | ||||
|---|---|---|---|---|---|---|
| Simulated Value | Measured Value | Relative Effor (RE) | Simulated Value | Measured Value | Relative Effor (RE) | |
| Aboveground biomass at harvest (t hm−2) | 11.33 | 11.49 | 1.38% | 12.17 | 12.39 | 1.79% |
| Yield per unit area (t hm−2) | 5.50 | 5.54 | 0.67% | 5.86 | 5.88 | 0.31% |
| Drought Event | Yied Per Unit Area during Drought Period/t hm−2 | Yield Loss Per Unit Area/t hm−2 | Yield Loss Rate/% | |
|---|---|---|---|---|
| Year | Month | |||
| 1983 | June, July, August | 5.199 | 0.739 | 12.44 |
| 1985 | August | 4.967 | 0.971 | 16.35 |
| 1986 | August | 5.183 | 0.755 | 12.71 |
| 1987 | September | 5.098 | 0.840 | 14.14 |
| 1988 | June, July, August | 3.233 | 2.705 | 45.55 |
| 1992 | June, July, August | 3.557 | 2.381 | 40.10 |
| 1994 | June, July, August | 3.375 | 2.563 | 43.16 |
| 1996 | August | 4.897 | 1.041 | 17.53 |
| 1998 | September | 4.266 | 1.672 | 28.16 |
| 1999 | September | 5.246 | 0.692 | 11.65 |
| 2000 | July, August | 4.741 | 1.197 | 20.15 |
| 2001 | June, July, September | 2.044 | 3.894 | 65.58 |
| 2004 | June, July, August | 4.373 | 1.565 | 26.35 |
| 2010 | July | 4.715 | 1.223 | 20.59 |
| 2011 | June, July | 4.836 | 1.102 | 18.56 |
| 2012 | June, July | 4.579 | 1.359 | 22.88 |
| 2014 | July | 5.167 | 0.771 | 12.98 |
| 2015 | July | 5.094 | 0.844 | 14.21 |
| 2016 | August, September | 4.598 | 1.340 | 22.56 |
| Mean value | 4.483 | 1.455 | 24.51 | |
| Hydrological Year Type | Irrigation Times | Irrigation Amount at Each Growth Stage/mm | Total Irrigation Amount/mm | Total Water Consumption/mm | Economical Irrigation Quota/mm | |||
|---|---|---|---|---|---|---|---|---|
| Seedling Stage | Jointing Stage | Tasseling Stage | Filling and Ripening Stage | |||||
| 50% (wet year) | 0 | 0 | 0 | 0 | 0 | 0 | 375 | 45 |
| 1 | 0 | 45 | 0 | 0 | 45 | 405 | ||
| 75% (normal year) | 0 | 0 | 0 | 0 | 0 | 0 | 320 | 125 |
| 1 | 0 | 0 | 45 | 0 | 45 | 365 | ||
| 2 | 0 | 90 | 0 | 0 | 90 | 405 | ||
| 3 | 35 | 45 | 45 | 0 | 125 | 425 | ||
| 95% (dry year) | 0 | 0 | 0 | 0 | 0 | 0 | 250 | 225 |
| 1 | 0 | 0 | 45 | 0 | 45 | 300 | ||
| 2 | 0 | 45 | 45 | 0 | 90 | 345 | ||
| 3 | 0 | 45 | 90 | 0 | 135 | 390 | ||
| 4 | 0 | 135 | 45 | 0 | 180 | 435 | ||
| 5 | 0 | 135 | 90 | 0 | 225 | 470 | ||
| 6 | 45 | 90 | 135 | 0 | 270 | 500 | ||
| Irrigation Scenarios | Irrigation Times | Irrigation Amount at Each Growth Stage/mm | Total Irrigation Amount/mm | |||
|---|---|---|---|---|---|---|
| Seedling Stage | Jointing Stage | Tasseling Stage | Filling and Ripening Stage | |||
| Without drought resistance capacity | 0 | 0 | 0 | 0 | 0 | 0 |
| 50% drought resistance capacity | 2 | 0 | 22.5 | 22.5 | 0 | 45.0 |
| 100% drought resistance capacity | 2 | 0 | 45.0 | 45.0 | 0 | 90.0 |
| Drought Resistance Capacity Level | LS = aln(P) + b | ||||||||
|---|---|---|---|---|---|---|---|---|---|
| Without Drought Resistance Capacity | 50% Drought Resistance Capacity | 100% Drought Resistance Capacity | |||||||
| a | b | R2 | a | b | R2 | a | b | R2 | |
| Function parameter value | −15.37 | 78.55 | 0.94 | −12.81 | 63.27 | 0.95 | −11.43 | 51.64 | 0.94 |
Publisher’s Note: MDPI stays neutral with regard to jurisdictional claims in published maps and institutional affiliations. |
© 2022 by the authors. Licensee MDPI, Basel, Switzerland. This article is an open access article distributed under the terms and conditions of the Creative Commons Attribution (CC BY) license (https://creativecommons.org/licenses/by/4.0/).
Share and Cite
Cui, Y.; Tang, H.; Jin, J.; Zhou, Y.; Jiang, S.; Chen, M. System Structure–Based Drought Disaster Risk Assessment Using Remote Sensing and Field Experiment Data. Remote Sens. 2022, 14, 5700. https://doi.org/10.3390/rs14225700
Cui Y, Tang H, Jin J, Zhou Y, Jiang S, Chen M. System Structure–Based Drought Disaster Risk Assessment Using Remote Sensing and Field Experiment Data. Remote Sensing. 2022; 14(22):5700. https://doi.org/10.3390/rs14225700
Chicago/Turabian StyleCui, Yi, Huiyan Tang, Juliang Jin, Yuliang Zhou, Shangming Jiang, and Menglu Chen. 2022. "System Structure–Based Drought Disaster Risk Assessment Using Remote Sensing and Field Experiment Data" Remote Sensing 14, no. 22: 5700. https://doi.org/10.3390/rs14225700