Article

A Novel Echo Separation Scheme for Space-Time Waveform-Encoding SAR Based on the Second-Order Cone Programming (SOCP) Beamformer

1
Department of Space Microwave Remote Sensing System, Aerospace Information Research Institute, Chinese Academy of Sciences, Beijing 100190, China
2
School of Electronic, Electrical and Communication Engineering, University of Chinese Academy of Sciences, Beijing 100039, China
*
Author to whom correspondence should be addressed.
Remote Sens. 2022, 14(22), 5888; https://doi.org/10.3390/rs14225888
Submission received: 3 October 2022 / Revised: 31 October 2022 / Accepted: 16 November 2022 / Published: 20 November 2022
(This article belongs to the Special Issue SAR-Based Signal Processing and Target Recognition)

Abstract

:
Space-time waveform-encoding (STWE)-synthetic aperture radar (SAR) is an effective way to accomplish high-resolution and wide-swath (HRWS) imaging. By designing the specific signal transmit mode, the echoes from several subswaths are received within a single receiving window and overlap each other in STWE-SAR. In order to separate the overlapped echoes, the linear-constrained minimum variance (LCMV) beamformer, a single-null beamformer, is typically used. However, the LCMV beamformer has a very narrow and unstable notch depth, which is not sufficient to accurately separate the overlapped echoes with large signal energy differences between subswaths. The issue of signal energy differences in STWE-SAR is first raised in this paper. Moreover, a novel echo separation scheme based on a second-order cone programming (SOCP) beamformer is proposed. The beam pattern generated by the SOCP beamformer allows flexible adjustment of the notch width and depth, which effectively improves the quality of separation results compared to the LCMV beamformer. The simulation results illustrate that the scheme can greatly enhance the performance of echo separation. Furthermore, the experimental results based on the X-band STWE-SAR airborne system not only demonstrate the scheme’s effectiveness but also indicate that it holds great promise for future STWE-SAR missions.

Graphical Abstract

1. Introduction

Due to the increasing demand for applications, high-resolution and wide-swath (HRWS) has been a focal point for current and future research on synthetic aperture radar (SAR) systems [1,2,3,4]. The azimuth resolution and swath range of traditional SAR with a single channel cannot be enhanced simultaneously due to the minimal antenna area constraint [5]. By expanding the number of SAR channels, beamforming can overcome standard SAR system performance limitations and realize HRWS imaging. The application of multichannel reception at the azimuth [6] reduces the requirement for pulse repetition frequency (PRF) of the system and creates conditions for expanding the receiving window, allowing for a wider imaging swath. Applying the digital beamforming (DBF) technique to elevation [7] can generate a sharp receive beam with a high gain to scan the echo in real-time, hence improving the system’s signal-to-noise ratio (SNR) for wide-swath imaging. Benefiting from the mature application of multichannel technology to spaceborne SAR [8], DBF has been deployed for spaceborne SAR missions, such as Radar Observing System for Europe at L-band (ROSE-L) [9], Sentinel-1 next-generation (NG) [10], Advanced Land-Observing Satellite-4 (ALOS-4) [11], Tandem-L [12], National Aeronautics and Space Administration (NASA)–Indian Space Research Organisation (ISRO) SAR (NISAR) [13], HRWS SAR [14], etc. Additionally, the DBF technique has become an important part of the HRWS-SAR systems because of its distinctive characteristics in spatial filtering and its ability to improve system performance.
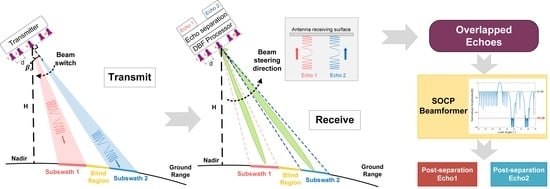
In addition to the benefits of integrating multichannel technology into the HRWS-SAR systems, the multiple degrees of freedom have come into view. For example, the innovative multidimensional waveform-encoding (MWE) [15] system can utilize the system information from multiple dimensions to improve system performance. Based on the space-time relationship of the system, the space-time waveform-encoding (STWE)-SAR can realize waveform diversity in the space-time domain [16,17]. As illustrated in Figure 1, STWE-SAR utilizes a specifically designed beam transmitting sequence that allows the subswath in the far range to be illuminated for one pulse repetition time (PRT) or several PRTs ahead of the subswath in the near range. In this way, the echoes from different subswaths can arrive at the antenna simultaneously and overlap each other within a single receiving window. STWE-SAR can gather ground feature information across a wider swath within the same receiving window and reduce the echo data volume. In order to obtain the echoes of different subswaths from the overlapped echoes, research on the separation schemes is one of the main focuses.
On this basis, echo separation schemes relayed on coding waveforms, such as the orthogonal frequency-division multiplexing (OFDM) chirp waveform [18], short-term shift-orthogonal (STSO) waveform [19], segmented-phase-code (SPC) waveform [20], segmented shift chirp (SSC) waveform [21], etc., have been widely and intensively studied in the multiple-input–multiple-output (MIMO)-SAR to achieve HRWS imaging. Unlike these schemes, STWE-SAR does not care about the structure of the waveform and encodes the waveform in the space-time domain. The DBF at elevation plays a crucial part in these echo separation schemes due to its spatial filtering characteristics, as the echoes of the subswaths come from distinct directions in space. Furthermore, the DBF technique and the optimization algorithm are then utilized to obtain a specific beamformer in STWE-SAR, such as the linear-constrained minimum variance (LCMV) beamformer [22], to generate a receive beam pattern with a single-null in a specific direction to achieve echo separation. In addition to the conventional LCMV beamformer, Feng et al. [16] introduced a separation strategy that incorporates the finite-impulse response (FIR) filtering process into the LCMV beamformer in order to mitigate the detrimental impacts of pulse extension loss (PEL). Zhao et al. [17] proposed an LCMV beamformer with digital scalloped beamforming (DSBF) and adaptive multiple nulls for the STWE-SAR.
However, the issue of the signal energy differences between different subswaths in real scenarios has not received significant consideration in previous research. The LCMV beamformer and the beamformer in [16] can only suppress interference energy in a single direction. The null depth is restricted and uncontrollable. The main suppression still depends on the level of side-lobes surrounding the null. Assume a strong scatterer as interference whose signal energy exceeds the LCMV beamformer’s suppression capabilities. In such a case, the remaining energy of the strong scatterer in the other subswath will degrade the separation performance. Although multiple nulls are deployed on the LCMV beamformer in [17] to increase the width of suppression, the actual suppression is not optimal, as is the case with the LCMV beamformer. Moreover, two-dimensional (2D) simulations can reflect the energy interference from azimuth directions in 2D scenes. The traces of the beam contact on the ground are circular. Targets located at different azimuth positions with varied look angles will be located on the equiphasic plane. The echoes from the targets on the trace will arrive at the antenna together with the desired signals. This complicated interference cannot be effectively suppressed by the LCMV beamformer. Consequently, the difficulties with the LCMV beamformer mentioned above could be eliminated by designing a beamformer that can generate a receive beam pattern with a flexible adjustment of the notch width and depth.
A novel echo separation scheme based on second-order cone programming (SOCP) is proposed in this paper because the null-steering constraint of the beam pattern can be summarized as a convex optimization problem [23]. The convex optimization problem can be converted to the equivalent SOCP form that can be efficiently solved by the interior point method [24]. The SOCP beamformer can constrain the side-lobes, which is meaningful for suppressing the range ambiguity to improve the image quality [12,14]. The receive pattern generated by the SOCP beamformer can achieve flexible adjustment of the notch width and depth, which ensures continuous high-intensity suppression of interference during beam steering. Even with many subswaths, the proposed SOCP beamformer can achieve high-quality separation from the overlapped echoes. Therefore, the proposed SOCP beamformer can be effectively deployed in the STWE-SAR.
The following sections are structured as follows. In Section 2, the signal energy differences in STWE-SAR are described, the deficiencies of the conventional LCMV beamformer are discussed, and the detailed design of the SOCP beamformer is given. The simulation results and the experimental separation results based on the airborne STWE-SAR data from the proposed SOCP beamformer and traditional LCMV beamformer are given in Section 3, followed by the discussion in Section 4. Section 5 draws the final conclusion of this paper.

2. Materials and Methods

In this section, the source of the signal energy differences is discussed. The deficiencies of the LCMV beamformer in separating echoes are illustrated in terms of both the depth and number of the nulls. Thus, a SOCP beamformer with flexible adjustment of the notch width and depth is proposed.

2.1. Signal Energy Differences

We assume that the antenna of STWE-SAR has N channels in elevation. The K subswaths are irradiated by K subbeams in a specific time sequence. The echoes from different subswaths arrive at the antenna within the same echo window. The angle of arrival (AoA) for the kth subswath is α k ( τ ) . After down-conversion and range-matched filtering, the signal of the nth received channel can be approximated as:
s r n ( η , τ ) = k = 1 K s k ( η , τ ) · e x p j 2 π d n s i n ( α k ( τ ) β c ) λ
where η denotes the slow time, τ denotes the fast time, λ denotes the signal wavelength, d n denotes the interval between the nth channel and the reference channel, θ k ( τ ) = α k ( τ ) β c denotes the off-boresight angle of the kth subbeam, and β c denotes the boresight angle of the antenna. s k ( η , τ ) is the signal corresponding to the kth subswath, which can be expressed as:
s k ( η , τ ) = σ k · s i n c τ T p k 2 r k ( η ) c · e x p j 2 π f c T p k j 4 π r k ( η ) λ
where σ k denotes the backscattering coefficient corresponding to the scattering point in the kth subswath, T p k = ( k 1 ) · T p denotes the transmit delay of the kth subbeam, T p denotes the pulse duration, r k ( η ) is defined as the slope distance of the scattering point in the kth subswath, and f c denotes the carrier frequency, and the envelope of the compressed signal in the range is s i n c ( · ) .
In STWE-SAR, the echoes from each subswath covered by the main lobe arrive at the antenna simultaneously. According to Equation (2), it should be noted that the signal energy from the subswath arriving at the antenna is related to the back-scattering coefficient σ k of the scatterers in the subswath. In different scattering scenes, such as buildings and water surfaces, the energy of the signal is significantly different, as shown in Figure 2.

2.2. Deficiencies of the LCMV Beamformer

2.2.1. LCMV Beamformer

If the received signal is expressed in the vector form, the output signal of all received channels can be written as:
s r = a s · s
where
s r = [ s r 1 , s r 2 , , s r N ] T ,
s = [ s 1 , s 2 , , s K ] T ,
a s = [ a 1 , a 2 , , a K ] ,
a k = e x p j 2 π d 1 s i n ( θ k ( τ ) ) λ , e x p j 2 π d 2 s i n ( θ k ( τ ) ) λ , , e x p j 2 π d n s i n ( θ k ( τ ) ) λ T ,
( · ) T denotes the transpose, s denotes the receive signal matrix for all subswath, a s denotes the receive array manifold matrix, and a k represents the steering vector of the signal from kth subswaths (subbeams).
According to Equation (3), signals received by the antenna are the overlapped signals from different subswaths. In STWE-SAR, the interfering signals are suppressed by the single-null on the beam pattern while receiving the desired signal with a high gain. The traditional null-steering beamformer is generated based on the LCMV algorithm [22]. To obtain the vector of beamforming weighting coefficients w H , the following constraint needs to be followed:
m i n w w H R n w s . t w H V = e H
where ( · ) H denotes the Hermitian transpose, e H = [ 1 , 0 , , 0 ] ( 1 × K ) denotes the constraint vector, R n denotes the spectral matrix of the thermal receiver noise, R n can be modeled as white in the LCMV beamformer, and V represents the constraint matrix containing the one-order distortionless constraint and a ( K 1 )-order null constraint, V C N × K .
V = [ a s b e a m , a s n u l l ] ,
where a s b e a m denotes the receive array manifold matrix of the beam steering direction, a s b e a m C N × 1 , and a s n u l l denotes the receive array manifold matrix of ( K 1 )-order null constraint, a s n u l l C N × ( K 1 ) . Therefore, we can derive w H as [22]:
w H = e H · ( V H V ) 1 · V H
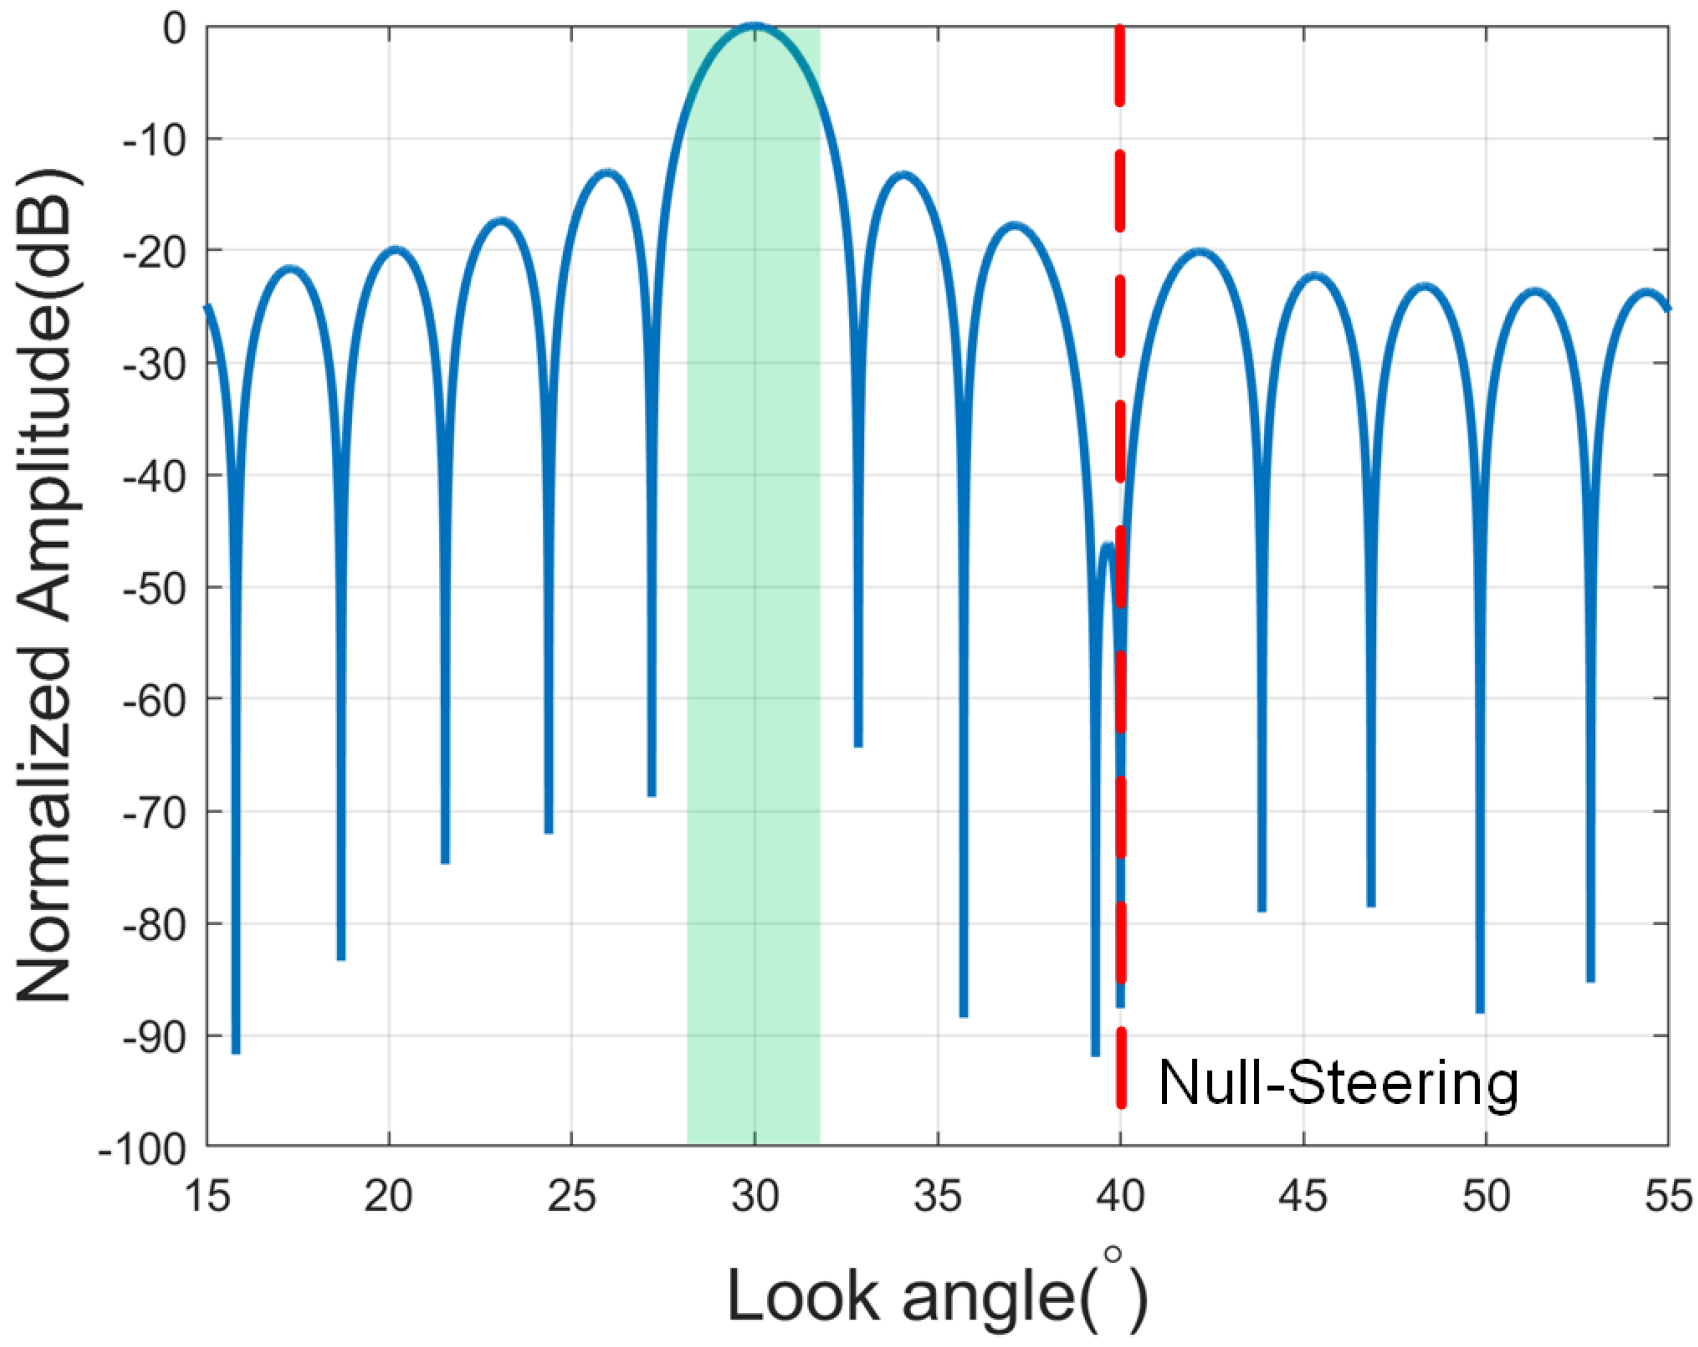
We assume that the number of channels in elevation is N = 16 and the channel interval is d = 0.04 m. The direction of the desired signal is θ s = 30 . The direction of the interference signal is θ j = 40 . According to the beam pattern obtained by the LCMV beamformer in Figure 3, the LCMV beamformer can only suppress the main interfering energy at a specific angle. Because the constraint in Equation (8) does not expressly limit the depth of the null, the notch depth is uncontrollable. The single-null also leads to an insufficient notch width, which is insufficient for coping with the effects of steering deviation or stronger interference around the null.

2.2.2. Restricted Notch Depth

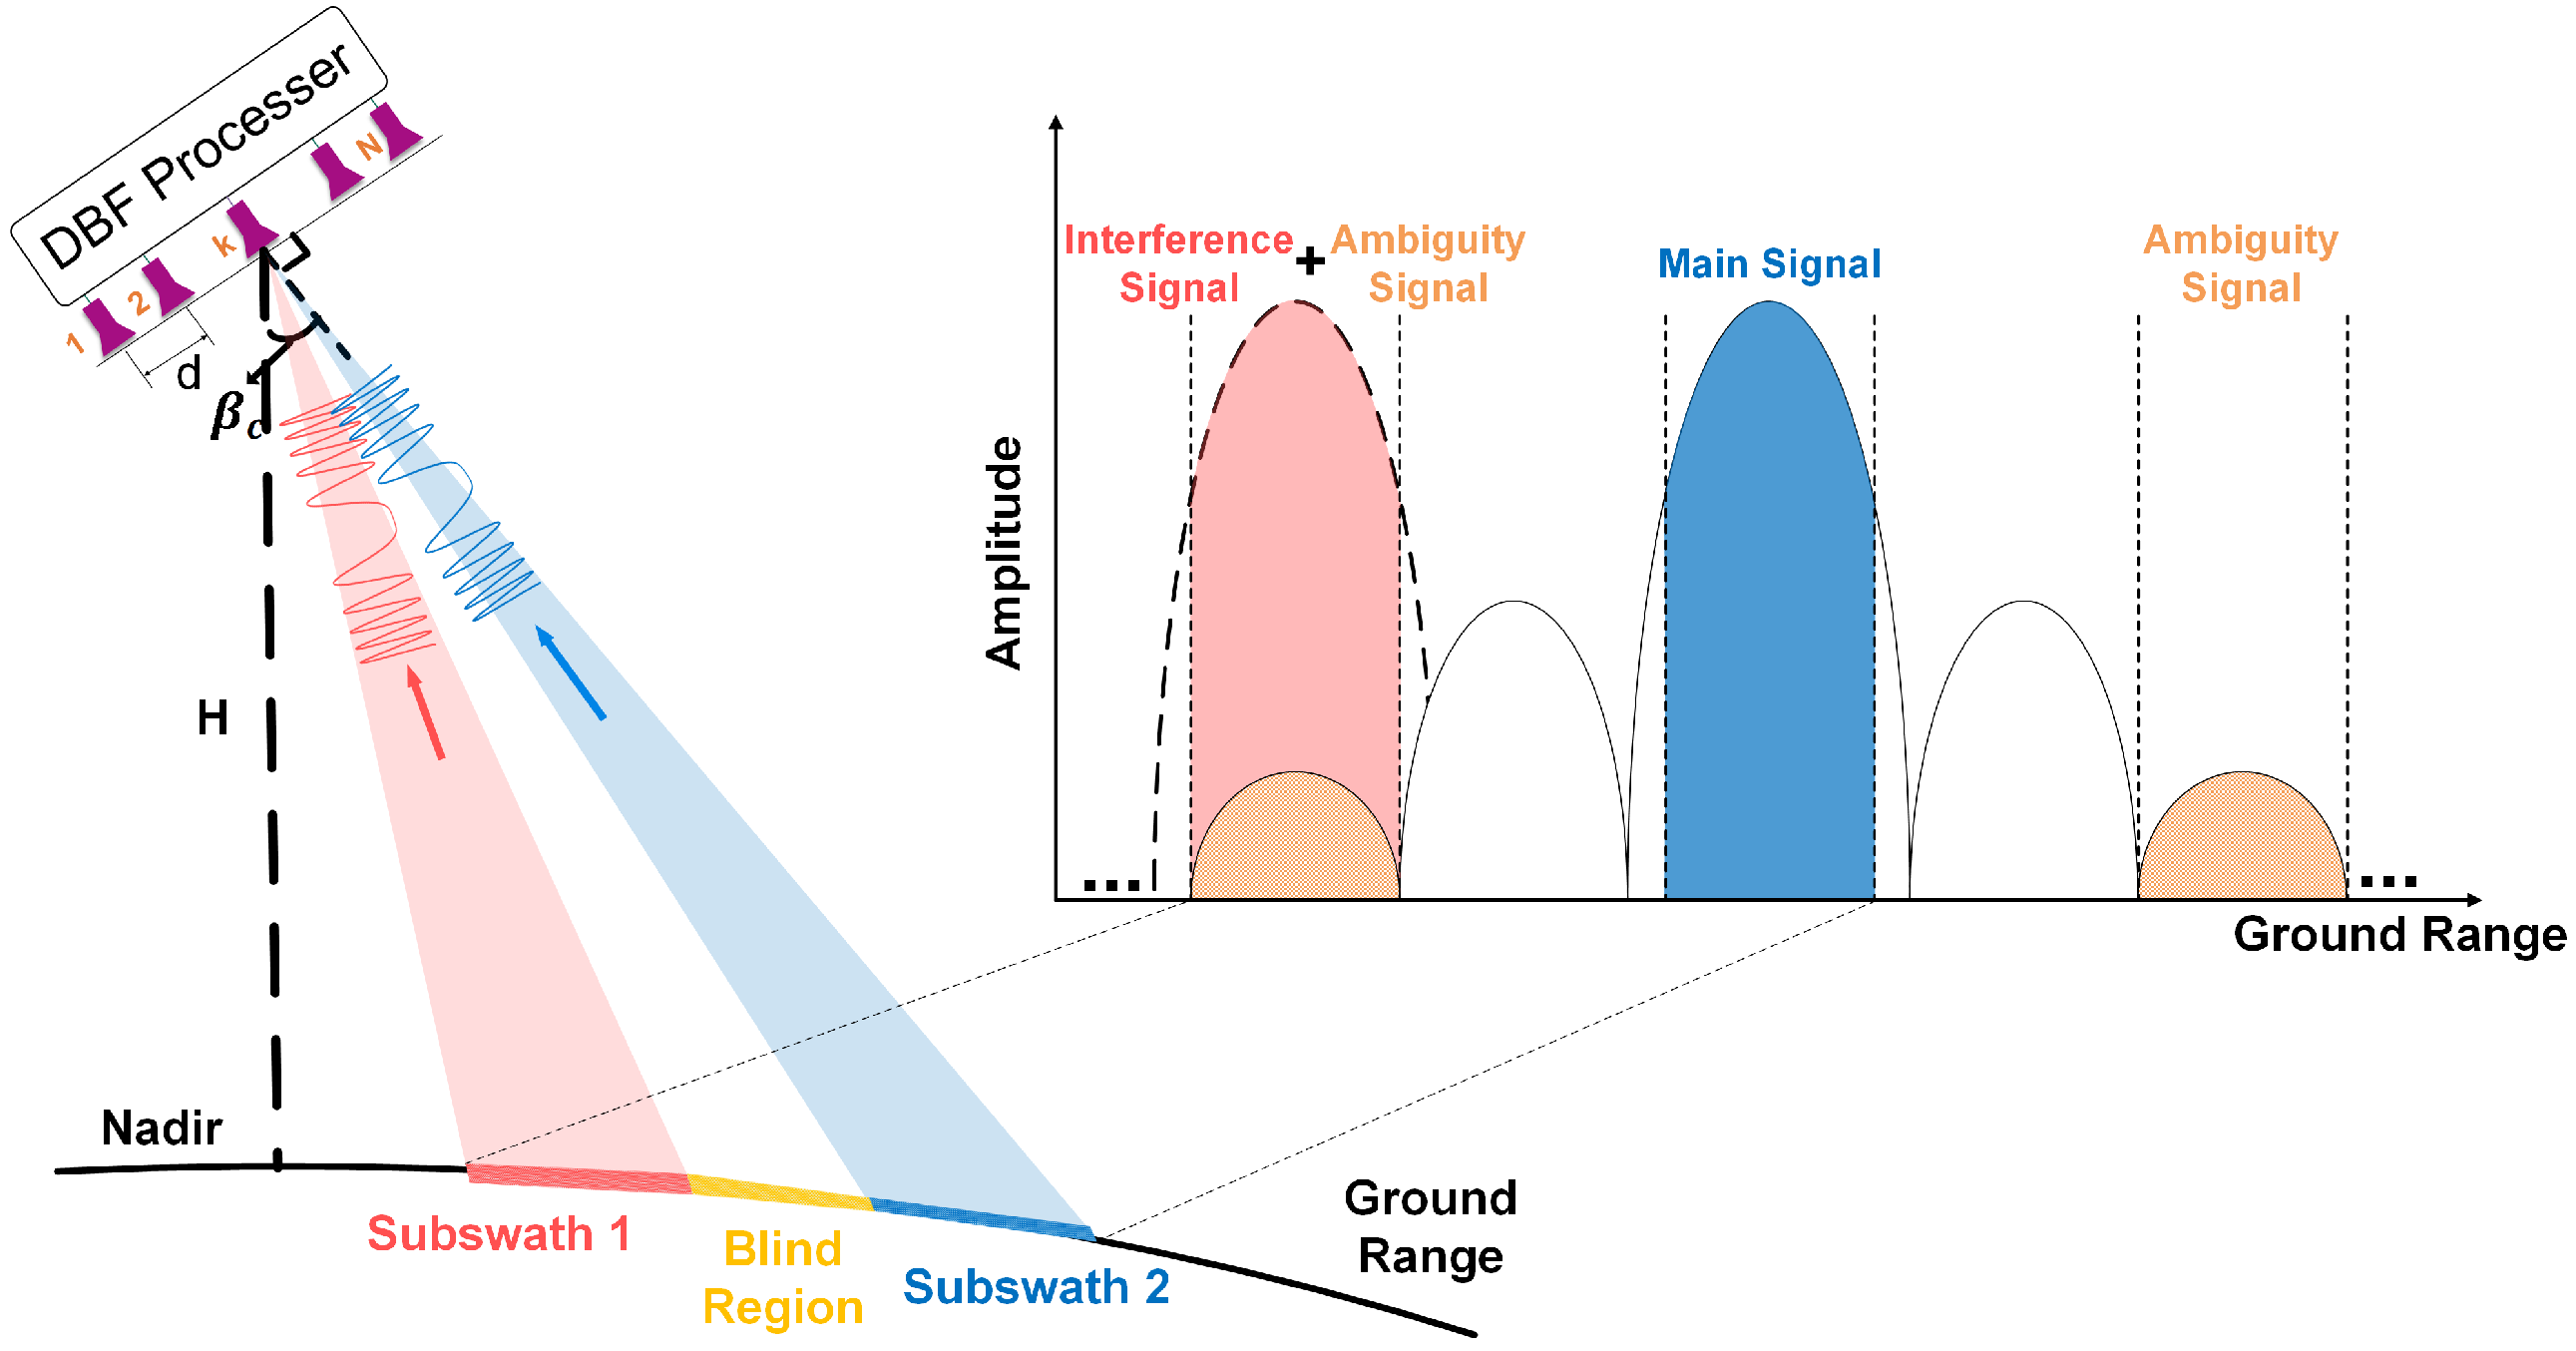
In STWE-SAR, for a subswath, the interference signals that are overlapped can be seen as its “range ambiguity”, as shown in Figure 4. The interference signals are transmitted by the main lobe of the other beam, which has much higher energy than the range ambiguity transmitted within the side-lobes. The signals to be suppressed are the superposition of interference signals and ambiguity signals, which demands the notch of the beam pattern to be deep enough at corresponding look angles. However, the notch depth of the LCMV beam pattern is uncertain, which is related to the gain of the beam pattern generated by the Scan-On-Receive (SCORE) technique at the corresponding angle of the notch on the LCMV beam pattern. The conventional SCORE beamformer and the LCMV beamformer can both be derived from the minimum variance distortionless response (MVDR) theory [22]. The difference is that the LCMV beamformer adds a null constraint. The different positions of the notch will lead to the different notch depths of the LCMV beamformer.
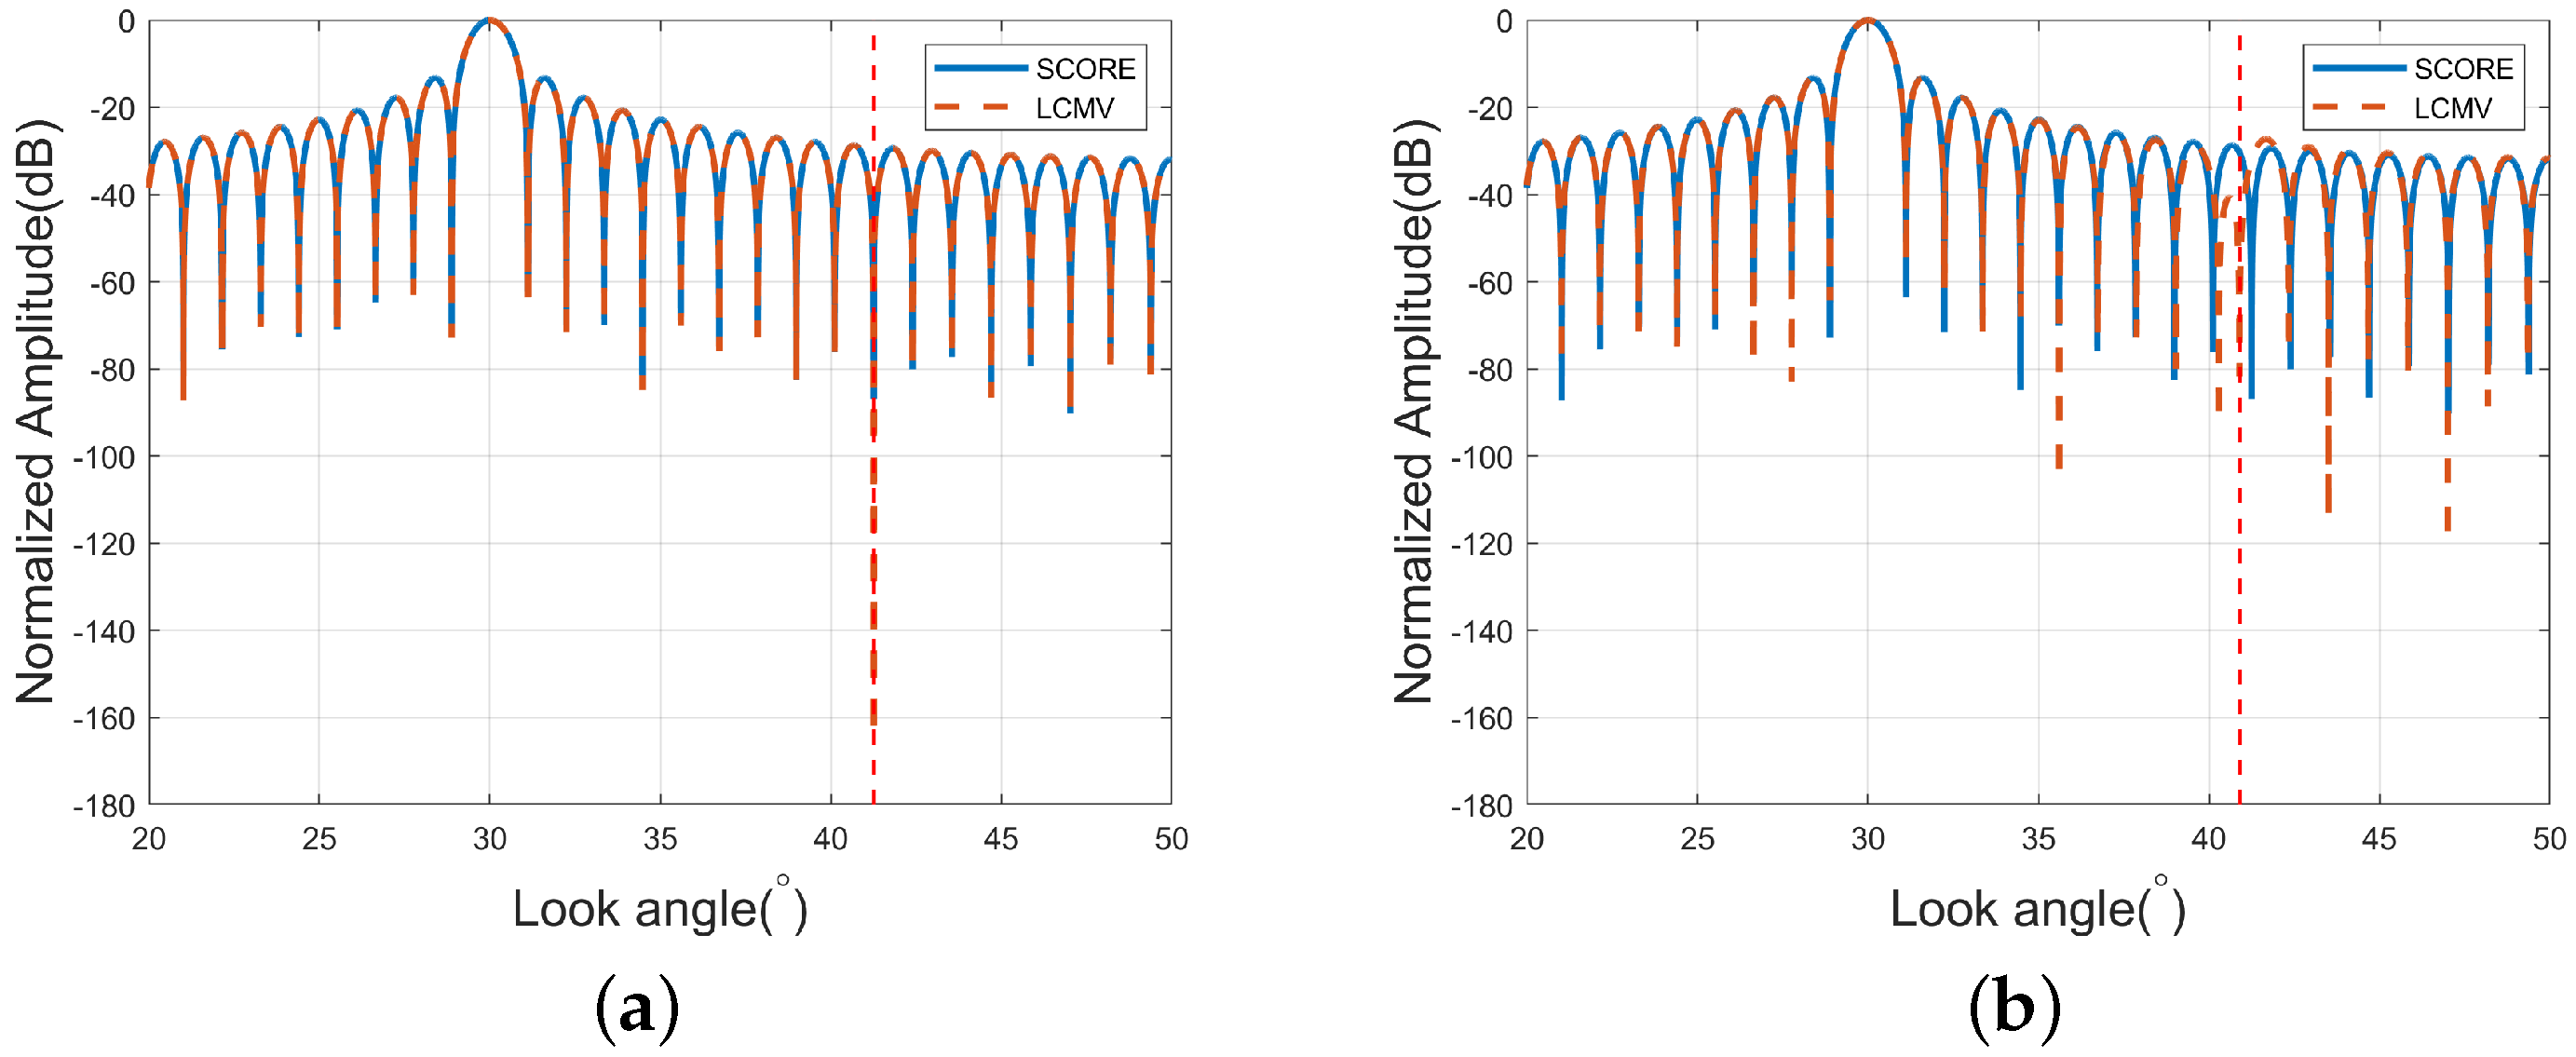
We assume that the number of channels in elevation is N = 40 and the channel interval is d = 0.04 m. Figure 5a shows the beam pattern generated by the LCMV beamformer with the null placed exactly at the notch of the beam pattern generated by SCORE. It can be seen that the LCMV beamformer can achieve an excellent suppression capability of −160 dB at this null. However, the notch depth of the other steering directions cannot be represented by this individual extreme notch depth. Only the signal in the null-steering direction is sufficiently suppressed in Figure 5a. The interference signals from the other directions are not effectively suppressed. In particular, the side-lobes near the null are still maintained at a relatively high level, which is insufficient for interference suppression. The interference signals from other subswaths in STWE-SAR will not always be located at the null. Most of the interference signals still need to be suppressed by the side-lobes. Section 2.2.3 gives a detailed analysis.
In addition, if the null is placed on the side-lobes, as shown in Figure 5b, the suppression ability of the LCMV beamformer at the null is acceptable at −80 dB. Although the gain of the side-lobes has been reduced to −40 dB, resulting in a notch of a certain width, the overall depth of this notch does not reach −80 dB. We assume that the interference energy after being weighted by the beam pattern needs to be suppressed by the notch is still greater than 40 dB. It means that the limited depth cannot suppress the interference below the level of side-lobes when encountering huge energy differences. The residual energy will affect the final imaging results.

2.2.3. Restricted Notch Width

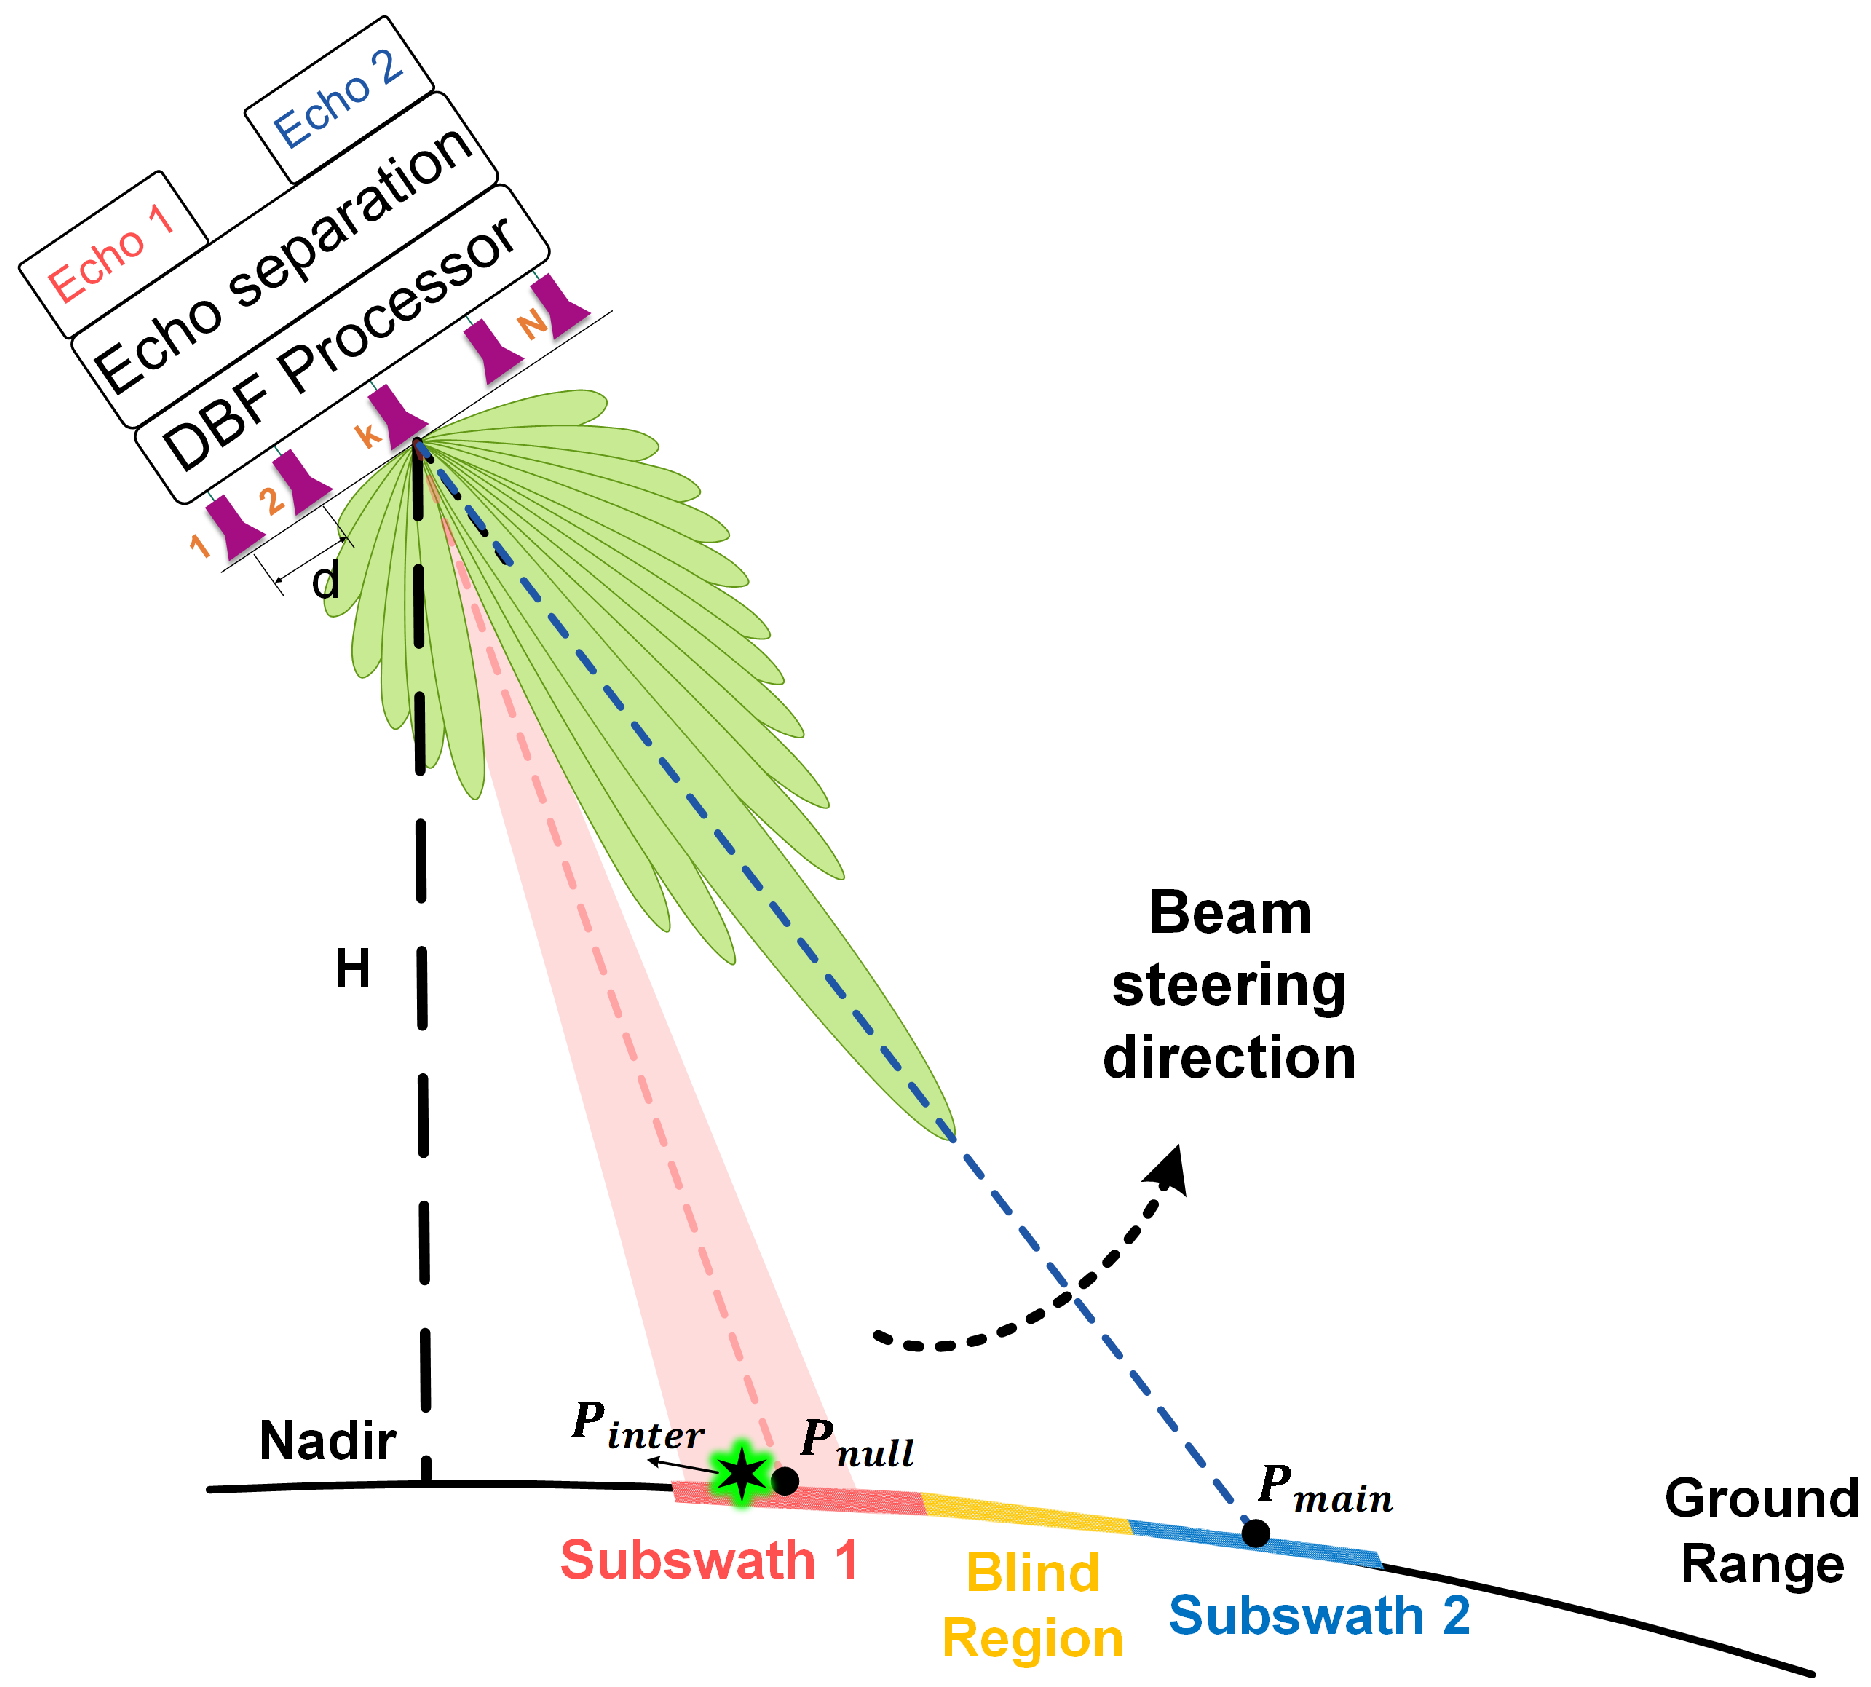
In addition to the limitation of the notch depth, the notch width on the beam pattern obtained by the LCMV beamformer is also an important factor limiting its capability. Since interference suppression still depends mainly on the side-lobes, the beam pattern with a high degree of suppression in a single direction, such as the beam pattern in Figure 5a, is far from sufficient. Suppose the single-null position P n u l l also exists near the strong interference target P i n t e r , as shown in Figure 6. The beam pattern in Figure 5a cannot cope with this situation well. As shown in Figure 6, the increase in notch width can assure the suppression of strong interference signals throughout a range of angles. The interfering signals are always received in the notch during the beam scanning. The separation effect can be enhanced. The increase in the notch width in Figure 5b is a suitable way to cope with it. However, it has limited notch depth.
In addition, there is another case, as shown in Figure 7, where due to the particular imaging geometry of the satellite-ground, the interference signals include not only the signals of P n u l l but also the signals of targets located on the equiphasic plane (The boundary of the beam when it touches the ground is circular called the equiphasic plane) of P n u l l [25]. The signals from targets located on the equiphasic plane will simultaneously arrive at the antenna from different look angles. It is important to note that these signals cannot be handled by range migration correction and range compression in the imaging of the current subswath since the projection of the slant range in the range of these interfering signals is distinct from the center slope range of the desired subswath. The suppression of interference from these targets cannot be achieved with the single-null beam pattern. Therefore, it is necessary to widen the notch so that it can cover the angular range of these interferences in the green region, as shown in Figure 7.

2.3. Proposed SOCP Beamformer

2.3.1. SOCP Theory

SOCP is a type of convex optimization [26] and is often used for beamforming optimization [27], which is used to solve a certain linear function minimization problem of the intersection of an affine set and the product of second-order cones. The standard SOCP optimization problem can be expressed as:
m i n y b T y s . t A j y + b j c j T y + d j , j = 1 , 2 , , J Fy = g
where y R q is the optimization variable, b R q , A j R ( q j 1 ) × q , b j R q j 1 , c j R a , c j T y R , d j R , b j R q j 1 , F C g × a , g C g , is the standard Euclidean norm. The inequality constraint in Equation (11) can be expressed as a second-order cone of dimension q j :
c j T A j y + d j b j S O C j q j
where the q j -dimension second-order cone S O C j q j is defined as:
S O C j q j t x | t R , x C q j 1 , t x
where t is a real scalar, and x is a complex ( q j 1 ) -dimensional vector. The second-order cone is hence convex since the affine mapping does not change the convexity. The equality constraints can be expressed as zero cones:
g Fy { 0 } g
where the zero cone is defined as:
{ 0 } g { x x C g , x = 0 } .
Furthermore, the optimization problem in Equation (11) can be transformed into the dual standard form of the convex conic optimization problem [24]:
m a x y b T y s . t c A T y K
where K is a symmetric cone consisting of the second-order cone, the zero cone, and the set of positive real numbers R + :
K = R + × { 0 } g × S O C 1 q 1 × × S O C J q J
Each symmetric cone corresponds to a constraint.

2.3.2. Design of the Beamformer Based on SOCP Theory

In the practical application of STWE-SAR, the received beam pattern is required to form a notch with a certain width and depth in the interference direction. Therefore, it is necessary to design an optimized beam pattern to meet the requirements. The key to the design is obtaining the optimal weighting coefficients w . The comprehensive design of the optimized beam pattern includes the control of the beam steering, the constraint of the side-lobes, the constraint of the notch, and the constraint of the weighting coefficients. The optimization of the beam pattern can be expressed as:
m i n w ξ 3 s . t a H ( θ 0 ) w = 1 | a H ( θ j S L ) w | ξ 1 , j S L = 1 , , J S L | a H ( θ j N L ) w | ξ 2 , j N L = 1 , , J N L w 2 ξ 3
where θ 0 denotes the desired direction of the beam, θ j S L denotes the direction of the side-lobe area Θ S L , θ N L denotes the direction of the notch area Θ N L , ξ 1 is the constraint of the side-lobe level, ξ 2 is the constraint of the notch depth, and ξ 3 is the constraint of weighting coefficients. It can be seen in Equation (18) that the optimized beam pattern is designed to ensure a distortionless response in the desired direction with the minimum norm of w . The side-lobe in θ S L and the notch in θ N L are also constrained.
According to Equation (16), the optimization in Equation (18) can be converted into the following form:
m i n y y 1 s . t a H ( θ 0 ) y 4 = 1 y 1 = ξ 3 | a H ( θ S L ) y 4 | y 2 , j S L = 1 , , J S L | a H ( θ N L ) y 4 | y 3 , j N L = 1 , , J N L y 4 y 1
where y 1 = ξ 3 , y 2 = ξ 1 , y 3 = ξ 2 , y 4 = w , and y = [ y 1 , y 2 , y 3 , y 4 T ] T . We define b [ 1 , 0 , , 0 ] T so that y 1 = b T y . The first two equalities can be represented as two zero-cone constraints:
ξ 3 y 1 1 a H ( θ 0 ) y 4 = ξ 3 1 1 0 0 0 T 0 0 0 a H ( θ 0 ) y c 1 A 1 T y { 0 } 2 .
The three inequalities can be expressed as SOC constraints:
y 1 y 4 = 0 0 1 0 0 0 T 0 0 0 I T y c 2 A 2 T y S O C N + 1 .
y 2 a H ( θ j S L ) y 4 = 0 0 0 1 0 0 T 0 0 0 a H ( θ j S L ) y c j S L + 2 A j S L + 2 T y S O C 2 , j S L = 1 , , J S L
y 3 a H ( θ j N L ) y 4 = 0 0 0 0 1 0 T 0 0 0 a H ( θ j N L ) y c j N L + 2 + J S L A j N L + 2 + J S L T y S O C 2 , j N L = 1 , , J N L .
Let
c [ c 1 , c 2 , , c J S L + 2 , , c J N L + J S L + 2 ]
and
A T [ A 1 T , A 2 T , , A J S L + 2 T , , A J N L + J S L + 2 T ]
are defined based on the above equations. The symmetric cone corresponding to the constraints can then be expressed as:
K = { 0 } 2 × S O C N + 1 × × S O C J S L 2 × × S O C J N L 2 .
Usually, the SOCP problem can be efficiently solved by the interior point method [26]. The optimal value of vector y can be easily obtained by the Sedumi convex optimization toolbox [24], which applies the interior point method. Then, y 4 in y is the optimal weighting coefficient of the SOCP beamformer.
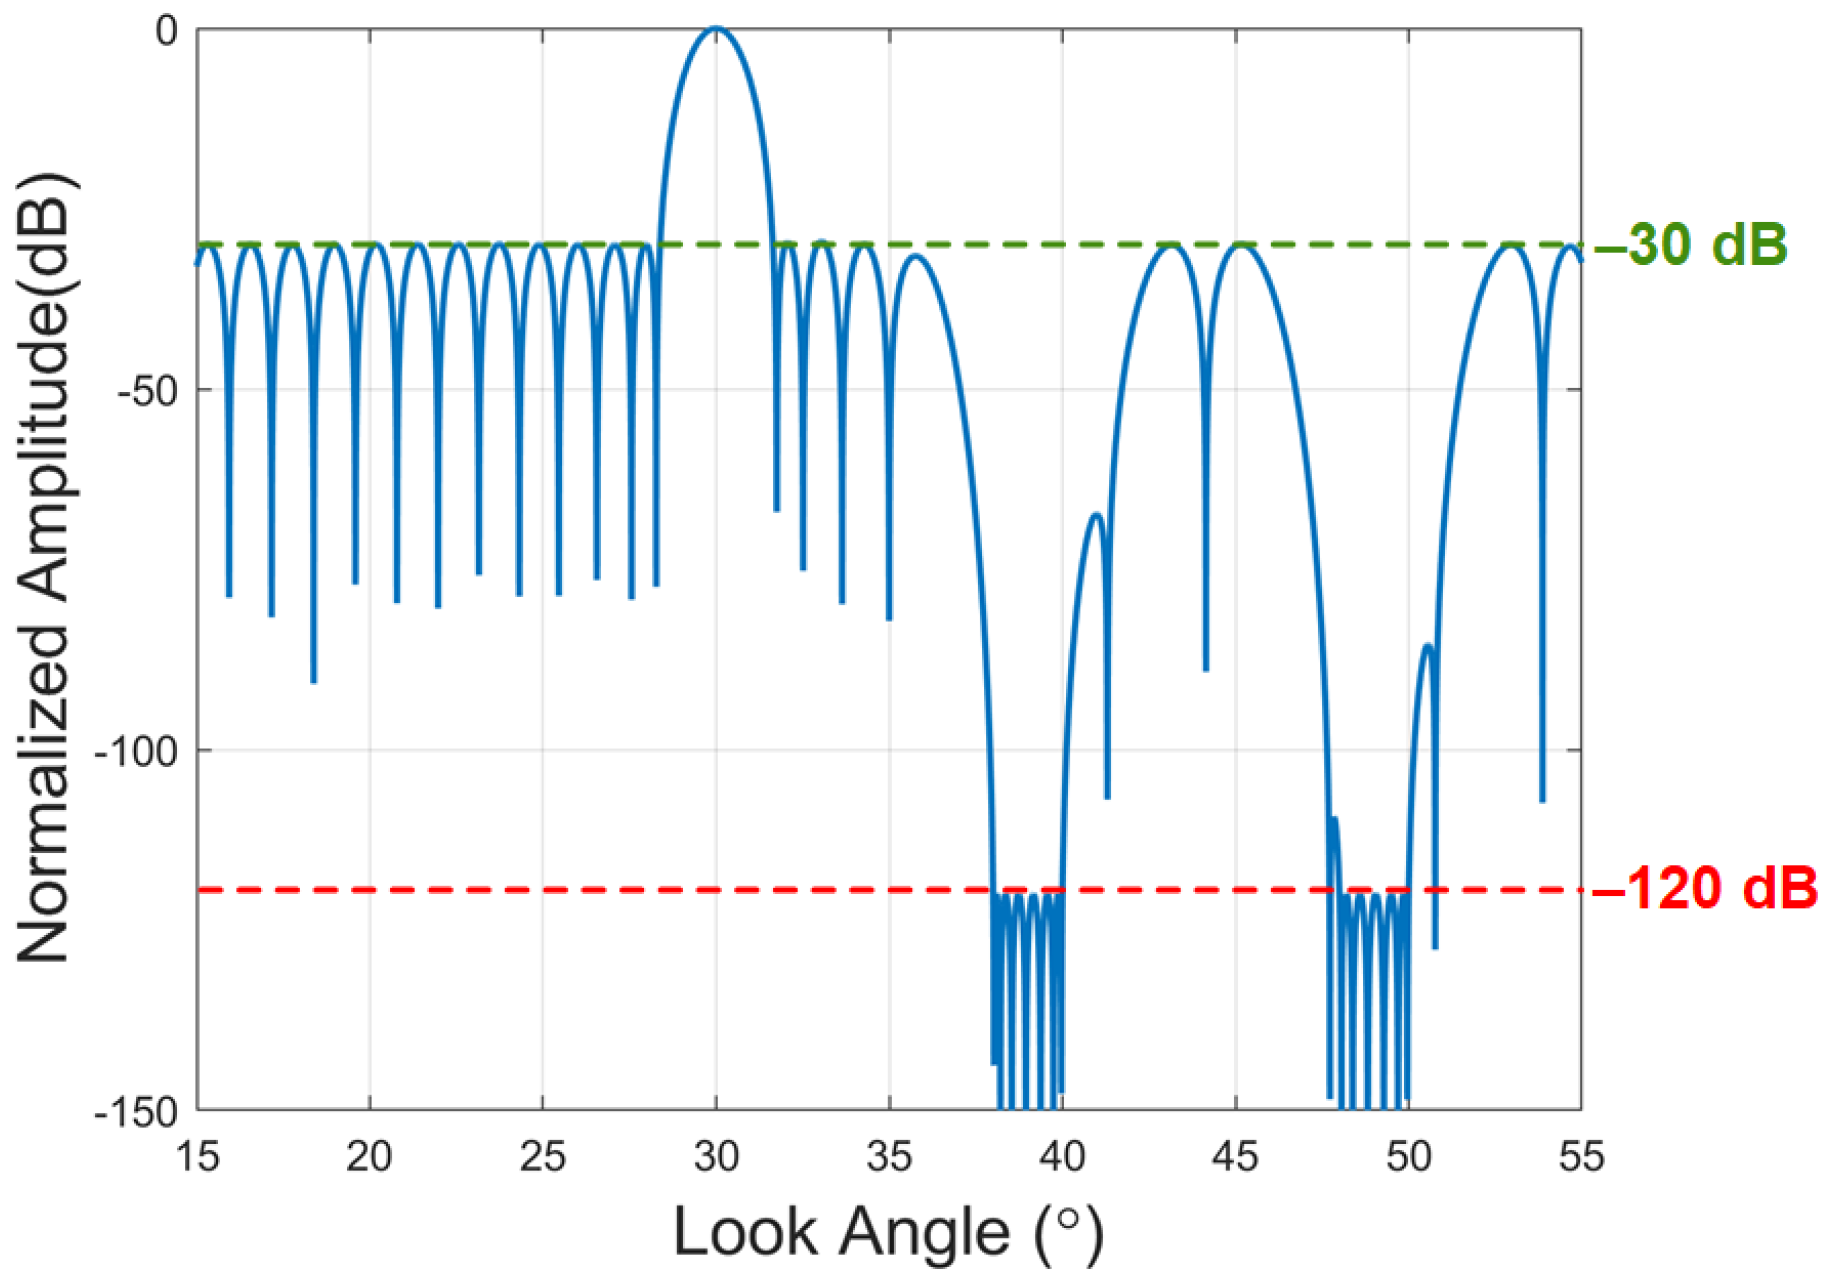
We assume the channels in elevation are N = 40 and the beam steering angle is θ 0 = 30 . The side-lobe area on the beam pattern is Θ S L = [ 60 , 28 . 5 ] [ 31 . 5 , 120 ] , and θ j S L is evenly distributed over the area. The notch area is placed at Θ N L = [ 38 , 40 ] [ 48 , 50 ] , and θ j N L is also chosen with uniform spacing. ξ 1 = 10 3 represents that the side-lobe level is required to be below −30 dB. ξ 2 = 10 12 represents that the notch level will not exceed −120 dB. Figure 8 shows the beam pattern generated by the SOCP beamformer. The beam pattern allows the adjustment of the side-lobe level and has a sizable notch area that combines the width and depth. The beamformer designed based on SOCP theory has a strong adaptive capability and flexibility. Therefore, the SOCP beamformer is well suited for STWE-SAR to cope with the deficiencies of the LCMV beamformer for echo separation.

3. Results

The spaceborne STWE-SAR was simulated to illustrate the advantages of the proposed echo separation scheme. In addition, the energy differences in the signals in different scenarios are shown based on the airborne STWE-SAR data. This is followed by the echo separation results using real data to validate the efficacy of the SOCP beamformer for echo separation.

3.1. Simulation Results

A spaceborne STWE-SAR system with three subswaths is demonstrated to evaluate the performance of the proposed method. The parameters of the simulated DBF-SAR system are given in Table 1. Three beam positions (marked in red) are illustrated in Figure 9a, which represents three subswaths. The timing diagram in Figure 9a shows the restrictions on the receive window due to transmit instances (marked in blue) and nadir echo (marked in green). The PRF and look angle values of the three beam positions are shown in Table 2. The geometric relationships among the target points are shown in Figure 9b. The energy of the target points in subswaths 1 and 2 is 40 and 20 dB higher than that in subswath 3, respectively, which is used to reflect the effect of energy differences in the echo separation results. The echoes of the three subswaths overlap in the time domain. Then, the overlapped echo is separated by the echo separation scheme.
According to the parameters in Table 1 and Table 2, the beam pattern generated by the conventional LCMV beamformer can be obtained, as shown in Figure 10. It can be seen that the width of the notch in the LCMV beam pattern is small, and the depth is shallow. In contrast, the notch in the beam pattern obtained by the SOCP beamformer is wide and deep, as shown in Figure 11. The side-lobes are constrained to below −25 dB. The width of the notch is an angular pulse width [17], and the depth is below −100 dB. The gain level of the notch of the SOCP beamformer is much lower than that of the LCMV beamformer.
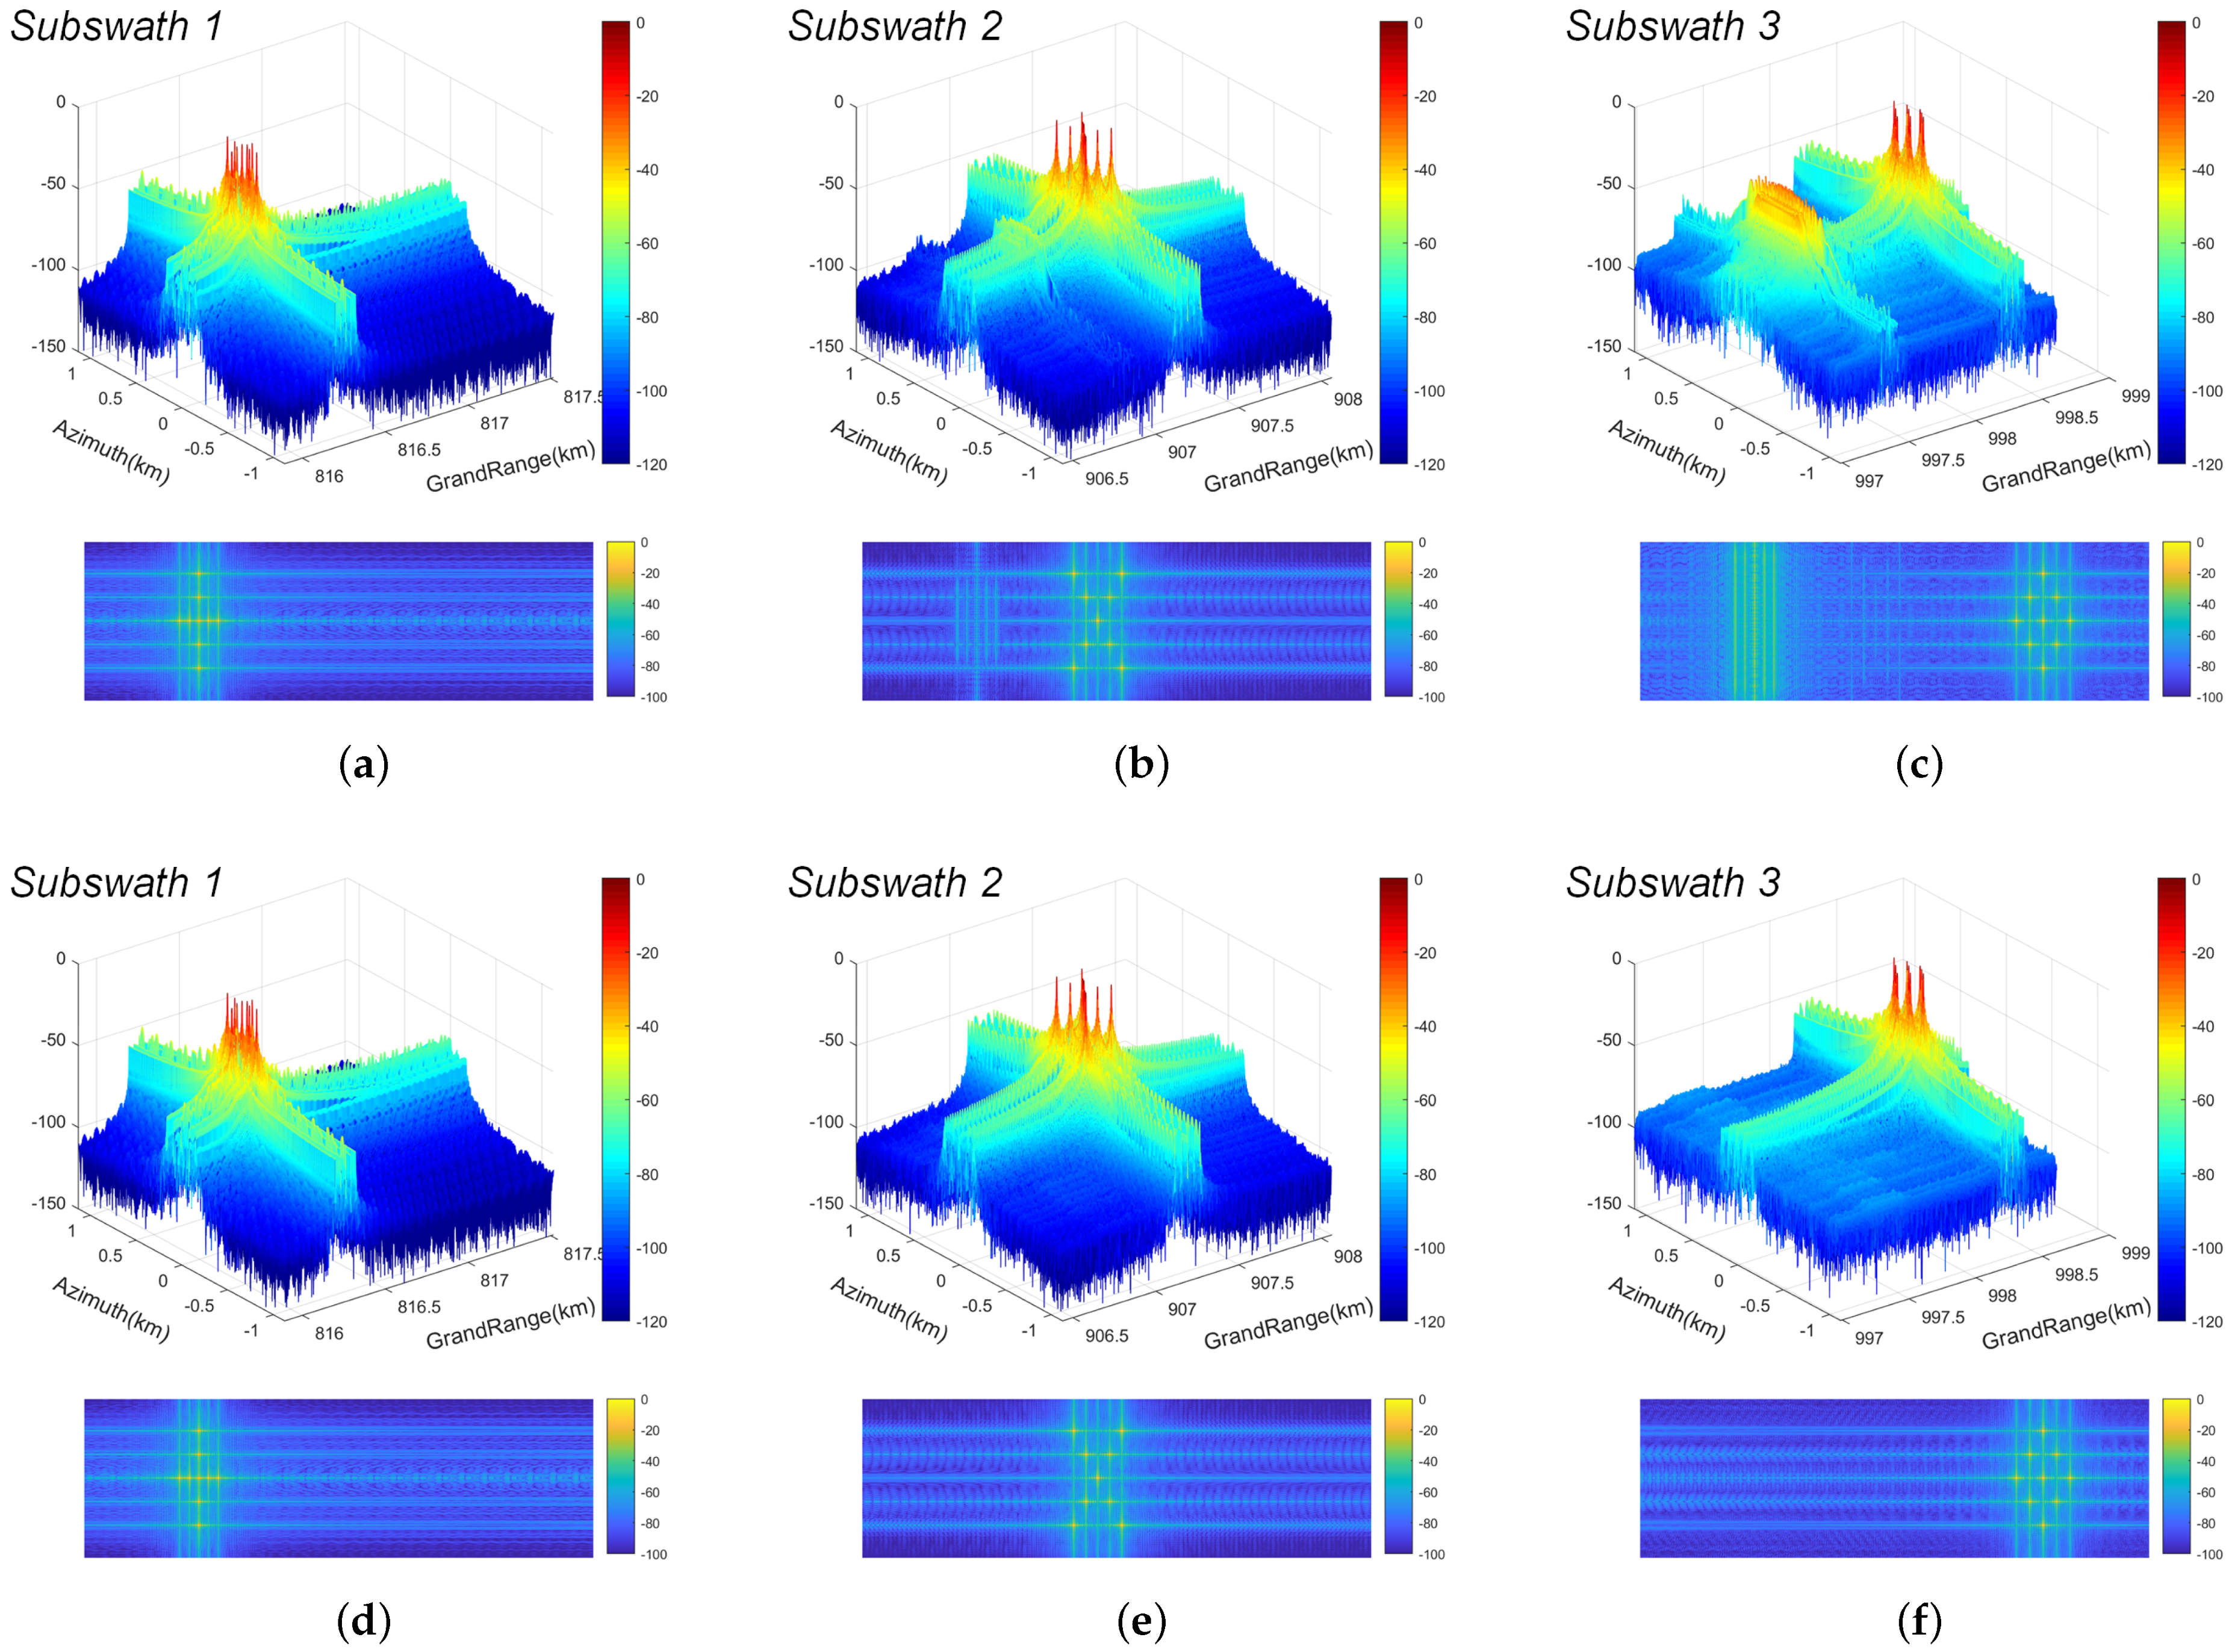
The final 3D and 2D separation results obtained by the LCMV beamformer and the SOCP beamformer are presented in Figure 12. Due to the limited suppression of interference by the LCMV beamformer and the lower signal energy than the interference energy, the interference energy from the other two subswaths produces obvious curved lines along the azimuth in the 2D results and the significant bulges in the 3D results, as shown in Figure 12b,c compared to Figure 12a. The interference in Figure 12a is not obvious because the interference energy levels in the other subswaths are much lower than the desired signals and can be suppressed to below the level of the side-lobes. In sharp contrast, the results obtained from the SOCP beamformer are effective for suppressing interference, as shown in Figure 12d–f. According to the results, it can be seen that the interference energy over −100 dB no longer affects the final imaging results. The 2D and 3D results illustrate the superiority of the proposed method over the conventional separation scheme based on the LCMV beamformer.
To give a numerical comparison, the suppressing degree of the compressed interference energy of the center point is recorded in Table 3. Since the signal energy is highest in subswath 1, both LCMV and SOCP beamformers provide effective suppression of the interference energy from subswaths 2 and 3. Nevertheless, when the signal energy in the interference region is greater than the signal energy in the desired subswath, the suppression degree of the LCMV beamformer is greatly reduced compared to the SOCP beamformer. When the desired subswaths are subswaths 2 and 3, the suppression of the SOCP beamformer in subswath 1 is at least 15.2 and 39.1 dB higher than that of the LCMV beamformer, respectively. The echo separation capability of the SOCP beamformer with a wide and deep notch is significantly superior to that of the LCMV beamformer.

3.2. Experimental Results

In this part, the experiment’s results of the X-band airborne STWE-SAR are presented to verify the effectiveness of the proposed scheme and illustrate the effect of signal energy differences on echo separation. As shown in Figure 13, subbeams 1 and 2 are designed in the range direction, which takes inter-pulse switching to points at 60 and 70 , in turn, corresponding to subswath 1 and subswath 2, respectively. The scenes consisted primarily of ponds, hills, farming, and human-made structures. The detailed system parameters are shown in Table 4. Since it is an airborne SAR, the echoes can reach the antenna within one PRT. The echoes from the two scenes are stored on the recorder in odd and even frame formats. The sampled data from odd and even frames corresponds to the echoes of subswaths 2 and 1, respectively. The echoes of the two subbeams are artificially superimposed in the time domain as the overlapped echoes received by the STWE mode. The data processing flow is shown in Figure 14. In this flow, the error correction method in [28] is applied before the echo overlaps.

3.2.1. Effect of Signal Energy Differences

First, the real data are used to illustrate the effect of energy differences on the separation results. The single-channel imaging results of the two subswaths before echo separation are shown in Figure 15a,b. Figure 16a,b give the energy plots of the single-channel imaging results before overlapping the two subswaths. The scenes in subswath 1 mainly contain farmland and ponds. Except for the ponds, the overall signal energy from subswath 1 is at a high level. In subswath 2, there are a lot of human-made structures that have strong signal energy and show up brighter in the images. The imaging result is dark and the overall signal energy is low since there are fewer strong scattering points in the scene.
Furthermore, Figure 16c reflects the difference in energy between the two subswaths. The majority of subswath 2’s energy is about 80 dB less than that of subswath 1, causing the separation result of subswath 2 to be affected by the energy from subswath 1. Figure 17a,b show the separation results of the LCMV beamformer in the presence of significant energy differences between two sub-beams. The residual interference energy can be observed in the separation results of both subswaths. Subswath 1, with higher overall energy, leaves a larger range of interference energy in the separation results of subswath 2, as shown in Figure 17b. Region A reflects the influences of the human-made structures in subswath 1 on subswath 2. Moreover, the energy of the strong scattering point in subswath 2 also has a clear effect on the separation results of subswath 1, as shown in regions B and C in Figure 17a. The results illustrate that the LCMV beamformer has a limited ability to suppress strong interference signals and cannot effectively separate the echoes from such a significant energy difference.

3.2.2. Comparison of Echo Separation Results

In order to improve the effectiveness of the traditional echo separation scheme based on the LCMV beamformer, we give the results of the echo separation scheme based on the SOCP beamformer, as shown in Figure 18. It should be noted that due to the wide beam of this airborne SAR system and the close distance between the two subswaths, the side-lobes are not constrained. The notch width is 1/10 of the angular pulse width, about 0 . 5 , and the notch depth is below -80 dB. The separation results of the SOCP beamformer in Figure 18 are much improved compared to the results in Figure 17. Specifically, the special regions A, B, and C in the results are selected to reflect the difference in the separation effect of the two schemes.
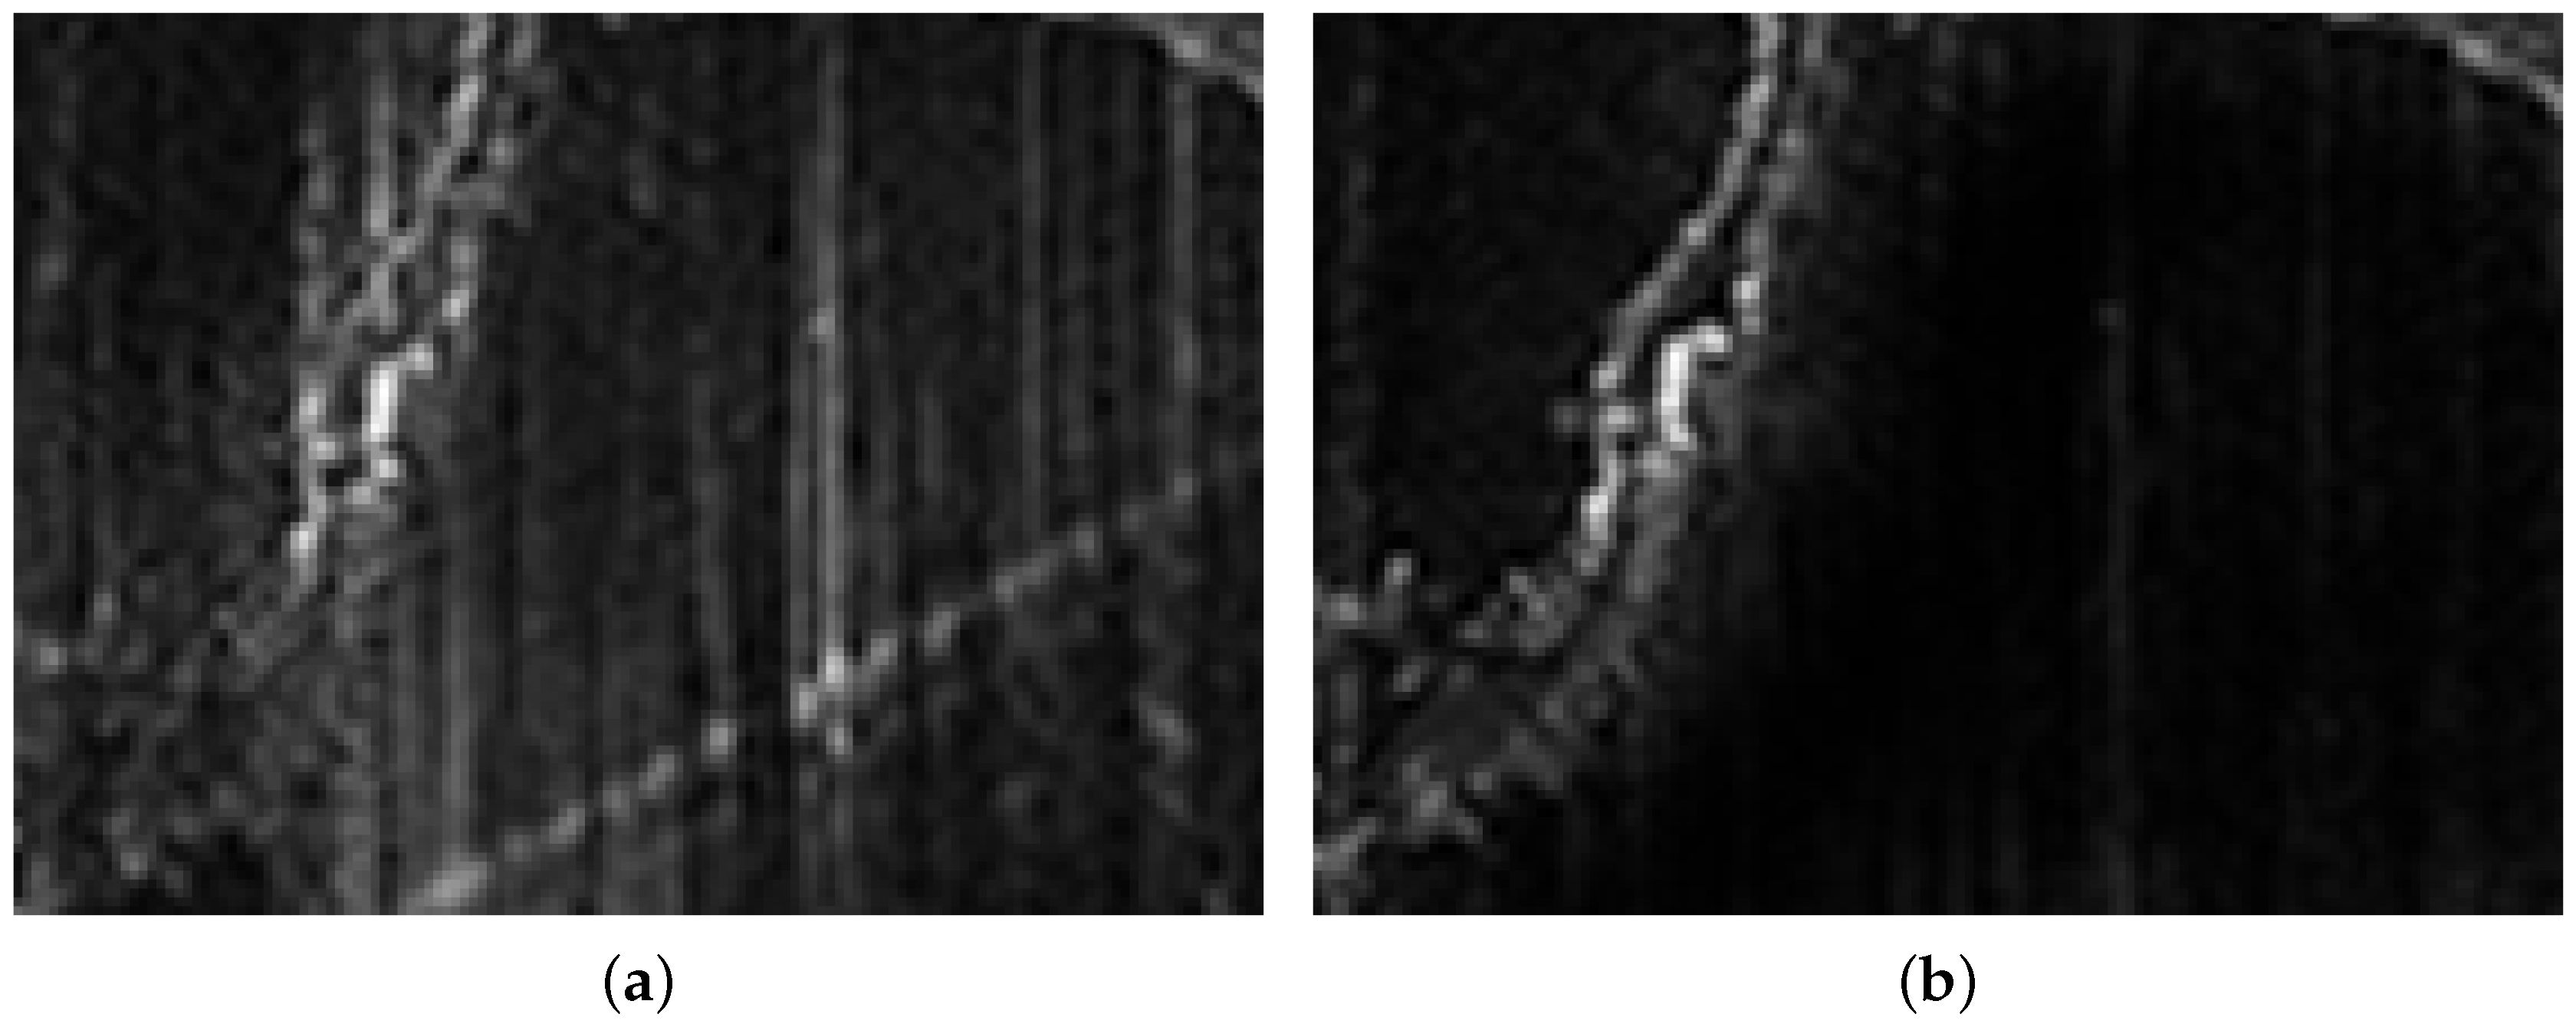
Compared to Figure 17a, the interference from subswath 1 in region A has been significantly decreased, as shown in Figure 18a. Moreover, regions B and C both reflect the residual energy of the strong scattering points in subswath 2 at the weaker scatterers in subswath 1. Figure 19 gives the results of a comparison between the two schemes in region C. The residual energy in Figure 19b has been effectively lowered by the SOCP beamformer, as visible in great detail.
In brief, the results in Figure 18 and Figure 19 illustrate that the echo separation scheme based on the SOCP beamformer can obtain better separation results with its wide and deep notch design to further suppress the interference than the LCMV beamformer. The scheme is promising for future STWE-SAR missions.

4. Discussion

The traditional echo separation scheme based on the LCMV beamformer achieves separation by suppressing the interfering signal in a single direction, which will modulate the envelope of the echo. However, due to the special imaging geometry of SAR, interference signals from equiphasic planes also exist, as shown in Figure 7. The angles of these interferences are different from the angle of the null, which requires a wider width of the notch. In addition, the interfering signal is located in the range ambiguity region, and the energy to be suppressed is actually the sum of the energy of the ambiguous signal and the interfering signal, as shown in Figure 4, which requires a higher demand of the depth of the notch. As shown in Figure 3, the interference suppression capability of the side-lobes of the LCMV beamformer does not exceed −40 dB. When the level of interference energy is much higher than the desired signal, the residual energy will appear in the results after range compression. Both simulation results in Figure 12 and experimental results in Figure 17 confirm the shortcomings of the conventional LCMV beamformer for suppressing interference signals and face the problem of a finite notch width and uncontrollable notch depth.
The scheme proposed in this paper uses the second-order cone programming approach to solve the beam pattern optimization problem with a wide and deep notch. As shown in Figure 8, the beam pattern obtained by the SOCP beamformer has a settable deep notch in a specified angular range, which is designed to suppress interference signals from multiple angles to below a fixed energy level, achieving controlled and effective interference suppression. In addition, the side-lobes can be constrained to achieve improved range ambiguity performance. Compared to the LCMV beamformer, the SOCP beamformer can suppress up to 39 dB of additional interference energy in the simulation results, as shown in Figure 12. In the experimental results shown in Figure 18, the SOCP beamformer also achieves better separation results.
In STWE-SAR, the length of the echo window is constrained by the PRF, which limits the maximum continuous swath width and leads to the appearance of blind regions, as shown in Figure 1 [29]. Benefiting from the development of the variable PRF technique or Staggered-SAR [30,31], the problem of blind regions has been greatly improved. However, the echo separation in Staggered-SAR is still needed. Relying only on the space-domain filtering characteristics of DBF-SCORE to achieve echo separation is insufficient. The proposed scheme can be used to further improve the system performance of future Staggered-SAR systems.
In the dispersed SAR system based on the floating swarm concept [32], the signal is received using a small satellite as a channel at elevation and then synthesized on the ground to reap high-resolution wide-swath imaging. The STWE mode can be adopted to transmit and cover multiple consecutive subswaths based on this dispersed SAR system, which can not only achieve the elimination of blind regions but also reduce the amount of ultra-wide echo data. Therefore, the echo separation scheme proposed in this paper can also provide sufficient support for future dispersed SAR systems in the echo separation to achieve HRWS imaging.

5. Conclusions

In this study, the problem of the energy difference between the interfering signal and the desired signal in STWE-SAR is pointed out for the first time. Based on this analysis, the deficiencies of the traditional echo separation based on the LCMV beamformer in terms of notch depth and width are obtained, which affect the quality of the final separation results. To address the deficiencies of the traditional scheme, an echo separation scheme based on the SOCP beamformer was proposed, which can constrain the depth and width of the notch to improve the separation quality and can also constrain the side-lobes of the beam pattern as needed to improve the system performance. The simulation results validate that the performance of the SOCP beamformer is significantly better than that of the traditional LCMV beamformer. The experimental results also verify the superior performance of the scheme. In the future, there will be more in-depth research on the application of echo separation schemes in HRWS-SAR systems.

Author Contributions

Conceptualization, S.H. and J.Q.; methodology, S.H.; validation, S.H., Q.Z. and W.W.; formal analysis, S.H. and Y.Z.; investigation, Y.D.; resources, Y.D.; data curation, Z.C.; writing—original draft preparation, S.H. All authors have read and agreed to the published version of the manuscript.

Funding

This work was funded by the National Natural Science Foundation of China under grant numbers 61971401 and in part by the Youth Innovation Promotion Association, Chinese Academy of Sciences (CAS).

Data Availability Statement

Not applicable.

Conflicts of Interest

The authors declare no conflict of interest.

References

  1. Wollstadt, S.; Lopez-Dekker, P.; De Zan, F.; Younis, M. Design principles and considerations for spaceborne ATI SAR-based observations of ocean surface velocity vectors. IEEE Trans. Geosci. Remote Sens. 2017, 55, 4500–4519. [Google Scholar] [CrossRef]
  2. De Almeida, F.Q.; Younis, M.; Krieger, G.; Moreira, A. Multichannel staggered SAR azimuth processing. IEEE Trans. Geosci. Remote Sens. 2018, 56, 2772–2788. [Google Scholar] [CrossRef]
  3. Baumgartner, S.V.; Krieger, G. Simultaneous high-resolution wide-swath SAR imaging and ground moving target indication: Processing approaches and system concepts. IEEE J. Sel. Top. Appl. Earth Obs. Remote Sens. 2015, 8, 5015–5029. [Google Scholar] [CrossRef]
  4. Wen, Y.; Zhang, Z.; Chen, Z.; Qiu, J.; Ren, M.; Meng, X. A Novel Time-Domain Frequency Diverse Array HRWS Imaging Scheme for Spotlight SAR. Remote Sens. 2022, 14, 1085. [Google Scholar] [CrossRef]
  5. Freeman, A.; Johnson, W.T.; Huneycutt, B.e.a.; Jordan, R.; Hensley, S.; Siqueira, P.; Curlander, J. The “Myth” of the minimum SAR antenna area constraint. IEEE Trans. Geosci. Remote Sens. 2000, 38, 320–324. [Google Scholar] [CrossRef]
  6. Krieger, G.; Gebert, N.; Moreira, A. Unambiguous SAR signal reconstruction from nonuniform displaced phase center sampling. IEEE Geosci. Remote Sens. Lett. 2004, 1, 260–264. [Google Scholar] [CrossRef]
  7. Gebert, N.; Krieger, G.; Moreira, A. Digital beamforming on receive: Techniques and optimization strategies for high-resolution wide-swath SAR imaging. IEEE Trans. Aerosp. Electron. Syst. 2009, 45, 564–592. [Google Scholar] [CrossRef]
  8. Werninghaus, R.; Buckreuss, S. The TerraSAR-X mission and system design. IEEE Trans. Geosci. Remote Sens. 2009, 48, 606–614. [Google Scholar] [CrossRef]
  9. Davidson, M.W.; Furnell, R. ROSE-L: Copernicus l-band SAR mission. In Proceedings of the 2021 IEEE International Geoscience and Remote Sensing Symposium IGARSS, Brussels, Belgium, 11–16 July 2021; pp. 872–873. [Google Scholar]
  10. Geudtner, D.; Tossaint, M.; Davidson, M.; Torres, R. Copernicus Sentinel-1 Next Generation Mission. In Proceedings of the 2021 IEEE International Geoscience and Remote Sensing Symposium IGARSS, Brussels, Belgium, 11–16 July 2021; pp. 874–876. [Google Scholar]
  11. Motohka, T.; Kankaku, Y.; Miura, S.; Suzuki, S. ALOS-4 L-band SAR observation concept and development status. In Proceedings of the IGARSS 2020–2020 IEEE International Geoscience and Remote Sensing Symposium, Waikoloa, HI, USA, 26 September–2 October 2020; pp. 3792–3794. [Google Scholar]
  12. Huber, S.; de Almeida, F.Q.; Villano, M.; Younis, M.; Krieger, G.; Moreira, A. Tandem-L: A technical perspective on future spaceborne SAR sensors for Earth observation. IEEE Trans. Geosci. Remote Sens. 2018, 56, 4792–4807. [Google Scholar] [CrossRef]
  13. Pinheiro, M.; Prats, P.; Villano, M.; Rodriguez-Cassola, M.; Rosen, P.A.; Hawkins, B.; Agram, P. Processing and performance analysis of NASA-ISRO SAR (NISAR) staggered data. In Proceedings of the IGARSS 2019–2019 IEEE International Geoscience and Remote Sensing Symposium, Yokohama, Japan, 28 July–2 August 2019; pp. 8374–8377. [Google Scholar]
  14. Bordoni, F.; López-Dekker, P.; Krieger, G. Beam-Switch Wide-Swath Mode for Interferometrically Compatible Single-Pol and Quad-Pol SAR Products. IEEE Geosci. Remote Sens. Lett. 2018, 15, 1565–1569. [Google Scholar] [CrossRef]
  15. Krieger, G.; Gebert, N.; Moreira, A. Multidimensional waveform encoding: A new digital beamforming technique for synthetic aperture radar remote sensing. IEEE Trans. Geosci. Remote Sens. 2007, 46, 31–46. [Google Scholar] [CrossRef]
  16. Feng, F.; Li, S.; Yu, W.; Huang, P.; Xu, W. Echo separation in multidimensional waveform encoding SAR remote sensing using an advanced null-steering beamformer. IEEE Trans. Geosci. Remote Sens. 2012, 50, 4157–4172. [Google Scholar] [CrossRef]
  17. Zhao, Q.; Zhang, Y.; Wang, W.; Deng, Y.; Yu, W.; Zhou, Y.; Wang, R. Echo separation for space-time waveform-encoding SAR with digital scalloped beamforming and adaptive multiple null-steering. IEEE Geosci. Remote Sens. Lett. 2020, 18, 92–96. [Google Scholar] [CrossRef]
  18. Kim, J.H.; Younis, M.; Moreira, A.; Wiesbeck, W. A novel OFDM chirp waveform scheme for use of multiple transmitters in SAR. IEEE Geosci. Remote Sens. Lett. 2012, 10, 568–572. [Google Scholar] [CrossRef]
  19. Krieger, G. MIMO-SAR: Opportunities and pitfalls. IEEE Trans. Geosci. Remote Sens. 2013, 52, 2628–2645. [Google Scholar] [CrossRef]
  20. Jin, G.; Deng, Y.; Wang, W.; Wang, R.; Zhang, Y.; Long, Y. Segmented phase code waveforms: A novel radar waveform for spaceborne MIMO-SAR. IEEE Trans. Geosci. Remote Sens. 2020, 59, 5764–5779. [Google Scholar] [CrossRef]
  21. Rommel, T.; Rincon, R.; Younis, M.; Krieger, G.; Moreira, A. Implementation of a MIMO SAR Imaging Mode for NASA’s Next Generation Airborne L-Band SAR. In Proceedings of the EUSAR 2018; 12th European Conference on Synthetic Aperture Radar, Aachen, Germany, 4–7 June 2018; pp. 1–5. [Google Scholar]
  22. Trees, H. Optimum Array Processing: Detection, Estimation, and Modulation Theory, Ser. Detection, Estimation, and Modulation Theory; Wiley-Interscience: Hoboken, NJ, USA, 2004. [Google Scholar]
  23. Liu, J.; Gershman, A.B.; Luo, Z.Q.; Wong, K.M. Adaptive beamforming with sidelobe control: A second-order cone programming approach. IEEE Signal Process. Lett. 2003, 10, 331–334. [Google Scholar]
  24. Sturm, J.F. Using SeDuMi 1.02, a MATLAB toolbox for optimization over symmetric cones. Optim. Methods Softw. 1999, 11, 625–653. [Google Scholar] [CrossRef]
  25. Cumming, I.G.; Wong, F.H. Digital processing of synthetic aperture radar data. Artech House 2005, 1, 108–110. [Google Scholar]
  26. Lobo, M.S.; Vandenberghe, L.; Boyd, S.; Lebret, H. Applications of second-order cone programming. Linear Algebra Appl. 1998, 284, 193–228. [Google Scholar] [CrossRef]
  27. Lorenz, R.G.; Boyd, S.P. Robust minimum variance beamforming. IEEE Trans. Signal Process. 2005, 53, 1684–1696. [Google Scholar] [CrossRef]
  28. Zhou, Y.; Wang, W.; Chen, Z.; Wang, P.; Zhang, H.; Qiu, J.; Zhao, Q.; Deng, Y.; Zhang, Z.; Yu, W.; et al. Digital beamforming synthetic aperture radar (DBSAR): Experiments and performance analysis in support of 16-channel airborne X-band SAR data. IEEE Trans. Geosci. Remote Sens. 2020, 59, 6784–6798. [Google Scholar] [CrossRef]
  29. Yang, T.; Lv, X.; Wang, Y.; Qian, J. Study on a novel multiple elevation beam technique for HRWS SAR system. IEEE J. Sel. Top. Appl. Earth Obs. Remote Sens. 2015, 8, 5030–5039. [Google Scholar] [CrossRef]
  30. Krieger, G.; Younis, M.; Huber, S.; Bordoni, F.; Patyuchenko, A.; Kim, J.; Laskowski, P.; Villano, M.; Rommel, T.; Lopez-Dekker, P.; et al. Digital beamforming and MIMO SAR: Review and new concepts. In Proceedings of the EUSAR 2012; 9th European Conference on Synthetic Aperture Radar, Nuremberg, Germany, 23–26 April 2012; pp. 11–14. [Google Scholar]
  31. Villano, M.; Krieger, G.; Moreira, A. Staggered SAR: High-resolution wide-swath imaging by continuous PRI variation. IEEE Trans. Geosci. Remote Sens. 2013, 52, 4462–4479. [Google Scholar] [CrossRef]
  32. Mittermayer, J.; Krieger, G. Floating swarm concept for passive Bi-static SAR satellites. In Proceedings of the EUSAR 2018; 12th European Conference on Synthetic Aperture Radar, Aachen, Germany, 4–7 June 2018; pp. 1–6. [Google Scholar]
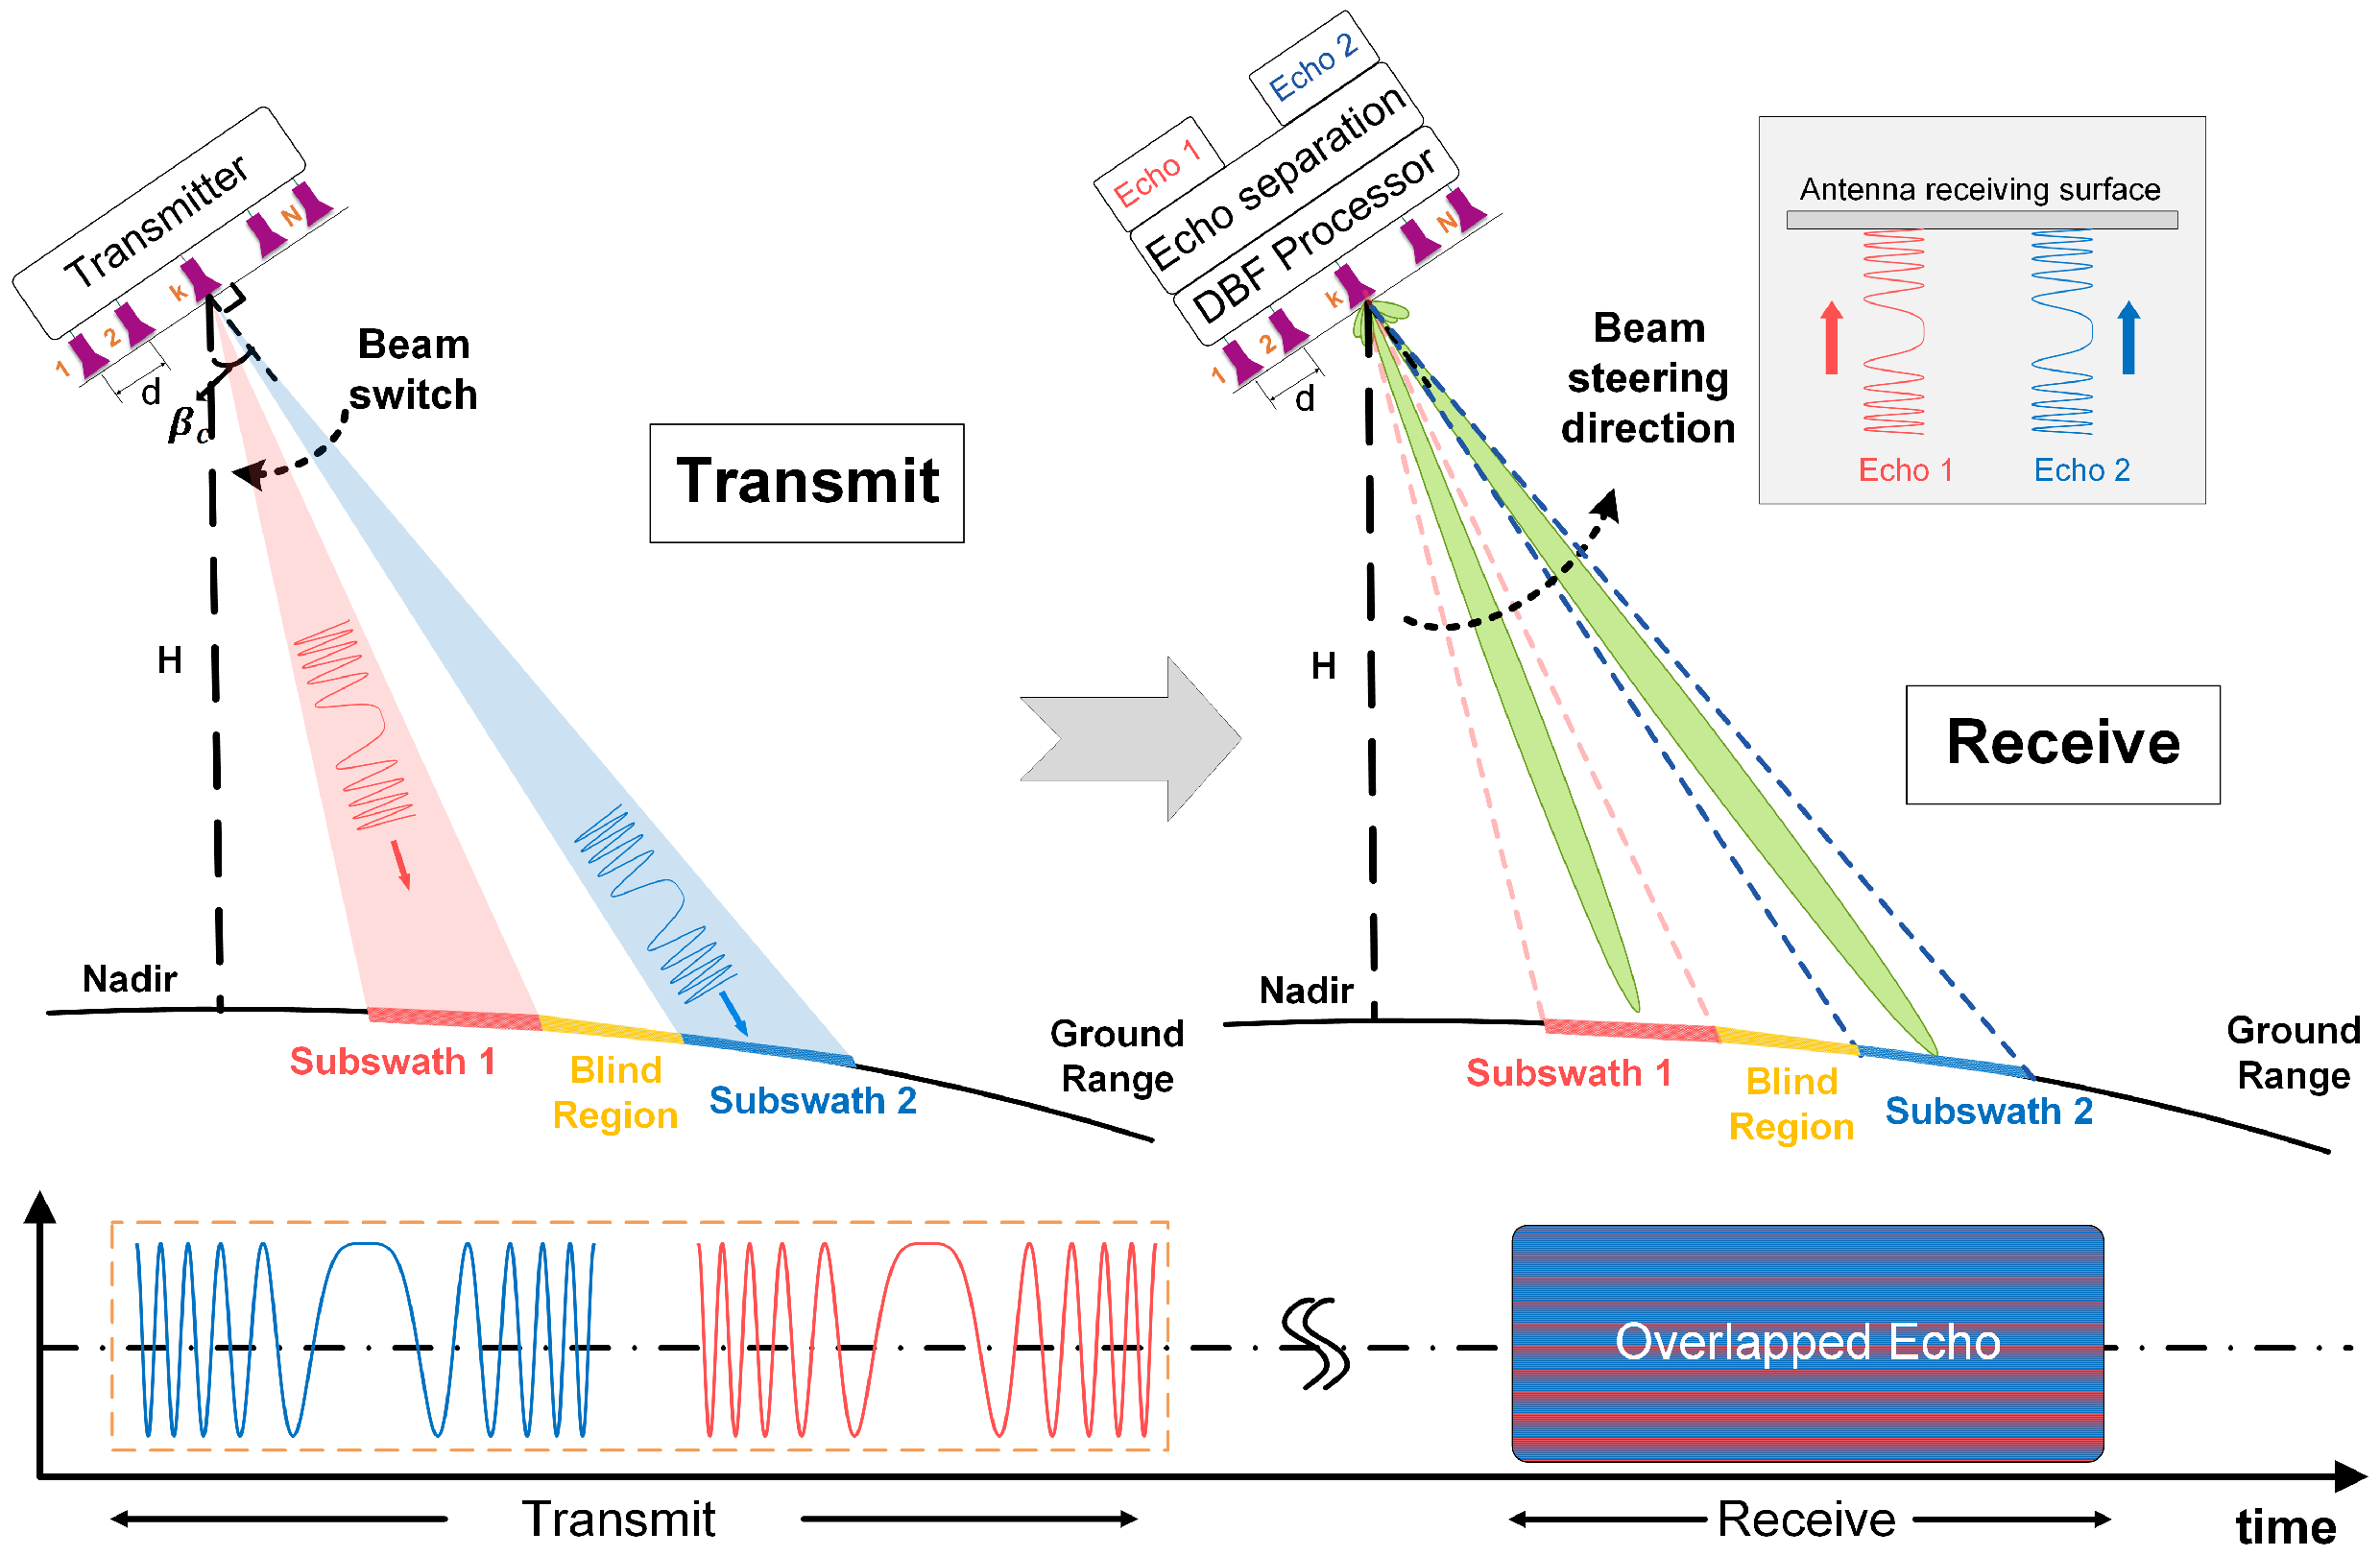
Figure 1. The principle diagram of the typical STWE-SAR system with two subswaths.
Remotesensing 14 05888 g001
Figure 2. The SAR images with different scattering scenes. (a) Buildings. (b) Water surfaces.
Remotesensing 14 05888 g002
Figure 3. The single–null beam pattern based on the LCMV beamformer.
Remotesensing 14 05888 g003
Figure 4. Diagram of the superposition of the interference signal and ambiguity signal range.
Remotesensing 14 05888 g004
Figure 5. The beam pattern generated by the LCMV beamformer. (a) The null placed at the notch of the beam pattern generated by SCORE. (b) The null placed at the side-lobe of the beam pattern generated by SCORE.
Remotesensing 14 05888 g005
Figure 6. Diagram of the suppression of interference energy with a wide notch.
Remotesensing 14 05888 g006
Figure 7. Diagram of the interference signals from the equiphasic plane.
Remotesensing 14 05888 g007
Figure 8. The beam pattern with wide and deep notches based on the SOCP beamformer.
Remotesensing 14 05888 g008
Figure 9. (a) The imaging diagram of the simulated system. (b) The imaging scenario for three subswaths.
Remotesensing 14 05888 g009
Figure 10. The beam pattern generated by the conventional LCMV beamformer. (ac) The beam pattern for subswath 1–3.
Remotesensing 14 05888 g010
Figure 11. The beam pattern generated by the proposed SOCP beamformer. (ac) The beam pattern for subswath 1–3.
Remotesensing 14 05888 g011
Figure 12. The final 3D and 2D separation results. (ac) The final 3D and 2D separation results obtained by the LCMV beamformer. (df) The final 3D and 2D separation results obtained by the SOCP beamformer.
Remotesensing 14 05888 g012
Figure 13. Real scheme.
Remotesensing 14 05888 g013
Figure 14. The data processing flow of the real data.
Remotesensing 14 05888 g014
Figure 15. The single-channel imaging results before echo separation. (a) Subswath 1. (b) Subswath 2.
Remotesensing 14 05888 g015
Figure 16. The single-channel energy. (a) Subswath 1. (b) Subswath 2. (c) Energy difference (subswath 2 − subswath 1).
Remotesensing 14 05888 g016
Figure 17. The echo separation results of the LCMV beamformer. Region A reflects the separation results of human-made structures and roads. Region B and C compare the effect of the separation of water and human-made structures. (a) Subswath 1. (b) Subswath 2.
Remotesensing 14 05888 g017
Figure 18. The echo separation results of the SOCP beamformer. (a) Subswath 1. (b) Subswath 2.
Remotesensing 14 05888 g018
Figure 19. (a) Special region C selected by the red rectangles in Figure 17a. (b) Special region C selected by the red rectangles in Figure 18a.
Remotesensing 14 05888 g019
Table 1. System Parameters of the Simulated STWE-SAR System.
ParameterValue
Orbit height (km)700
Platform velocity (m/s)7474
Carrier frequency (GHz)9.6
Signal bandwidth (MHz)100
Pulse duration ( μ s)10
Oversampling rate1.2
Antenna height (m)1.6
Antenna length (m)9.6
Numbers of channels40
PRF (Hz)1550
Look angle of antenna normal direction ( )30
Table 2. Information about Beam Positions.
IndexPRF (Hz)Look Angle ( )
11550[28.97, 32.92]
21550[37.35, 39.91]
31550[42.97, 44.82]
Table 3. Compressed Energy at the Angle of the Interference Signal for the Center Point.
BeamformerDesiredInterference Subswath
Subswath123
LCMV1\−55.36 dB−59.70 dB
2−47.72 dB\−66.33 dB
3−23.33 dB−54.10 dB\
SOCP1\−55.36 dB−59.70 dB
2−62.96 dB\−66.37 dB
3−62.45 dB−58.03 dB\
Table 4. Parameters of the Airborne STWE-SAR System.
ParameterValue
Height (m)4200
Platform velocity (m/s)80
Carrier frequency (GHz)9.6
Signal bandwidth (MHz)500
Pulse duration ( μ s)10
Oversampling rate1.2
Antenna height (m)0.32
Antenna length (m)0.496
Numbers of channels16
PRF (Hz)1500
Look angle of antenna normal direction ( )65
Publisher’s Note: MDPI stays neutral with regard to jurisdictional claims in published maps and institutional affiliations.