
A Novel Estimation Method of Water Surface Micro-Amplitude Wave Frequency for Cross-Media Communication
 ,
,
Abstract
1. Introduction
2. Underwater Sound Source Excitation and Detection Principle
2.1. Underwater Sound Source Excitation Model
2.2. Detection Principle
3. Proposed Algorithm
3.1. Algorithm Theory
3.2. Implementation Steps
3.2.1. Hilbert Transform
3.2.2. Detection of the Number of WSAW
| Algorithm 1: Improved RELAX to estimate the WSAW parameter. |
INPUT: the demodulated WSAW signals;
|
4. Simulation and Experiment
4.1. Simulation Results
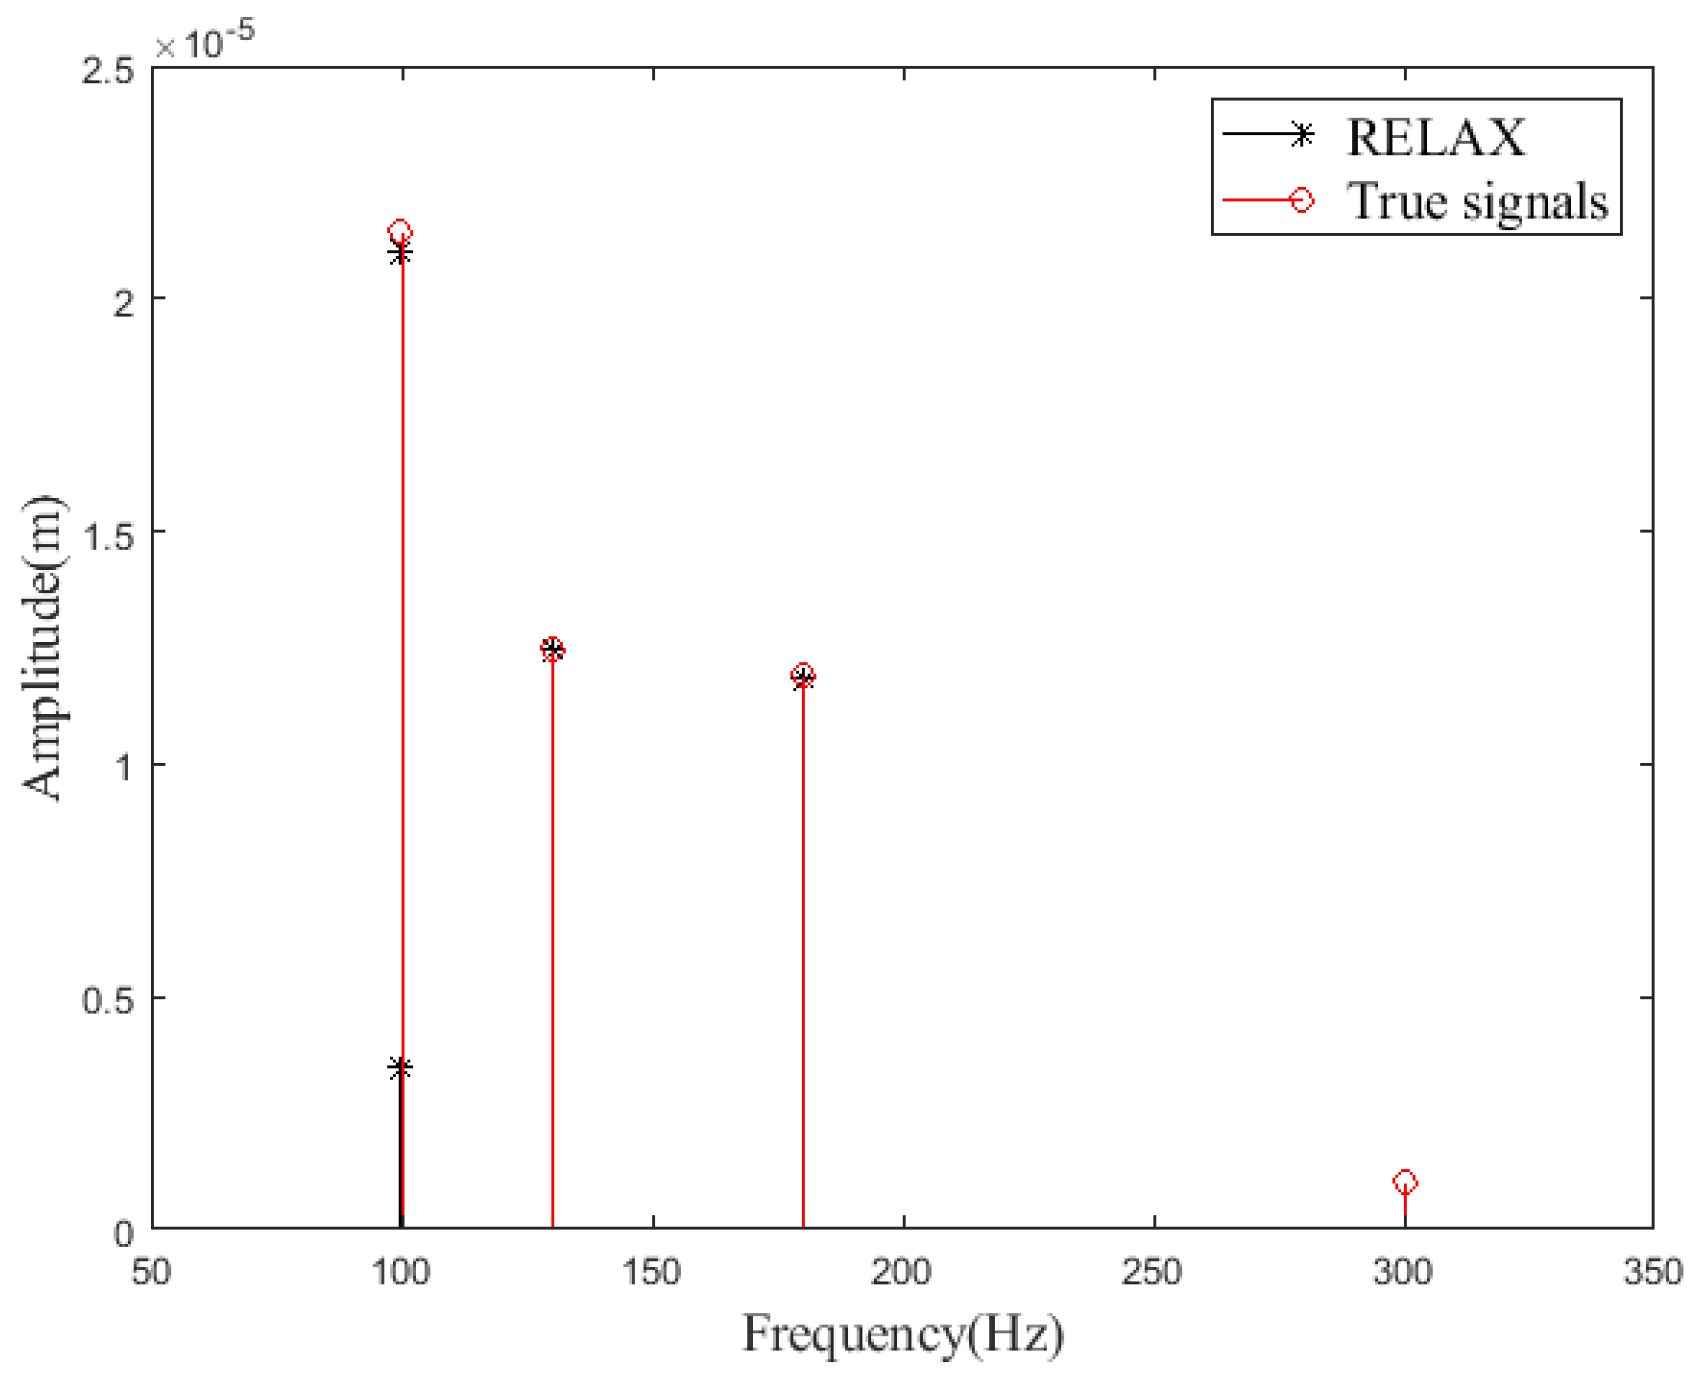
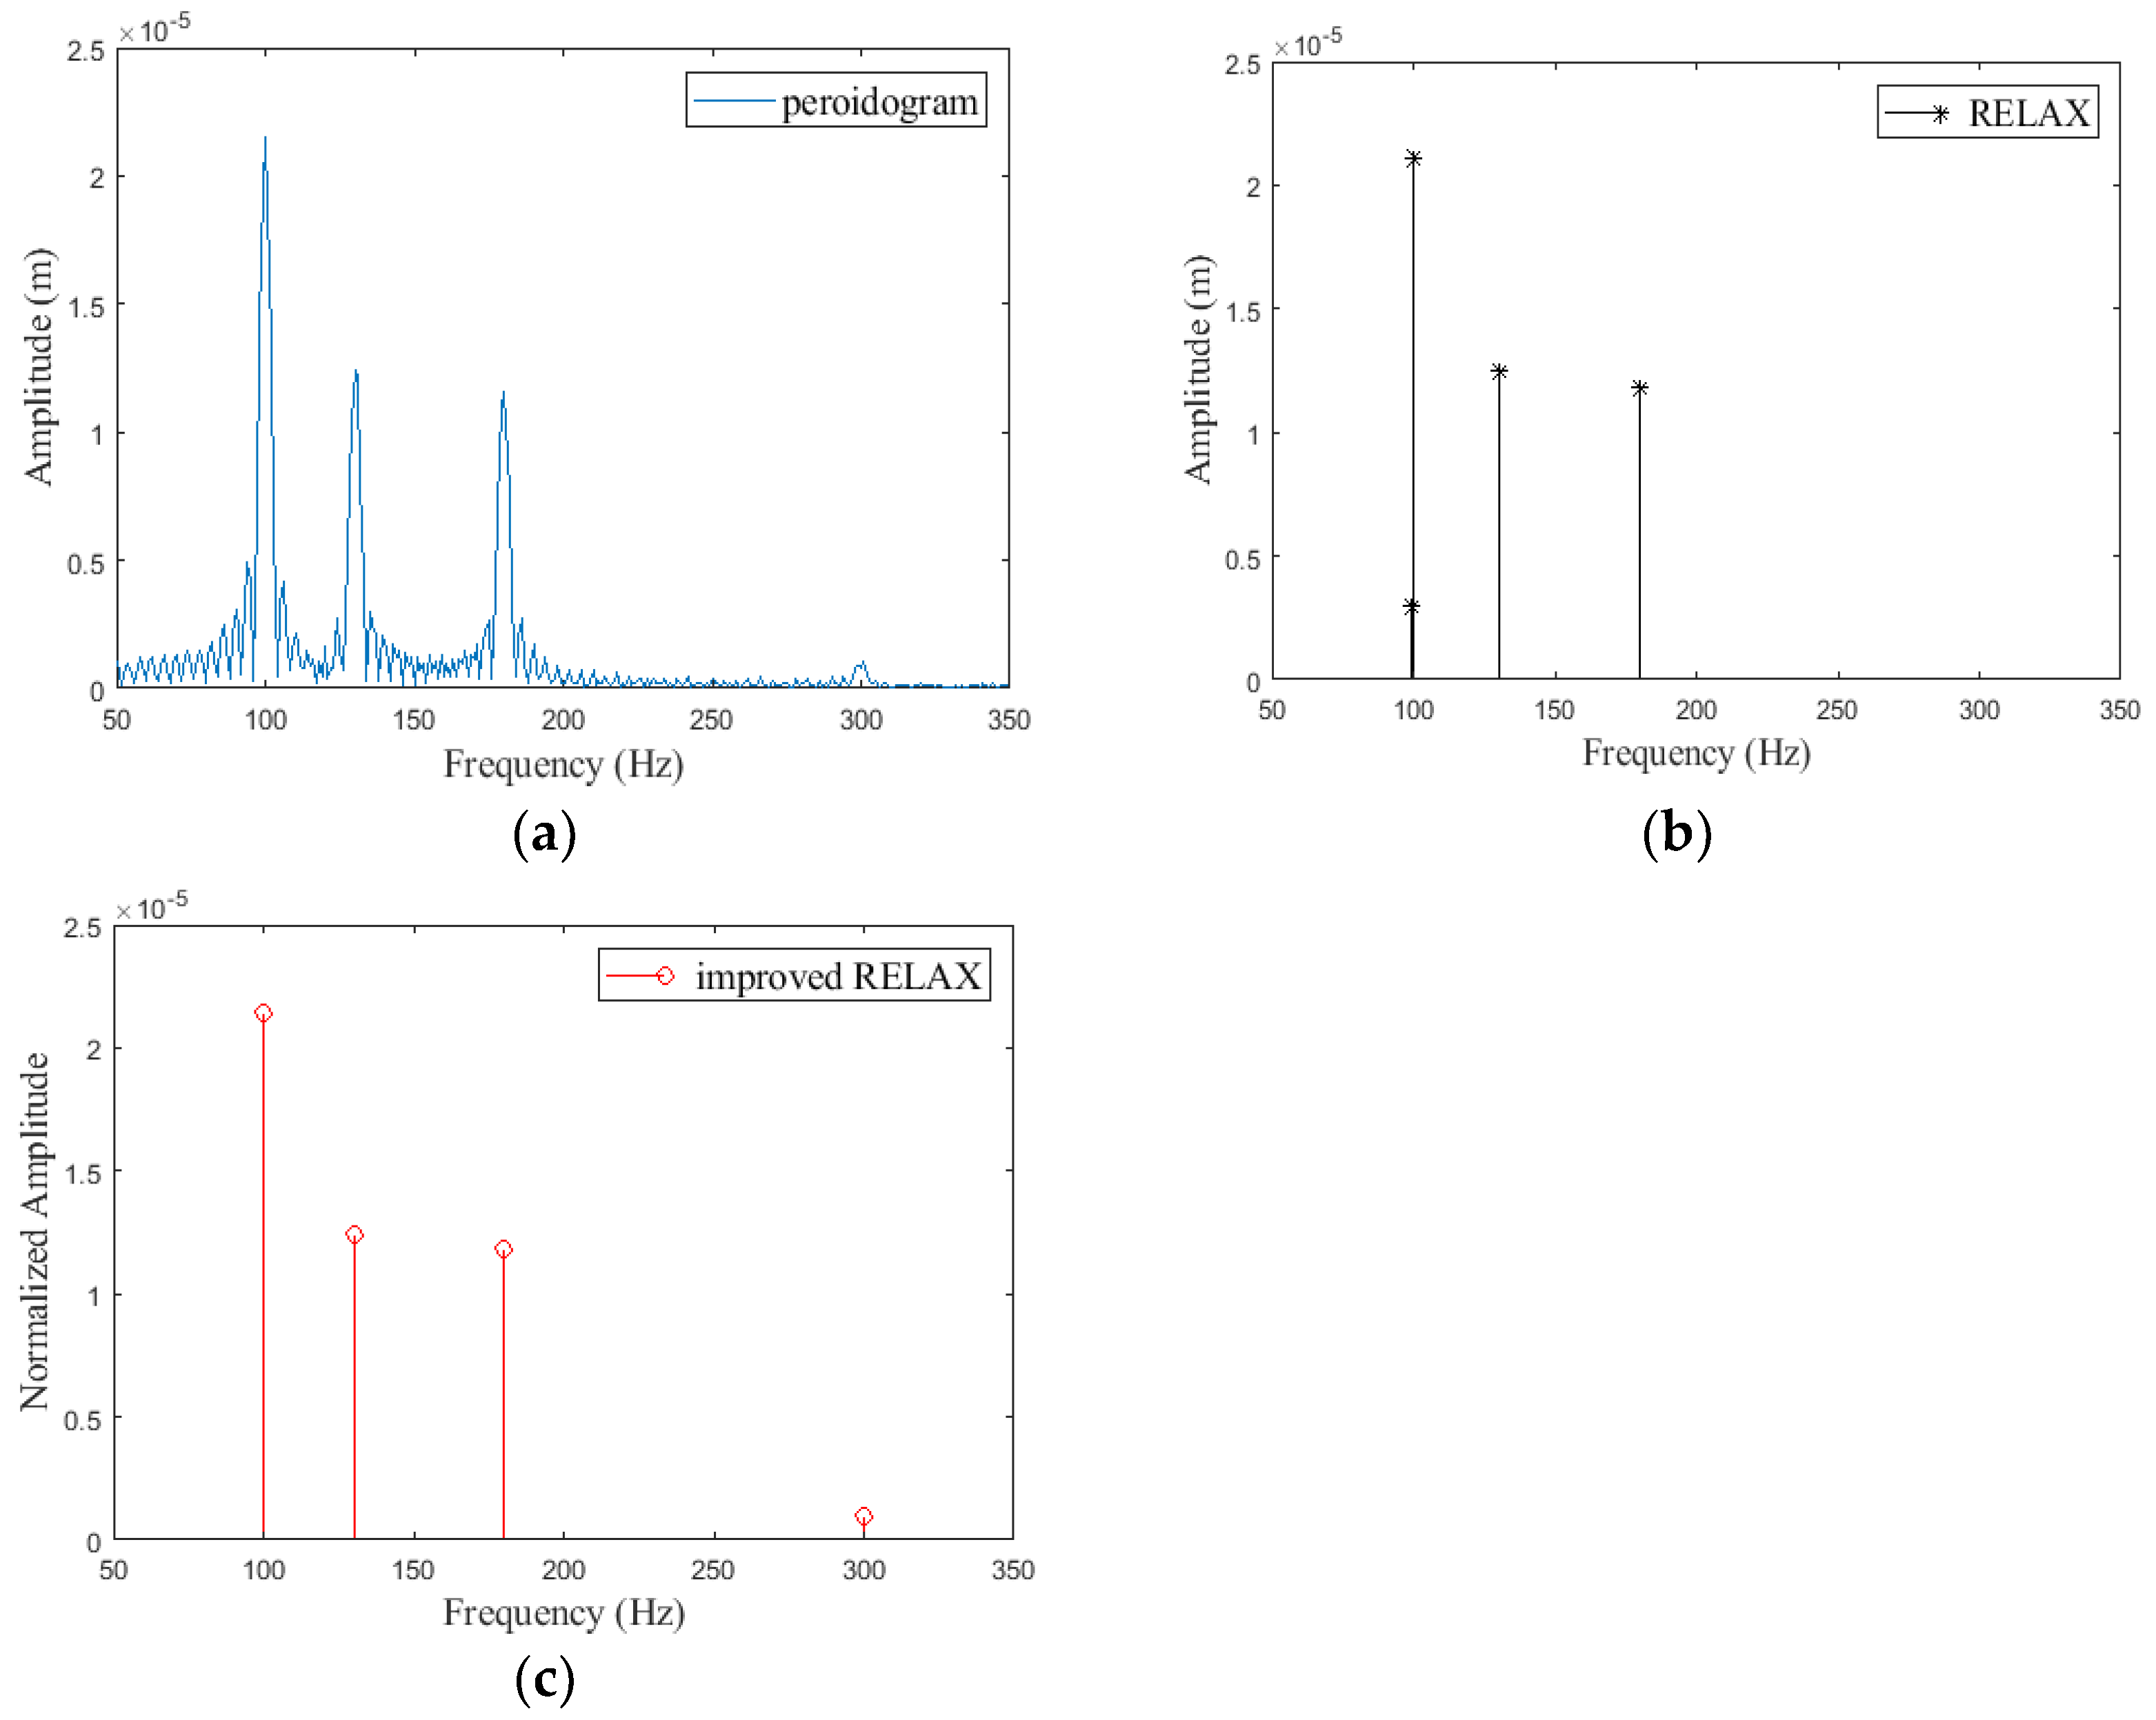
4.1.1. Example One
4.1.2. Example Two
4.2. Experiment and Results
4.2.1. Example One
4.2.2. Example Two
5. Discussion
6. Conclusions
Author Contributions
Funding
Data Availability Statement
Acknowledgments
Conflicts of Interest
Abbreviations
| WSAW | The Water Surface Micro-Amplitude Wave |
| FMCW | Frequency Modulated Continuous Wave |
| AEIC | Acoustic and Electromagnetic Integrated Communication Technology |
| TARF | Translational Acoustic-RF Communication |
| SNR | Signal to Noise Ratio |
| GIP | Generalized Inner Product |
| PRF | Pulse Repetition Frequency |
References
- Lama, G.F.C.; Errico, A.; Pasquino, V.; Mirzaei, S.; Preti, F.; Chirico, G.B. Velocity uncertainty quantification based on Riparian vegetation indices in open channels colonized by Phragmites australis. J. Ecohydraulics 2022, 7, 71–76. [Google Scholar] [CrossRef]
- Tur, R.; Yontem, S. A comparison of soft computing methods for the prediction of wave height parameters. Knowl.-Based Eng. Sci. 2021, 2, 31–64. [Google Scholar] [CrossRef]
- Bartholomä, A. Acoustic bottom detection and seabed classification in the German Bight, southern North Sea. Geo-Mar. Lett. 2006, 26, 177–184. [Google Scholar] [CrossRef]
- Yuan, F.; Huang, Y.; Chen, X.; Cheng, E. A biological sensor system using computer vision for water quality monitoring. IEEE Access 2018, 6, 61535–61546. [Google Scholar] [CrossRef]
- Dietz, A.J.; Klein, I.; Gessner, U.; Frey, C.M.; Kuenzer, C.; Dech, S. Detection of water bodies from AVHRR data—A TIMELINE thematic processor. Remote Sens. 2017, 9, 57. [Google Scholar] [CrossRef]
- Khan, M.A.; Sharma, N.; Lama, G.F.; Hasan, M.; Garg, R.; Busico, G.; Alharbi, R. Three-dimensional hole size (3DHS) approach for water flow turbulence analysis over emerging sand bars: Flume-scale experiments. Water 2022, 14, 1889. [Google Scholar] [CrossRef]
- Jarry, J. SAR, NAUTILE, SAGA, ELIT—Four new vehicles for underwater work and exploration: The IFREMER approach. IEEE J. Ocean. Eng. 1986, 3, 413–417. [Google Scholar] [CrossRef]
- McKnight, S.W.; Dimarzio, C.A.; Li, W.; Hogenboom, D.O.; Sauermann, G.O. Laser-induced acoustic detection of buried objects. In Detection and Remediation Technologies for Mines and Minelike Targets III, Proceedings of the Aerospace/Defense Sensing and Controls, Orlando, FL, USA, 13–17 April 1998; SPIE: Boston, MA, USA, 1998; Volume 3392, pp. 841–847. [Google Scholar]
- Beverini, N.; Firpi, S.; Guerrini, P.; Maccioni, E.; Maguer, A.; Morganti, M.; Stefani, F.; Trono, C. Fiber laser hydrophone for underwater acoustic surveillance and marine mammals monitoring. In Proceedings of the SPIE—International Conference on Lasers, Applications, and Technologies, Kazan, Russian Federation, 23–27 August 2010; Volume 7994, pp. 285–291. [Google Scholar] [CrossRef]
- Thomas, G.L.; Hahn, T.; Thorne, R. Combining passive and active underwater acousitics with video and laser optics to assess fish stocks. In Proceedings of the OCEANS 2006, Boston, MA, USA, 18–21 September 2006. [Google Scholar] [CrossRef]
- Williamson, B.J.; Blondel, P.; Armstrong, E.; Bell, P.S.; Hall, C.; Waggitt, J.J.; Scott, B. A self-contained subsea platform for acoustic monitoring of the environment around marine renewable energy devices-field deployments at wave and tidal energy sites in Orkney, Scotland. IEEE J. Ocean. Eng. 2015, 4, 67–81. [Google Scholar] [CrossRef]
- Manik, H. Underwater acoustic signal processing for detection and quantification of fish. In Proceedings of the 2011 International Conference on Electrical Engineering and Informatics, Bandung, Indonesia, 17–19 July 2011; pp. 3–5. [Google Scholar] [CrossRef]
- Ameer, P.M.; Jacob, L. Underwater localization using stochastic proximity embedding and multi-dimensional scaling. Wirel. Netw. 2013, 19, 1679–1690. [Google Scholar] [CrossRef]
- Liu, C.; Zakharov, Y.V.; Chen, T. Broadband underwater localization of multiple sources using basis pursuit de-noising. IEEE Trans. Signal Process. 2012, 60, 1708–1717. [Google Scholar] [CrossRef]
- Cho, H.; Gu, J.; Joe, H.; Asada, A.; Yu, S. Acoustic beam profile-based rapid underwater object detection for an imaging sonar. J. Mar. Sci. Tech-Japan. 2015, 20, 180–197. [Google Scholar] [CrossRef]
- Guerrero, J.A.; Garcia, L.A.; Contreras, J.J.; Buenrostro, R.; Cosio, M. HYRMA: A hybrid routing protocol for marine environments monitoring. IEEE Latin Am. Trans. 2015, 13, 1562–1568. [Google Scholar] [CrossRef]
- Yoshioka, D.; Sakamoto, H.; Ishihara, Y.; Matsumoto, T.; Timischl, F. Power feeding and data-transmission system using magnetic coupling for an ocean observation mooring buoy. IEEE Trans. Magn. 2007, 43, 2663–2665. [Google Scholar] [CrossRef]
- Lee, M.; Bourgeois, B.; Hsieh, S.; Martinez, A.; Hickman, G. A laser sensing scheme for detection of underwater acoustic signals. In Proceedings of the 1988 IEEE Southeastcon, Knoxville, TN, USA, 10–13 April 1988; pp. 253–257. [Google Scholar]
- Antonelli, L.; Blackmon, F. Experimental demonstration of remote, passive acousto-optic sensing. J. Acoust. Soc. Am. 2004, 116, 3393–3403. [Google Scholar] [CrossRef]
- Blackmon, F.; Antonelli, L. Remote, aerial, trans-layer, linear and non-linear downlink underwater acoustic communication. In Proceedings of the IEEE OCEANS 2006, Boston, MA, USA, 18–21 September 2006. [Google Scholar] [CrossRef]
- Tonolini, F.; Adib, F. Networking across boundaries: Enabling wireless communication through the water-air interface. In Proceedings of the ACM SIGCOMM 2018—2018 ACM Special Interest Group on Data Communication, Budapest, Hungary, 20–25 August 2018; pp. 117–131. [Google Scholar] [CrossRef]
- Lurton, X. An Introduction to Underwater Acoustics: Principles and Applications; Springer Science & Business Media: Berlin, Germany, 2002; p. 106. [Google Scholar]
- Churnside, J.; Bravo, H.; Naugolnykh, K. Effects of underwater sound and surface ripples on scattered laser light. Acoust. Phys. 2008, 54, 204–209. [Google Scholar] [CrossRef]
- Guo, C.; Deng, B.; Yang, Q.; Wang, H.; Liu, K. Modeling and simulation of water-surface vibration due to acoustic signals for detection with terahertz radar. In Proceedings of the UCMMT 2019—2019 UK-Europe-China Workshop on Millimeter Waves and Terahertz Technologies, London, UK, 20–22 August 2019. [Google Scholar] [CrossRef]
- Moniara, R. Wireless underwater-to-air communications via water surface modulation and radar detection. In Proceedings of the Radar Sensor Technology XXIV, Anaheim, CA, USA, 26–30 April 2020. [Google Scholar] [CrossRef]
- Li, C.; Ling, J.; Li, J.; Lin, J. Accurate doppler radar noncontact vital sign detection using the RELAX algorithm. IEEE Trans. Instrum. Meas. 2010, 3, 687–695. [Google Scholar]
- Li, C.; Lin, J. Optimal carrier frequency of non-contact vital sign detectors. In Proceedings of the 2007 IEEE Radio and Wireless Symposium, Long Beach, CA, USA, 9–11 January 2007; pp. 281–284. [Google Scholar] [CrossRef]
- Xiong, Y.; Peng, Z.; Xing, G.; Zhang, W.; Meng, G. Accurate and robust displacement measurement for FMCW radar vibration monitoring. IEEE Sens. J. 2018, 18, 1131–1139. [Google Scholar] [CrossRef]
- Li, J.; Stoica, P. Efficient mixed-spectrum estimation with applications to target feature extraction. IEEE Trans. Signal Process. 1996, 44, 281–295. [Google Scholar] [CrossRef]
- Zhang, L.; Zhang, X.; Tang, W. Amplitude measurement to weak sinusoidal water surface acoustic wave using laser interferometer. Chin. Opt. Lett. 2015, 13, 091202. [Google Scholar] [CrossRef]
- Fuchs, J. Estimating the number of sinusoids in additive white noise. IEEE Trans. Acoust. Signal Process. 1988, 36, 1846–1853. [Google Scholar] [CrossRef]
- Zhou, S.; Wang, Z. OFDM for Underwater Acoustic-Communications; Wiley: New York, NY, USA, 2014; pp. 2–8. [Google Scholar]
- Liu, Z.; Li, J. Implementation of the RELAX algorithm. IEEE Trans. Aero. Elec. Sys. 1998, 34, 657–664. [Google Scholar] [CrossRef]


| Parameters | Quantity | Value |
|---|---|---|
| distance from the radar to the water surface | 1.5 m | |
| distance from the underwater sound source to the water surface | 0.8 m | |
| sound pressure level | 110 dB | |
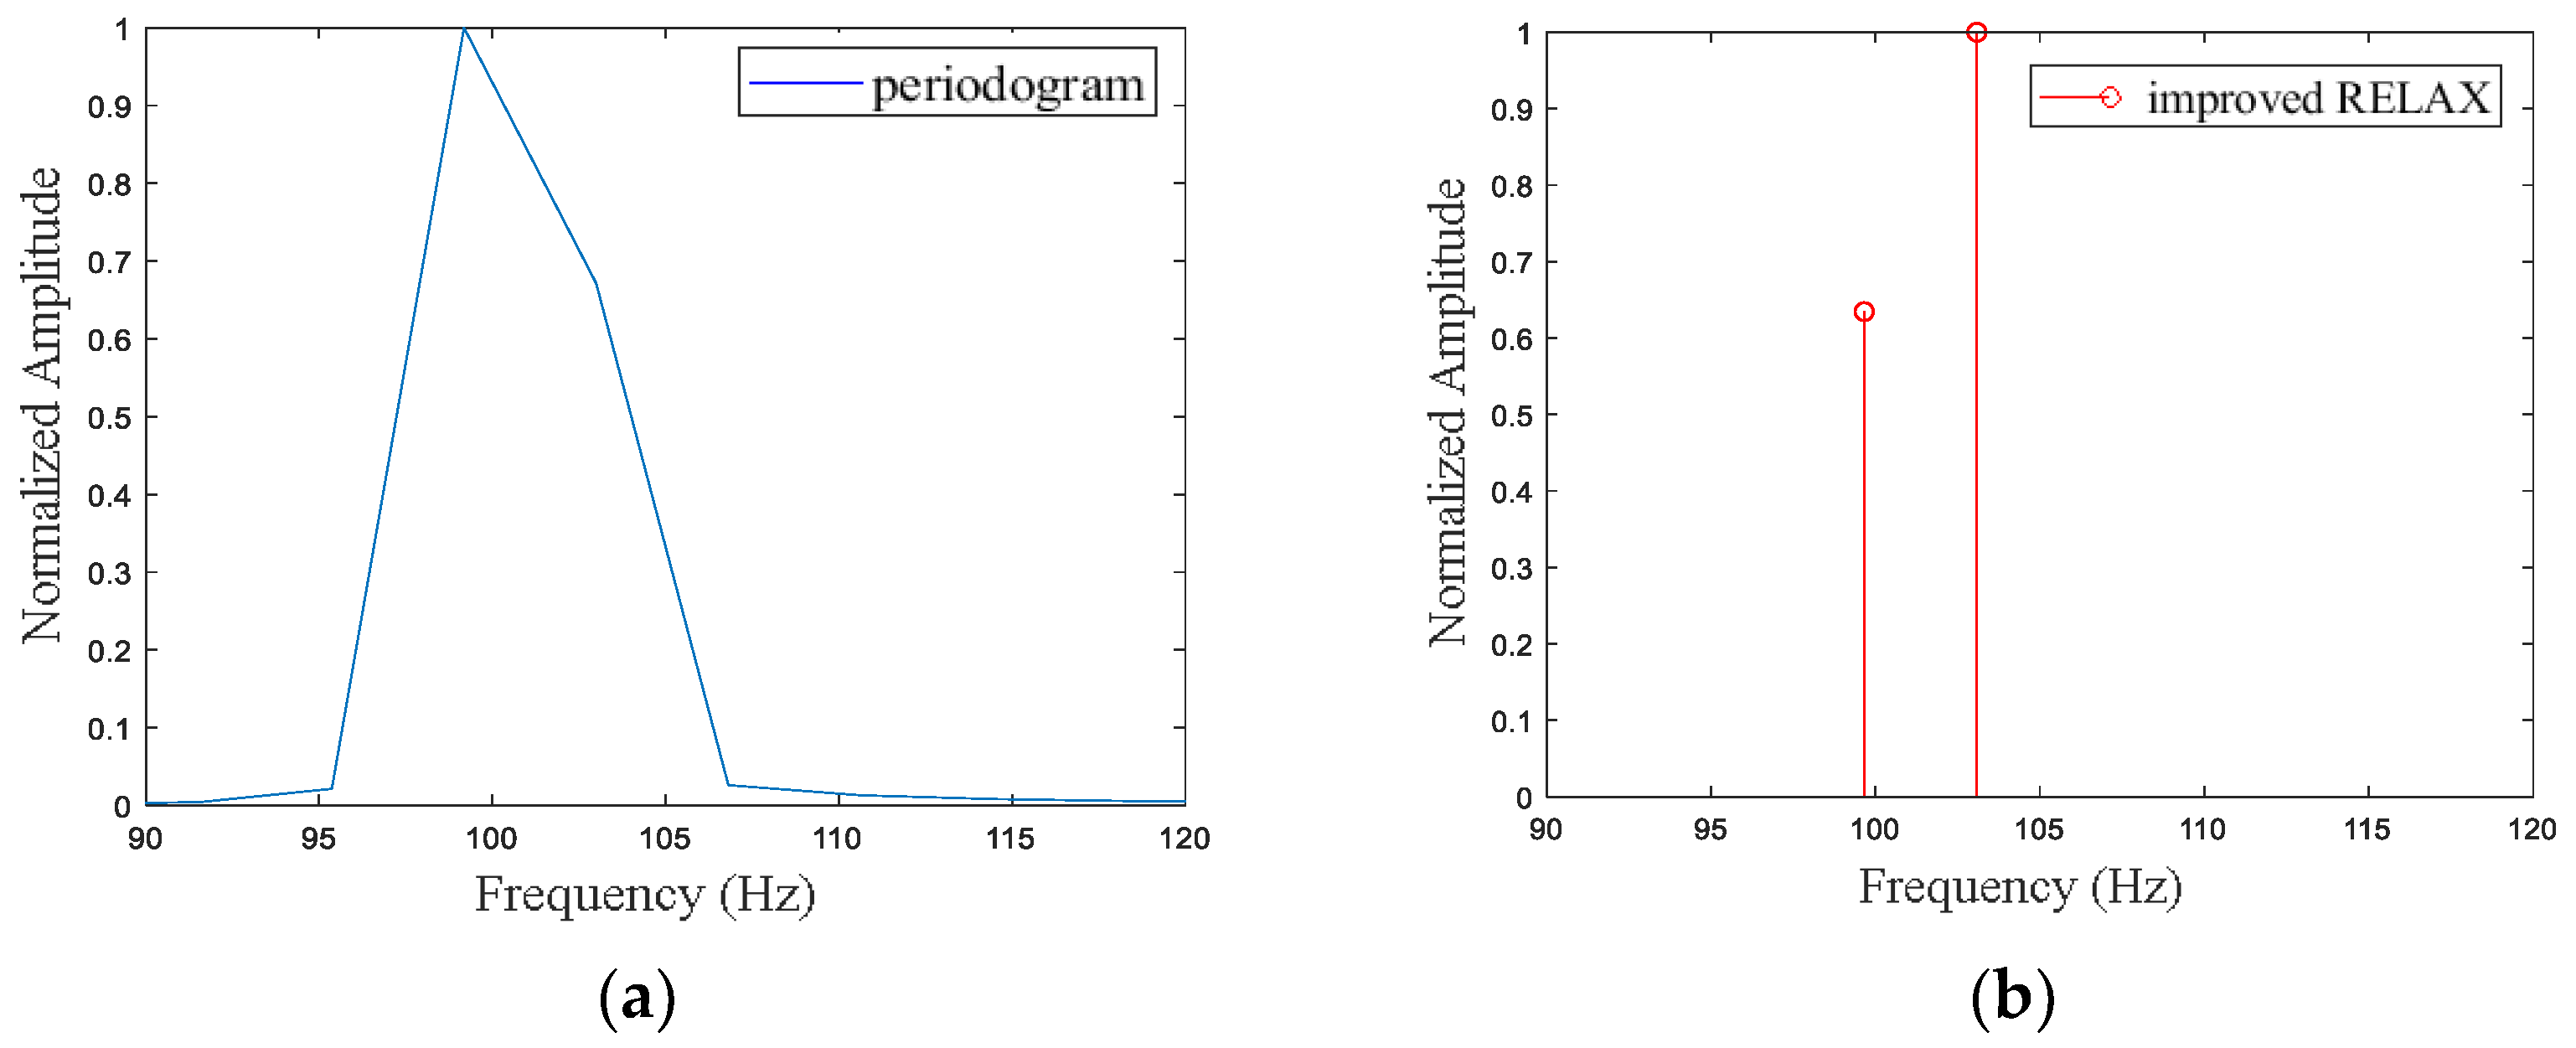
| transmitting frequency 1 of the underwater source | 100 Hz | |
| transmitting frequency 2 of the underwater source | 103 Hz | |
| bandwidth | 1.2 GHz | |
| pulse repetition time | 8 us | |
| fast-time sampling number | 400 | |
| slow-time sampling number | 40,000 |
| Algorithm | Estimation Error | |
|---|---|---|
| periodogram | 91.55 Hz | 8.45% |
| improved RELAX | 101.71 Hz | 1.71% |
| Parameters | Value |
|---|---|
| center frequency | 34.6 GHz |
| pulse repetition frequency (PRF) | 50 kHz/125 kHz |
| fast-time sampling points | 400/1000 |
| slow-time sampling points | 60,000 |
| antenna gain | 25 dB |
| Sampling Duration (s) | Periodogram | Improved RELAX | ||
|---|---|---|---|---|
| Result (Hz) | Error | Result (Hz) | Error | |
| 0.005 | 141.10 | 8.54% | 136.00 | 4.62% |
| 0.01 | 125.90 | 3.15% | 129.70 | 0.23% |
| 0.05 | 129.70 | 0.23% | 130.00 | 0.00% |
| 0.1 | 129.70 | 0.23% | 130.00 | 0.00% |
Publisher’s Note: MDPI stays neutral with regard to jurisdictional claims in published maps and institutional affiliations. |
© 2022 by the authors. Licensee MDPI, Basel, Switzerland. This article is an open access article distributed under the terms and conditions of the Creative Commons Attribution (CC BY) license (https://creativecommons.org/licenses/by/4.0/).
Share and Cite
Luo, J.; Liang, X.; Guo, Q.; Zhao, T.; Xin, J.; Bu, X. A Novel Estimation Method of Water Surface Micro-Amplitude Wave Frequency for Cross-Media Communication. Remote Sens. 2022, 14, 5889. https://doi.org/10.3390/rs14225889
Luo J, Liang X, Guo Q, Zhao T, Xin J, Bu X. A Novel Estimation Method of Water Surface Micro-Amplitude Wave Frequency for Cross-Media Communication. Remote Sensing. 2022; 14(22):5889. https://doi.org/10.3390/rs14225889
Chicago/Turabian StyleLuo, Jianping, Xingdong Liang, Qichang Guo, Tinggang Zhao, Jihao Xin, and Xiangxi Bu. 2022. "A Novel Estimation Method of Water Surface Micro-Amplitude Wave Frequency for Cross-Media Communication" Remote Sensing 14, no. 22: 5889. https://doi.org/10.3390/rs14225889
APA StyleLuo, J., Liang, X., Guo, Q., Zhao, T., Xin, J., & Bu, X. (2022). A Novel Estimation Method of Water Surface Micro-Amplitude Wave Frequency for Cross-Media Communication. Remote Sensing, 14(22), 5889. https://doi.org/10.3390/rs14225889