1. Introduction
The increasingly extensive application of 3D laser scanning has led to the development of research in many fields, such as forest investigation [
1,
2,
3], autonomous driving [
4], building modeling and detection [
5,
6], cultural relic protection [
7], etc. However, the original scanning data only provides spatial information and does not contain semantic information that can be directly understood and applied in such fields. Therefore, it is necessary to assign a semantic label to each point before further applications, which is called point cloud classification.
Feature extraction, as a vital step of classification, aims to find discriminative features describing 3D distribution from massive points [
8], which directly affects the accuracy of subsequent point cloud processing. Commonly used point cloud features include RGB colors [
9], intensity features [
10,
11,
12,
13], geometric features [
9,
14,
15,
16,
17], etc. The intensity and RGB information are not always available, which limits the generality of methods using those features. Moreover, RGB color and intensity information are not necessarily conducive to improving classification accuracy [
18].
As 3D coordinates are fundamental information in all LiDAR (Light Detection and Ranging) systems. We only use geometric features for classification in this study, which can be extracted directly from 3D coordinates and depends on the local structure and point density [
10,
19,
20,
21]. The three major types of laser scanning data (Airborne Laser Scanning, Mobile Laser Scanning, and Terrestrial Laser Scanning) present different point distributions. For instance, Airborne Laser Scanning (ALS) is used to collect large-scale 3D information with almost uniform point density. As an important complement to ALS, Mobile Laser Scanning (MLS) and Terrestrial Laser Scanning (TLS) can capture dense and detailed 3D information from the side view. The scanning targets are mainly distributed on the two sides of the route in MLS, with a similar distance to the scanning center, while the distribution of the targets is more complex in TLS. Thus, the density variation in TLS is commonly larger than that of MLS, in spite of the similar scanning pattern [
22]. In this research, we mainly focus on the effect of density variation on the representation of geometric features in TLS data. As one of the factors that affect geometric features, the impact of density variation on feature extraction has been focused on feature extraction strategy and parameter setting in previous studies.
Local point density can be directly used as a feature to reflect the point distribution characteristics by counting the number of points in a given geometric primitive, such as a sphere and a cylinder [
11,
16,
21,
23,
24,
25]. Pirotti et al. delimitated the working area by calculating the point density and defining the lowest acceptable point density [
11]. Previous research has established that specific objects can be detected by density variation. For instance, leaf points are separated by utilizing the remarkable density difference between leaf and wood points [
26,
27]. On this basis, Tan et al. further analyzed the factors influencing the density variation and calibrated the distance effect on density [
2]. Che et al. proposed a method to filter TLS data with a scanline density analysis by simulating reference point density based on distance and angular resolution, which is the angle between two horizontally or vertically adjacent laser beams [
28]. Ibrahim et al. extracted ground points by counting the point number in cylinder neighborhoods and set the density threshold according to the average point density and the number of drive lines [
29]. In addition to directly using point density as a feature description, projecting 3D points onto the XOY plane is another common strategy [
14,
19,
30,
31]. Li et al. projected the points onto a rectangular grid in the XOY plane, counting the number of points in each sub-grid, and taking it as the projection density. The points with projection density above a predefined threshold are labeled as building façade [
32,
33,
34]. In some studies, projection density is also used to extract poles in an urban scene [
35] and individual trees in a forest scene [
31,
36].
Density variation also affects the parameter setting in the post-processing, e.g., grid size [
37], slice thickness [
38], voxel size [
39], density threshold [
40], and neighborhood setting [
19]. Setting a unified threshold may be unsuitable when dealing with data of large density variation. In order to solve the problems brought by threshold setting, Liu et al. generated an adaptive threshold for each grid based on scanning distance and angular resolution to detect dynamic targets at different distances [
41]. Cheng et al. calculated the threshold of projection density based on the distance from the farthest building to the scanner, the height of the lowest building, and angular resolution [
42]. However, this approach requires a detailed understanding of the entire scene. To solve this problem, Chen et al. calculated the threshold of projection density based on the polar grid and vertical angular resolution [
22].
In addition to the threshold setting, many studies have weakened the effect of density variation on feature extraction by changing the neighborhood setting, further improving feature saliency. Under the neighborhood with the same scale, density variation will result in a lower number of neighboring points farther away from the scanner, which affects the discrimination of local features. In order to overcome the effect of density variation on the fix-scale neighborhood, Dimitrov et al. determine the representative radius by various surfaces, mitigating the impact of density variation [
43]. Another idea is to evaluate a series of neighborhood settings through local features, such as eigenentropy [
19], curvature [
44], surface variation [
45], or direct use multi-scale neighborhoods for feature extraction [
46,
47]. However, the selection of the search range still depends on prior knowledge. To solve this problem, Chen et al. constructed a density-adaptive search range for each point, based on the theoretical point spacing estimated from a distance and angular resolution [
30,
48].
Although the above methods take into account the effect of density variation on feature extraction, which can improve the accuracy of classification and object recognition, there are still some problems to be solved.
- (1)
Angular resolution is an important parameter in many density-adaptive methods, indicating how close two adjacent points are under a given distance. However, most current methods assume that it is a known parameter and directly take it into calculation [
28,
30,
41,
42,
48]. Although the angular resolution can be obtained directly from the scanner settings, the condition with the unknown angular resolution is unavoidable, limiting the generality of the current methods.
- (2)
Among the object extraction methods, many density-adaptive methods are designed for specific objects. The target objects are distinguished from other objects in the scene by defining a set of rules that take the geometric features into account, such as buildings [
32,
34,
49,
50], vehicles [
29], or trees [
36]. There is still a lack of feature design considering density variation in multi-class classification.
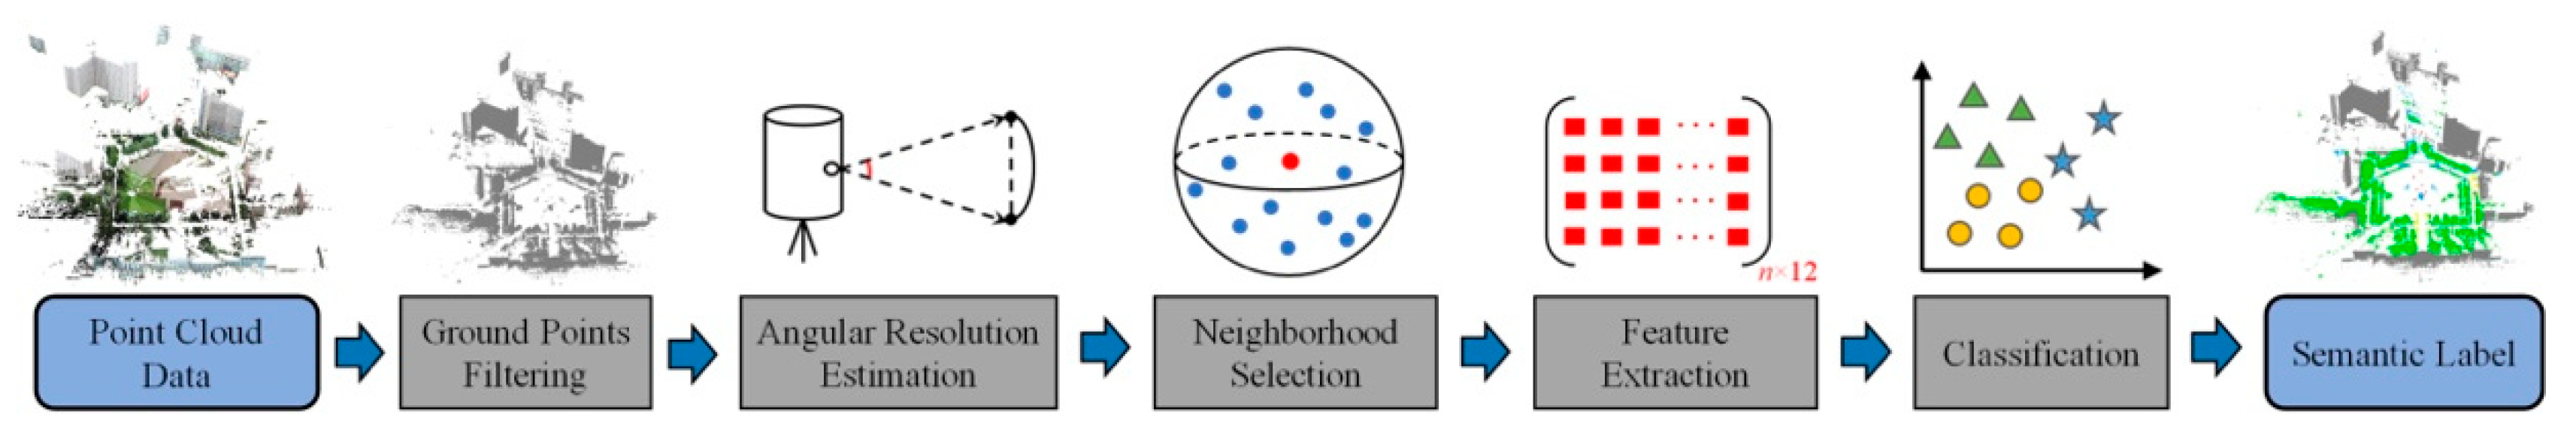
Focusing on the above limitations, we provide a solution when the angular resolution is unknown in density-adaptive processing and propose an alternative density-adaptive method for feature extraction considering density variation in multi-class classification. The following objectives are accomplished:
- (I)
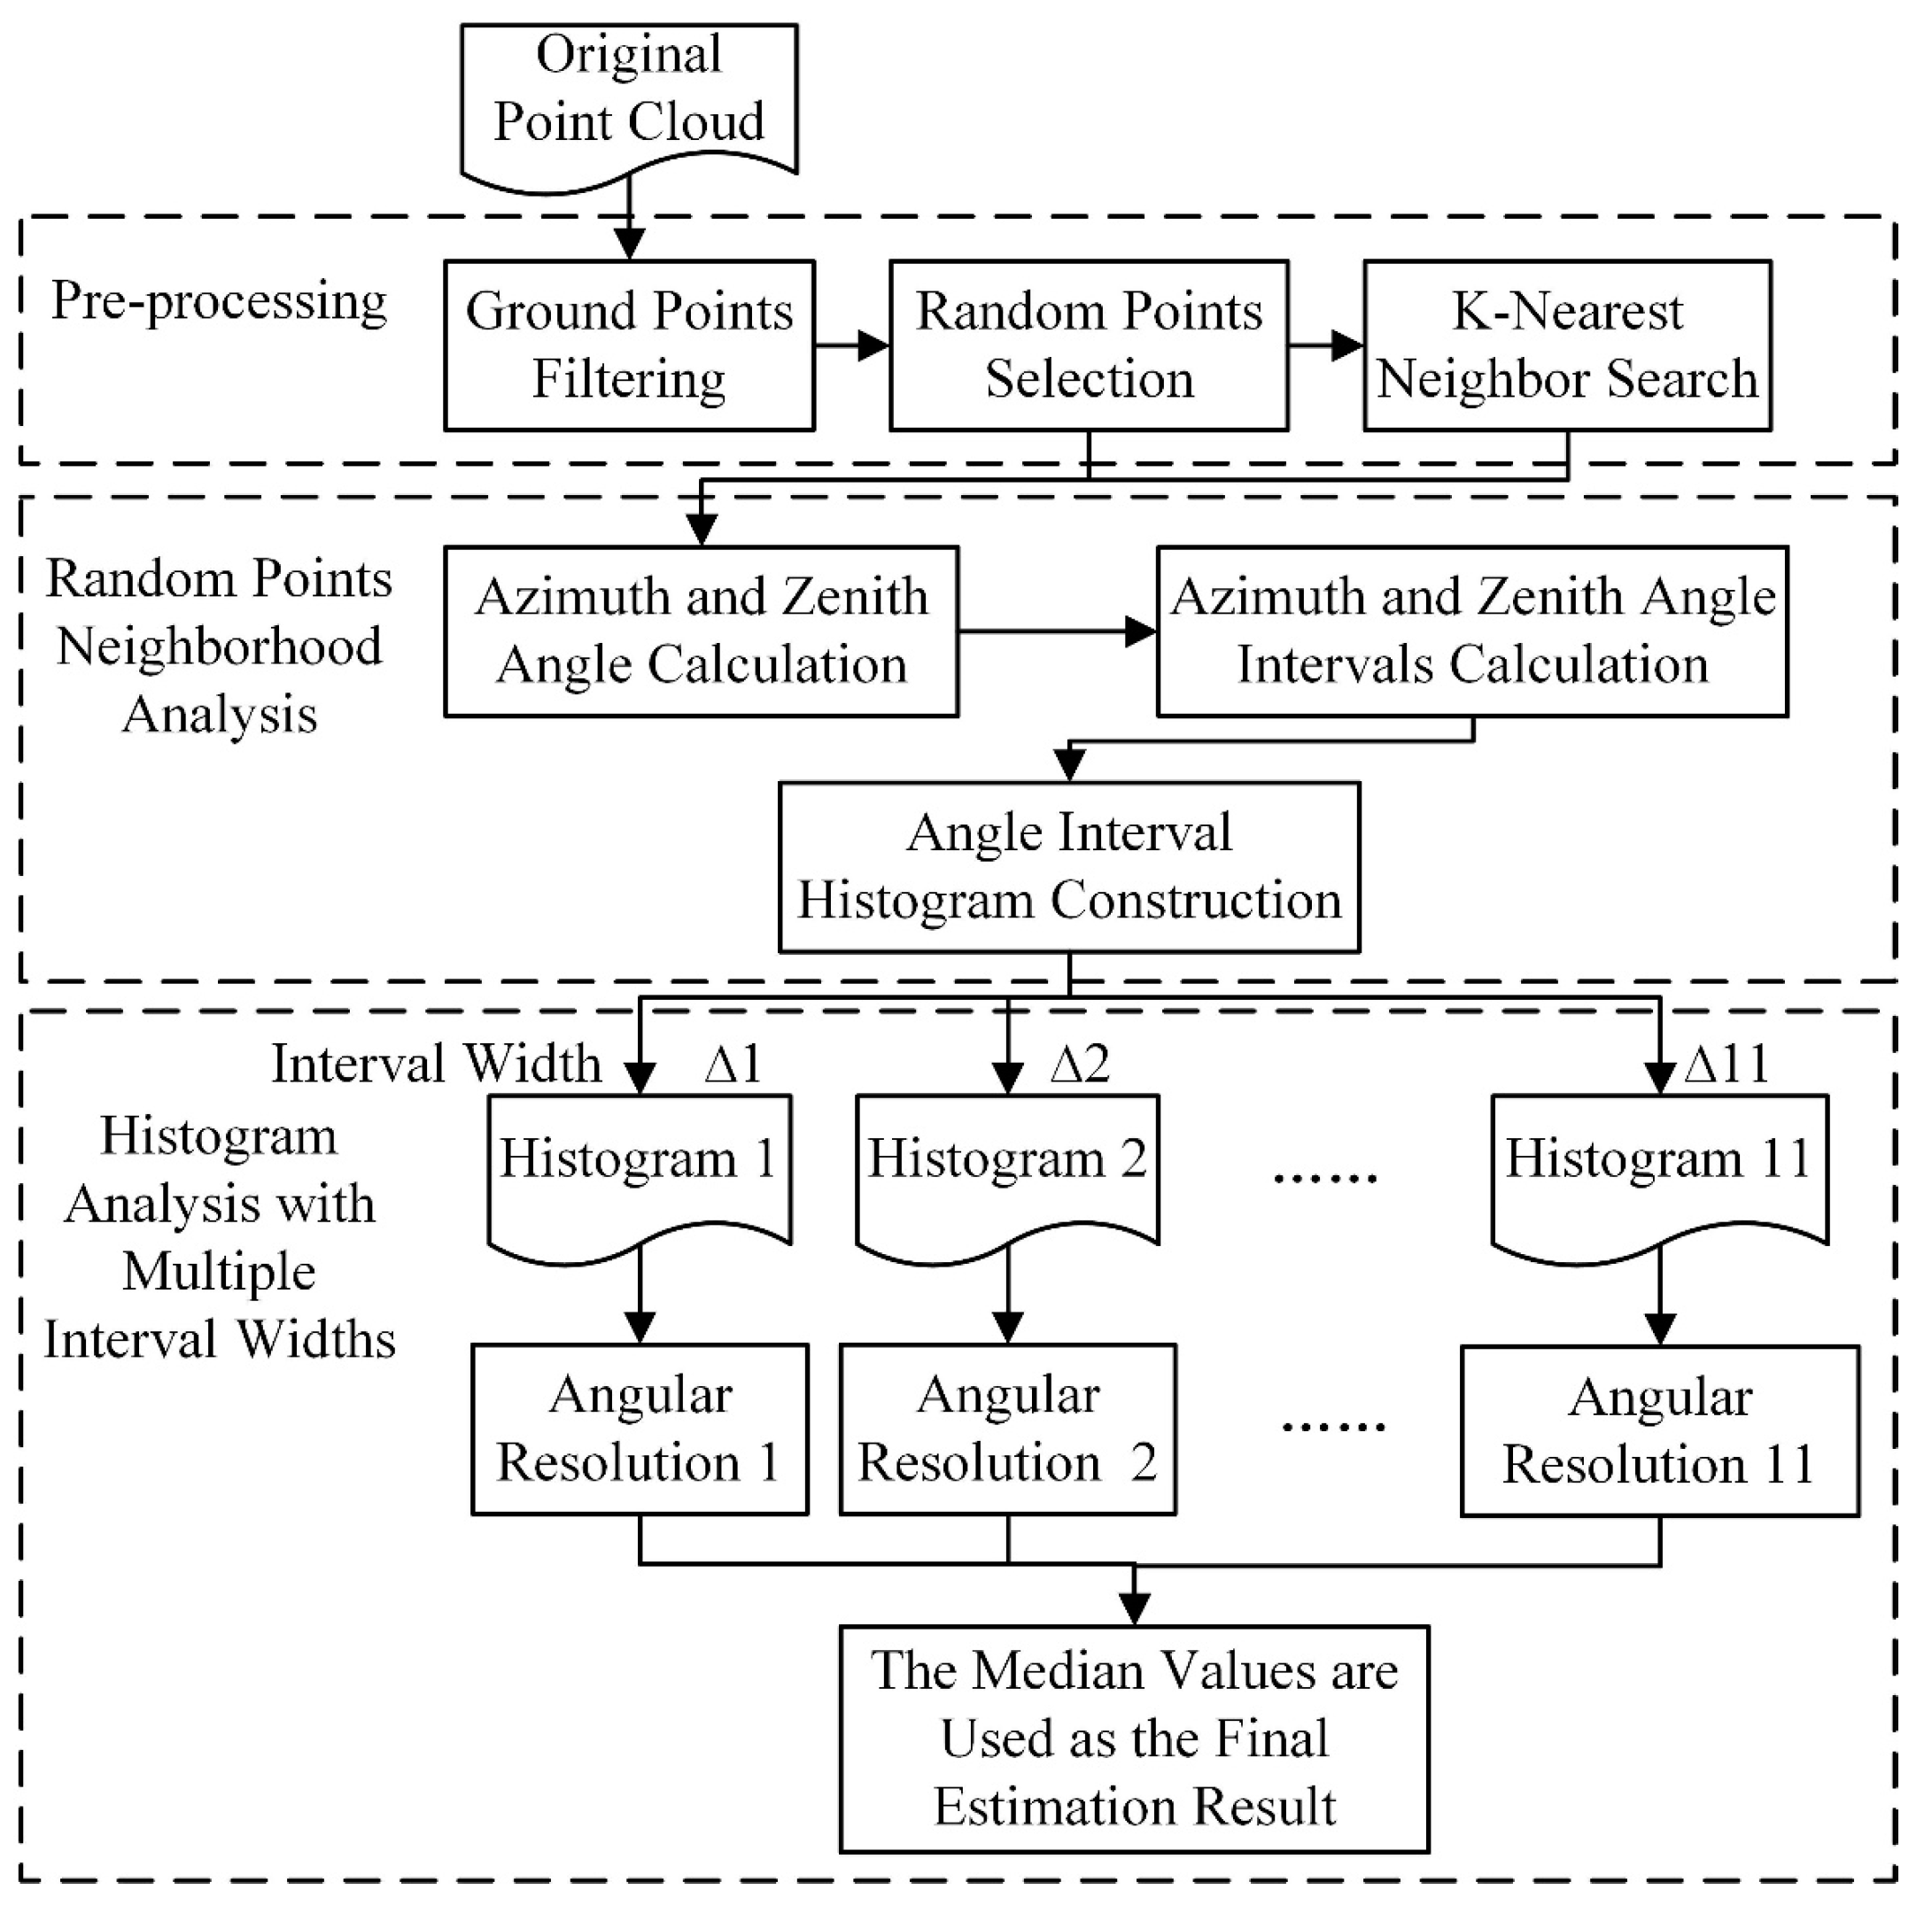
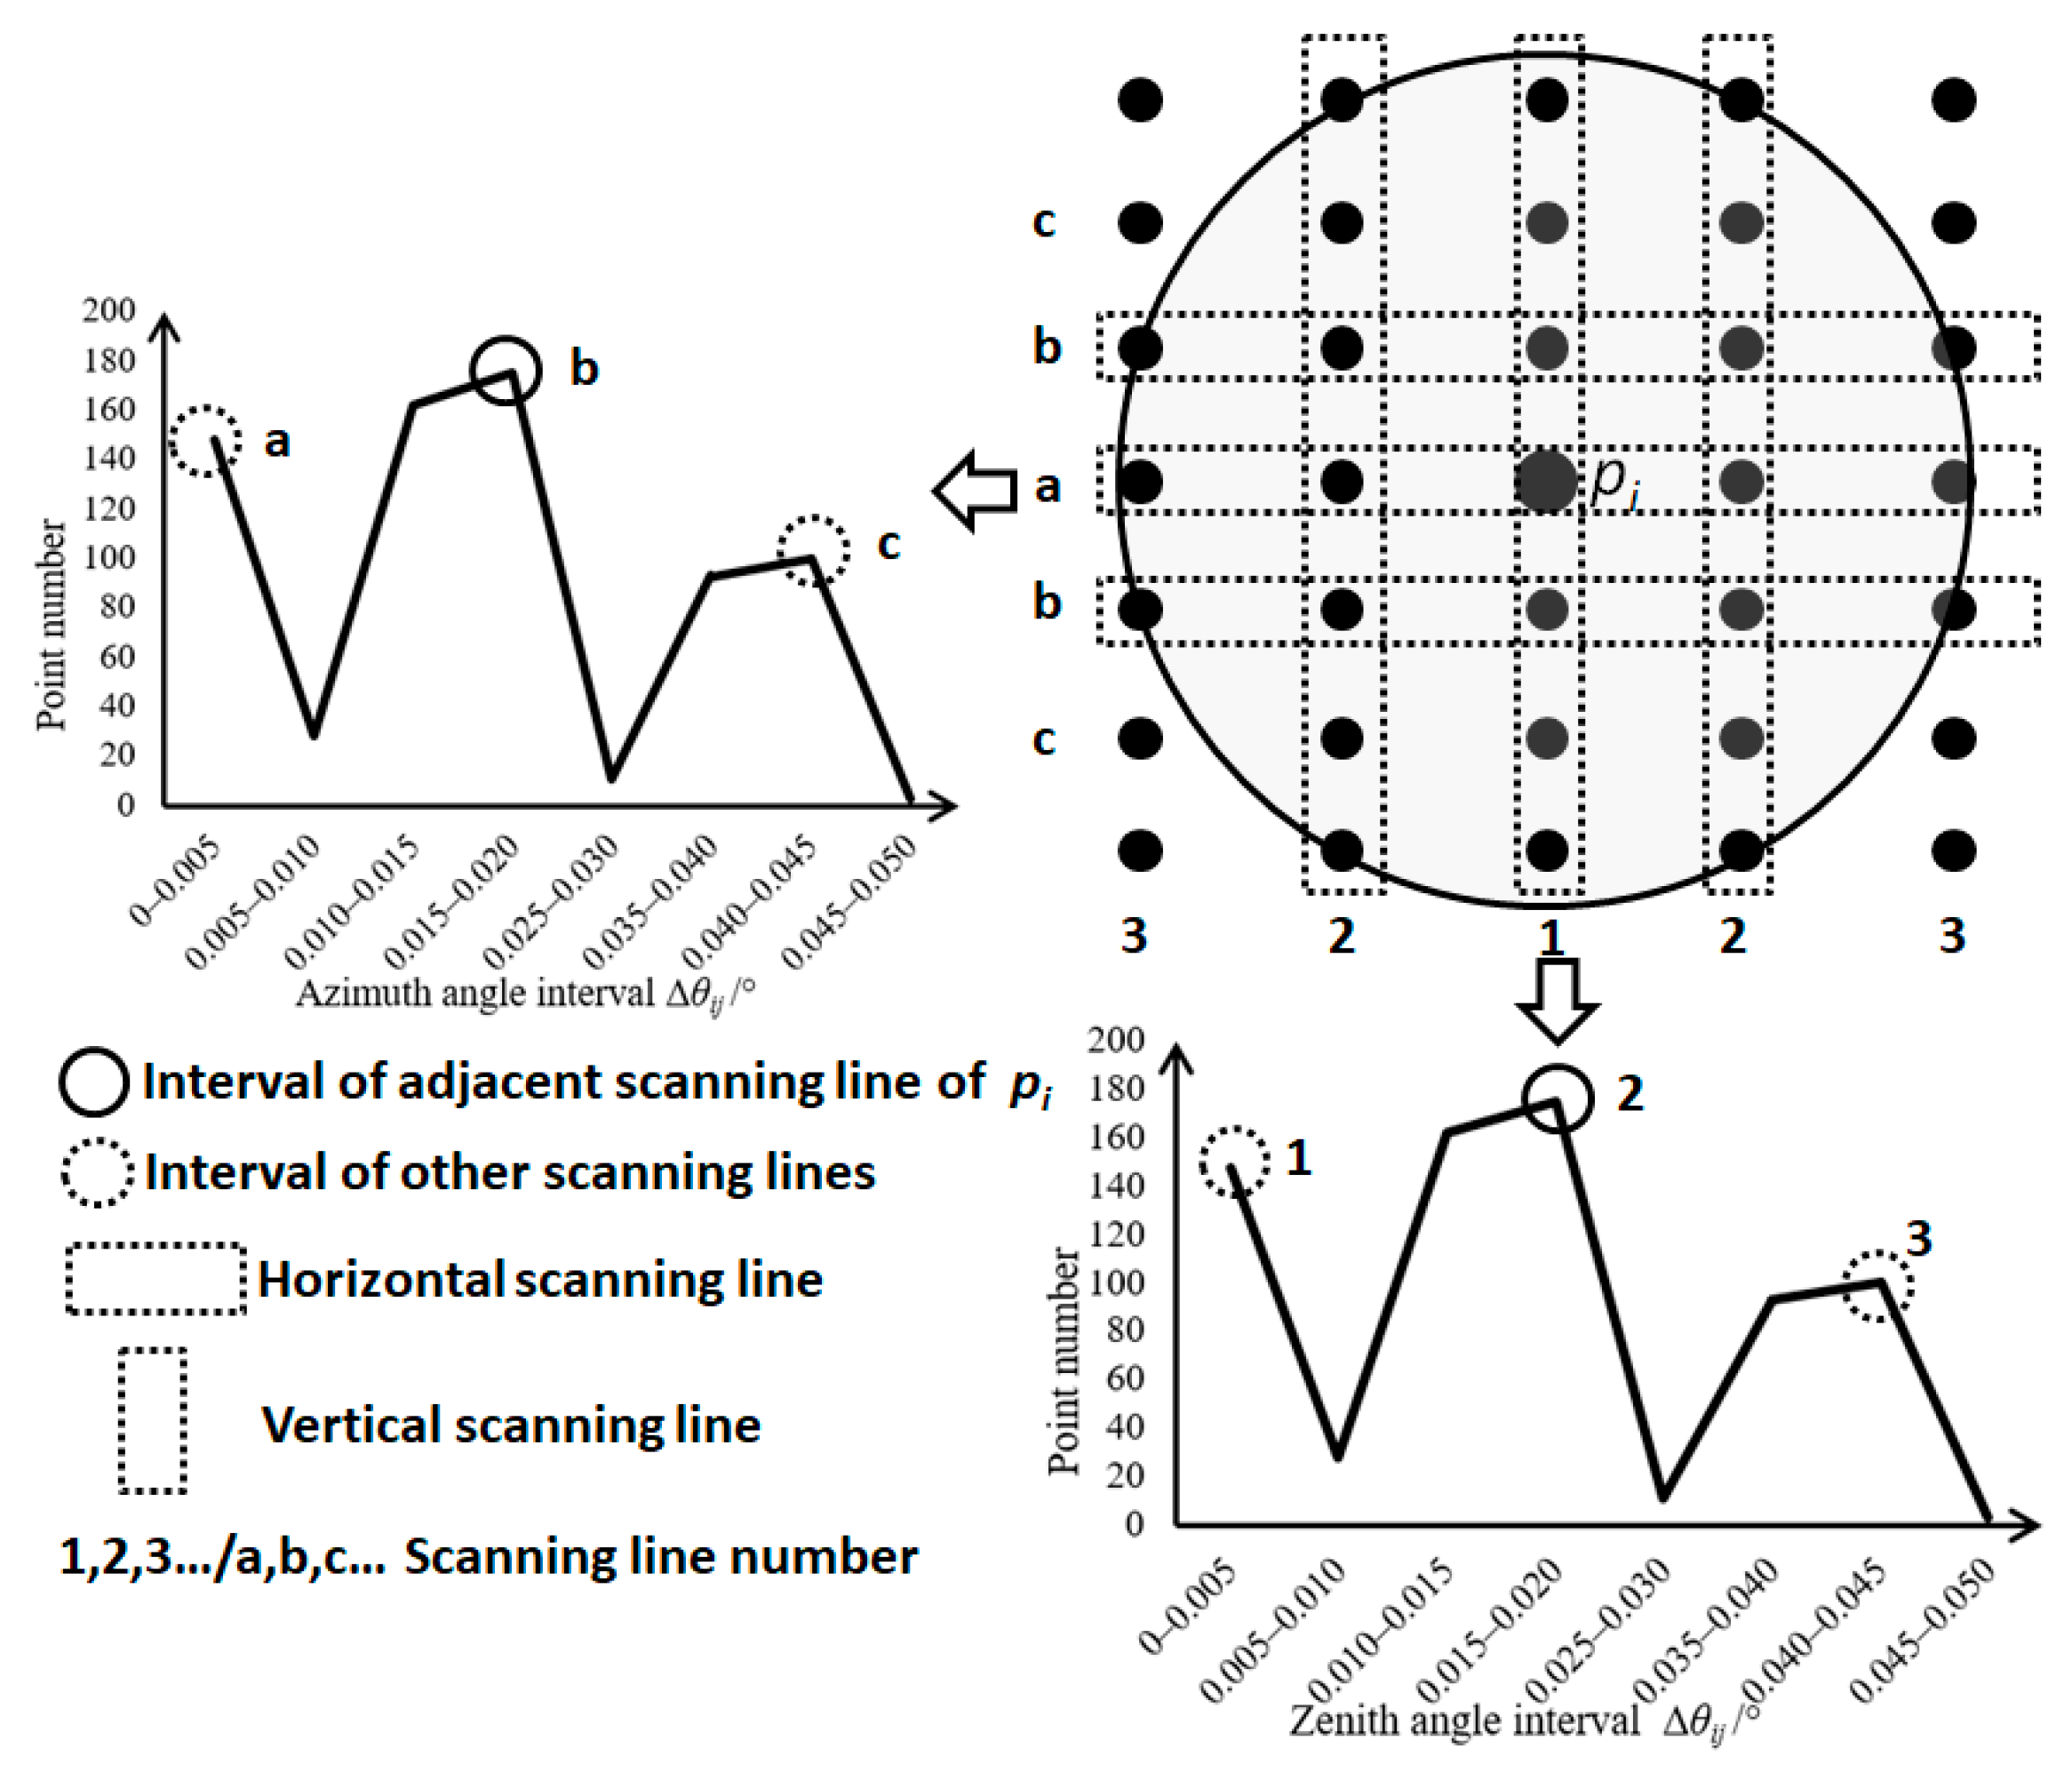
Focusing on the case when angular resolution is unknown, we present a stable method to estimate the angular resolution of TLS data, called the neighborhood analysis of randomly picked points (NARP), and
- (II)
Based on the estimated angular resolution, we propose a grid-based feature called relative projection density, to adapt to the density variation in TLS data. In contrast to the commonly used projection density in previous studies [
19,
30,
31,
32,
33,
34,
49], the relative projection density can weaken the effect of density variation and strengthen the relationship between projection density and object geometry.
4. Discussion
The proposed method aims to improve the generality of density-adaptive processing and weaken the impact of density variation caused by scanning distance in feature extraction. Our framework consists of two components, and each component will be processed independently of the other one. We will briefly summarize the advantage of our method derived from our experience below.
In previous studies, angular resolution was often used as a known parameter to balance the density variation [
22,
28,
30,
41,
42,
48]. Although angular resolution can be obtained directly from scanner settings, dealing with the data without angular resolution is unavoidable in some cases because (a) TLS benchmark datasets usually do not contain angular resolution, such as Semantic-3D [
18], WHU-TLS [
54]; (b) some scanners do not directly provide an entry for setting the angular resolution, e.g., Leica P Series scanners control the scanning resolution by setting point spacing at a specific distance. Although the angular resolution may be obtained by making an insight of the original data through the software provided by the scanner developer, it will take extra time and makes the density-adaptive methods inconvenient to use and; (c) scanning parameters are generally stored in the original data exported directly from the scanner, while point cloud formats used (e.g., ASC, LAS, PTS, etc.) for data sharing usually do not contain angular resolution, which will cause angular resolution information to be lost in data sharing and transmission processing. Compared with previous studies, our method provides a viable solution for the above conditions when the angular resolution is unknown. In addition, it should be mentioned that our method requires to retrieve the neighboring information of some selected points, which are commonly not included in the original point cloud and may be time-consuming. However, because constructing a neighborhood is a necessary step in the frequently used point cloud processing, such as feature extraction, segmentation, and classification, our method does not occupy additional computing resources from the perspective of the whole process. Thus, our method is easy to be embedded in most methods in which detailed and local point analysis is utilized.
Previous studies dealt with the effect of density variation from many aspects, such as threshold setting [
30,
32,
48,
49], radius selection [
30,
40,
41,
55], and feature design [
26,
27,
28,
56,
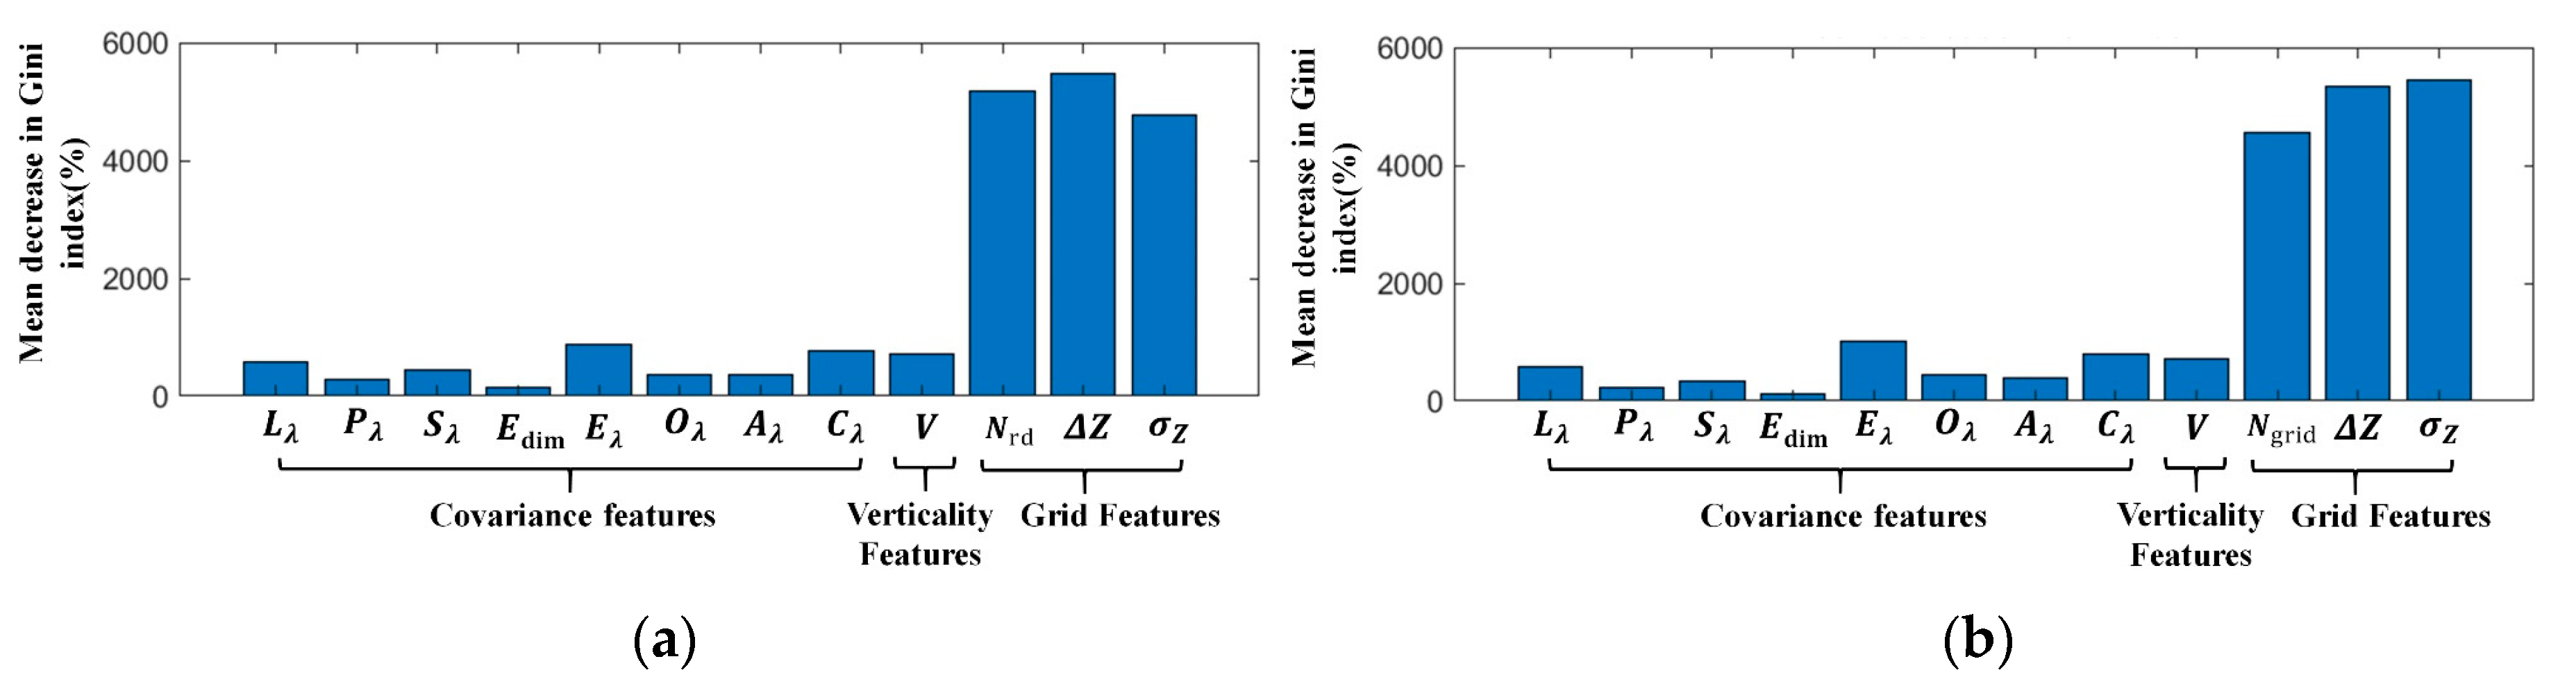
57]. We address this problem from the view of grid-based feature extraction. Our test has shown that the proposed relative projection density is effective and density variation in grid-based feature extraction is beneficial to improve the result of object recognition, which is similar to the conclusion of many previous studies, such as [
28,
30,
48]. Furthermore, our conclusion can be supported by the evaluation result of feature importance, as shown in
Figure 16.
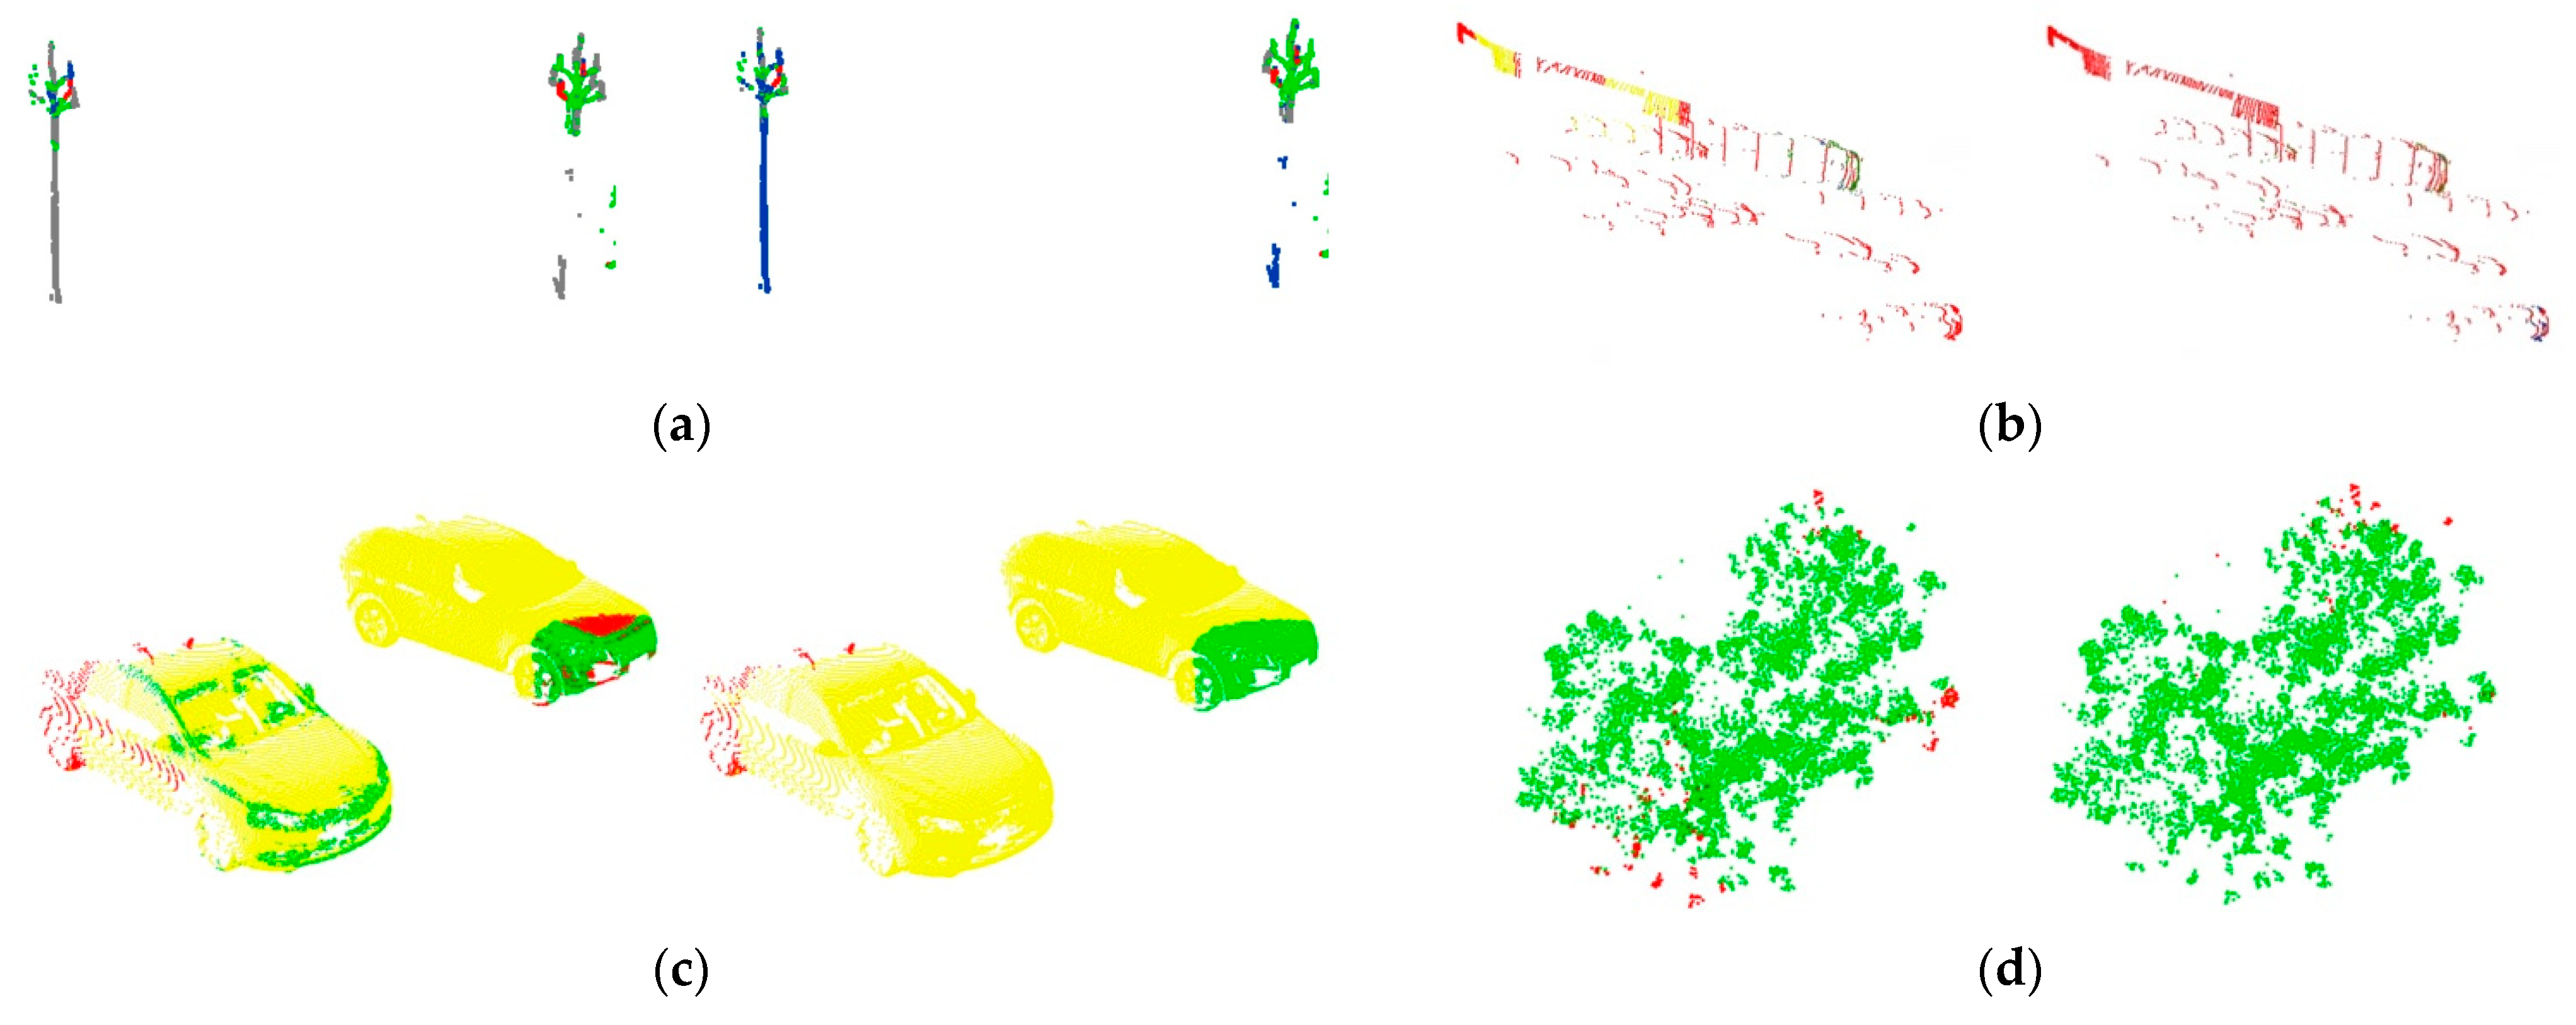
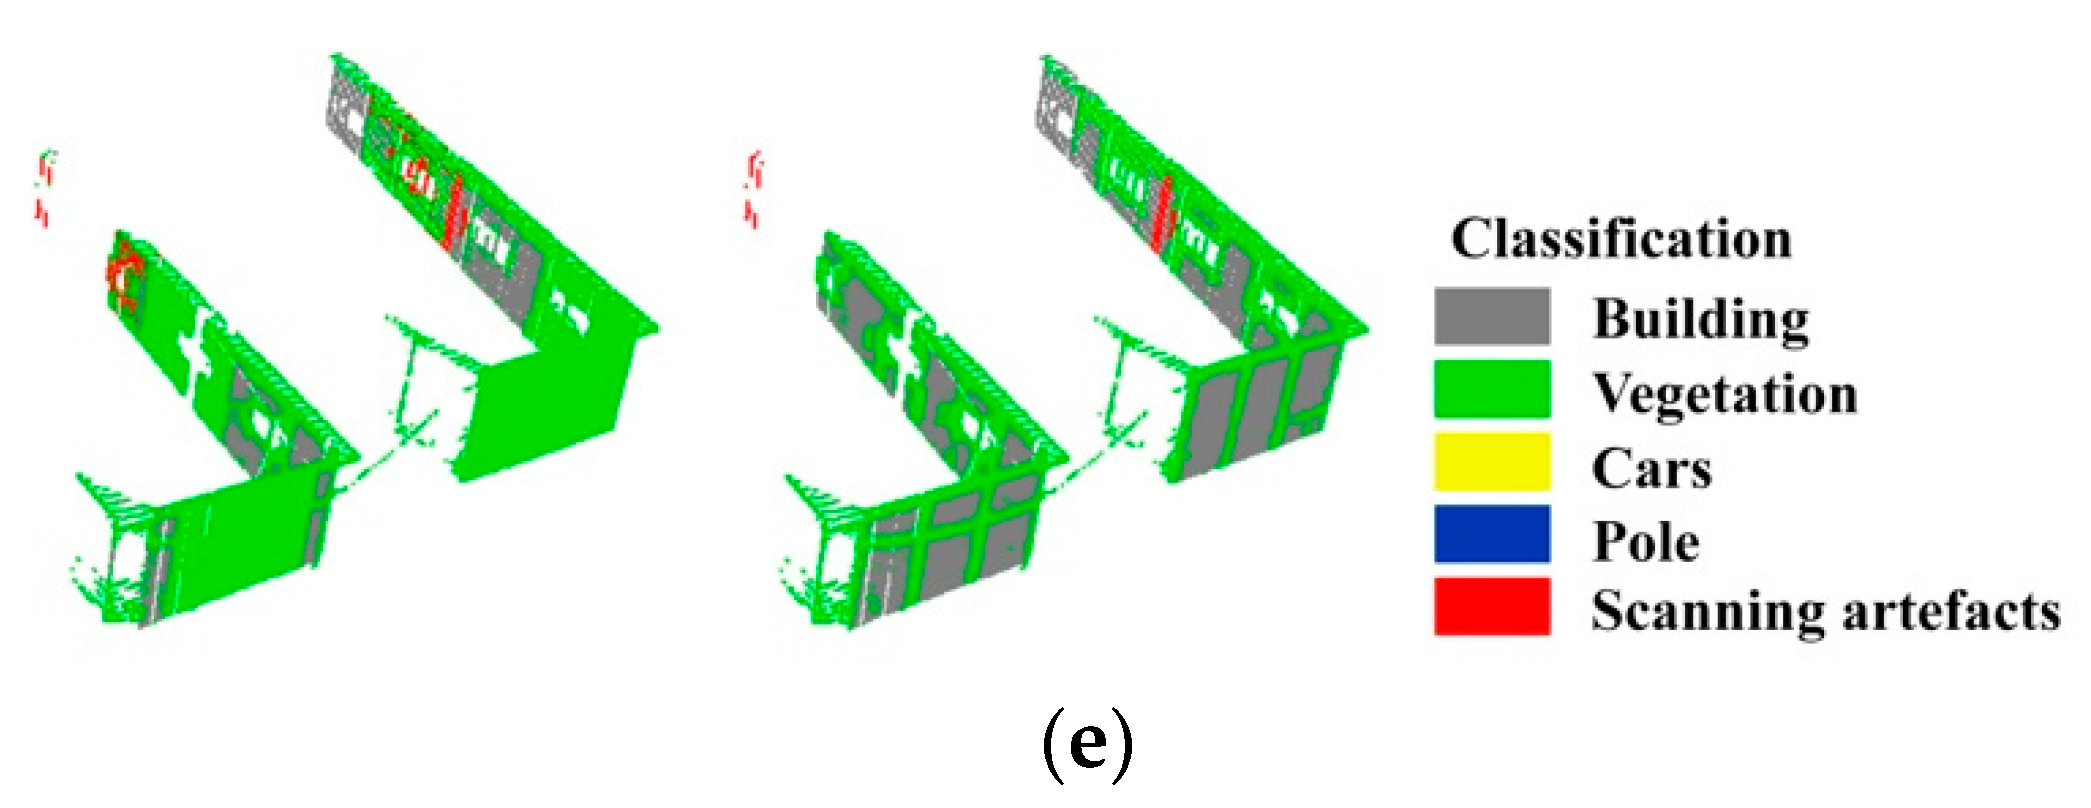
Figure 16 shows the importance of the projection density feature increasing after considering density variation and the proposed feature is among the three most important features. Moreover, it becomes visible that noisy labeling can be observed from the classification result in
Figure 15. To avoid unsmooth classification results, more features, such as contextual features, can be subsequently introduced on the basis of existing features [
58], and a label smoothing method [
59,
60] can be used to optimize the overall results. As our focus is to weaken the effect of density variation on classification results; the smoothing of noise points is not included in this research.
5. Conclusions
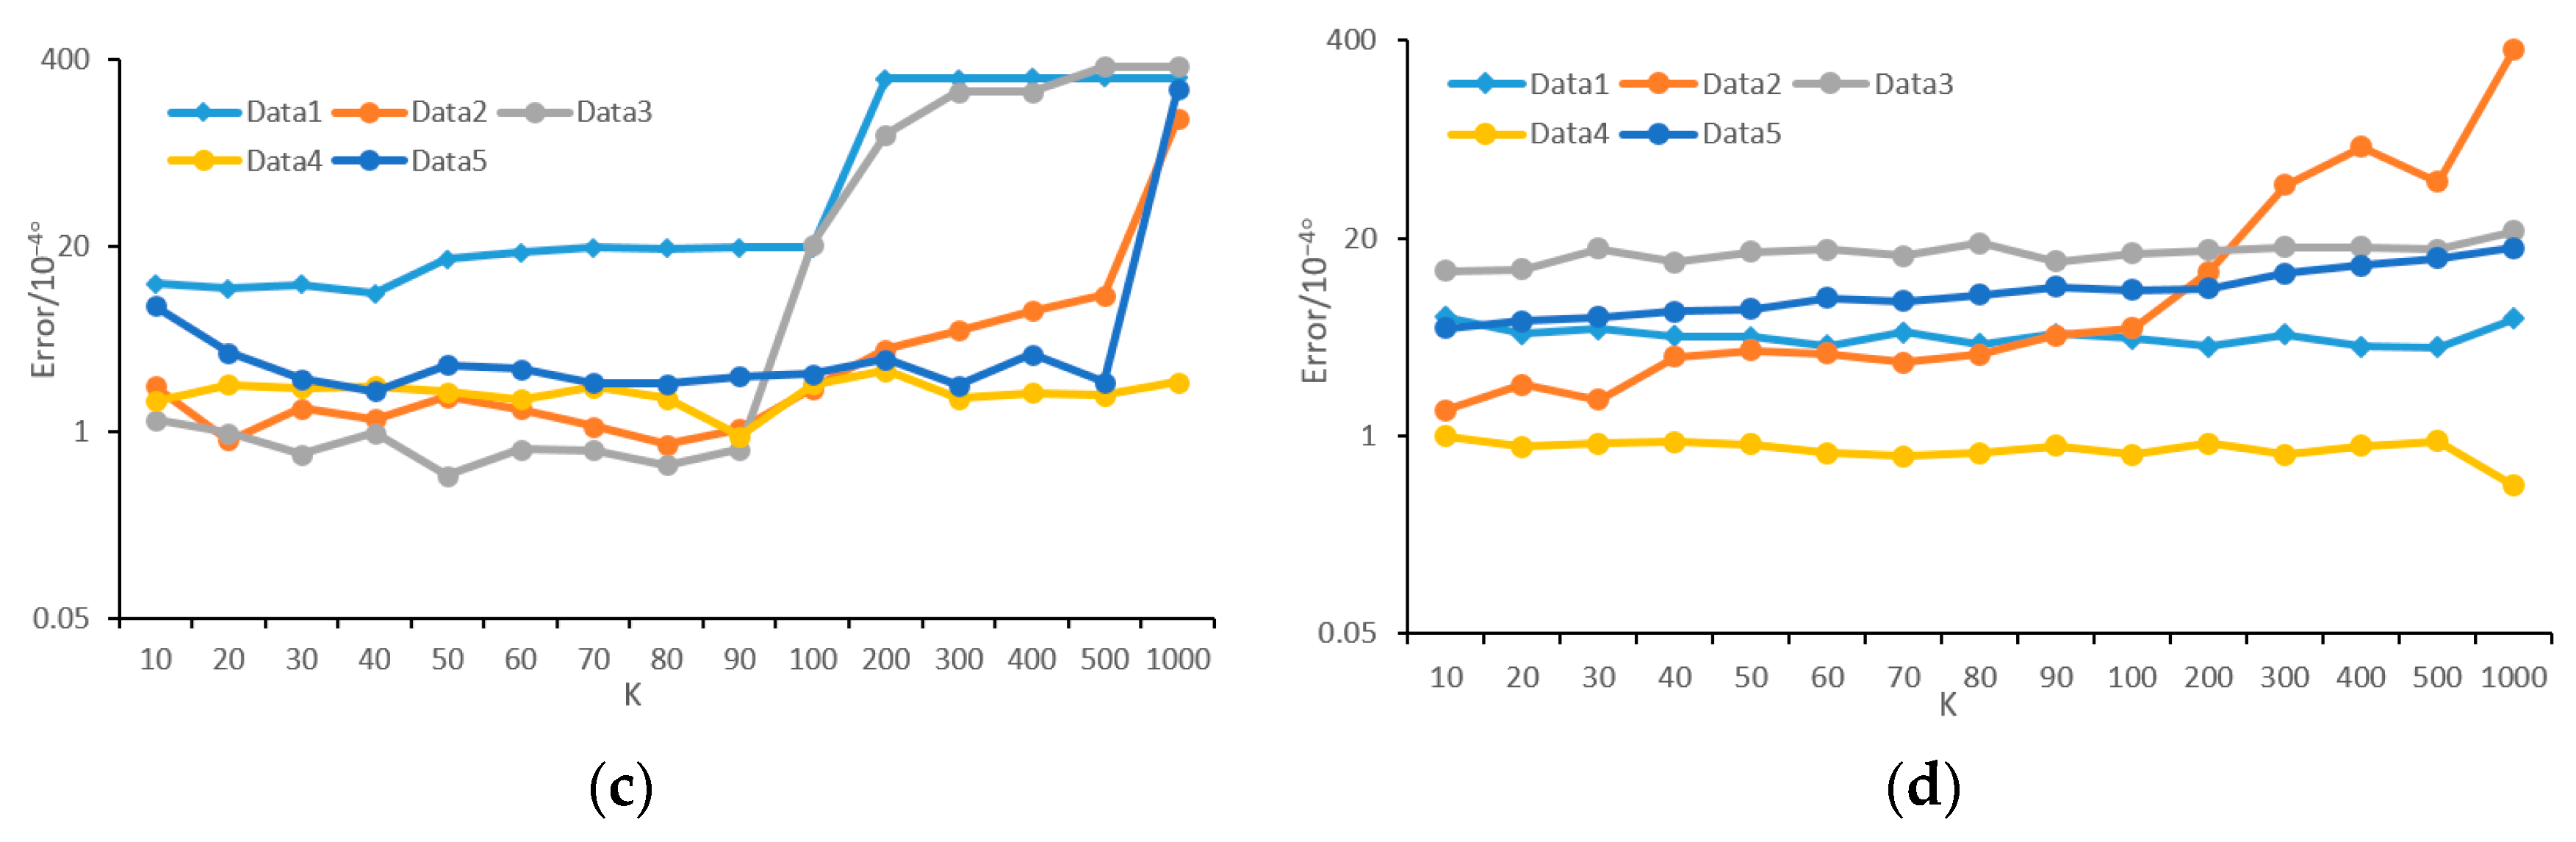
The main concentrations of our work are the generality of the density-adaptive methods using angular resolution, which is the angle between two horizontally or vertically adjacent laser beams, and the effect of density variation on projection density in feature extraction. To deal with the case when angular resolution is unknown, we propose an estimation method of angular resolution for TLS data. The test shows that the error of our method is less than 0.001° in most cases. Additionally, our method is stable in terms of object type (building, crown, pole, car, and ground), incident angle, and parameter setting. Although the moving targets will cause an estimation error, the point number of such objects is commonly small and will not affect the estimation result.
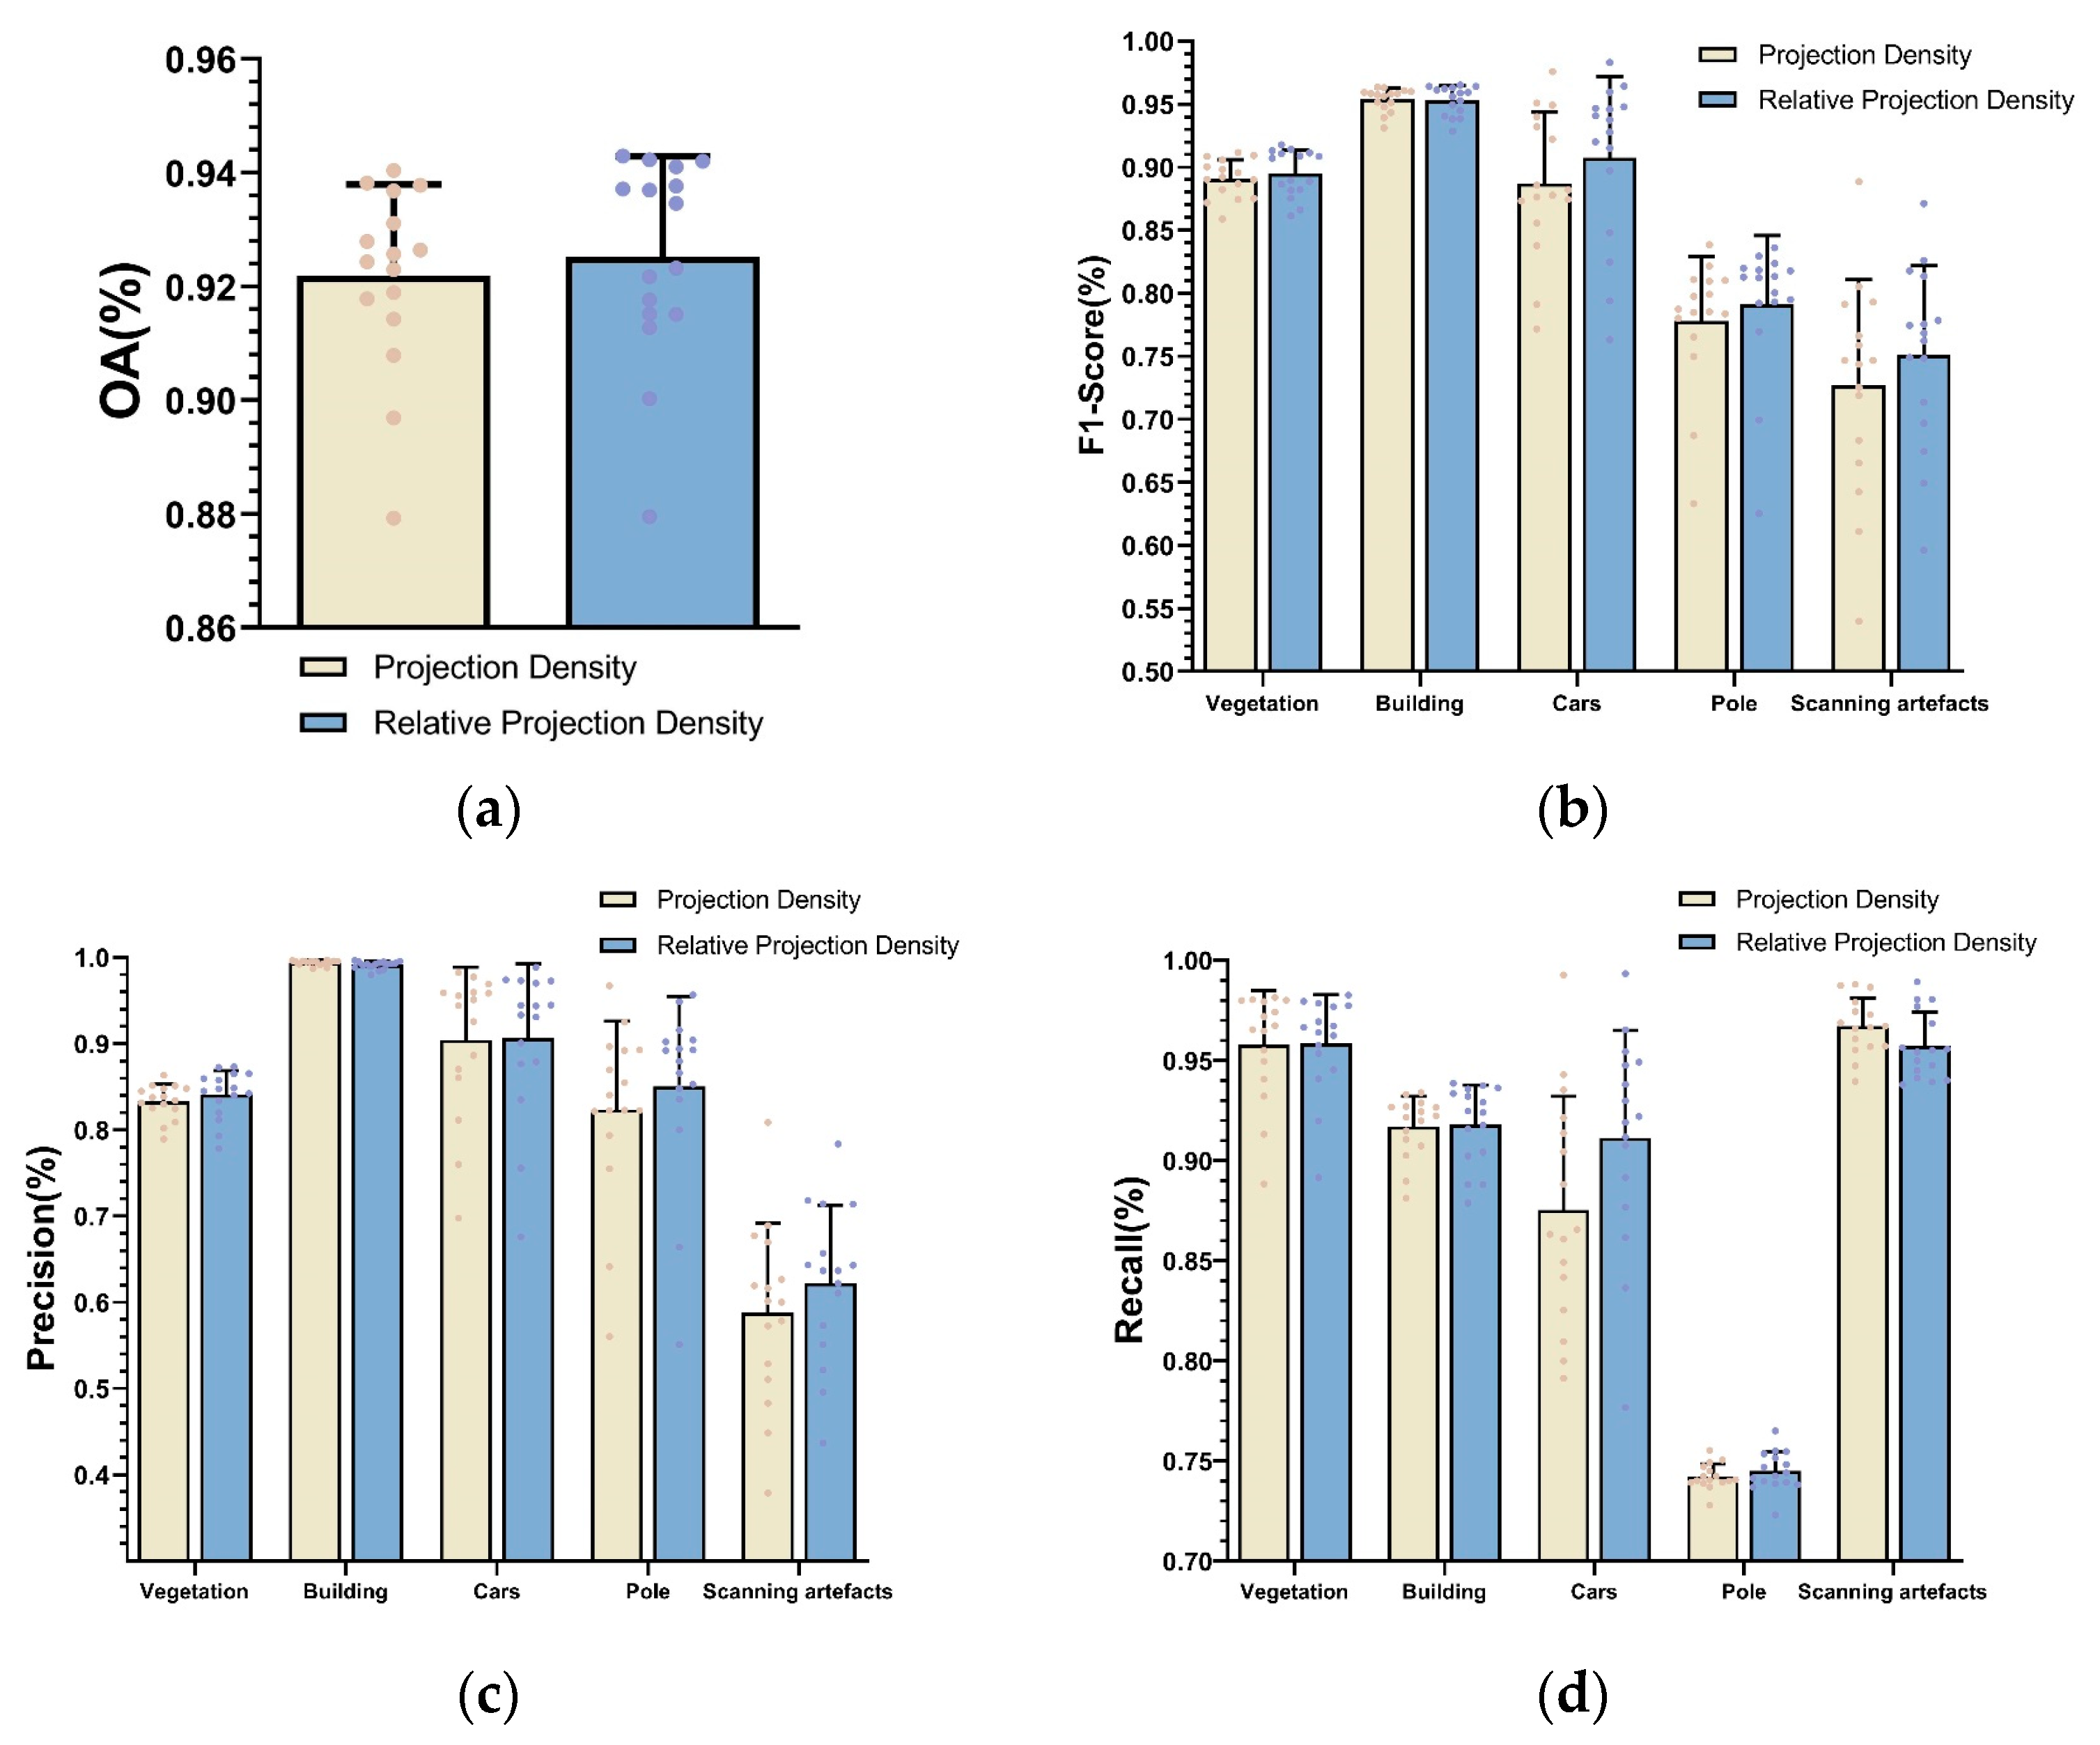
Focusing on the problem on the extraction of projection density, which is brought by density variation, a relative projection is proposed in step of feature extraction. Compared with traditional projection density, our approach improves the Overall Accuracy, F1-Score, Recall, and Precision by 0.33%, 1.23%, 0.61%, and 1.35%, respectively. Our experimental results show that our method improves the classification accuracy of small-size objects, such as cars, poles, and scanning artifacts, while ensuring the classification accuracy of buildings and vegetation. Since there are still some noise points in the final classification results, for future work, we can add some contextual information or combine smooth labeling methods to further optimize the results of the 3D scene analysis. Furthermore, a suitable feature selection method would be desirable.


