Technical Note

Tropical Cyclone Planetary Boundary Layer Heights Derived from GPS Radio Occultation over the Western Pacific Ocean

1
School of Atmospheric Sciences, Joint Center of Data Assimilation for Research Application, Nanjing University of Information and Science & Technology, Nanjing 210044, China
2
Earth System Science Interdisciplinary Center, University of Maryland, College Park, MD 20740, USA
*
Author to whom correspondence should be addressed.
Remote Sens. 2022, 14(23), 6110; https://doi.org/10.3390/rs14236110
Submission received: 16 November 2022 / Revised: 29 November 2022 / Accepted: 29 November 2022 / Published: 2 December 2022
(This article belongs to the Section Atmospheric Remote Sensing)

Abstract

:
According to GPS radio occultation data from previous studies, the height of the planetary boundary layer (PBLH) is defined as the altitude at which the vertical gradient of refractivity N is at its local minimum, called the gradient approach. As with its density, the atmosphere’s refractivity falls broadly exponentially with height. The spherically symmetric refractivity Nss(r) was established to account for the standard deviation of atmospheric refractivity with altitude. Ni is the residual from the fundamental vertical variations of refractivity, defined as Ni(r) = N(r)Nss(r). In this study, the vertical gradient of N is replaced by the vertical gradient of Ni to optimize the gradient approach, called the local gradient approach. Using the US radiosonde and Constellation Observing System for Meteorology, Ionosphere, and Climate (COSMIC) radio occultations (ROs) data from 2007–2011, these two PBLH-determining approaches are evaluated. The PBLHs estimated by the gradient approach and the local gradient approach have RMSE values of 0.73 km and 0.65 km, respectively. The PBLH obtained by the local gradient approach is closer to the radiosonde-derived value. In this paper, the COSMIC-2 ROs data and the western Pacific typhoon best track data are collocated in time and space during 2020–2021, and the axisymmetric composite structural characteristics of the tropical cyclone (TC) PBLs are analyzed. The lowest vertical gradients of N and Ni of TCs correspond closely with the average PBLHs. We find that the mean PBLHs of tropical depressions (TD), tropical storms (TS), and typhoons (TY) all have their local maxima at a radial distance of 125 km with heights of 1.03 km, 1.12 km, and 1.36 km, respectively. After 375 km, 575 km, and 935 km of TD, TS, and TY radial distances, the mean PBLHs become stable and cease to vary. The mean PBLH undulations increase significantly with the increase in tropical cyclone intensity. Niwet is the residual from the fundamental vertical variations of wet refractivity, defined as Niwet(r) = Nwet(r)Nsswet(r). Local minima of Niwet and Ni vertical gradients of TD, TS, and TY have comparable distributions and are concentrated between 0.5 km and 1 km.

1. Introduction

The planetary boundary layer (PBL) directly interacts with the Earth’s surface. It dominates the vertical exchange of substance, momentum, heat, and moisture between the Earth’s surface and the atmosphere [1], a crucial component of the atmospheric system. The planetary boundary layer height (PBLH) is an essential parameter of the PBL, which can describe many kinds of weather and climatological processes associated with the PBL in a region [2]. It has become one of the essential physical parameters for atmospheric numerical simulations and environmental evaluations [3].
The tropical cyclone (TC), one of nature’s deadliest and most destructive events, is a potent and profound tropical weather phenomenon. The PBL is essential for TC genesis and maintenance [4,5]. Several numerical studies have shown that the TC intensity and structure simulations are very sensitive to the formulation of the PBL schemes [6,7,8,9]. The formulation of a reasonable parameterization scheme for the PBL can improve the accuracy of the TC intensity forecast.
GPS dropsonde data are widely utilized to reveal the characteristics of the TC PBLstructure. Zhang et al. [10] studied the thermodynamic and kinematic structures of the hurricane boundary layer. They defined the kinematic boundary layer height as the inflow layer depth, the maximum tangential wind speed height, and the thermodynamic boundary layer height as the mixed layer depth. Their results show that both the thermodynamic boundary layer height and the kinematic boundary layer height decrease with decreasing the radius to the storm center. Ming et al. [11] examined the typhoon boundary layer over the western Pacific Ocean. They found that the PBLH scale of typhoons tends to decrease toward the storm’s center. It is confirmed that the conceptual model of hurricane PBLH variation proposed by Zhang et al. [10] is applicable in typhoon conditions. Ren et al. [12] compared the results of PBLHs for three TC strength classes. Chen et al. [13] proposed a helicity-based method to determine the TC PBLH and found that it is closest to the maximum tangential wind speed height.
The PBLHs are generally determined using vertical profiles of meteorological elements such as temperature, humidity, and wind speed. The PBL structure is determined by various processes (turbulence, radiation, baroclinity, advection, divergence, associated vertical motions, etc.) that may influence the vertical profiles of different mean and turbulent atmospheric parameters [14]. Due to its complexity, there has been no consensus on what should define the PBLH in the research community. The data from radiosondes are generally reliable and accurate, and they are a crucial piece of PBL observational equipment. However, the occasional observation times and uneven and sparse distributions of observation stations make it difficult to research the relevant information over the ocean and plateau areas. With the development of remote sensing technology, detection methods such as the AIRS (Atmospheric Infrared Sounder), the MODIS (Moderate Resolution Imaging Spectroradiometer), the GLAS (Geoscience Laser Altimeter System) onboard ICESat (Ice, Cloud and Land Elevation Satellite), and CALIPSO (Cloud-Aerosol Lidar and Infrared Sounding Satellite Observations) play an essential role in the PBL detection [15,16,17,18]. However, there are also problems, such as low vertical resolution, which cannot be applied to all weather processes.
The Global Positioning System Radio Occultation (GPS RO) observations with unique global coverage, high accuracy, high vertical resolution, long-term stability, and all-weather observations provide new opportunities to develop global PBLH datasets [2,19]. The COSMIC-2 offers unprecedented opportunities to understand the PBL structures of TCs by providing abundant observational data (bend Angle, refractivity, temperature, and water vapor) over the tropical ocean. The next-generation COSMIC-2 occultation receiver was launched on 25 June 2019. It features more powerful satellite antennas and higher sampling frequencies to obtain 4000–5000 tropical and subtropical atmospheric profiles per day [20]. COSMIC-2 occultation profiles can reach very low altitudes (near the ocean surface) thanks to a more advanced open-loop tracking technology [21].
Basha and Ratnam [22] proposed the refractivity profiles to identify the PBLHs. In addition, they found high correlations in all weather conditions between the PBLHs detected using N and those identified using traditional methods such as potential, virtual potential temperature, and mixing ratio. Guo et al. [23] proposed the breakpoint method to determine the PBLH and studied the PBL characteristics of tropical and subtropical oceans. Their results confirmed that the spatial patterns of the variations are consistent with those derived from ECMWF global analysis. Xie et al. [24] pointed out that the vital moisture and temperature gradients in the vertical direction resulted in a sharp refractivity gradient, and the gradient method was not affected by the N-bias. They found the gradient method is effective in determining the PBLH. Ho et al. [25] compared the gradient and breakpoint methods. They found that the spatial and temporal variations of the marine boundary layer height (MBLH) determined from the RO observations were consistent with those from the Cloud-Aerosol Lidar with Orthogonal Polarization (CALIOP) and the radiosondes. The results show that the gradient method is more accurate than the breakpoint method.
As the gravity of the upper atmosphere squeezes the atmosphere at lower altitudes, the atmosphere becomes denser with lower altitudes. The atmospheric refractivity, therefore, has a fundamental change with altitude. Spherically symmetric refractivity was developed to depict a reference change of refractivity with altitude [26]. Compared with N, Ni representing the residual from the fundamental vertical variations of refractivity is more conducive to highlighting the local variation characteristics of the atmosphere and the influences of different weather conditions on the vertical gradient of refractivity and is more suitable for determining the PBLH. In this paper, the COSMIC ROs data are collocated in space and time with the US radiosonde data. The collocated data are used to verify the reliability of the local gradient approach, which uses Ni to determine the PBLH. The approach is also used to determine the PBL axisymmetric structures of TCs over the western Pacific.
The paper is arranged as follows. Section 2 describes the GPS ROs, radiosonde, typhoon best track data employed in this study, and the quality control procedure used to remove outliers. The traditional and the new PBLH determination approaches are provided in Section 3. Section 4 discusses the variational characteristics of TC PBLHs during the TD, TS, and TY phases. A summary and conclusions are provided in Section 5.

2. Data Description and QC

2.1. Data Description

The COSMIC ROs data during a 6-year period from 2007 to 2011 and COSMIC-2 ROs data during a 2-year period from 2020 to 2021 used in this study are provided by the COSMIC Data Analysis and Archival Center (CDAACC) [27]. The COSMIC satellite, launched on 15 April 2006, consists of six low Earth orbit (LEO) microsatellites [28]. The COSMIC-2 was successfully launched on 25 June 2019. It has an orbital inclination of 24° and provides more than 4000 atmospheric profiles per day within ±45° latitudes. Both COSMIC and COSMIC-2 adopt the open-loop processing technology, improving the accuracy of radio occultation signals and dramatically increasing the amount of data in the lower tropical atmosphere [29], allowing for a more comprehensive analysis of the structural characteristics of the PBL. The level-2 product wetPrf/wetfP2 and atmPrf of COSMIC/COSMIC-2 were used in the study. These products include refractivity, bending angle, temperature, pressure, water vapor pressure, and other vertical profiles. The vertical resolutions of wetPrf and wetfP2 are 100 m and 50 m below 20 km, respectively. For uniformity, the wetfP2 data are interpolated to a resolution of 100 m. For more detailed information, please refer to the website https://cdaac-www.cosmic.ucar.edu (accessed on 1 March 2022).
Radiosonde data for 2007 to 2011 were obtained from the National Climatic Data Center (NCDC) radiosonde dataset. The radiosonde measurements, including pressure, temperature, relative humidity, and wind speed, are gathered every 6 s with a vertical resolution of approximately 30 m. The radiosonde data are interpolated to a resolution of 100 m.
The best track data of western Pacific typhoons during 2020–2021 used in this paper are provided by the Joint Typhoon Warning Center (JTWC). It is included in the International Best Track Archive for Climate Stewardship (IBTrACS). The data include the center position, maximum wind speed, minimum pressure, and intensity of the typhoon, which are important information for analyzing TCs. The agency classifies TCs according to their wind speed: tropical depression (TD, magnitude 6–7), tropical storm (TS, magnitude 8–11), and typhoon (TY, magnitude 12–17).

2.2. Data Collocation

The US radiosonde data are utilized to verify the validity of the GPS ROs data used to determine the PBLH. Since the PBLH is affected by the underlying surface, and the land surface is complex, only the profiles over the ocean are selected to collocate in this paper. Due to the low PBLH at night, only the daytime profiles are selected for analysis. The collocation criteria between radiosonde and COSMIC RO profiles are a temporal difference of less than 2 h and a spatial distance of less than 200 km during a 6-year period from 2007 to 2011. GPS RO refractivity measurement represents an integrated refraction effect of the atmosphere along a ray path within a few hundred kilometers long and 1.5-km diameter tube centered at the perigee point (i.e., the point on the ray path that is closest to the Earth’s surface). GPS RO measurements have a horizontal resolution of about 300 and 1.5 km along ray path and cross-ray directions, respectively [19]. The verification co-locations are made during quiet conditions.
Referring to Yang et al. [30], we constructed the TC composite field data based on the collocation criteria of the best track data of TC cases and COSMIC-2 RO profiles during 2020–2021 with a temporal difference of less than 3 h and a radial distance of less than 1000 km from TC centers. The composite analysis technique is the primary approach for TC PBL studies, which provides an overview and characterization of the problem under study.

2.3. Quality Control

Due to the high water vapor content in the tropical lower troposphere, substantial local gradients of refractivity frequently occur, causing GPS RO ray paths to intersect with rays above, below, or both. This occurrence will be called impact multipath [31,32]. Multipath typically increases the total spectrum width [33], which means that the local spectrum width (LSW) is more remarkable. Liu et al. [34] pointed out that the LSW is used to characterize the uncertainty of retrieved bending angle and refractivity profiles and proposed an LSW-based quality control procedure for eliminating low-quality data from data assimilation. Using GPS ROs data, Yang et al. [30] investigated TC temperature and water vapor structures. Comparing the results before and after quality control, they discovered that the warm-core architectures of TCs would be significantly distorted if outliers were not deleted.
The quality control procedure in this paper will be performed in four steps. The first step of quality control eliminates any data with negative refractivity. In the second step, the bi-weight method proposed by Lanzante [35] and applied to COSMIC RO data by Zou and Zeng [36] is utilized to estimate the mean and standard deviation, and points with deviations from the bi-weight mean exceeding four times the standard deviation are eliminated. The third step is to eliminate GPS ROs profiles with higher than 500 m of down-probing heights so that the profiles’ lowest measurements fall within the PBL. In the fourth step, the RO observation errors are measured using LSW/α (referred to as LSW hereafter) using the exact definition as in the Liu et al. [34] article, and PBLHs with LSW values exceeding 30 percent are eliminated. α is the variable bending angle in the atmPrf file.

3. Methodology

3.1. Traditional Definitions for PBL Height from GPS ROs

Radiosonde data are crucial for acquiring PBL information. Due to the immense potential temperature gradient near the top of the PBL [37,38], the PBLH is typically determined as the height corresponding to the maximum potential temperature gradient in local maximum values. This technique is known as the potential temperature gradient approach. The potential temperature and potential temperature gradient can be expressed as follows:
θ = T ( P 0 P ) κ
θ z = ( P 0 P ) κ T z κ P 0 κ T ( 1 P ) 1 + κ P z
where: P is the pressure (unit: hPa); T is the temperature (unit: K); P0 is the standard pressure, often taken as 1000 hPa, κ κ d = 0.286.
There are often different definitions of the PBLH. Xie et al. [24] demonstrated that the refractivity of GPS RO data contains temperature and moisture information. There are often abrupt temperature and water vapor changes at the top of the PBL, so the gradient of temperature or water vapor is generally used to determine the PBLH [39]. The PBLH is the height at which the minimum vertical refractivity gradient in local minimum values is located. The PBLH determined by the refractivity gradient is more accurate than the temperature or water vapor gradient alone. We name the approach of determining the PBLH by the refractivity gradient as the gradient approach. The atmospheric refractivity N is a function of temperature and water vapor [40] and consists of a dry Ndry and a wet Nwet term. The refractivity and the vertical refractivity gradient can be expressed as follows:
N = a 1 ( P T ) + a 2 ( P W T 2 ) = N d r y + N w e t
N z = N d r y z + N w e t z
N d r y z = a 1 1 T P z a 1 P T 2 T z
N w e t z = a 2 1 T 2 P w z 2 a 2 P w T 3 T z
where: P is the pressure (unit: hPa); Pw is the water vapor pressure (unit: hPa); T is the temperature (unit: K); with constants a 1 = 77.6   KhPa 1 , a 2 = 3.73 × 10 5   K 2 hPa 1 .
This study examines two scenarios of typical COSMIC RO and radiosonde profiles to demonstrate the applicability and limits of the traditional gradient approach for calculating the PBLH.
The radiosonde/RO co-location 1 gradient profiles of potential temperature and refractivity are displayed in Figure 1. The PBLHs are determined by the potential temperature gradient approach and the gradient approach. On 30 January 2010, the radiosonde event occurred at 2300UTC, 156.8°W, 71.3°N, while the radio occultation event (RO1) occurred at 2326UTC, 157.0°W, 71.6°N. It can be seen that the two PBLHs are the same, 0.50 km. It is consistent with the findings of several earlier research, indicating that the gradient approach is reliable for determining the PBLH.
Figure 2 shows the radiosonde/RO co-location 2 profiles of the potential temperature gradient, the refractivity gradient, and RO2 of the specific humidity and temperature. The radiosonde profile for the radiosonde/RO co-location 2 profile was observed at 2300UTC on 11 March 2007, and was located at (156.8°W, 71.3°N). The radio occultation event (RO2) occurred at 2108UTC on 11 March 2007, and was located at (160.3°W, 71.9°N). The PBLHs determined by the two data are 1.30 km and 0.70 km, respectively, and they differ significantly. As seen in Figure 2d, there is an inversion layer between 0.50 km and 1.7 km for the temperature profile of RO2. Among them, the inversion layer of 1.2 km–1.4 km is the strongest. In Figure 2c, below 1.7 km the rate of decrease of specific humidity is reaching the maximum is around 1.4 km–1.7 km. Combined with the temperature and water vapor changes, it is more reasonable to set the PBLH at about 1.4 km. However, due to the small vertical gradients of temperature and water vapor, the refractivity gradient reaches a minimum of 0.7 km under the influence of the pressure gradient. It can be seen from Figure 2b that the refractivity gradient values at these two heights are similar. The PBLH determined from the radiosonde data in Figure 2a also shows that it is more reasonable to set the PBLH at about 1.4 km. This indicates that the gradient approach has some defects and needs further improvement.

3.2. Optimization Approach Definition of Boundary Layer Height

In Xu and Zou [26], spherically symmetric refractivity was introduced to describe the fundamental variation of refractivity with altitude due to the different densities of upper and lower atmospheres. The spherically symmetric refractivity is defined as the global average of the refractivity at the same r, where r is the distance from the Earth’s center at each profile point, r = z + r0, where r0 is the radius of the earth. The spherically symmetric dry refractivity and spherically symmetric wet refractivity are defined similarly. Their expressions are shown below:
N s s ( r ) = N ( n ( r ) ) ¯
N s s d r y ( r ) = N d r y ( n ( r ) ) ¯  
N s s w e t ( r ) = N w e t ( n ( r ) ) ¯  
The subscript “ss” indicates it is the spherically symmetric refractivity. The subscripts dry and wet represent the dry and wet terms, respectively; where “n(r)” represents the nth observation point with distance r to the center of the earth. At the same r, different n(r) observation points correspond to longitudes, latitudes, and times. The “¯” denotes the global average of variables at the same r. The spherically symmetric refractivity Nss(r) is important to account for the standard deviation of the atmospheric refractivity with height. For an atmosphere of spherical symmetry, the refractivity is assumed to be a continuous function of the geocentric radial distance r.
Compared with N, Ni, which represents the residual from the fundamental vertical variations of refractivity, is more conducive to highlighting the local variation characteristics of the atmosphere and the influences of different weather conditions on the vertical gradient of refractivity and is more suitable for determining the PBLH. To improve the gradient approach, this paper uses the Ni gradient to determine the PBLH. The approach of determining the PBLH based on the Ni gradient is called the local gradient approach. Nidry and Niwet represent the residuals from the fundamental vertical variations of dry refractivity and wet refractivity, respectively. Ni, Nidry, and Niwet can be expressed as follows:
N i ( r ) = N ( r ) N s s ( r )
N i d r y ( r ) = N d r y ( r ) N s s d r y ( r )  
N i w e t = N w e t ( r ) N s s w e t ( r )  
where Nss(r), Nssdry(r), and Nsswet(r) are the spherically symmetric refractivity, dry refractivity, and wet refractivity. The individual refractivity profile is only a function of r. Equations (10)–(12) refer to the individual profile only. Figure 3 depicts the profiles of the spherically symmetric refractivity and the vertical gradient of the spherically symmetric refractivity on 2 January 2008. They hardly changed over time.

3.3. Validation

For the case of Figure 2 (RO2), we use the local gradient approach to calculate its PBLH, as shown in Figure 4. The PBLH calculated using the local gradient approach is 1.40 km, closer to the PBLH calculated using radiosonde data than the gradient approach. The outcome is consistent with the previous analysis. The PBLH of the case of Figure 1 (RO1) calculated using the local gradient approach is 0.50 km, which is the same as the PBLHs calculated using the gradient and the potential temperature gradient approaches (figure omitted). It demonstrates that our hypothesis that Ni, which reflects the local variable characteristics of the atmosphere, is more suitable than N for determining the PBLH is valid.
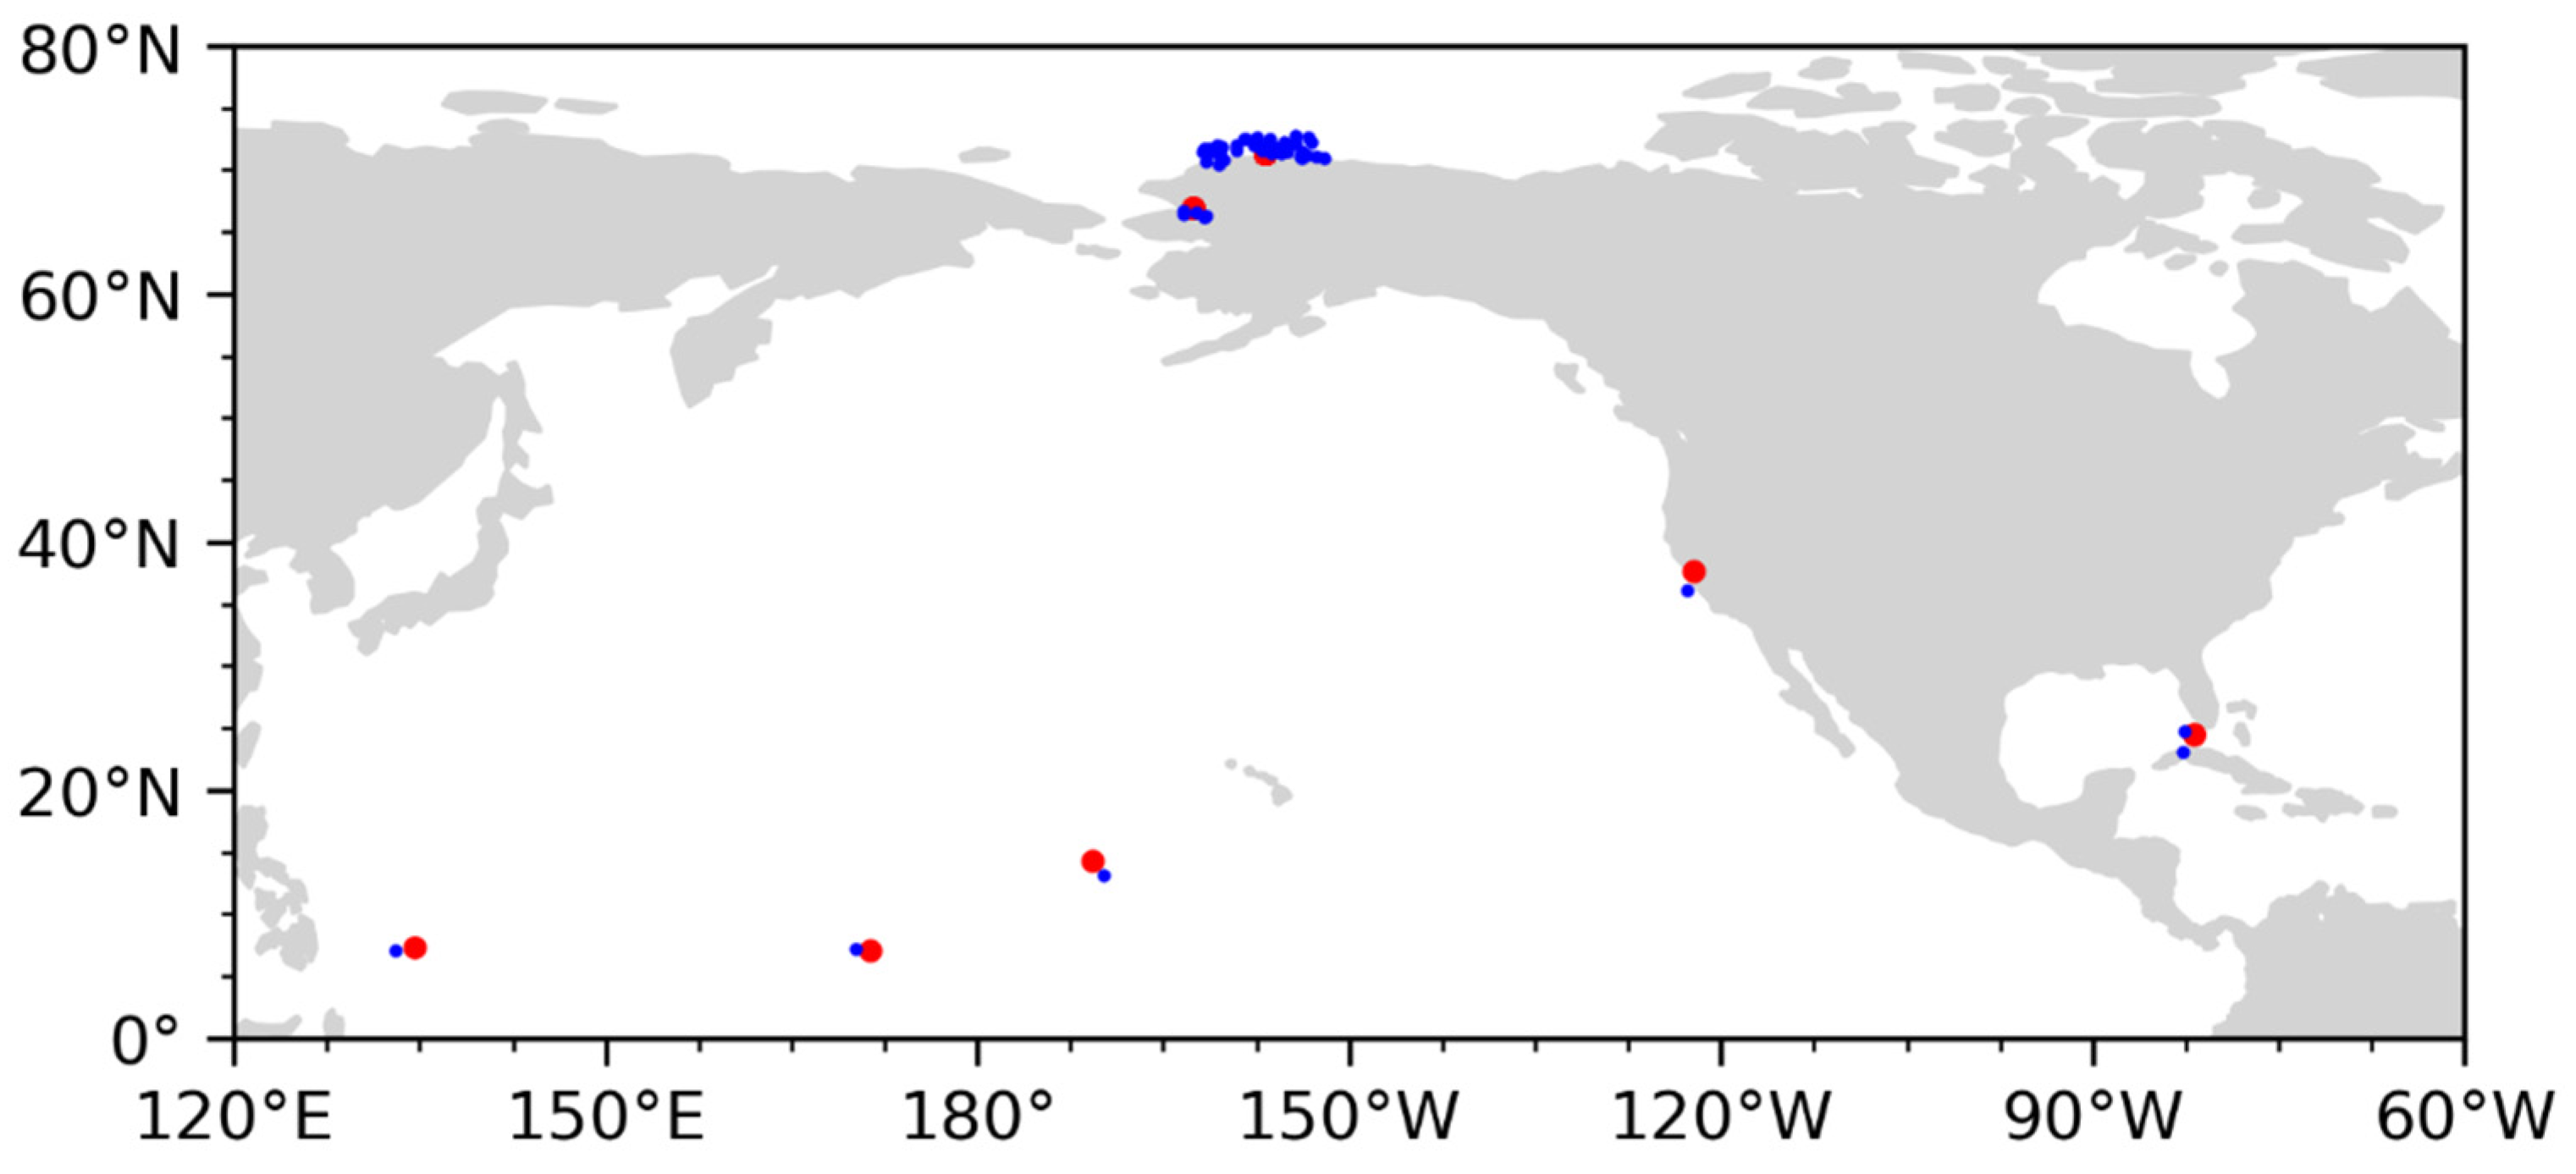
Figure 5 shows the spatial distributions of the collocated COSMIC ROs and US radiosonde data over the daytime ocean after the first three steps of the quality control during a 6-year period from 2007 to 2011. It is noticed that the collocated profiles are mainly distributed near the small islands and the coasts. The RO profiles are dispersed across the ocean surface offshore, whereas the radiosonde profiles are distributed along the coastlines.
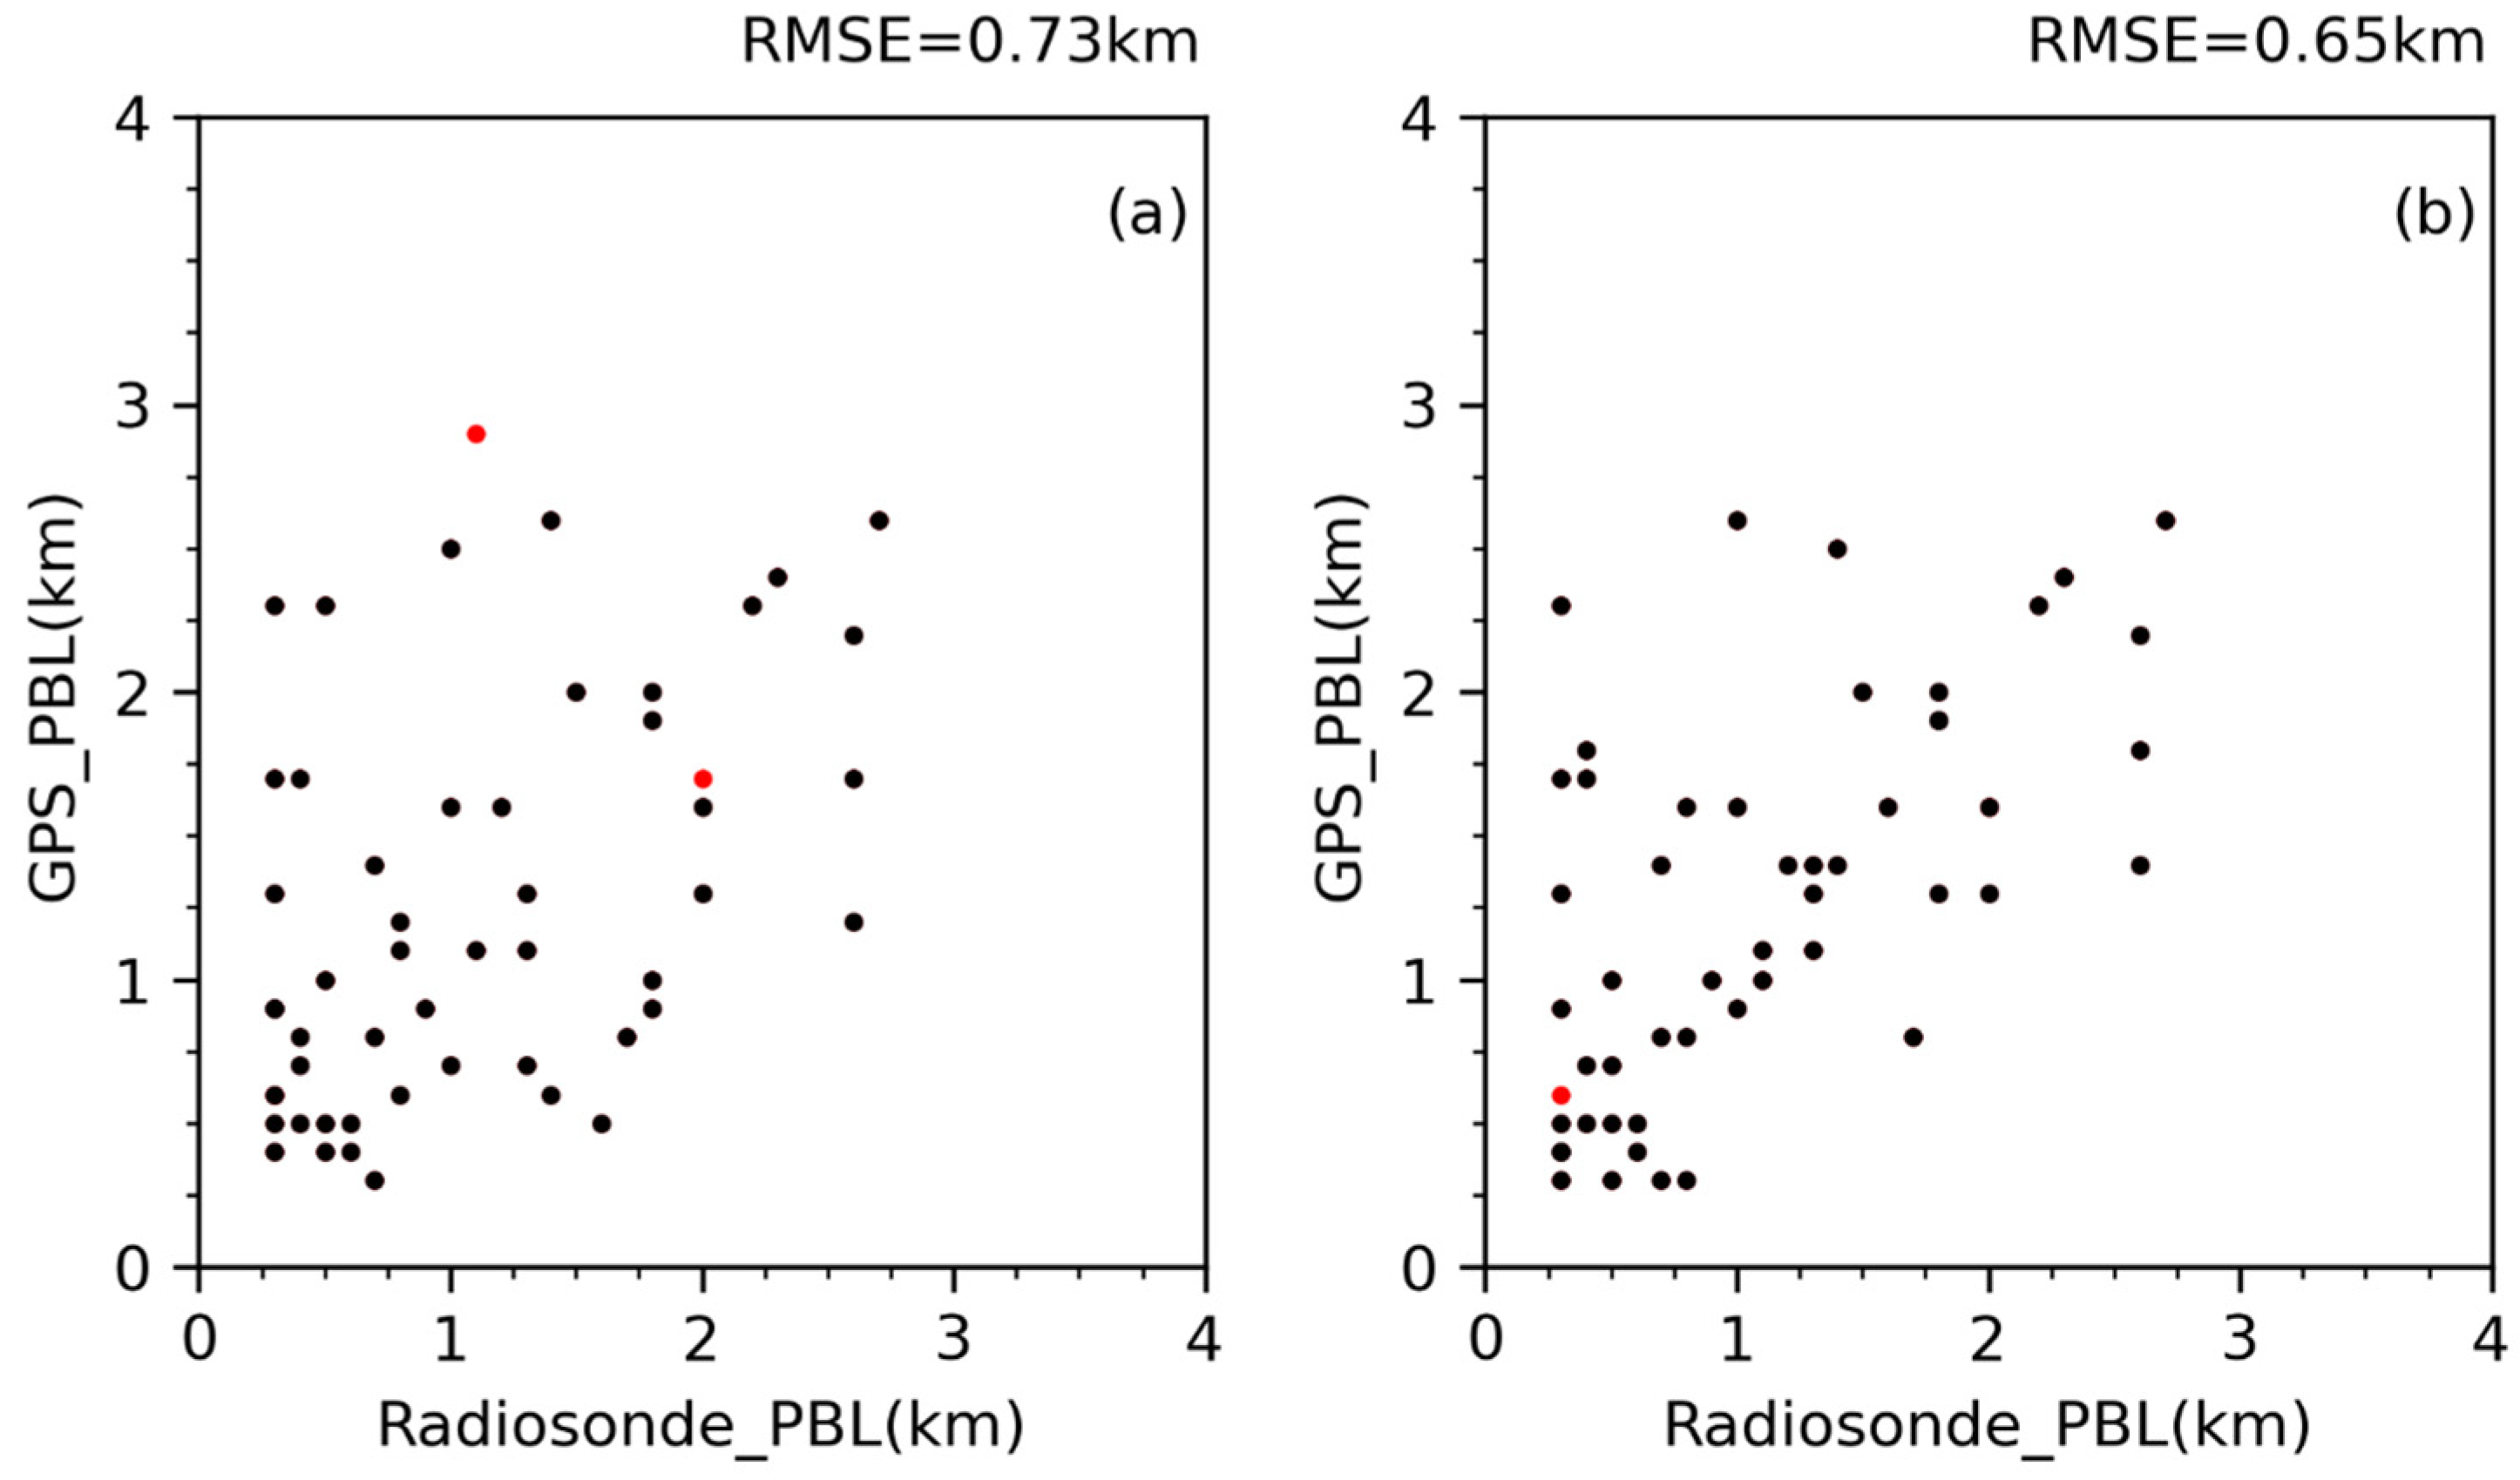
The scatter plots of the PBLHs are obtained by statistical analysis of the COSMIC RO and radiosonde collocation dataset, as shown in Figure 6. The red dots indicate the data excluded for LSW > 30%, and the black dots are the final calculation results. The number of profiles after the fourth quality control step in Figure 6a,b are 50 and 51, respectively. The PBLHs estimated by the local gradient approach of COSMIC ROs data are higher than those estimated by the potential temperature gradient approach of the radiosonde data. This could be caused by the relatively high down-probing heights of the COSMIC ROs data. The PBLHs estimated using the local gradient approach are closer to the potential temperature gradient approach and are superior to those derived by the gradient approach. Figure 6a,b demonstrate that the Root Mean Square Error (RMSE) drops from 0.73 km to 0.65 km. It further indicates Ni is more appropriate than N for identifying the PBLH.

4. Composite Structure of PBL Structure in Tropical Cyclones

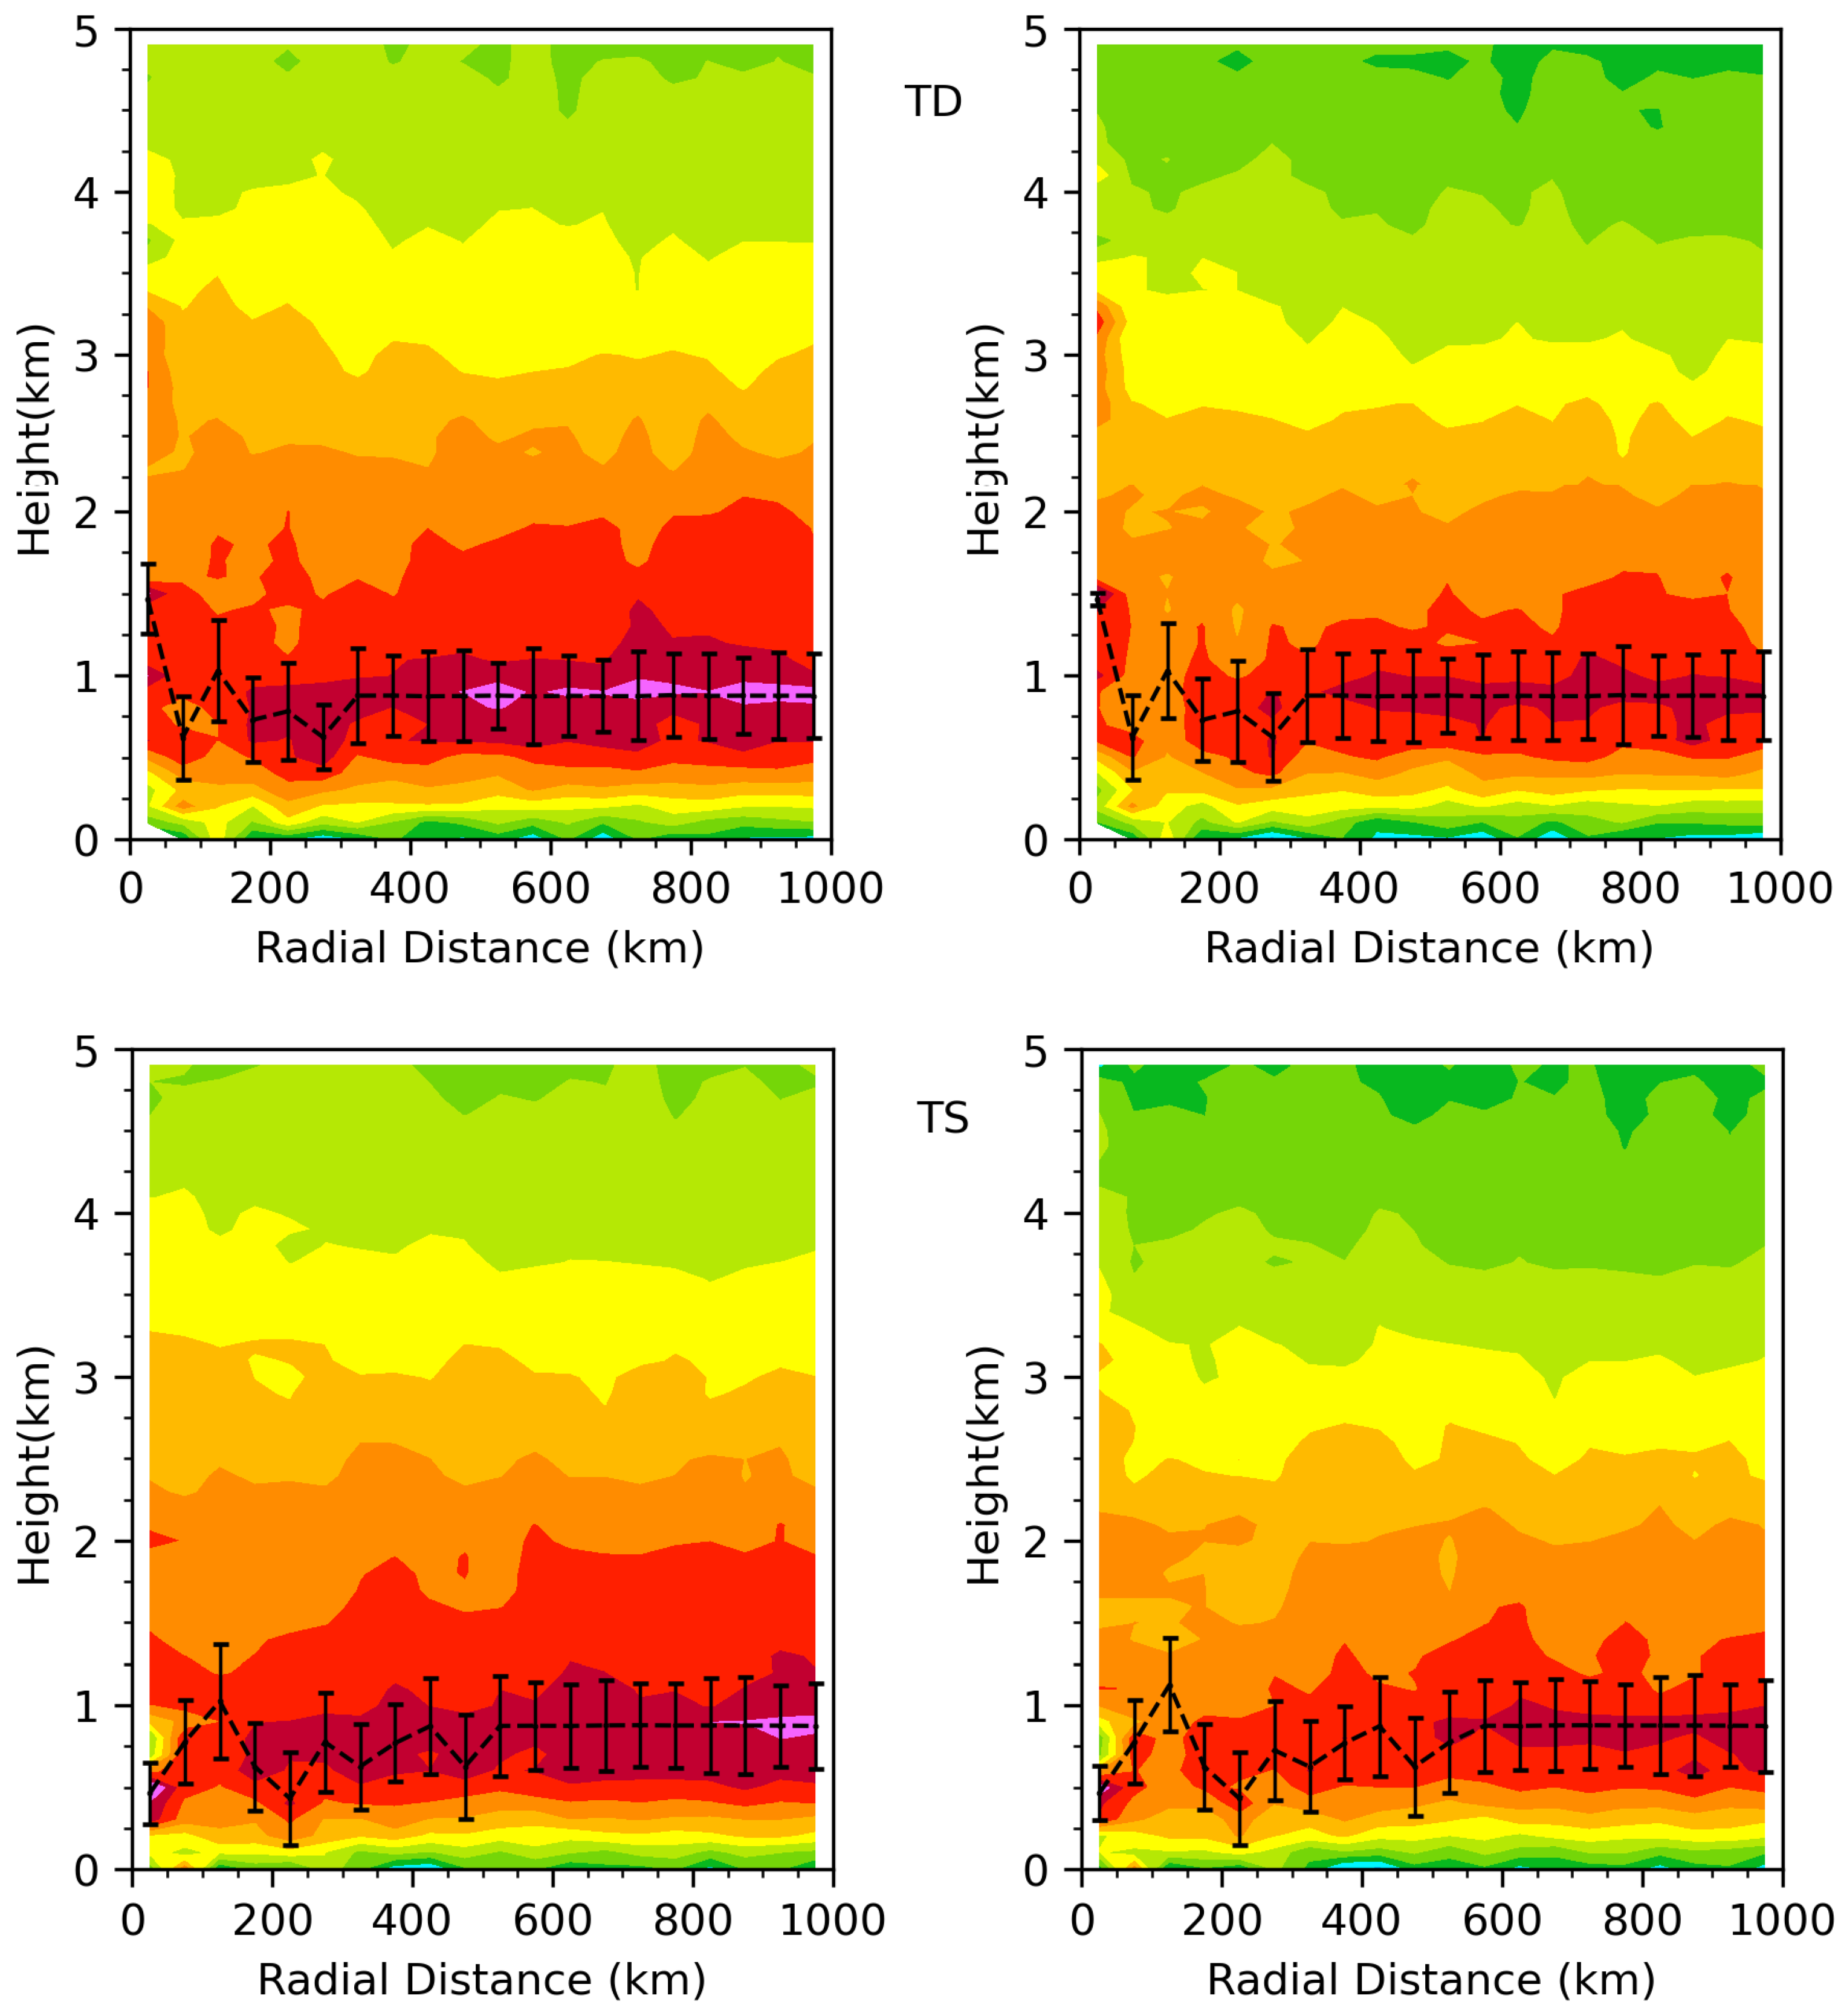
Several studies have shown that TCs’ kinematic and thermodynamic boundary layer heights tend to decrease with decreasing radial distances within 200 km of the hurricane’s center [10,11,12,13,41,42]. This phenomenon may be due to the convective downdrafts in the TC eyes [9,43,44]. Figure 7 illustrates the mean convective PBLHs derived at each 50-km radial radius using this study’s composite field data which includes rived at each 50-km radial radius using this study’s composite field data which includes multiple TCs and numerous profiles for TCs from 2020 to 2021. We assume that the TCs are axisymmetric structures. In Figure 7, the mean convective PBLHs of TS and TY also reflect this property, which is consistent with the previous study’s findings. Previous research has demonstrated that turbulent fluxes approach zero at the kinematic PBLHs, which are more reflective of the PBLHs of TCs [45,46]. The PBLHs calculated in this research for convective typhoons are comparable in magnitude to the kinematic PBLHs explored by earlier papers utilizing GPS dropsonde data and are greater than the thermodynamic PBLHs [10,11,12,13,41,42].
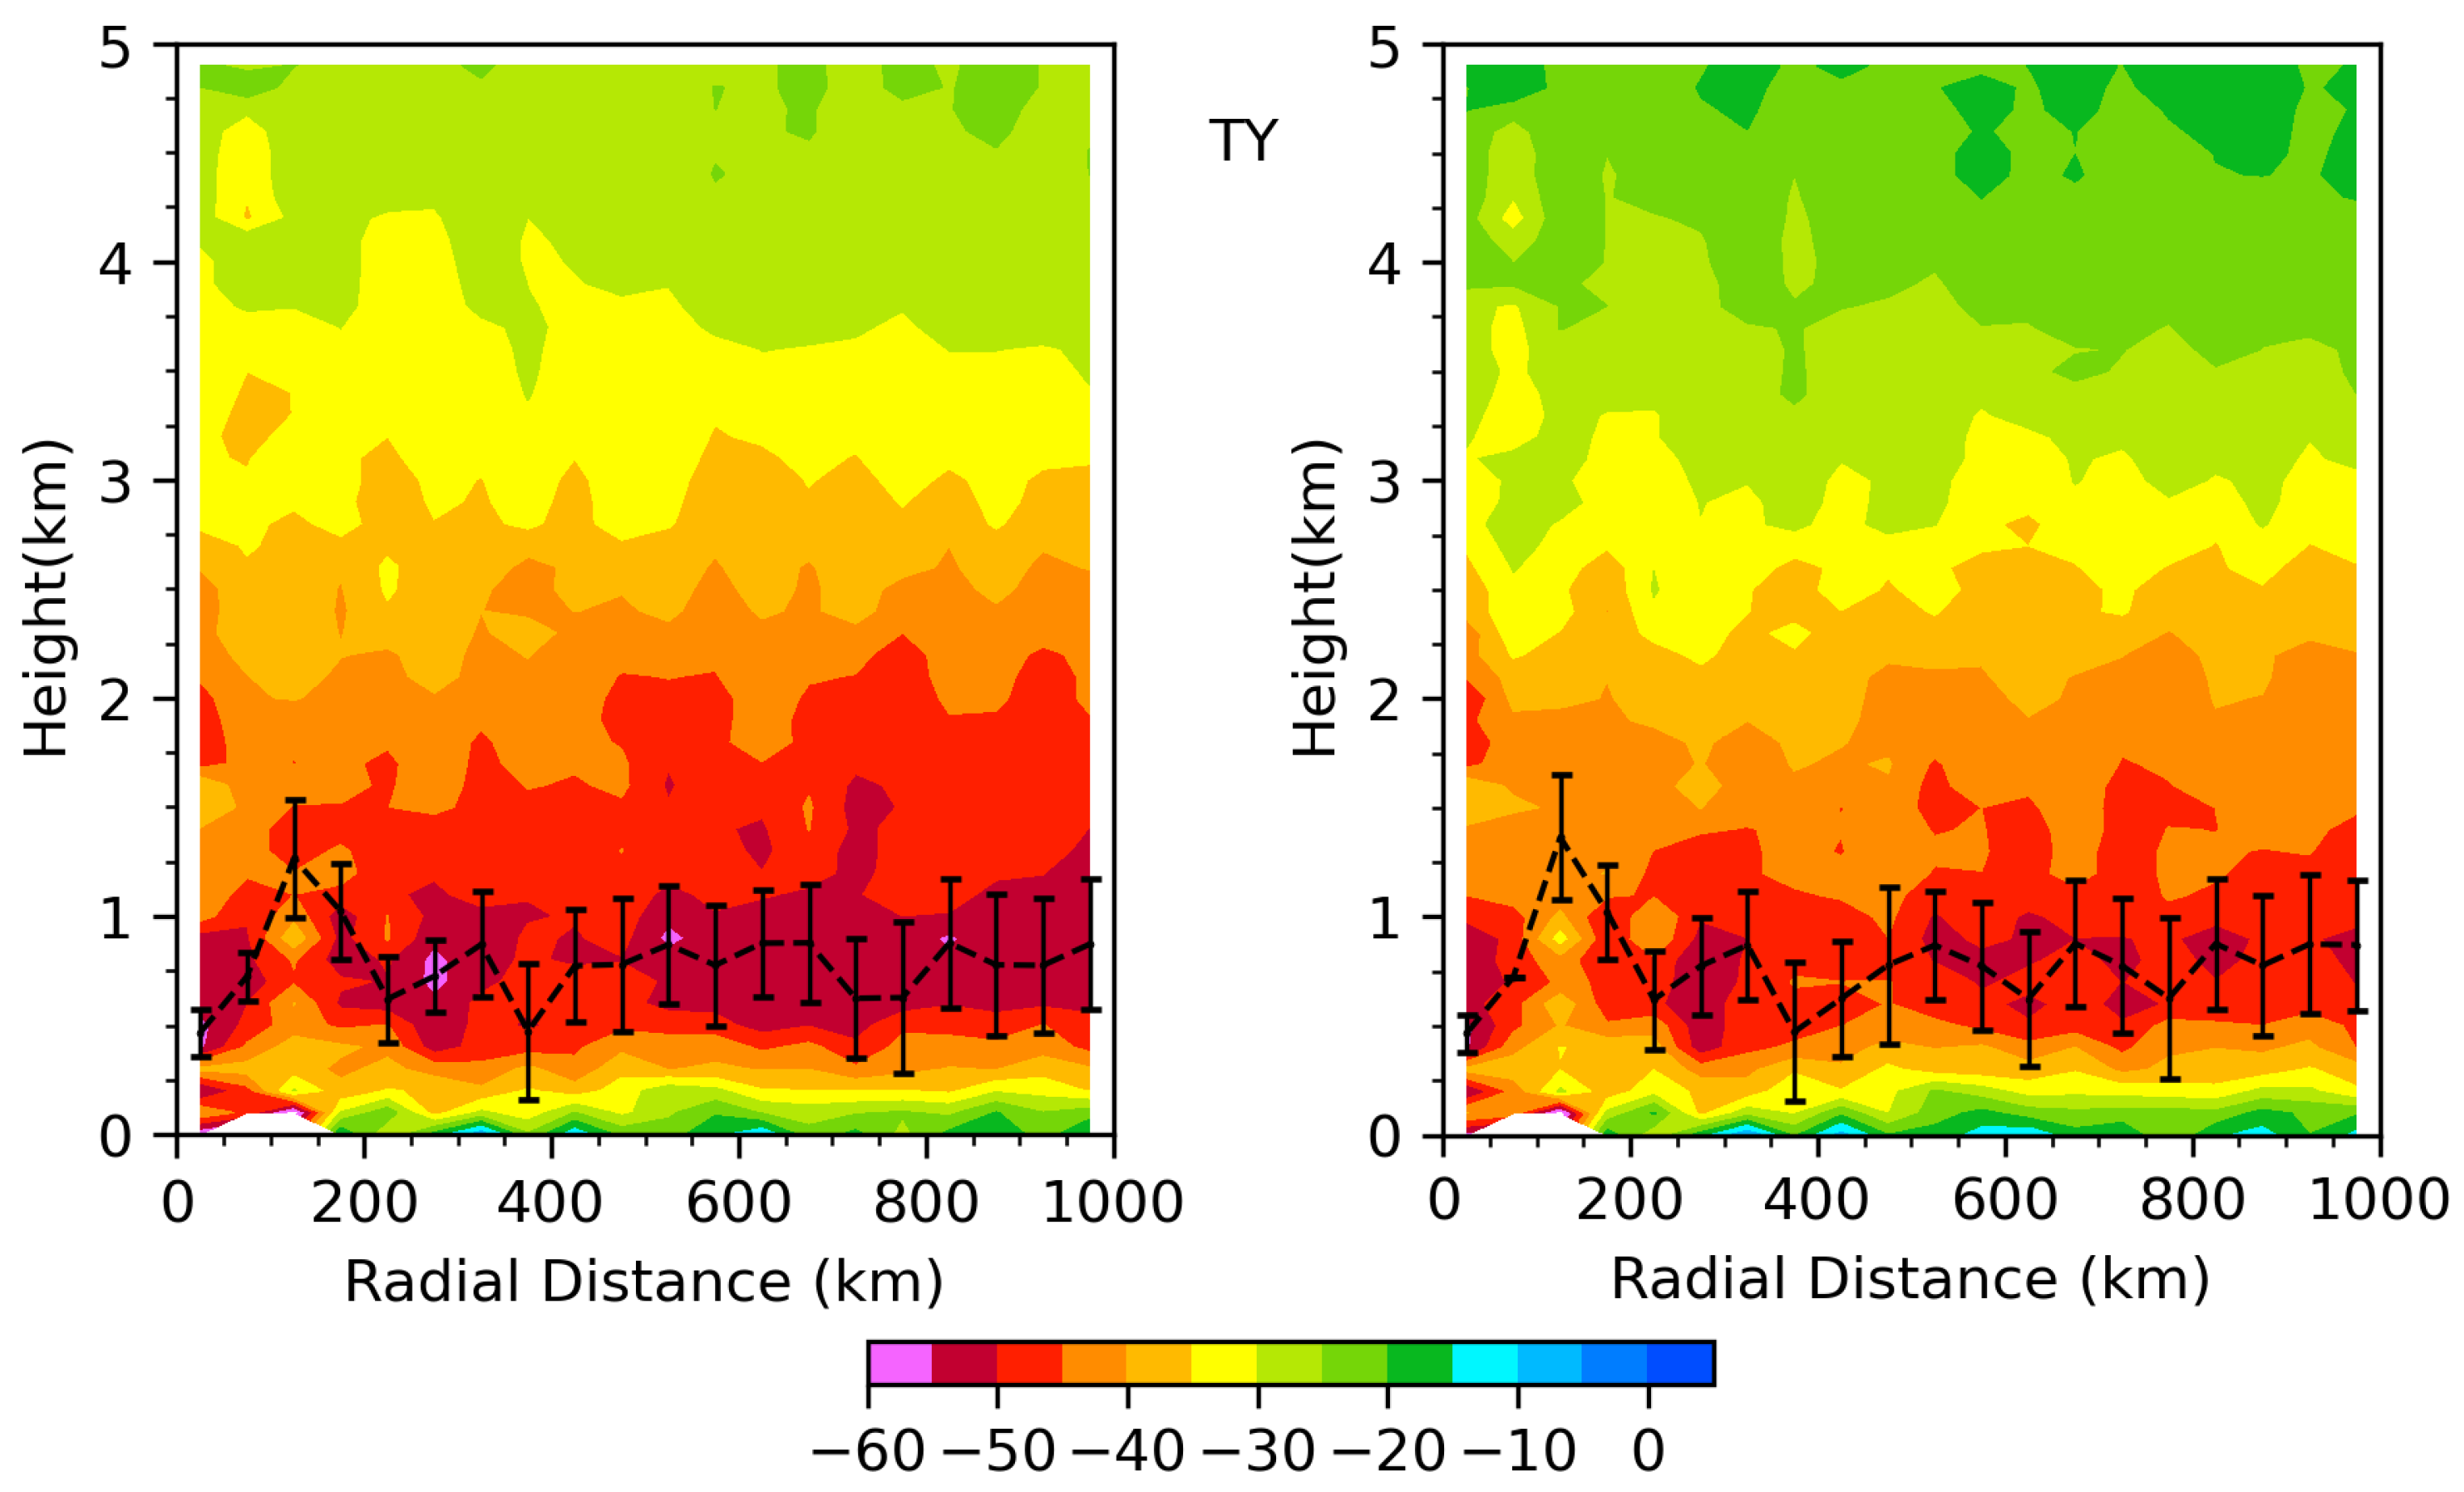
Figure 7 shows composite N and Ni vertical gradients cross sections and averages and 0.5 times standard deviations of convective PBLHs for the TD, TS, and TY categories calculated by collocated COSMIC-2 RO data in each 50-km radial distance over the western Pacific during 2020–2021. As can be seen from Figure 7, the error bars are calculated from the averages ± 0.5 times the standard deviations of convective PBLHs and vary less over the radial distance. The lowest vertical gradients of N and Ni of TCs can correspond well with the mean PBLHs. The lowest vertical gradients of TCs are mainly located between 0.5 km and 1 km. The minimums of vertical gradients of Ni, which subtracted the fundamental vertical variation of refractivity, look more precisely located than that of N, and the band distributions can be visualized in the radial direction.
The followings are the composite structure of PBLH determined by the local gradient approach. The mean PBLHs of TD (upper right of Figure 7), a maximum value of 1.47 km, exist at a radial radius of 25 km. This should be related to the updraft of the convective cloud cluster. The mean PBLHs exhibit undulating variations as radial distance increases. At radial distances of 125 km and 225 km, the local maximums are 1.02 km and 0.78 km, respectively. They may correspond to the updrafts at the convective cloud cluster and vortex cloud band. After 375 km of radial distance, the mean PBLHs become stable and cease to vary.
Developing to the TS phase (middle right of Figure 7), the mean PBLHs exist at a small value of 0.46 km at a radial distance of 25 km, which is opposite to the result of the TD phase. It could mean that as the eye area appears, there is a decrease in the central PBLH caused by the downward motion of the tropical cyclone when the TD develops into TS. At the radial distances of 125 km, 275 km, and 425 km, there are local maximums of 1.12 km, 0.73 km, and 0.87 km, which may correspond to the updrafts at the eyewall, inner spiral cloud band, and outer spiral cloud ring, respectively. The inner spiral cloud band PBLH is lower than the outer spiral cloud ring PBLH, which may be due to the dry and cold air carried by precipitation. After 575 km of radial distance, the mean PBLHs become stable and cease to vary. The fact that this stabilization happens at a greater distance than in the TD case indicates that the radius of TS expands relative to TD.
With the further strengthening of TC intensity, the mean PBLH at the radial distance of 25 km is similar to that of the TS phase, with a minimum value of 0.47 km present by the TY phase (bottom right of Figure 7). This value is highly close to the height of the maximum tangential wind speed of the TY calculated by Ming et al. [11]. Compared to the TS phase, the local maximum at the radial distance of 125 km increases to 1.36 km, which may be related to the enhancement of the updraft in the eyewall. This value is more significant than the maximum tangential wind height of the typhoon calculated by Ming et al. [11]. A local maximum of 0.87 km occurs at the radial distances of 325 km and 525 km. A local maximum of 0.88 km occurs at the radial distances of 675 km and 825 km. The latter is slightly higher than the former. They could correspond to the updrafts at the inner spiral cloud band and outer spiral cloud ring, respectively. After 935 km of radial distance, the mean PBLHs become stable and cease to vary. During the TY phase, the range and intensity of each structure of the TC increased. According to Knaff et al. [47], more intense TCs had bigger mean size distributions. This is comparable to the findings in this paper. Chavas et al. [48] and Schenkel et al. [49] examined the radiuses of tropical cyclones, the majority of which are between 150 km and 1000 km, and the radii at which the mean PBLHs become stable and stop to vary in our study fell within this range.
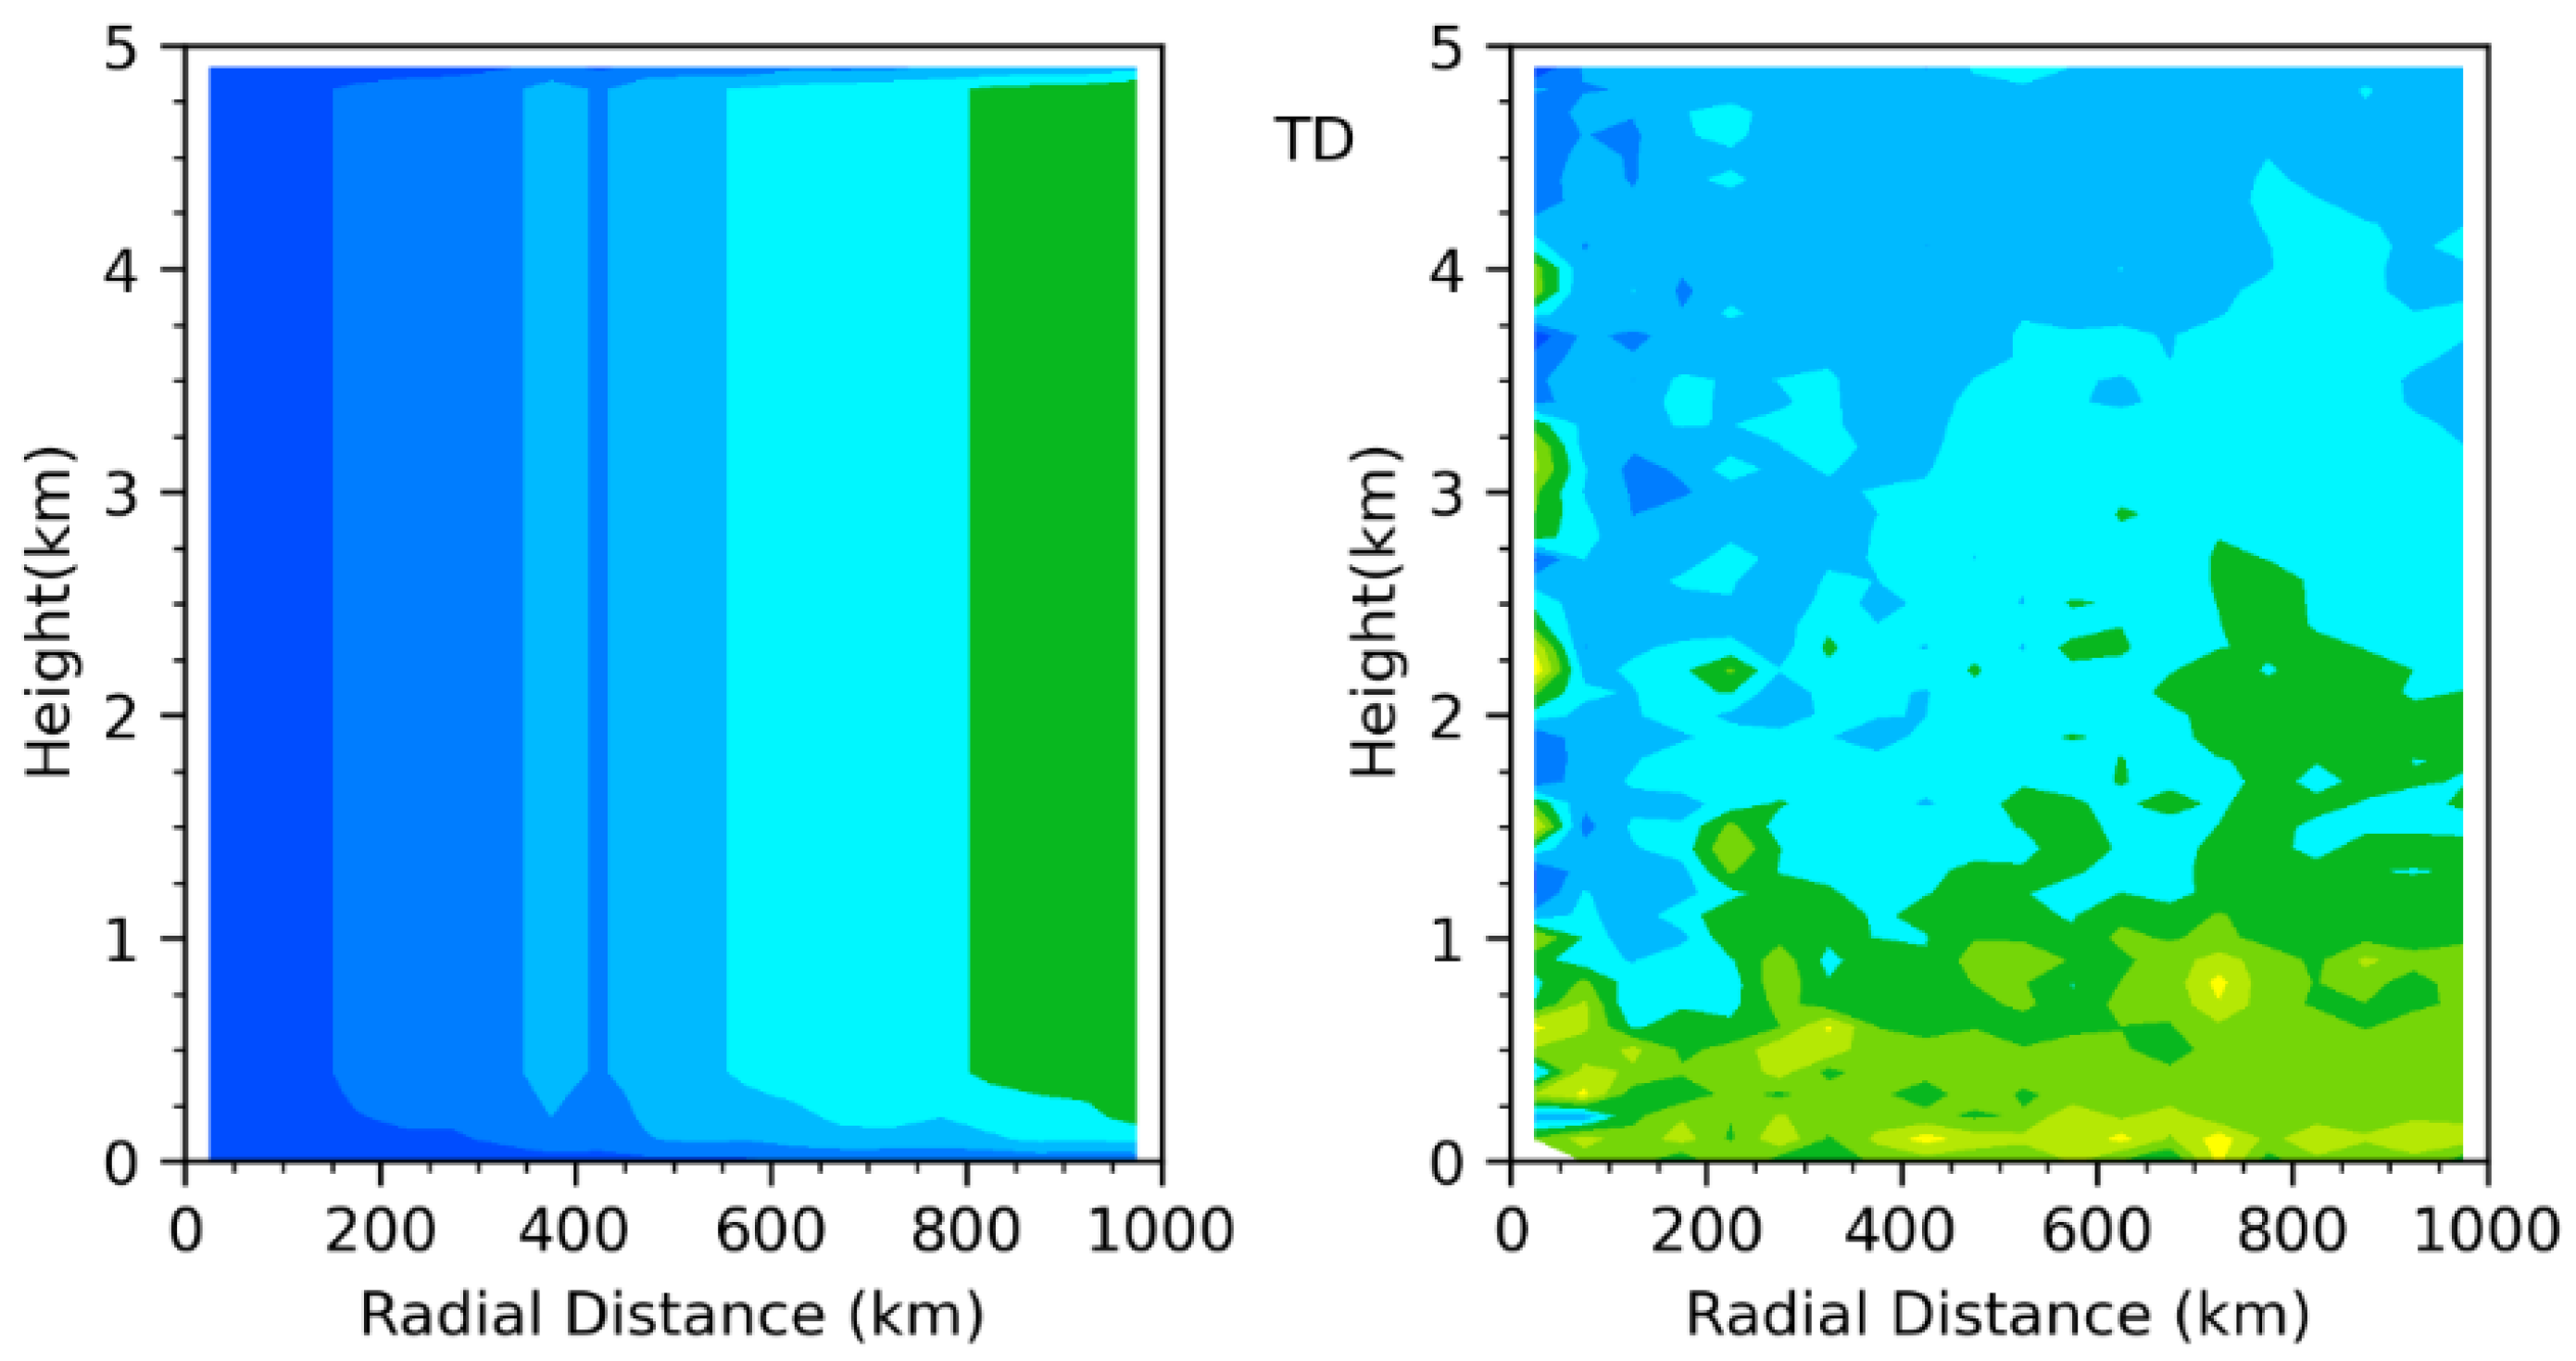
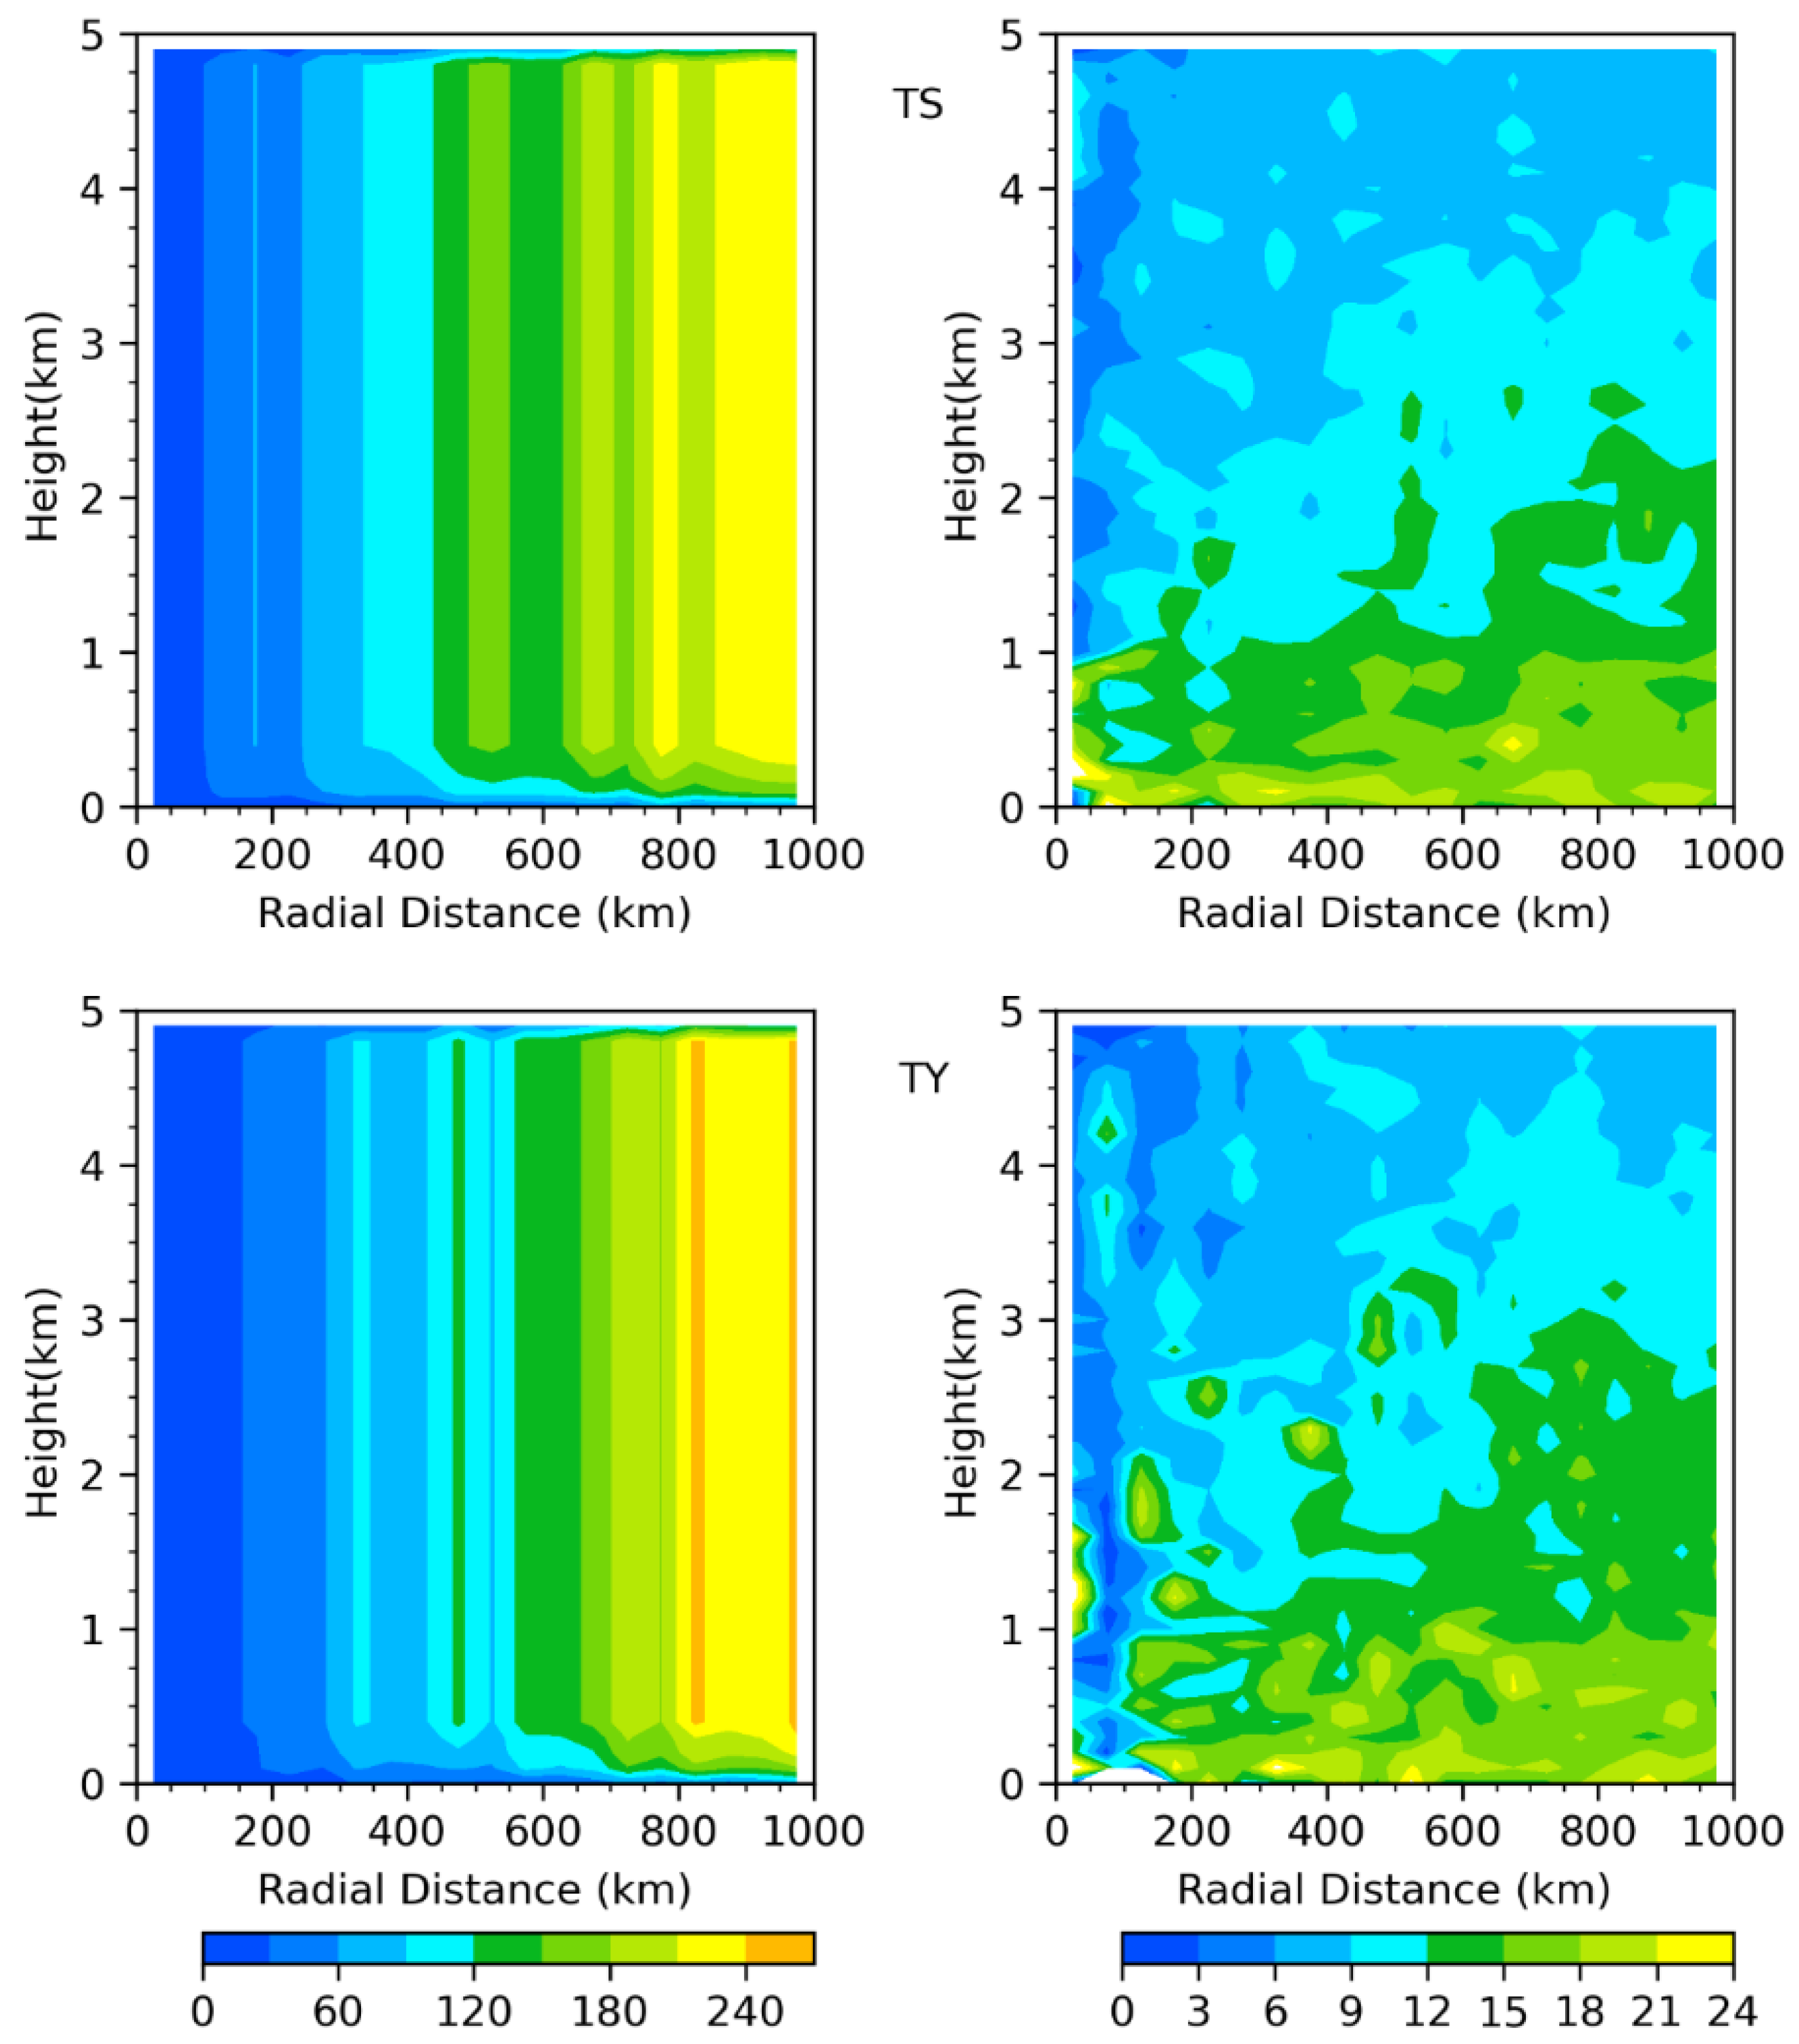
Figure 8 shows the RO counts and the standard deviations of the Ni vertical gradients for the TD, TS, and TY categories calculated in each 50-km radial distance over the western Pacific after quality control. The data counts inside the 100-km radial radii for TD, TS, and TY are less than 30, according to Figure 8 (left). RO profile numbers are unaffected by altitudes between 0.3 km and 4.8 km in height. TS has the largest RO profile count, followed by TY, while TD has the lowest. Figure 8 (right) reveals the most significant standard deviations of the Ni vertical gradients for TD, TS, and TY are at heights of less than 0.3 km, with most values between 12 N-unit km−1 and 24 N-unit km−1. The standard deviations decrease with altitude, and most standard deviations are less than 12 N-unit km−1 above 3.5 km. Most standard deviations of TD, TS, and TY fall between 9 N-unit km−1 and 21 N-unit km−1 in the region between 0.5 km and 1 km, where the lowest vertical gradients of Ni are located. The higher the distance from the centers of TCs, the larger the RO profile distribution area and the more significant the geographical difference between the data. We hypothesize that this explains why standard deviations grow as the distance from TC centers increases.
On average, the dry refractivity Ndry generally accounts for more than 90 percent of the total refractivity, whereas the wet refractivity Nwet generally accounts for 8–9 percent [50]. Figure 9 shows that composite Nidry, and Niwet vertical gradients cross sections and Niwet mean vertical gradients as a percentage of Ni mean vertical gradients for the TD, TS, and TY categories calculated by collocated RO data in each 50-km radial distance over the western Pacific. It is noted that from Figure 9 (right), the distributions of the local minima of Niwet and Ni vertical gradients of TD, TS, and TY are similar, both concentrated between 0.5 km and 1 km. The Niwet mean vertical gradients account for 56% and more of the Ni mean vertical gradients between 0.5–1 km; and the percentages of Niwet decrease with increasing altitude to 40% and below at 5 km. It is noted that from Figure 9 (left), the Nidry vertical gradients of TD, TS, and TY are uniformly distributed in the radial direction with little variations. This result corresponds to Equations (5) and (6), where the Niwet vertical gradient considers both temperature and water vapor variations, and the Nidry vertical gradient contains only temperature variation. So, below 3 km, the former is closer to the vertical gradient of Ni.

5. Conclusions

GPS RO data have been widely used in the application of boundary layer meteorology. Various approaches for determining the PBLH have been proposed, with the gradient approach being the most logical and trustworthy. Nevertheless, compared with N, Ni, which subtracted the fundamental vertical variations of refractivity, is more conducive to highlighting the local variation characteristics of the atmosphere and the influences of various weather conditions on the vertical gradient of refractivity and is more suitable for determining the PBLH. This study uses the local gradient approach as a novel technique for determining the PBLH.
COSMIC radio occultations (ROs) and US radiosonde data from 2007–2011 collocated in time and space are used to test the method’s validity. This paper uses only daytime profiles over the ocean. The RMSEs of the PBLHs determined by the gradient approach and the local gradient approach are 0.73 km and 0.65 km, respectively. Compared with the gradient approach, the results of the local gradient approach are closer to the results of the radiosonde data. The local gradient approach, representing the local variation characteristics of the atmosphere, is more reasonable.
This study constructed composites of COSMIC-2 GPS RO observations from 2020–2021 to study the PBLH axisymmetric structures of TCs of different intensities over the western Pacific Ocean using the gradient approach and the local gradient approach. The lowest vertical gradients of N and Ni of TCs correspond closely with the average convective PBLHs. Compared to the vertical gradients of N, the smallest vertical gradients of Ni, which subtracted the fundamental vertical variations of refractivity, look more precisely located, and the band distributions can be visualized. The local gradient approach calculation shows that the mean PBLHs exist at a maximum value of 1.47 km at a radial distance of 25 km during the TD phase. At a radial distance of 125 km, the PBLHs for TD, TS, and TY are 1.03 km, 1.12 km, and 1.36 km, respectively. The local maximum value of the mean PBLH tends to be greater for more intense TCs. It should be associated with the intensification of the eyewall updrafts of TCs. This contradicts the calculations of Ren et al. [12] for hurricanes, which may be related to the differences between typhoons and hurricanes The mean PBLH undulations increase significantly with the increase in tropical cyclone intensity. After 375 km, 575 km, and 935 km of TD, TS, and TY radial distances, the mean PBLHs become stable and cease to vary. We also separately estimated the Nidry gradient and the Niwet gradient. The distributions of the local minima of Niwet and Ni vertical gradients of TD, TS, and TY are comparable and concentrated between 0.5 km and 1 km.
TC initialization is a challenging and crucial aspect of the numerical forecast model. Enhancing TC initialization accuracy can improve TC forecasts’ accuracy [51]. The selection of the PBL scheme is an essential problem, which is a determining element in the accuracy of the TC forecast [52,53]. The PBLH structures of the TCs constructed in this paper are significant for the improvement of the parameterization scheme of the PBL. The PBLH structural differences between weak and robust TCs also contribute to the intensity forecast of TC. Previous observational studies on the TC PBLH structure were mainly based on the GPS dropsonde data. This paper confirms the feasibility of the GPS RO data to study the PBLH structure of the TC, and more RO observations will be applied to the studies of the TC PBL in the future. GPS RO data are also often used for tropospheric studies [54,55,56].
Because of a lack of sufficient observations within the TC inner core and the low resolution in the radial direction, the results in this study cannot be used as stable TC inner core PBLH structures. It is not clear about the specific physical processes inside the TC PBL. In our future work, we will combine other types of observations from satellites, radars, and GPS dropsondes to explore the thermodynamic and kinematic processes and improve the TC PBL’s parameterization scheme for TC PBL. It will be used in the numerical simulation of TC to test whether it improves the TC intensity and structure forecast. It is vital and valuable to have a more precise and accurate understanding of the physical mechanisms of the TC PBL and to develop more appropriate parameterization methods for TC PBL [57].

Author Contributions

Conceptualization, S.Y.; data curation, L.W.; formal analysis, L.W. and S.Y.; funding acquisition, S.Y.; investigation, L.W. and S.Y.; methodology, S.Y.; project administration, S.Y.; resources, S.Y.; writing—original draft, L.W.; writing—review and editing, S.Y. and L.L. All authors have read and agreed to the published version of the manuscript.

Funding

This research was supported by the National Natural Science Foundation of China (41875032 and 42275005).

Data Availability Statement

The COSMIC RO data used in this study were downloaded from NCAR’s website at https://www.cosmic.ucar.edu (accessed on 1 March 2022). The best track data used in this study were downloaded from NOAA’s website at https://www.ncei.noaa.gov (accessed on 5 March 2022).

Acknowledgments

We would like to acknowledge the suggestions provided by the reviewers and the editor.

Conflicts of Interest

The authors declare no conflict of interest.

References

  1. Stull, R.B. An Introduction to Boundary Layer Meteorology; Springer Science & Business Media: Berlin, MA, USA, 1988; pp. 1–27. [Google Scholar]
  2. Ao, C.O.; Waliser, D.E.; Chan, S.K.; Li, J.L.; Tian, B.; Xie, F.; Mannucci, A.J. Planetary boundary layer heights from GPS radio occultation refractivity and humidity profiles. J. Geophys. Res. 2012, 117, D16117. [Google Scholar] [CrossRef] [Green Version]
  3. Zhang, Q.; Zhang, J.; Qiao, J.; Wang, S. Relationship of atmospheric boundary layer depth with thermodynamic processes at the land surface in arid regions of China. Sci. China Earth Sci. 2011, 54, 1586–1594. [Google Scholar] [CrossRef]
  4. Malkus, J.S.; Riehl, H. On the Dynamics and Energy Transformations in Steady-State Hurricanes. Tellus 1960, 12, 1–20. [Google Scholar] [CrossRef] [Green Version]
  5. Smith, R.K.; Montgomery, M.T.; van Sang, N. Tropical cyclone spin-up revisited. Q. J. R. Meteorol. Soc. 2009, 135, 1321–1335. [Google Scholar] [CrossRef] [Green Version]
  6. Braun, S.A.; Tao, W. Sensitivity of High-Resolution Simulations of Hurricane Bob (1991) to Planetary Boundary Layer Parameterizations. Mon. Weather Rev. 2000, 128, 3941–3961. [Google Scholar] [CrossRef]
  7. Smith, R.K.; Thomsen, G.L. Dependence of tropical-cyclone intensification on the boundary-layer representation in a numerical model. Q. J. R. Meteorol. Soc. 2010, 136, 1671–1685. [Google Scholar] [CrossRef]
  8. Kepert, J.D. Choosing a boundary layer parameterization for tropical cyclone modeling. Mon. Weather Rev. 2012, 140, 1427–1445. [Google Scholar] [CrossRef] [Green Version]
  9. Zhang, J.A.; Rogers, R.F. Effects of parameterized boundary layer structure on hurricane rapid intensification in Shear. Mon. Weather Rev. 2019, 147, 853–871. [Google Scholar] [CrossRef]
  10. Zhang, J.A.; Rogers, R.F.; Nolan, D.S.; Marks, F.D. On the characteristic height scales of the hurricane boundary layer. Mon. Weather Rev. 2011, 139, 2523–2535. [Google Scholar] [CrossRef]
  11. Ming, J.; Zhang, J.A.; Rogers, R.F. Typhoon kinematic and thermodynamic boundary layer structure from dropsonde composites. J. Geophys. Res. 2015, 120, 3158–3172. [Google Scholar] [CrossRef]
  12. Ren, Y.; Zhang, J.A.; Vigh, J.L.; Zhu, P.; Liu, H.; Wang, X.; Wadler, J.B. An observational study of the symmetric boundary layer structure and tropical cyclone intensity. Atmosphere 2020, 11, 158. [Google Scholar] [CrossRef] [Green Version]
  13. Chen, N.; Tang, J.; Zhang, J.A.; Ma, L.M.; Yu, H. On the distribution of helicity in the tropical cyclone boundary layer from dropsonde composites. Atmos. Res. 2021, 249, 105298. [Google Scholar] [CrossRef]
  14. Beyrich, F. Mixing height estimation from sodar data—A critical discussion. Atmos. Environ. 1997, 31, 3941–3953. [Google Scholar] [CrossRef]
  15. Fetzer, E.J.; Teixeira, J.; Olsen, E.T.; Fishbein, E.F. Satellite remote sounding of atmospheric boundary layer temperature inversions over the subtropical eastern Pacific. Geophys. Res. Lett. 2004, 31, L17102. [Google Scholar] [CrossRef]
  16. Wood, R.; Bretherton, C.S. Boundary layer depth, entrainment, and decoupling in the cloud-capped subtropical and tropical marine boundary layer. J. Clim. 2004, 17, 3576–3588. [Google Scholar] [CrossRef]
  17. Palm, S.P.; Miller, D.; Benedetti, A.; Spinhirne, J. Validation of ECMWF global forecast model parameters using the geoscience laser altimeter system (GLAS) atmospheric channel measurements. Geophys. Res. Lett. 2005, 32, L22S09. [Google Scholar] [CrossRef]
  18. Jordan, N.S.; Hoff, R.M.; Bacmeister, J.T. Validation of Goddard Earth Observing System-version 5 MERRA planetary boundary layer heights using CALIPSO. J. Geophys. Res. 2010, 115, 9–12. [Google Scholar] [CrossRef] [Green Version]
  19. Kursinski, E.R.; Hajj, G.A.; Schofield, J.T.; Linfield, R.P.; Hardy, K.R. Observing Earth’s atmosphere with radio occultation measurements using the global positioning system. J. Geophys. Res. Atmos. 1997, 102, 23429–23465. [Google Scholar] [CrossRef]
  20. Chen, S.Y.; Liu, C.Y.; Huang, C.Y.; Hsu, S.C.; Li, H.W.; Lin, P.H.; Cheng, J.P.; Huang, C.Y. An Analysis Study of FORMOSAT-7/COSMIC-2 Radio Occultation Data in the Troposphere. Remote Sens. 2021, 13, 717. [Google Scholar] [CrossRef]
  21. Ho, S.P.; Zhou, X.; Shao, X.; Zhang, B.; Adhikari, L.; Kireev, S.; He, Y.; Yoe, J.G.; Xia-Serafino, W.; Lynch, E. Initial assessment of the COSMIC-2/FORMOSAT-7 neutral atmosphere data quality in NESDIS/STAR using in situ and satellite data. Remote Sens. 2020, 12, 4099. [Google Scholar] [CrossRef]
  22. Basha, G.; Ratnam, M.V. Identification of atmospheric boundary layer height over a tropical station using high-resolution radiosonde refractivity profiles: Comparison with GPS radio occupation measurements. J. Geophys. Res. 2009, 114, D16101. [Google Scholar] [CrossRef]
  23. Guo, P.; Kuo, Y.-H.; Sokolovskiy, S.V.; Lenschow, D.H. Estimating Atmospheric Boundary Layer Depth Using COSMIC Radio Occultation Data. J. Atmos. Sci. 2011, 68, 1703–1713. [Google Scholar] [CrossRef]
  24. Xie, F.; Wu, D.L.; Ao, C.O.; Mannucci, A.J.; Kursinski, E.R. Advances and limitations of atmospheric boundary layer observations with GPS occultation over southeast Pacific Ocean. Atmos. Chem. Phys. 2012, 12, 903–918. [Google Scholar] [CrossRef] [Green Version]
  25. Ho, S.; Peng, L.; Anthes, R.A.; Kuo, Y.; Lin, H. Marine Boundary Layer Heights and Their Longitudinal, Diurnal, and Interseasonal Variability in the Southeastern Pacific Using COSMIC, CALIOP, and Radiosonde Data. J. Clim. 2015, 28, 2856–2872. [Google Scholar] [CrossRef] [Green Version]
  26. Xu, X.; Zou, X. COSMIC-2 RO Profile Ending at PBL Top with Strong Vertical Gradient of Refractivity. Remote Sens. 2022, 14, 2189. [Google Scholar] [CrossRef]
  27. Kuo, Y.H.; Wee, T.K.; Sokolovskiy, S.; Rocken, C.; Schreiner, W.; Hunt, D.; Anthes, R.A. Inversion and error estimation of GPS radio occultation data. J. Meteorol. Soc. Jpn. 2004, 82, 507–531. [Google Scholar] [CrossRef] [Green Version]
  28. Anthes, R.A.; Bernhardt, P.A.; Chen, Y.; Cucurull, L.; Dymond, K.F.; Ector, D.; Healy, S.B.; Ho, S.-P.; Hunt, D.C.; Kuo, Y.-H.; et al. The COSMIC/FORMOSAT-3 Mission: Early Results. Bull. Am. Meteorol. Soc. 2008, 89, 313–334. [Google Scholar] [CrossRef]
  29. Ao, C.O.; Hajj, G.A.; Meehan, T.K.; Dong, D.; Iijima, B.A.; Mannucci, A.J.; Kursinski, E.R. Rising and setting GPS occupations by use of open-loop tracking. J. Geophys. Res. Atmos. 2009, 114, D04101. [Google Scholar] [CrossRef] [Green Version]
  30. Yang, S.; Zou, X.; Ray, P.S. Comparison of TC temperature and water vapor climatologies between the Atlantic and Pacific Oceans from GPS RO observations. J. Clim. 2018, 31, 8557–8571. [Google Scholar] [CrossRef]
  31. Yang, S.; Zou, X. Relationships of along-the-track local variations of GPS RO impact parameter to strong local vertical gradient of wet refractivity in the tropics. Sci. China Earth Sci. 2021, 64, 2015–2026. [Google Scholar] [CrossRef]
  32. Yang, S.; Zou, X.; Anthes, R. Raytracing simulated GPS radio wave propagation paths experiencing large disturbances when going through the top of the sub-cloud layer. Remote Sens. 2021, 13, 4693. [Google Scholar] [CrossRef]
  33. Sokolovskiy, S.; Rocken, C.; Schreiner, W.; Hunt, D. On the uncertainty of radio occultation inversions in the lower troposphere. J. Geophys. Res. Atmos. 2010, 115, D22111. [Google Scholar] [CrossRef] [Green Version]
  34. Liu, H.; Kuo, Y.H.; Sokolovskiy, S.; Zou, X.; Zeng, Z.; Hsiao, L.F.; Ruston, B.C. A quality control procedure based on bending angle measurement uncertainty for radio occultation data assimilation in the tropical lower troposphere. J. Atmos. Ocean. Technol. 2018, 35, 2117–2131. [Google Scholar] [CrossRef]
  35. Lanzante, J.R. Resistant, robust and non-parametric techniques for the analysis of climate data: Theory and examples, including applications to historical radiosonde station data. Int. J. Climatol. 1996, 16, 1197–1226. [Google Scholar] [CrossRef]
  36. Zou, X.; Zeng, Z. A quality control procedure for GPS radio occultation data. J. Geophys. Res. Atmos. 2006, 111, 111. [Google Scholar] [CrossRef] [Green Version]
  37. Seidel, D.J.; Ao, C.O.; Li, K. Estimating climatological planetary boundary layer heights from radiosonde observations: Comparison of methods and uncertainty analysis. J. Geophys. Res. Atmos. 2010, 115, 6113. [Google Scholar] [CrossRef] [Green Version]
  38. Liu, S.; Liang, X.Z. Observed diurnal cycle climatology of planetary boundary layer height. J. Clim. 2010, 23, 5790–5809. [Google Scholar] [CrossRef]
  39. Von Engeln, A.; Teixeira, J. A planetary boundary layer height climatology derived from ECMWF reanalysis data. J. Clim. 2013, 26, 6575–6590. [Google Scholar] [CrossRef]
  40. Smith, E.K.; Weintraub, S. The Constants in the Equation for Atmospheric Refractive Index at Radio Frequencies. Proc. IRE 1953, 41, 1035–1037. [Google Scholar] [CrossRef] [Green Version]
  41. Ahern, K.; Bourassa, M.A.; Hart, R.E.; Zhang, J.A.; Rogers, R.F. Observed Kinematic and Thermodynamic Structure in the Hurricane Boundary Layer during Intensity Change. Mon. Weather Rev. 2019, 147, 2765–2785. [Google Scholar] [CrossRef]
  42. Zhang, J.A.; Dunion, J.P.; Nolan, D.S. In Situ Observations of the Diurnal Variation in the Boundary Layer of Mature Hurricanes. Geophys. Res. Lett. 2020, 47, GL086206. [Google Scholar] [CrossRef]
  43. Molinari, J.; Frank, J.; Vollaro, D. Convective bursts, downdraft cooling and boundary layer recovery in a sheared tropical storm. Mon. Weather Rev. 2013, 141, 1048–1060. [Google Scholar] [CrossRef]
  44. Ming, J.; Zhang, J.A.; Rogers, R.F.; Marks, F.D.; Wang, Y.; Cai, N. Multiplatform observations of boundary layer structure in the outer rainbands of landfalling typhoons. J. Geophys. Res. 2014, 119, 7799–7814. [Google Scholar] [CrossRef]
  45. Zhang, J.A.; Drennan, W.M.; Black, P.G.; French, J.R. Turbulence structure of the hurricane boundary layer between the outer rainbands. J. Atmos. Sci. 2009, 66, 2455–2467. [Google Scholar] [CrossRef]
  46. Kepert, J.D. Slab- and height-resolving models of the tropical cyclone boundary layer. Part I: Comparing the simulations. Q. J. R. Meteorol. Soc. 2010, 136, 1686–1699. [Google Scholar] [CrossRef]
  47. Knaff, J.A.; Longmore, S.P.; Molenar, D.A. An objective satellite-based tropical cyclone size climatology. J. Clim. 2014, 27, 455–476. [Google Scholar] [CrossRef]
  48. Chavas, D.R.; Emanuel, K.A. A QuikSCAT climatology of tropical cyclone size. Geophys. Res. Lett. 2010, 37, L18816. [Google Scholar] [CrossRef] [Green Version]
  49. Schenkel, B.A.; Lin, N.; Chavas, D.; Oppenheimer, M.; Brammer, A. Evaluating outer tropical cyclone size in reanalysis datasets using QuikSCAT data. J. Clim. 2017, 30, 8745–8762. [Google Scholar] [CrossRef]
  50. Yang, S.; Zou, X. Assessments of cloud liquid water contributions to GPS radio occultation refractivity using measurements from COSMIC and CloudSat. J. Geophys. Res. Atmos. 2012, 117, D06219. [Google Scholar] [CrossRef] [Green Version]
  51. Shi, D.; Chen, G.; Wang, K.; Bi, X.; Chen, K. Evaluation of Two Initialization Schemes for Simulating the Rapid Intensification of Typhoon Lekima (2019). Adv. Atmos. Sci. 2020, 37, 987–1006. [Google Scholar] [CrossRef]
  52. Bell, M.M.; Montgomery, M.T.; Emanuel, K.A. Air–Sea Enthalpy and Momentum Exchange at Major Hurricane Wind Speeds Observed during CBLAST. J. Atmos. Sci. 2012, 69, 3197–3222. [Google Scholar] [CrossRef]
  53. Zhang, J.A.; Rogers, R.F.; Tallapragada, V. Impact of parameterized boundary layer structure on tropical cyclone rapid intensification forecasts in HWRF. Mon. Weather Rev. 2017, 145, 1413–1426. [Google Scholar] [CrossRef]
  54. Johnston, B.; Xie, F. Characterizing Extratropical Tropopause Bimodality and its Relationship to the Occurrence of Double Tropopauses Using COSMIC GPS Radio Occultation Observations. Remote Sens. 2020, 12, 1109. [Google Scholar] [CrossRef] [Green Version]
  55. Schmidt, T.; Beyerle, G.; Heise, S.; Wickert, J.; Rothacher, M. A climatology a multiple tropauses derived from GPS radio occultations with CHAMP and SAC-C. Geophys. Res. Lett. 2006, 33, L04807. [Google Scholar] [CrossRef]
  56. Noersomadi; Tsuda, T.; Fujiwara, M. Influence of ENSO and MJO on the zonal structure of tropical tropopause inversion layer using high-resolution temperature profiles retrieved from COSMIC GPS Radio Occultation. Atmos. Chem. Phys. 2019, 19, 6985–7000. [Google Scholar] [CrossRef] [Green Version]
  57. Ahern, K.; Hart, R.E.; Bourassa, M.A. Asymmetric Hurricane Boundary Layer Structure during Storm Decay. Part I: Formation of Descending Inflow. Mon. Weather Rev. 2021, 149, 3851–3874. [Google Scholar] [CrossRef]
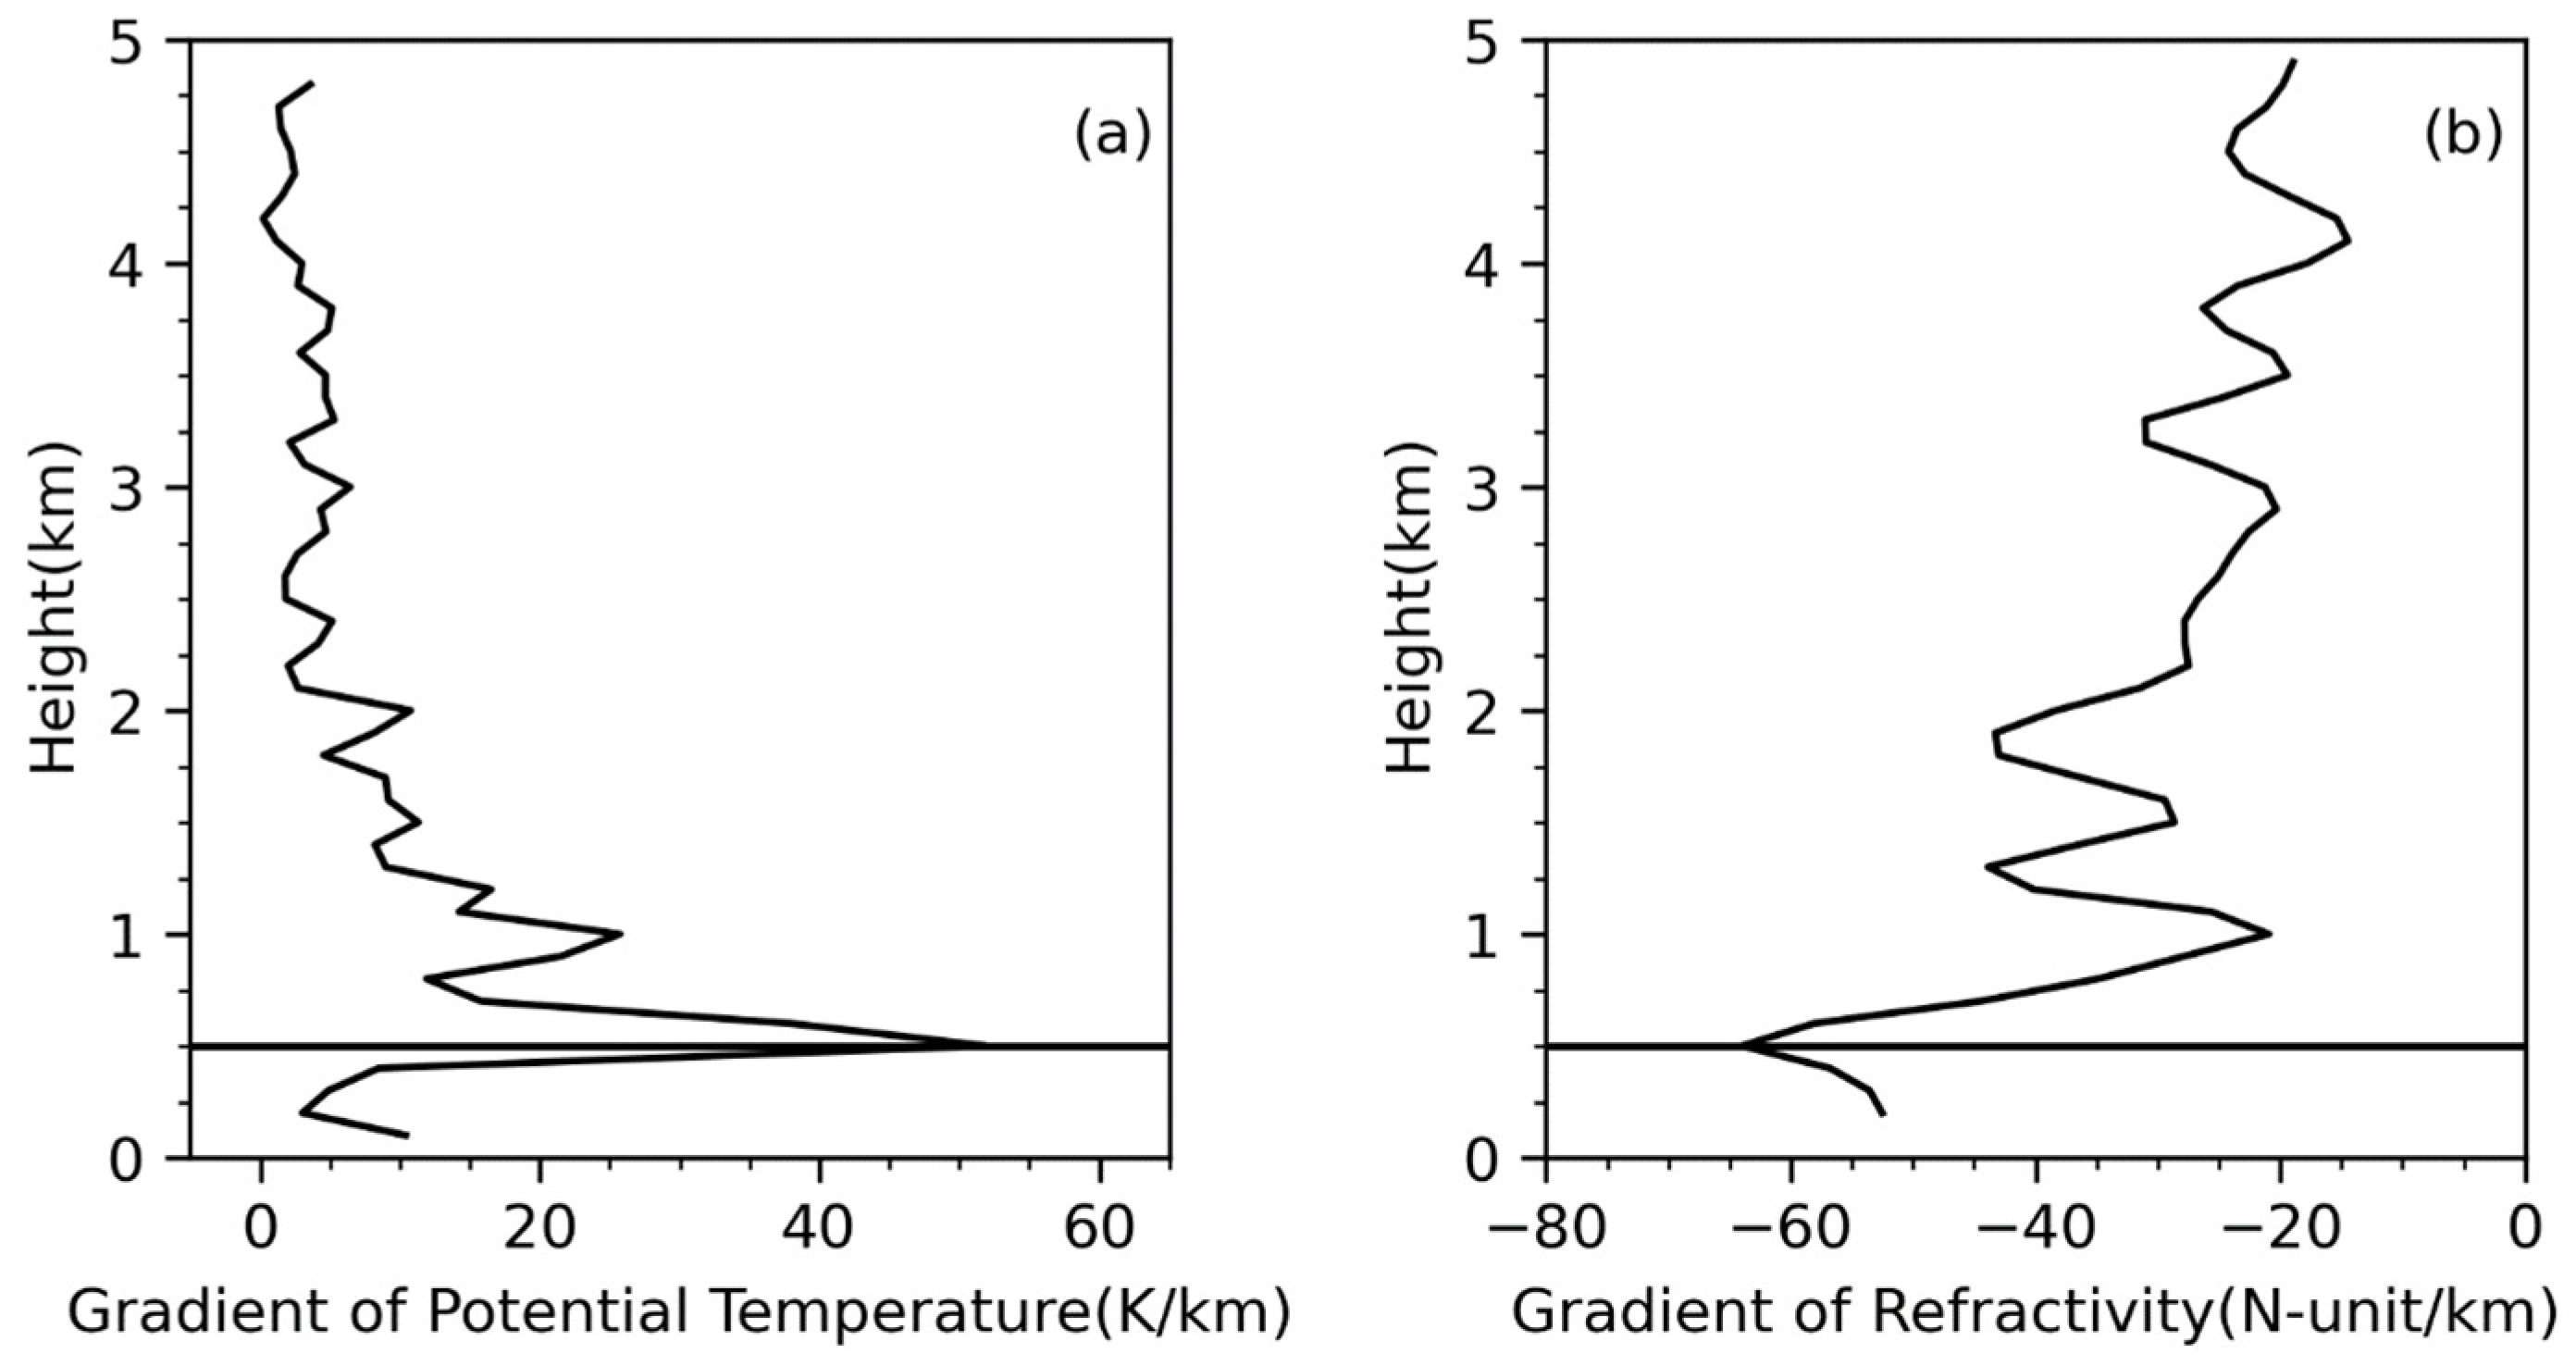
Figure 1. The radiosonde/RO co-location 1 gradient profiles of (a) potential temperature and (b) refractivity. The black horizontal lines show the PBLHs. The radiosonde event occurred at 2300UTC on 30 January 2010, located at (156.8°W, 71.3°N); the radio occultation event (RO1) occurred at 2326UTC on 30 January 2010, located at (157.0°W, 71.6°N).
Remotesensing 14 06110 g001
Figure 2. The radiosonde/RO co-location 2 profiles of (a) the potential temperature gradient and (b) the refractivity gradient, as well as RO2 of (c) the specific humidity and (d) the temperature. The black horizontal lines show the PBLHs. The radiosonde event occurred at 2300UTC on 11 March 2007, located at (156.8°W, 71.3°N); the radio occultation event (RO2) occurred at 2108UTC on 11 March 2007, located at (160.3°W, 71.9°N).
Remotesensing 14 06110 g002aRemotesensing 14 06110 g002b
Figure 3. (a) The spherically symmetric refractivity and (b) vertical gradient profiles on 2 January 2008.
Remotesensing 14 06110 g003
Figure 4. The Ni gradient profile of RO2. The black horizontal line shows the PBLH.
Remotesensing 14 06110 g004
Figure 5. Spatial distributions of profiles collocated by COSMIC ROs and radiosonde data during 2007–2011 over the ocean (red dot indicates the radiosonde data, the blue dot indicates the RO data).
Remotesensing 14 06110 g005
Figure 6. Scatter plots of the PBLHs over the ocean determined using COSMIC RO (a) N and (b) Ni data with radiosonde potential temperature data during 2007–2011. The red dots indicate the excluded points with LSW > 30%.
Remotesensing 14 06110 g006
Figure 7. Composite N (left) and Ni (right) vertical gradients cross sections and averages (black dashed lines) and 0.5 times standard deviations (vertical segment, N-unit km−1) of PBLHs calculated by collocated COSMIC-2 ROs data in each 50-km radial distance over the western Pacific. (top) TD, (middle) TS, and (bottom) TY.
Remotesensing 14 06110 g007aRemotesensing 14 06110 g007b
Figure 8. COSMIC-2 RO profile counts (left) and the standard deviations (N-unit km−1) of the Ni vertical gradients (right) calculated in each 50-km radial distance and 0.1-km height box over the western Pacific: (top) TD, (middle) TS, and (bottom) TY.
Remotesensing 14 06110 g008aRemotesensing 14 06110 g008b
Figure 9. Composite Nidry (left; colored shading) and Niwet (right; colored shading) vertical gradients (N-unit km−1) cross sections and Niwet mean vertical gradients as a percentage of Ni mean vertical gradients (right; contour lines; %) calculated by collocated COSMIC-2 ROs data in each 50-km radial distance over the western Pacific: (top) TD, (middle) TS, and (bottom) TY.
Remotesensing 14 06110 g009
Publisher’s Note: MDPI stays neutral with regard to jurisdictional claims in published maps and institutional affiliations.