Article

Giant Planet Observations in NASA’s Planetary Data System

1
Astronomy Department, New Mexico State University, Las Cruces, NM 88003, USA
2
Department of Astronomy, University of Maryland, College Park, MD 20742, USA
3
U.S. Geological Survey, Astrogeology Science Center, Flagstaff, AZ 86001, USA
4
Carl Sagan Center, SETI Institute, 339 Bernardo Avenue #200, Mountain View, CA 94043, USA
5
Department of Earth, Planetary and Space Sciences, University of California, Los Angeles, CA 90095, USA
*
Author to whom correspondence should be addressed.
Remote Sens. 2022, 14(23), 6112; https://doi.org/10.3390/rs14236112
Submission received: 31 October 2022 / Revised: 18 November 2022 / Accepted: 20 November 2022 / Published: 2 December 2022
(This article belongs to the Special Issue Remote Sensing Observations of the Giant Planets)

Abstract

:
While there have been far fewer missions to the outer Solar System than to the inner Solar System, spacecraft destined for the giant planets have conducted a wide range of fundamental investigations, returning data that continues to reshape our understanding of these complex systems, sometimes decades after the data were acquired. These data are preserved and accessible from national and international planetary science archives. For all NASA planetary missions and instruments the data are available from the science discipline nodes of the NASA Planetary Data System (PDS). Looking ahead, the PDS will be the primary repository for giant planets data from several upcoming missions and derived datasets, as well as supporting research conducted to aid in the interpretation of the remotely sensed giant planets data already archived in the PDS.

1. Introduction

Spacecraft exploration of the outer Solar System began with the arrival of Pioneer 10 at Jupiter in 1973, and continues to the present day with the Juno spacecraft in orbit around Jupiter. Unlike the more frequent orbiter and lander missions to destinations in closer proximity to Earth (e.g., the Moon or Mars), missions to the outer Solar System have been more scarce due to cost, power, and travel time constraints. Nevertheless, spacecraft destined for the giant planets have conducted a wide range of fundamental investigations, returning data that continues to reshape our understanding of these complex systems, sometimes decades after the data were acquired.
Early in the history of NASA’s planetary missions, data archiving was somewhat unregulated: data were typically delivered from missions to Principal Investigators (PIs), who were individually responsible to clean, process, and document the data, and then to deposit them with the National Space Science Data Center Archive (NSSDCA) for permanent storage and public access. However, there was a realization in the late 1980s that careful stewardship of data was required to ensure both its accessibility and its usability for future generations of researchers. Not only were the data degrading (whether stored on analog media such as photographic film or scan tapes, or on digital media such as magnetic tapes), but subsequent attempts by others to use the data were failing despite conscientious efforts on the part of the PIs to provide sufficient documentation. It was recognized that these remote sensing (and also in situ) data represent a national treasure and a significant investment that must be preserved and maintained indefinitely.
NASA’s Planetary Data System (PDS) was established with this aim in mind, following recommendations made by the Committee on Data Management and Computation (CODMAC) on behalf of the Space Science Board, National Academy of Sciences [1,2], with the PDS being one of a series of data systems recommended (the others covering other scientific disciplines such as Heliophysics and Astrophysics). CODMAC reviewed several archiving approaches and concluded that planetary datasets should reside at research institutions associated with the relevant scientific community, ensuring that scientists with direct experience in working with the data are closely involved in the archiving and curation process as well as the development of tools for data search, analysis, visualization, and planning observations.
To that end, the PDS is structured as a federated system of six Discipline Nodes (DNs) that provide unique expertise in various sub-disciplines of planetary science (Figure 1) [3]. Of these DNs, all but the Geosciences Node archive key remote sensing data sets related to the giant planets (specific examples are given in Section 2):
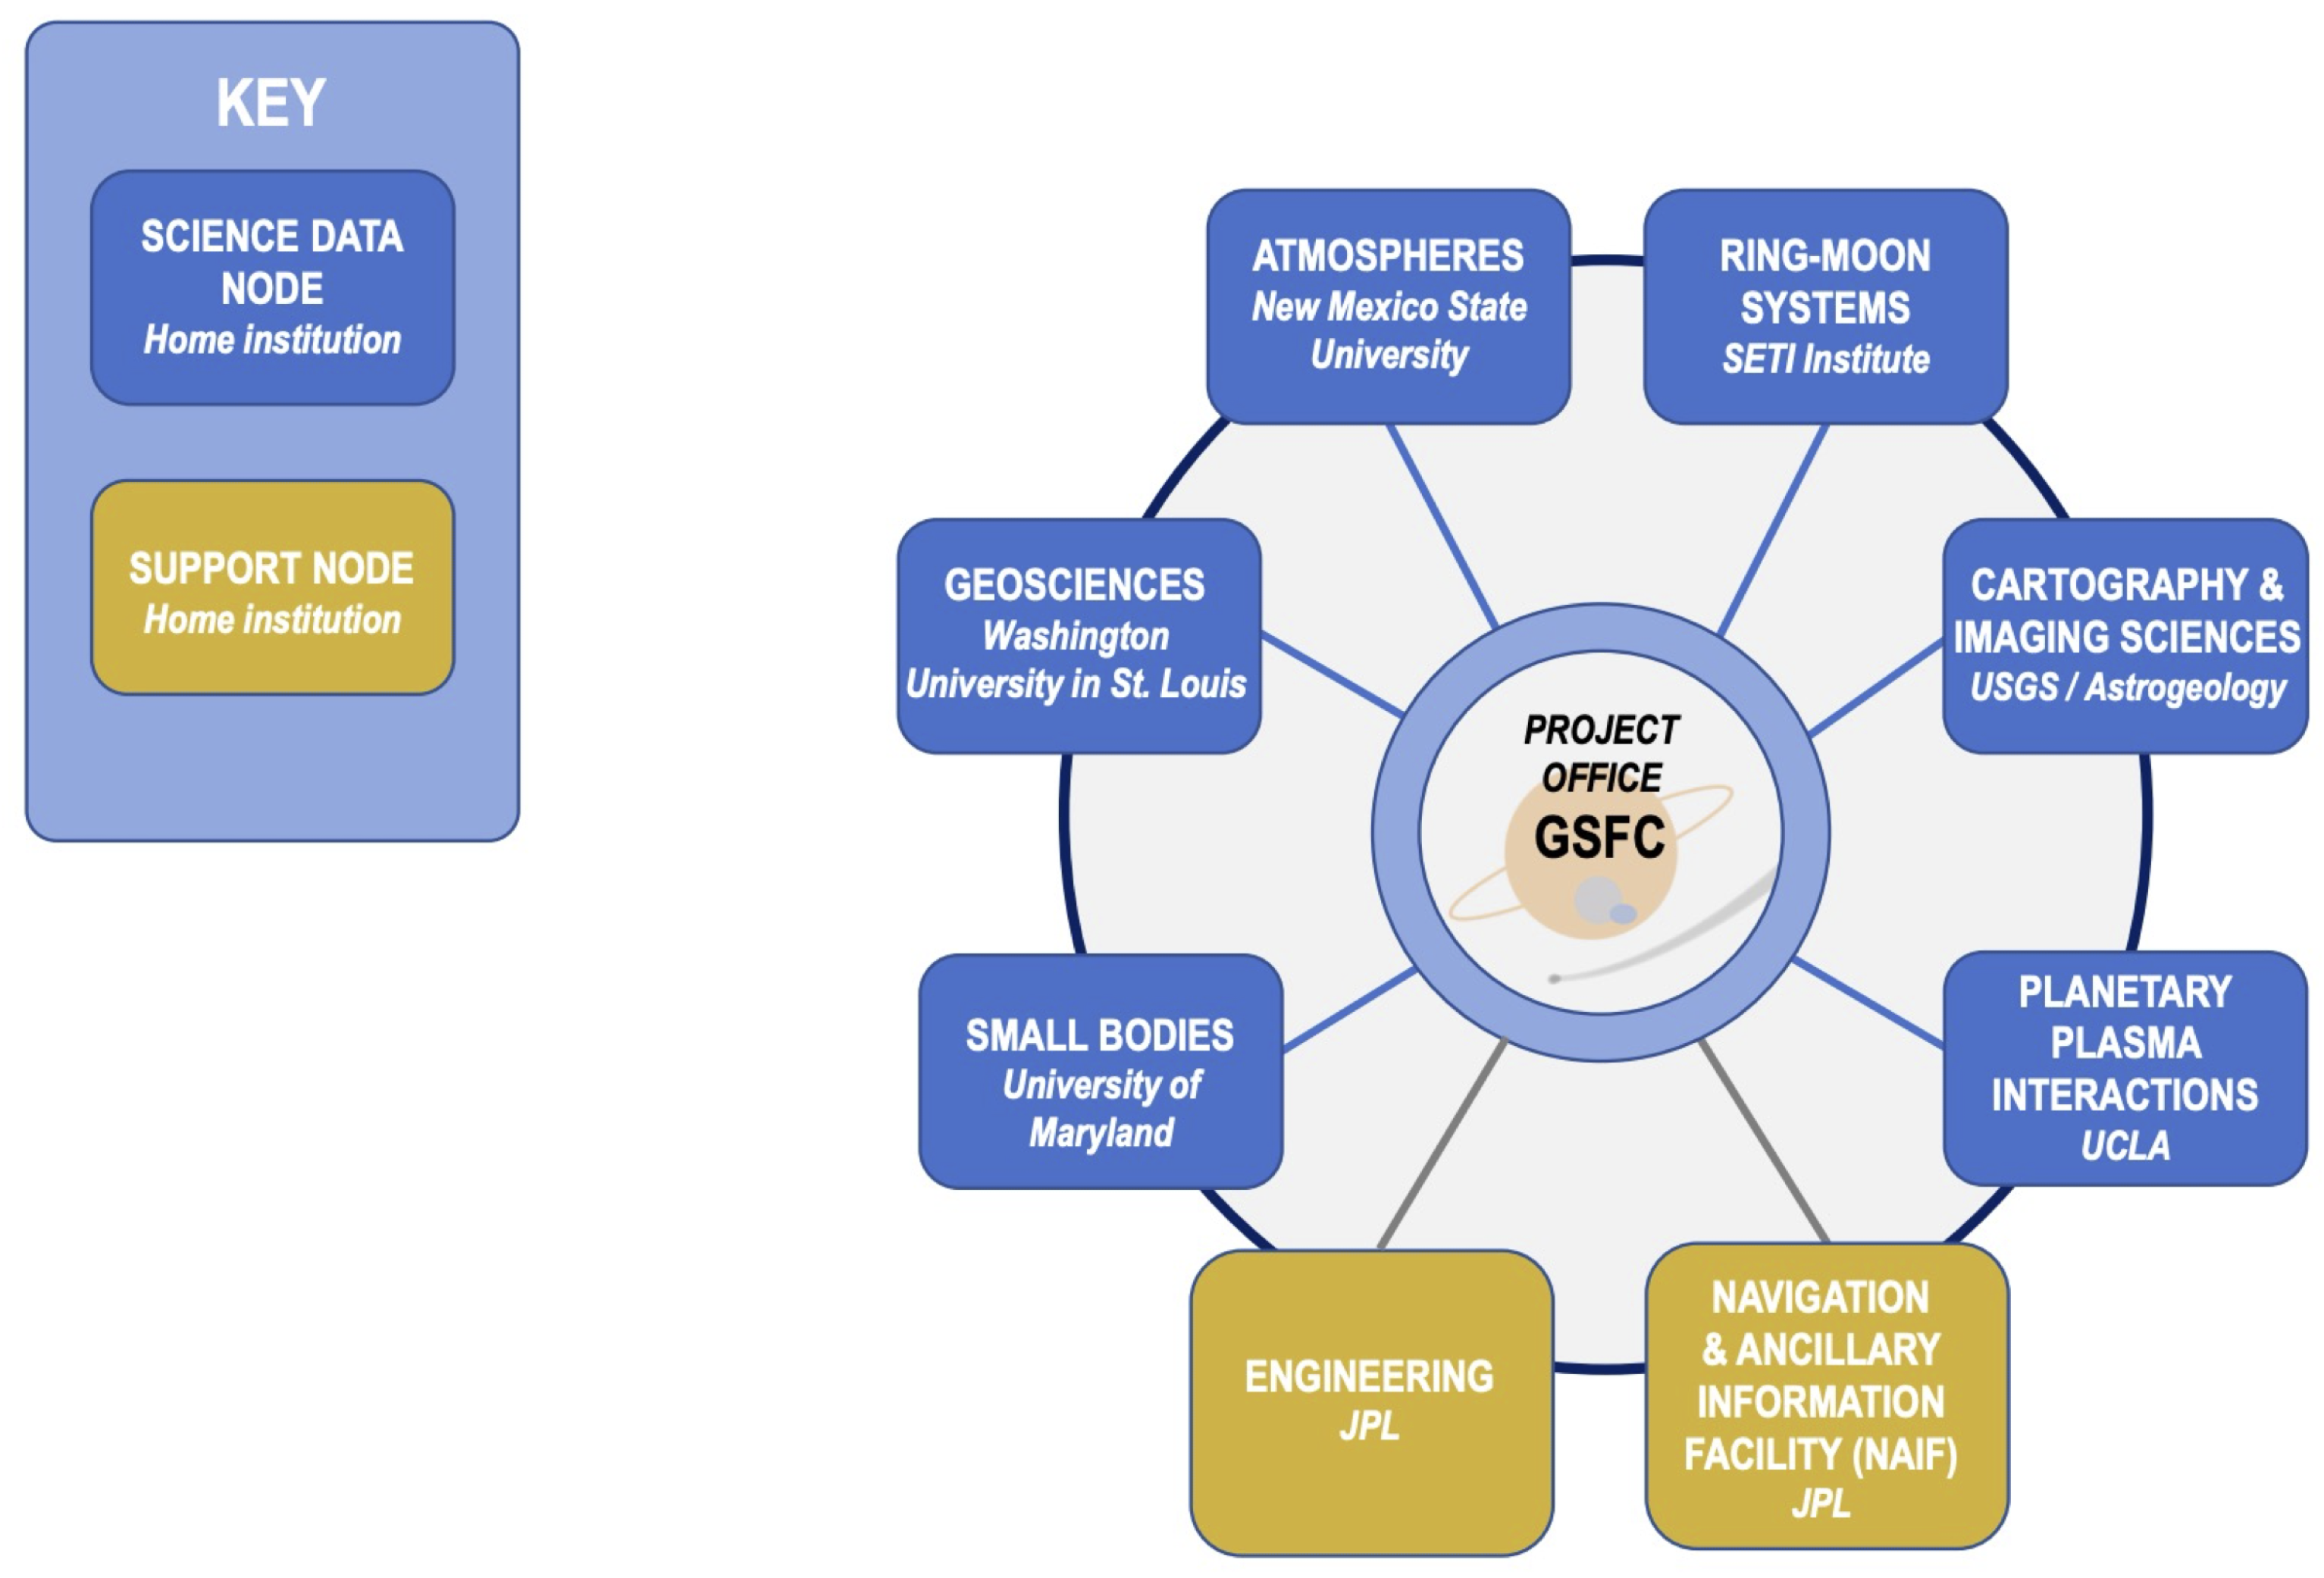
  • The Atmospheres Node (ATM, https://pds-atmospheres.nmsu.edu, accessed on 30 October 2022) archives all non-imaging atmospheric data from planetary missions (excluding Earth observations), ground-based observations, and planetary analog, laboratory and field measurements.
  • The Cartography and Imaging Sciences Node (IMG, https://pds-imaging.jpl.nasa.gov, accessed on 30 October 2022) archives digital image collections from planetary missions, and supports cartographic and geospatial data analysis.
  • The Geosciences Node (GEO, https://pds-geosciences.wustl.edu, accessed on 30 October 2022) archives and distributes digital data related to the study of the surfaces and interiors of terrestrial planetary bodies.
  • The Planetary Plasma Interactions Node (PPI, https://pds-ppi.igpp.ucla.edu, accessed on 30 October 2022) archives data related to the study of the interaction between the solar wind and planetary winds with planetary magnetospheres, ionospheres and surfaces.
  • The Ring-Moon Systems Node (RMS, https://pds-rings.seti.org, accessed on 30 October 2022) archives data relevant to outer planetary systems, with a focus on individual data products within their original context. This includes remote sensing data (images, imaging spectrometer, and occultations) for systems beyond the asteroid belt (that is, Jupiter through Pluto). RMS also hosts the Radio Science Sub-Node (RSSN), which assists all of PDS with the ingestion and curation of radio science data, including gravity science and occultations.
  • The Small Bodies Node (SBN, https://pds-smallbodies.astro.umd.edu, accessed on 30 October 2022) archives mission, ground-based, and laboratory data for objects generally described as comets, asteroids and interplanetary dust. This includes dwarf planets, objects in the Kuiper Belt and the Oort cloud, Centaurs, and small planetary satellites, as well as observations of the giant planets acquired en route to small body targets.
Data standards, i.e., the technical specifications used to describe data storage, sharing, and interpretation, are crucial for information transfer and interoperability. PDS standards ensure consistent description of planetary science data so that data providers, programmers, and end-users all know what to expect when creating and working with PDS files [4]. Historically, the PDS Requirements Review [2] laid out an ambitious design for preserving, cataloging, and distributing planetary datasets to users, all during a time that predated the widespread use of the internet. It consisted of a proposed three-stage rollout:
  • PDS version 1.0: Focused on software infrastructure and catalog design (1990)
  • PDS version 2.0: Basic operations in the central cataloging and distribution node, with two selected DNs being brought up to full operational status as test cases (1992–1993)
  • PDS version 3.0: “Final” release with all DNs fully operational and user support in place (1994–1995)
By the mid-1990s, following feedback from users and data preparers, two major changes were implemented, resulting in what came to be known as PDS3 data standards (referring to v3.0 in the list above). First, major simplifications were made to the catalog file structures in order to streamline the process for users to locate and order datasets, and second, an attempt was made to rationalize and standardize the keywords used in labels by imposing some minimal metadata requirements.
Fifteen years following the introduction of PDS3, the process of developing and implementing new standards (PDS4) began, based on lessons learned during twenty years of archiving, current information systems concepts, and the capabilities inherent in the modern internet. PDS4 ensures more consistent standardization, better long-term preservation, and improved automation support [5]. Currently, all new datasets submitted to PDS comply with the PDS4 standards, and all existing PDS3 datasets are in the process of being migrated to PDS4. Further details of the history and data standards of the PDS are provided in Raugh and Hughes [6].
The release of the Memorandum from the President’s Office of Science and Technology Policy entitled “Increasing Access to the Results of Federally Funded Scientific Research” in 2013 led to the development of the NASA Plan for Increasing Access to the Results of Scientific Research in 2014, the NASA Science Mission Directorate’s Strategy for Data Management and Computing for Groundbreaking Science 2019–2024, and the NASA Science Mission Directorate’s Policy Document SPD-41: Scientific Information Policy in 2021. Taken together, these documents codify the requirements surrounding the accessibility and preservation of digital data produced by NASA missions, instruments, and projects. The PDS has played a central role in serving as a publicly accessible and appropriate repository for archiving planetary data. The strength of the PDS lies in its long-term stability and the fact that all data are peer reviewed, both to ensure that they conform to the PDS standards and to confirm that they are well-documented and will be usable by future researchers. The PDS is an archive guided by the FAIR principles for scientific data management and stewardship, namely that the data should be findable, accessible, interoperable, and reusable.
After nearly five decades exploring the giant planets of our Solar System, the PDS is now responsible for the curation, preservation, and distribution of a wealth of remote sensing data on the outer planets. This includes data covering a wide range of wavelengths, instrumentation, acquisition modalities, targets, and physical processes. In this paper, we describe examples of such data in Section 2, discuss the modes through which these data can be accessed in Section 3, highlight anticipated future giant planets data and their application to both Solar System and exoplanetary science investigations in Section 4, and provide conclusions in Section 5.

2. Giant Planets Data in the PDS

Remote sensing data relevant to numerous science questions about the giant planets can be found across the PDS, illustrative of both the breadth and depth of the existing giant planets data. With the current PDS4 standards it should be immaterial where the data are actually located since they should be discoverable from any search within the PDS. However, the DNs still play an important and active role in working with and advising new and experienced data providers, data users, and tool developers who interact with data in the PDS.
In the following subsections we provide representative examples of giant planets data that are available from the PDS, organized by science area. This is by no means an exhaustive list. Rather, it is intended to showcase the aforementioned breadth of data and the physical processes they probe. Many instances of giant planet observations in the PDS archive were obtained when the planet was not encountered by the spacecraft, i.e., at distances where the planet is poorly resolved or unresolved by imaging instruments. We highlight here only datasets where the spacecraft was in the vicinity of the giant planet and conducted scientific observations during a flyby, or the planet was the subject of a prolonged orbiter mission. We also provide examples of Earth-based observations of the giant planets that are archived in the PDS.

2.1. Atmospheric Science

The most widely recognized attribute of the giant planets is their dynamic atmospheres, including the presence of latitudinally confined cloud bands, long-lasting vortices, discrete convective cloud features, auroral emissions, and evidence of bolide impacts. The PDS archives a broad range of observations that support investigations of these phenomena, including some with temporal coverage spanning several decades that enable studies of seasonal changes in the giant planet atmospheres and comparative studies between the four giant planets of our Solar System.

2.1.1. Atmospheric Composition

The chemical composition of gas giant atmospheres can yield critical insights into both their formation and evolution as well as dynamical processes taking place below the cloud tops. Abundance measurements for the most ubiquitous elements (helium, carbon, nitrogen, and sulfur) as compared to the corresponding solar values provide constraints on different planetary formation scenarios [7]. Global abundances and the spatial distribution of disequilibrium species (e.g., PH 3 , CO) provide linkages between the atmospheric thermochemistry and the vertical convective motions, which also probes the heat balance of the deep atmosphere.
Several long-wave infrared (LWIR) spectrometers have flown on NASA missions to the outer planets, including the Infrared Interferometer Spectrometer and Radiometer (IRIS) instrument on Voyagers 1 and 2 and the Composite Infrared Spectrometer (CIRS) on Cassini. The flyby nature of the Voyager missions resulted in the same instruments being used to probe similar phenomena across all four of the giant planets, which can enable comparative studies. For example, data from the IRIS instruments were used to determine the helium abundance of Jupiter [8,9], Saturn [9,10], Uranus [11], and Neptune [12] (Figure 2). The 13 year duration of the Cassini mission enabled studies of seasonal variation in Saturn’s atmospheric composition and chemistry using the CIRS data [13,14,15]. (Both the raw and calibrated CIRS data are archived in the PDS and are accessible from https://atmos.nmsu.edu/data_and_services/atmospheres_data/Cassini/inst-cirs.html and https://pds-rings.seti.org/cassini/cirs/index.html, both accessed on 30 October 2022).

2.1.2. Global Dynamics

Every mission to the giant planets was equipped with some form of an imaging camera (Table 1), resulting in a wealth of data in the PDS that can be used for studies of giant planet atmospheric dynamics. The Voyager flybys revealed the large-scale zonal structure of the atmospheric circulations of Jupiter [16,17], Saturn [18,19], Uranus [20], and Neptune [21], with the Galileo and Cassini orbiters revealing time-dependence and small-scale structure in the wind fields on Jupiter [22] and Saturn [23,24], respectively. There were also valuable secondary imaging science opportunities during gravity assist flybys as conducted during Jupiter flybys by Cassini [25,26] and New Horizons [27].
The large-scale zonal and meridional wind speeds of the giant planets can be inferred through cloud-tracking techniques. This requires images with appropriate temporal spacing of ideally one to several hours: a time separation that is too small will not yield measurable motion, whereas a time separation that is too large increases the likelihood that the feature(s) being tracked will evolve and lose their fidelity. Cloud tracking techniques also are optimized when using images of high spatial resolution, which increases the number of features that can be tracked.

2.1.3. Vortices

In addition to enabling the study of global dynamics of the giant planets, the imaging instruments described in Section 2.1.2 have also been used for detailed studies of discrete vortices. Long-lived storms like Jupiter’s Great Red Spot have been characterized in terms of their chemistry and dynamics using observations from several instruments with data archived in the PDS [28,29]. In a more recent NASA mission, Juno’s polar orbit has provided unprecedented access to the polar regions of Jupiter, and data from the JIRAM instrument (https://pds-atmospheres.nmsu.edu/data_and_services/atmospheres_data/JUNO/jiram.html, accessed on 30 October 2022), as shown in Figure 3, revealed new insights into the formation, evolution, and vertical extent of polar vortex crystals.

2.1.4. Vertical Profiles

The variation of atmospheric temperature as well as molecular mole fractions with depth (or pressure) can be inferred by radio or stellar occultations. In the former, the S or X band (or both) radio signals from the spacecraft are the source, and the reduction in signal as it passes from the spacecraft through a giant planet atmosphere to be received on Earth by the Deep Space Network can be analyzed to produce pressure-temperature profiles as well as vertical abundance profiles. For stellar occultations, a star is the source, and the dimming of starlight as measured by remote sensing instruments on board a spacecraft (or on Earth) can yield vertical profiles for atmospheric constituents [30], particularly when components of the occultation data are spectroscopic [31]. The radio science and UV and IR spectroscopic remote sensing instruments on board Voyager 1 and 2, Galileo, Cassini, New Horizons, and Juno have all been used to extract information about the behavior of the giant planet atmospheres with depth. A quick-look view of the types of data archived in the PDS for each giant planet is available through the Integrated Archive pages at the PDS Atmospheres Node. (For example, the Integrated Jupiter Data Archive page (https://pds-atmospheres.nmsu.edu/data_and_services/atmospheres_data/JUPITER/matrices.html, accessed on 30 October 2022) provides a summary of the remote sensing instruments on board the spacecraft that flew by or orbited Jupiter.) Additionally, the RMS Node hosts 53 bundles of Earth-based, stellar occultations of the Uranian system (https://pds-rings.seti.org/pds4/bundles/uranus_occs_earthbased, accessed on 30 October 2022). Approximately half of these observations include atmospheric occultations by Uranus. They are presented as time series data, in units of counts-per-time, and are available for users who wish to further analyze them to generate vertical profiles of the Uranian atmosphere.
Other than occultations, the microwave observations from Juno’s Microwave Radiometer (MWR) instrument are sensitive to deeper regions of the Jovian atmosphere (from 0.5 bar to hundreds of bars of pressure) than any previously flown giant planet remote sensing instrument. These data, which are available from the PDS Atmospheres Node (https://pds-atmospheres.nmsu.edu/data_and_services/atmospheres_data/JUNO/microwave.html, accessed on 30 October 2022), are comprised of brightness temperatures in six different radiometric channels. The combination of data from MWR as well as instruments sensitive to Jupiter’s upper troposphere (e.g., JIRAM or JunoCam) is a powerful approach for exploring the depths to which atmospheric phenomena such as waves or storms extend [32].
Atmospheric entry probes are the most direct way to gain information about the vertical structure of the giant planet atmospheres. To date, only the Galileo mission to Jupiter was equipped with a dedicated probe, which entered Jupiter’s atmosphere on 7 December 1995. Key science results from the Galileo probe include the findings that Jupiter’s zonal winds increased with depth and remained high (and constant) from 4 to 21 bars [33], the relatively cloud-free Jovian “hot spot” where the probe entered the atmosphere had an anomalously low water abundance [34], and the probe detected radio signals attributed to the existence of Jovian lightning [35]. Additionally, at Saturn, when Cassini approached and plunged into the atmosphere, Cassini Radio Science was actively following the spacecraft with multiple Deep Space Network (DSN) receivers until the signal was lost. These in situ data, the Galileo Probe and the End-of-Mission raw Cassini radio science data, are archived in the PDS Atmospheres Node (https://pds-atmospheres.nmsu.edu/data_and_services/atmospheres_data/Galileo/galileo.html and https://atmos.nmsu.edu/data_and_services/atmospheres_data/Cassini/inst-rss.html, both accessed on 30 October 2022).

2.1.5. Upper Atmospheres and Aurora

Many of the spacecraft destined for the giant planets have been equipped with remote sensing instruments that enable the study of the neutral upper atmospheres, ionospheres, and auroral emissions. The ultraviolet spectrometers listed in Table 2 detected Ly α emission from the giant planets, revealing the complex interactions between each planet’s magnetic field and the solar wind and more local sources of charged particles. The Cassini Ultraviolet Imaging Spectrograph (UVIS) provided the most extensive dataset of a giant planet upper atmosphere to date. The UVIS observations of Saturn included solar and stellar occultations in the extreme ultraviolet (EUV) and far ultraviolet (FUV), dayglow spectral images, and images of the magnetosphere that show the vertical profile of neutral hydrogen escaping from Saturn’s atmosphere [36]. As shown in Figure 4, the Grand Finale phase of the Cassini mission enabled views of Saturn’s polar regions of unprecedented detail, revealing a complex structure of Saturn’s aurora that relates to the quiet or disturbed nature of the nearby plasma [37].
In addition to the auroral processes probed by the ultraviolet instruments, the Jovian Infrared Auroral Mapper (JIRAM) instrument on board the Juno spacecraft is sensitive to the 3.3–3.6 μ m emissions from H 3 + , which are used to characterize the morphology of the aurora and the conditions in the magnetosphere that lead to auroral emissions. The JIRAM nadir and limb observations of the H 3 + emissions (https://pds-atmospheres.nmsu.edu/data_and_services/atmospheres_data/JUNO/jiram.html, accessed on 30 October 2022) reveal complex morphology in Jupiter’s auroral ovals and an anti-correlation between derived thermospheric temperatures and the H 3 + density, reinforcing that H 3 + emission is an atmospheric cooling mechanism [38].

2.1.6. Impacts and Convective Outbursts

Impact events are ubiquitous throughout the Solar System, but they are challenging to observe without monitoring a target of interest night after night since they are signatures of a stochastic process. However, in the case of Comet Shoemaker-Levy 9 (SL9), whose 21 fragments impacted the Jovian atmosphere, observers had more than a year of advanced warning between the time the comet was discovered in March 1993 and the dates on which the fragments were predicted to impact Jupiter (July 1994). Numerous ground-based and space-based assets were used to observe the impacts, deriving information about the chemical composition of both the Jovian atmosphere and the comet fragments, the propagation of waves through the Jovian atmosphere, and the interaction of charged particles with both the magnetosphere and upper atmosphere of Jupiter. The spacecraft data from Galileo and Hubble Space Telescope are archived in the PDS Imaging Node and Atmospheres Node, respectively, and some ground-based observations of the SL9 impacts are also archived in the PDS Atmospheres Node (https://pds-atmospheres.nmsu.edu/data_and_services/atmospheres_data/catalog.htm#Jupiter, accessed on 30 October 2022).
In addition to impacts, convective outbursts are another episodic phenomenon that can be used to probe vertical transport and moist convection in giant planet atmospheres. Although generally there is little indication a priori of when such a storm will take place, fortunately these events are often so energetic that their effects are visible for weeks or months after the initial outburst. Such was the case for the Saturn storm of 2010–2011, which was first detected in December 2010 and whose aftermath was detected through August 2011. The Cassini spacecraft was well positioned to acquire observations of the storm with its instrument suite (Figure 5), revealing new insights into Saturn’s atmospheric structure, wind field, tropospheric cloud composition, stratospheric thermal structure and trace gas composition, ammonia vapor distribution, and associated lightning discharges [29]. These data are archived in the PDS Imaging (ISS and VIMS), Atmospheres (CIRS), RMS (ISS, VIMS and CIRS) and PPI (RPWS) nodes.

2.1.7. Ground-Based Photometric Monitoring

Studies of seasonal changes in the atmospheres of the giant planets are by necessity long-term endeavors, given the orbital periods of the gas giants (approximately 12, 29, 84, and 164 years for Jupiter, Saturn, Uranus, and Neptune, respectively). There are few facilities that have been operating continuously and collecting data in a self-consistent manner that would enable long-term studies of the giant planets; the 21-inch telescope at Lowell Observatory is one such example. Disk-integrated albedos of Uranus and Neptune in the Strömgren b and y filters spanning the period 1972–2016 (Figure 6) [39] are archived in the PDS [40]. They reveal seasonal changes in the integrated brightness of the ice giant planets as well as short-term brightness changes that are likely due to the appearance and fading of large, discrete atmospheric features.

2.2. Particles and Fields

Radio frequency emissions from Jupiter are very strong, at times even stronger than those of the Sun. Radio frequency observations at decametric wavelengths (∼22 MHz) were used to determine that Jupiter had an intrinsic magnetic field [41] before the first in situ observations by Pioneer 10. Other Jovian emissions include decametric radiation from synchrotron emissions of trapped electrons in Jovian radiation belts. The first spacecraft to make radio frequency observations were Voyager 1 and 2 in 1979. Both Voyager 1 and Voyager 2 carried a Planetary Radio Astronomy (PRA) experiment and a Plasma Wave Subsystem that measures electric and magnetic field waves in the range of Hz to 10 s of KHz. The radio and plasma wave investigations have probed the strong interaction between the moon Io and the upper atmosphere of Jupiter and have been used to determine the rotation rate of Jupiter. Plasma wave observations have been used to determine the electron density at Jupiter.
Since Voyager 1 and Voyager 2, the radio or plasma (or both) wave experiments have been flown on four subsequent missions to Jupiter. Table 3 gives the spacecraft and instruments, and the Digital Object Identifiers (DOIs) through which the data can be accessed directly from the PDS. The PDS is in the process of migrating all data holdings that were originally archived using the PDS3 metadata standard to the PDS4 standard, which provides a more modern archive structure and richer metadata. In cases where both PDS3 and PDS4 versions of the data are available, we list in Table 3 the access DOIs to the PDS4 data.
Figure 7 shows the radio spectra at the giant planets as well as that from Earth. As is the case for Jupiter, electromagnetic wave observations at Saturn have provided insight into the planetary rotation. However, at Saturn the period obtained called planetary period oscillations (PPO) is not the rotation period of the planet. The PPO period drifts over a time scale of years and is different for sources in the north and south (e.g., [42]). Its origin remains an area of intense study. Table 3 lists the radio astronomy and plasma wave data that are available from Saturn.
The Magnetospheric Imaging Instrument (MIMI) on Cassini provided a form of remote sensing of Saturn’s magnetosphere not available for the other outer planets. The coexistence of trapped energetic ions and neutral gases in Saturn’s magnetosphere allows the process of charge exchange to take place, in which an energetic particle takes an electron from a neutral particle, turning the ion into a neutral particle that is no longer magnetically trapped. The neutral particles can be imaged, providing a picture of the source energetic ion population, in a process called Energetic Neutral Atom (ENA) imaging. The Ion and Neutral Camera (INCA), was part of Cassini’s MIMI package. The INCA camera data are available from the PDS (Table 3), including processed images and movies of the ENA that are included as browse files. In Figure 8, we show a sequence of four ENA images in the magnetosphere along with auroral EUV images in the ionosphere. The images show the injection of ions and the corresponding aurora. Note, the images of the ions map along magnetic field lines to Saturn’s aurora and both rotate with Saturn.
Only Voyager 2 has visited Uranus and Neptune. Both the Planetary Radio Astronomy and the Plasma Wave Subsystem instruments returned data; these are also listed in Table 3.
Recently, all of the Voyager Plasma Wave Subsystem data have been made available in bundles covering the entire mission by using the PDS4 standard. The newly submitted PDS4 Voyager data are available in the NASA Common Data Format (CDF) format. PDS4 was designed to allow translation from the formats used in the archive to other formats. In space plasma research, the CDF format is widely used in research. PDS developed a version of CDF (called CDF-A) that adheres to PDS4 archival standards. A large number of research tools are available for data archived in CDF-A. The PPI Node is currently translating most of the PDS4 data in the archive into PDS4 documented CDF-A. Both the original PDS4 data and the translated data will be made available to users. Researchers wanting to use data translated into CDF-A can find the CDF-A standards documents and user guides at https://pds-ppi.igpp.ucla.edu/doc/index.jsp (accessed on 30 October 2022).
In addition to the spacecraft observations of the giant planets, Jupiter can be readily observed from Earth’s surface. In recent years, a worldwide program of continuous monitoring of Jovian radio waves has been maintained. In cooperation with the International Planetary Data Alliance (IPDA), PDS has archived and made available data from the Radio Jove project. The data are available in the archival version of the CDF-A format and in their native format used at radio observatories. The data from Radio Jove are also listed in Table 3. A unique aspect of the Radio Jove program is that it includes contributions from both professional and amateur observers. An inexpensive receiver that can detect the Jovian emissions is available through the NASA Radio Jove web site (https://radiojove.gsfc.nasa.gov/, accessed on 30 October 2022).
Planetary particles and fields data are of interest to scientists in both the astronomy and heliophysics communities. In addition to direct access from PPI, the data are being made available through the International Virtual Observatory Alliance’s (IVOA) protocol (EPN-TAP) and the Heliophysics API (HAPI). These will enable users in those communities to stream the data using the protocol with which they are familiar. At this writing, all of the Voyager and Cassini data are available through EPN-TAP and the Voyager, Cassini and Galileo data are available through the HAPI server. In addition, PPI supports the TOPCAT (Tool for OPerations on Catalogs And Tables) display system for data using EPN-TAP and Autoplot for data accessed through HAPI.

2.3. Interiors

The deep atmospheres and interior structure of the giant planets can be probed through gravity measurements, whereby the returned radio signal from the spacecraft is used to quantify slight deviations in its orbit due to the gravitational influence of the planet on the spacecraft. The Doppler shifts of the signals from the radio science instruments on board Voyager 1 and 2, Cassini, and Juno were measured by the Deep Space Network to probe the gravity fields of the giant planets. For example, recent analyses of measurements made by the Juno Gravity instrument revealed new insights into the depth limits of Jupiter’s zonal winds [44] and Jupiter’s asymmetric gravity field [45]. The radio science data for the giant planets are archived in the PDS at the PPI Node (Voyager and Galileo), the Atmospheres Node (Cassini and Juno) and the Small Bodies Node (New Horizons). The Radio Science subnode, housed at the Ring-Moon Systems Node, serves all of the PDS and provides expertise on working with radio science data.
Additionally, certain waves in Saturn’s rings have been used as records of processes originating in Saturn’s interior, similar to the information provided by a terrestrial seismometer ([46] and references therein). The data facilitating this research is primarily the derived occultation profiles taken from Cassini VIMS (https://pds-rings.seti.org/viewmaster/volumes/COVIMS_8xxx, accessed on 30 October 2022) and RSS (https://pds-rings.seti.org/viewmaster/volumes/CORSS_8xxx, accessed on 30 October 2022).

3. Data Discoverability and Usability

Given the diversity of giant planets data in the PDS, examples of which are described in Section 2, accessing and making use of those data might seem like a task that requires advanced knowledge of data processing and visualization, file manipulation, or data engineering. Here we discuss various methods already implemented – some across the PDS and some at specific Discipline Nodes – to aid in giant planets data search and discovery.
A new user to the PDS, or an experienced user who is interested in exploring the PDS holdings rather than conducting a focused search for something specific, should start at the PDS homepage (https://pds.nasa.gov, accessed on 30 October 2022). From there, the Data Search function enables users to search by Target (e.g., Uranus System) or Mission (e.g., Voyager). In each case the search returns links to (a) specific search tools – including those described in the following subsections – that are most appropriate for finding the data of interest, and (b) resource pages containing more information about the PDS holdings in the area of interest.
Experienced PDS users, or those who know more specifically what kind of giant planets data they are searching for, may wish to begin their search at the relevant DN. There users can make use of sophisticated tools developed by the DNs that enable searching on parameters such as observing geometry, positional information, or science theme. Examples of such tools are described in the following subsections.

3.1. OPUS and Viewmaster: Search and Browse the RMS Archive

An enhanced data browser is provided by Viewmaster (https://pds-rings.seti.org/viewmaster/volumes, accessed on 30 October 2022), which allows users to see every data volume in the RMS archive within an intuitively designed framework so that corresponding preview images, diagrams, indices, and documentation are listed in parallel to each data product, and related files can be found straightforwardly. The process of finding and using PDS data archived by the RMS Node is illustrated in Figure 9 by an example of how a user can generate a spectrum of Saturn’s aurora.
Alongside Viewmaster, seamless cross-mission cross-instrument search for spacecraft and ground-based remote sensing observations is provided by the RMS Node’s Outer Planet Unified Search (OPUS) tool (https://opus.pds-rings.seti.org, accessed on 30 October 2022). OPUS uses extensive metadata generated by the RMS Node using the most current SPICE kernels for enhanced search capabilities and provides preview images for an enhanced browsing experience, so users can easily filter down through the available holdings to reach the desired data products. Figure 10 illustrates how a user could search through OPUS to obtain the same data (and find additional metadata) used to plot the spectrum described in Figure 9. OPUS supports full geometric search of the giant planets for Voyager ISS, Cassini CIRS, ISS, UVIS, and VIMS, and New Horizons LORRI.

3.2. Ephemeris Tools

RMS also maintains a suite of tools to assist planetary scientists in the planning, acquisition and interpretation of observations (https://pds-rings.seti.org/tools, accessed on 30 October 2022). These tools help users to understand the context of observations, by generating ephemerides for a planet or any of its moons as a function of time, or diagrams of a planetary system at specified times from various viewpoints, or diagrams tracking moons:
  • Planet Viewer generates a diagram showing the appearance of a planetary system at a specified time. Bodies and rings are rendered with terminators and shadows as appropriate. The viewpoint can be Earth’s center, a particular Earth-based observatory, JWST, HST, or a specific planetary spacecraft. Figure 11 shows diagrams from the Jupiter Viewer tool for the same approximate times of Galileo’s observations of Jupiter and its four large moons in 1610.
  • Moon Tracker generates a diagram showing the apparent east–west motion of one or more moons relative to the disk of a planet, within a specified time period.
  • Ephemeris Generator generates a table listing of useful information about the viewing geometry for a planet or any of its moons as a function of time. Users are free to specify which of a variety of useful quantities to tabulate (e.g., RA and dec, phase angle, ring opening angle, distance, lunar phase, etc.)
The tools are supported for many missions, including Juno, New Horizons, Cassini, Europa Clipper, JUICE, HST, and JWST, and offer temporal coverage between the years 1550 and 2650.

3.3. User-Directed Classification via Self-Supervised Learning

As useful as OPUS and Viewmaster are, the system requires the user to already have knowledge about what data they wish to obtain. The RMS Node is developing a pilot project in self-supervised learning [48], which we hope will eventually result in the ability to add search and classification capabilities based on features in the data. For example, users could identify similarities across objects, instruments, or wavelengths to focus on characteristics of interest to their investigations. This is one way in which machine learning methods can speed up the searching process and aid in discovery of relevant data sets.

3.4. Mission Pages

The PDS Discipline Nodes host a variety of mission-specific pages to help users access all data from individual missions. Legacy data from missions that were archived using the PDS3 standards are currently being migrated to the new PDS4 archive standard. Experienced users who are familiar with these missions may be better served by accessing the node pages directly; however, new users should start with the mission pages contain a wealth of background and contextual information that will aid them as they begin working with the mission data. Most mission pages serve as portals to instrument-specific data located at the DNs and cross-referenced through these mission pages.
An example set of detailed mission pages are those created for the Cassini mission, which generated 635 GB of science data from 12 instruments while orbiting Saturn for more than 13 years (2004–2017). Near the end of the mission, the Cassini Project in partnership with the PDS developed a set of mission web pages that organized the data by science discipline and included support data and tools to ensure long-term access to the Cassini data by future generations of researchers [49]. Mission data archived in the PDS are generally presented to the users by mission, and then organized by instrument. The Cassini web pages maintained by the Atmospheres Node (https://atmos.nmsu.edu/data_and_services/atmospheres_data/Cassini/sci-saturn.html, accessed on 30 October 2022) go beyond this structure to also provide a science-based thematic organization that contains numerous resources for accessing data concerning Saturn’s interior and atmosphere. Additional mission pages for Cassini are maintained by the other relevant DNs (RMS (https://pds-rings.seti.org/cassini), accessed on 30 October 2022), SBN, IMG, and PPI).
The Juno mission is an example of an active mission (at the time of this writing), with accumulating datasets that continue to provide a wealth of new observations of the Jovian system. ATM serves as the lead PDS node for the Juno mission and coordinates the archiving of Juno data, which are distributed through the mission web page (https://pds-atmospheres.nmsu.edu/data_and_services/atmospheres_data/JUNO/juno.html, accessed on 30 October 2022). Links to the various instruments take users to corresponding pages at other nodes (e.g., IMG and PPI). These pages are designed to provide information about the mission and instruments to help users find and make use of Juno data.

3.5. Planetary Image Locator Tool (PILOT)

The Planetary Image Locator Tool (PILOT) (http://pilot.wr.usgs.gov, accessed on 30 October 2022) is a web-based interface [50] that provides access to a search tool for several PDS orbital image catalogs indexed by the Unified Planetary Coordinates (UPC) database [51]. The UPC database contains improved geometric, photometric, and positional information about planetary orbital image data, computed using a uniform coordinate system and the most up-to-date SPICE kernels. These improvements result in enhanced image metadata and enable the user’s ability to identify desired images, extending beyond those provided by the PDS. Precise searches can be performed within PILOT on individual metadata fields stored in the UPC database. In addition, PILOT has access to browse images, links to the raw images, and label information that can help scientists and cartographers perform further investigations on the images. Although all data in the UPC and PILOT must be supported by a camera model that describes detailed instrument and target geometric behavior during image acquisition, together these services address ∼90% of the orbital image data for which Imaging node is responsible to the PDS. PILOT not only allows users to download select images either individually or through provided scripts to pull large sets of images, it also provides direct access to the Map Projection on the Web (POW) online tool. PILOT was developed and is maintained by the Cartography and Imaging Sciences Node to complement other node delivery services.

3.6. Map Projection on the Web (POW)

The Map Projection on the Web (POW) (https://astrocloud.wr.usgs.gov/, accessed on 30 October 2022) service [52,53] allows users to convert raw PDS images to science-ready, map-projected products. POW integrates PILOT [50] and the UPC [51], the Integrated Software for Imagers and Spectrometers (ISIS) package (https://isis.astrogeology.usgs.gov/, accessed on 30 October 2022) [54], Geospatial Data Abstraction Library (GDAL) (https://gdal.org/, accessed on 30 October 2022) [55], and the Astrogeology cluster for its processing and delivery needs. POW provides users with calibrated cartographic images that can be used readily for analysis of atmospheric dynamics, cloud morphology and change detection, merging of dissimilar instrument images, analysis in a Geographic Image System (GIS) and use in a host of other scientific applications (e.g., ArcMAP, ENVI, Matlab, JMARS, QGIS, etc.). POW allows researchers to make use of a wealth of PDS science data without having to install or learn how to run ISIS and to benefit from a recommended processing pipeline as defined by USGS and the instrument teams. This service can also be used as a learning tool or an introduction to ISIS for those who would like to run it locally because the ISIS commands will be logged and delivered to the user. Using the POW front-end, a user is allowed to (1) select and submit a list of up to 250 PDS raw images, (2) define an output map projection and its parameters (e.g., Polar Stereographic, Sinusoidal), (3) define the output bit type (8, 16, or 32 bit), and (4) select an ISIS or PDS output format or a more standardized geospatial format such as GeoTiff, PNG, or JPEG. Conversion to the various supported image formats will be completed using the GDAL, which passes all cartographic information into the output format.

3.7. Planetary Image Atlas

The Atlas (https://pds-imaging.jpl.nasa.gov/Atlas, accessed on 30 October 2022) [56] provides access to the full collection of PDS-IMG data available in online holdings and data node catalogs. The Atlas uses faceted navigation to support searches on common search criteria such as mission name, instrument name, target, product type, observation/illumination geometry metadata, geographic coordinates, time constraints, etc. The Atlas also allows users to search images based on their “content” (i.e., moons, rings, clouds) through the use of deep convolutional neural networks to classify images [57,58].

4. Discussion

Looking forward, the PDS will be the primary repository for giant planets data from several upcoming missions and derived datasets, as well as supporting research conducted to aid in the interpretation of the remotely sensed giant planets data already archived in the PDS.

4.1. Future Mission Data

Juno began its extended mission phase in July 2021. The prime mission data, along with the accumulating data from the extended phase, will continue to be available from the PDS ATM, RMS, PPI, and IMG nodes. Higher order data products resulting from the end of the prime mission such as gravity model harmonic coefficients, auroral UV maps, auroral H 3 + maps, magnetic field models among other products will also be available from the aforementioned nodes as they complete the peer review process and become ingested into the archive.
Beyond Juno, NASA’s Europa Clipper and ESA’s JUpiter ICy moons Explorer (JUICE) missions will conduct detailed investigations of several of Jupiter’s icy satellites. If observations of Jupiter are also made, those data will be archived in the PDS in the relevant node(s) (or linked to from the PDS in the case of the JUICE data, whose primary archive will be ESA’s Planetary Science Archive).

4.2. Data Derived from Analysis of Remote Sensing Observations

The scientific impact of giant planets remote sensing data in the PDS is felt long after the end of a mission. In some cases the data themselves are used for investigations long after their acquisition, making use of new analysis techniques, tools, or interpretations. In other cases the data are used to inspire new, related projects that enhance the interpretation of the original data. In these cases, the resulting data are often referred to as derived data, and ideally they should also be archived in the PDS to optimize their discoverability and usability.
There are numerous examples of derived data relevant to the giant planets that are archived in the PDS, for example, Saturn zonal wind profiles derived from Cassini ISS observations [59] and vertical profiles of Saturn’s thermospheric temperature and H 2 densities derived from the analysis of Cassini UVIS and CIRS stellar occultation observations [60]. With the greater demand for archiving derived data products now being placed on researchers funded by NASA’s Research and Analysis programs, the PDS expects to receive and archive numerous additional derived data products relevant to the giant planets. Both future data users as well as data proposers are encouraged to turn to the PDS as a logical repository for their derived data archiving needs.

4.3. Data Generated in Support of Giant Planet Studies

Laboratory experiments involving gases at or near conditions appropriate for the giant planets are required for the interpretation of remote sensing observations of the giant planets. For example, interest in hydrocarbons in the upper atmospheres of Jupiter and Saturn (and Titan) drove the need for better chemistry data to understand the behavior of these species in such extreme conditions [61]. The PDS archives laboratory data alongside the relevant mission and ground-based observatory data to aid in the advancement of the science of atmospheric chemistry in the outer Solar System.
Computational models and simulations are another critical tool used for the interpretation of remotely sensed giant planets data. Although model outputs are generally not archived in the PDS as they do not conform to PDS standards, several PDS nodes have implemented – or are now implementing – annex-style repositories to meet the data accessibility of the planetary modeling communities [62]. For example, the PPI Node maintains an annex (https://pds-ppi.igpp.ucla.edu/search/annex/, accessed on 30 October 2022) for models describing the Jovian current sheet and the global magnetic field of Saturn. The Atmospheres Node is in the process of implementing an atmospheric modeling annex that will be used to preserve outputs from atmospheric dynamical models, including those relevant to the giant planets.

4.4. Connections to Other Archives

In 2020 NASA chartered the Planetary Data Ecosystem (PDE) Independent Review Board (IRB) to provide a holistic evaluation of the planetary science community’s access to and use of planetary data. The PDE IRB report provided scores of findings and recommendations aimed at fostering the development of the ecosystem and addressing barriers to data preservation and the use of planetary data [63]. The recognition that there is an entire ecosystem surrounding access to and use of planetary data was a critical outcome of the PDE IRB effort, as well as the need to improve the connectivity of the different elements of the ecosystem.
For example, data from the Hubble Space Telescope (HST) have led to many significant discoveries related to the giant planets during its 32-year (and counting) mission. These include the appearance and disappearance of dark vortices in the atmospheres of Uranus and Neptune [64], the unique nature of Saturn’s aurorae [65], the long-term studies of the shrinking of Jupiter’s Great Red Spot [28], and the changes in Jupiter’s zonal wind profile [66]. The HST data, which are archived at the Mikulski Archive for Space Telescopes (MAST, https://archive.stsci.edu/hlsp/search.php, accessed on 30 October 2022), contains thousands of observations of the giant planets, but they are not integrated into PDS and are not easily searchable by planetary scientists.
The RMS Node is nearing completion of a pipeline to fully incorporate HST data identified as relevant to the Solar System into PDS4, with fully searchable OPUS metadata. The RMS pipeline can automatically query MAST, identify Solar System observations by a variety of attributes, retrieve the relevant files, and construct a corresponding PDS4 bundle that includes planetary metadata. When this project is complete, OPUS users will be able to access HST data based on a full set of Solar System-focused search attributes. In the meantime, RMS currently maintains a large collection of “placeholder” HST volumes (in PDS3 format). These contain browse products and metadata, but they redirect users to MAST to retrieve the actual data files. The foundation laid by this project will also enable the PDS to give similar treatment to JWST data.
In an effort to further improve interoperability, the PDS has played a major role in the development of the International Planetary Data Alliance (IPDA, https://planetarydata.org, accessed on 30 October 2022), whose goal is to facilitate access to and the exchange of planetary science data that are managed by a number of international space agencies. Enabling broad, international access to planetary data requires the use of common standards across the archives of different agencies (PDS4 has been adopted as the current standard for IPDA) and clear linkages among the data archives. Although the giant planets have yet to be explored by spacecraft managed by agencies other than NASA, that will change with ESA’s JUICE mission, and the PDS will play a key role in ensuring transparent access to the JUICE data from the PDS.
Finally, with the discovery of thousands of giant planets in exoplanetary systems, there has been a tremendous increase in the number of studies that treat the giant planets of our Solar System as analogs for advancing our understanding of exoplanets. Current and future data in the PDS are vital to such studies, including for example full disk albedos of the giant planets [67,68], full-disk images of the giant planets acquired at a wide range of phase angles [69], and laboratory measurements made at giant planet and exoplanetary analog conditions [61]. Efforts are currently underway within NASA’s Science Mission Directorate to enhance interoperability across the archives of the Astrophysics, Heliophysics, Planetary Science, and Earth Science Divisions. Exoplanet studies, which are heavily interdisciplinary in nature, are a motivating driver for such efforts and potential use cases are currently being explored.

5. Conclusions

The giant planets data within the PDS represent a record of an incredible human achievement: spacecraft exploration of the outer Solar System aimed at answering fundamental science questions concerning the origin and evolution of planets. The data also serve as the scientific legacy of numerous researchers who have contributed data they collected, analyzed, and used to generate new knowledge about the workings of the giant planets.
The data in the PDS are preserved using state-of-the-art information technology, with tools available to aid in their discoverability and usability. The fact that data from NASA’s earliest days of giant planet exploration are still being used today to obtain new insights about the workings of the gas giants [70] demonstrates their long-lasting utility and benefit to science. The PDS will continue to uphold its role as NASA’s preeminent archive for giant planets data while evolving to meet modern data archiving challenges and the changing needs of its user base.

Author Contributions

Conceptualization, N.J.C., M.S.T., R.J.W. and M.K.G.; writing—original draft preparation, N.J.C., M.S.T., M.J.T.M., R.J.W., L.F.H., L.D.V.N., J.J.B., J.M.B.; writing—review and editing, M.K.G.; visualization, N.J.C., M.J.T.M., R.J.W., M.K.G. All authors have read and agreed to the published version of the manuscript.

Funding

This research was funded by the Planetary Science Division of NASA’s Science Mission Directorate through award numbers 80NSSC22M0020 (ATM), 80NSSC22M0022 (RMS), 80NSSC22M0023 (PPI), 80HQTR22TA003 (IMG), and 80NSSC22M0024 (SBN).

Data Availability Statement

All of the data described in this paper are publicly available through the NASA Planetary Data System (https://pds.nasa.gov, accessed on 30 October 2022).

Acknowledgments

Any use of trade, firm, or product names is for descriptive purposes only and does not imply endorsement by the U.S. Government. The authors thank R. Beebe for a pre-submission review of the manuscript.

Conflicts of Interest

The authors declare no conflict of interest. The funders had no role in the design of the study; in the collection, analyses, or interpretation of data; in the writing of the manuscript, or in the decision to publish the results.

Abbreviations

The following abbreviations are used in this manuscript:
APIApplication Programming Interface
ATMAtmospheres Node
CDFCommon Data Format
CDF-ACommon Data Format Archival
CIRSComposite Infrared Spectrometer (Cassini)
CODMACCommittee on Data Management and Computation
DecDeclination
DNDiscipline Node
DOIDigital Object Identifier
DSNDeep Space Network
ENAEnergetic Neutral Atom
EPN-TAPEuroPlaNet Table Access Protocol
ESAEuropean Space Agency
EUVExtreme Ultraviolet spectrographic channel of the UVIS instrument (Cassini)
FAIRFindability, Accessibility, Interoperability, and Reuse of digital assets
FUVFar Ultraviolet spectrographic channel of the UVIS instrument (Cassini)
GDALGeospatial Data Abstraction Library
GeoTiffA standard geospatial format
GISGeographic Information System
HAPIHeliophysics Application Programming Interface
HSTHubble Space Telescope
IMGCartography and Imaging Sciences Node
INCAIon and Neutral Camera (Cassini)
IPDAInternational Planetary Data Alliance
IPPImaging Photopolarimeter (Pioneer 10, 11)
IRInfrared
IRBIndependent Review Board
IRISInfrared Interferometer Spectrometer and Radiometer (Voyager 1, 2)
ISSImaging Science Subsystem (Cassini, Voyager 1, 2)
IVOAInternational Virtual Observatory Alliance
JIRAMJovian Infrared Auroral Mapper (Juno)
JPEGA common image format developed by the Joint Photographic Experts Group
JUICEJUpiter ICy moons Explorer (European Space Agency mission)
JWSTJamesWebb Space Telescope
ISISIntegrated Software for Imagers and Spectrometers
LORRILong Range Reconnaissance Imager (New Horizons)
LWIRLong-Wave Infrared Spectrometer (several missions)
MASTMikulski Archive for Space Telescopes
MIMIMagnetospheric Imaging Instrument (Cassini)
MVICMultispectral Visible Imaging Camera (New Horizons)
MWRMicroWave Radiometer (Juno)
NASANational Aeronautics and Space Administration
NIMSNear Infrared Mapping Spectrometer
NSSDCNational Space Science Data Center
OPUSOuter Planet Unified Search
PDEPlanetary Data Ecosystem
PDSPlanetary Data System
PDS3Governing standards of the PDS from the mid-1990s until the adoption of PDS4
PDS4Current governing standards of the PDS, adopted in 2005
PIPrincipal Investigator
PILOTPlanetary Image Locator Tool
PNGPortable Network Graphic, a common image format
POWMap Projection on the Web
PPIPlanetary Plasma Interactions Node
PPOPlanetary Period Oscillations
PRAPlanetary Radio Astronomy (Voyager 1, 2)
PWSPlasmaWave Subsystem (Voyager 1, 2)
RARight Ascension
RMSRing-Moon Systems Node
RSSRadio Science Subsystem (Cassini)
RSSNRadio Science Sub-Node
RPWSRadio and Plasma Wave Science (Cassini)
SBNSmall Bodies Node
SL9Comet Shoemaker-Levy 9
SPICEObservation geometry information system for planetary spacecraft
SSISolid State Imager (Galileo)
TOPCATTool for OPerations on Catalogs And Tables
UPCUnified Planetary Coordinates
URAPUnified Radio and Plasma Experiment
USGSUnited States Geological Survey
UVUltraviolet
UVISUltraviolet Imaging Spectrograph (Cassini)
VIMSVisual and Infrared Mapping Spectrometer (Cassini)

References

  1. Bernstein, R.; Alexander, S.S.; Arvidson, R.E.; Ely, O.; Goad, C.; Groth, E.J.; Landgrebe, D.A.; Legeckis, R.; McPherron, R.L.; Tananbaum, H.; et al. Data Management and Computation; Volume 1: Issues and recommendations associated with distributed computation and data management systems for the space sciences; National Academy Press: Washington, DC, USA, 1982. [Google Scholar] [CrossRef]
  2. Arvidson, R.E.; Hunt, G.; Landgrebe, D.A.; Levinthal, E.; Ludwig, G.H.; McCord, T.B.; Schreier, E.; Walker, R.; Wiederhold, G. Data Management and Computation; Volume 2: Issues and recommendations associated with distributed computation and data management systems for the space sciences; National Academy Press: Washington, DC, USA, 1986. [Google Scholar] [CrossRef] [Green Version]
  3. Planetary Data System Roadmap Study for 2017–2026. Technical Report, NASA Science Mission Directorate. 2017. Available online: https://pds.nasa.gov/home/about/PlanetaryDataSystemRMS17-26_20jun17.pdf (accessed on 30 October 2022).
  4. Data Design Working Group. PDS4 Concepts. Technical report, NASA PDS. 2021. Available online: https://pds.jpl.nasa.gov/datastandards/documents/concepts/Concepts_1.17.0.pdf (accessed on 30 October 2022).
  5. Prockter, L.; Tiscareno, M.S.; Grayzeck, E.J.; Acton, C.H.; Arvidson, R.E.; Bauer, J.M.; Beebe, R.; Besse, S.; Chanover, N.; Crichton, D.J.; et al. The Planetary Data System: A Vital Component in NASA’s Science Exploration Program. Bull. Am. Astron. Soc. 2021, 53, 459. [Google Scholar] [CrossRef]
  6. Raugh, A.; Hughes, J.S. The Road to an Archival Data Format—Data Structures. Planet. Sci. J. 2021, 2, 204. [Google Scholar] [CrossRef]
  7. Owen, T.; Encrenaz, T. Compositional constraints on giant planet formation. Planet. Space Sci. 2006, 54, 1188–1196. [Google Scholar] [CrossRef]
  8. Gautier, D.; Conrath, B.; Flasar, M.; Hanel, R.; Kunde, V.; Chedin, A.; Scott, N. The helium abundance of Jupiter from Voyager. J. Geophys. Res. 1981, 86, 8713–8720. [Google Scholar] [CrossRef] [Green Version]
  9. Conrath, B.J.; Gautier, D.; Hanel, R.A.; Hornstein, J.S. The helium abundance of Saturn from Voyager measurements. Astrophys. J. 1984, 282, 807–815. [Google Scholar] [CrossRef]
  10. Conrath, B.J.; Gautier, D. Saturn Helium Abundance: A Reanalysis of Voyager Measurements. Icarus 2000, 144, 124–134. [Google Scholar] [CrossRef]
  11. Conrath, B.; Gautier, D.; Hanel, R.; Lindal, G.; Marten, A. The helium abundance of Uranus from Voyager measurements. J. Geophys. Res. 1987, 92, 15003–15010. [Google Scholar] [CrossRef]
  12. Conrath, B.J.; Gautier, D.; Lindal, G.F.; Samuelson, R.E.; Shaffer, W.A. The helium abundance of Neptune from Voyager measurements. J. Geophys. Res. Supp. 1991, 96, 18907. [Google Scholar] [CrossRef]
  13. Fouchet, T.; Moses, J.I.; Conrath, B.J. Saturn: Composition and Chemistry. In Saturn from Cassini-Huygens; Dougherty, M.K., Esposito, L.W., Krimigis, S.M., Eds.; Springer: New York, NY, USA, 2009; p. 83. [Google Scholar] [CrossRef]
  14. Fletcher, L.N.; Achterberg, R.K.; Greathouse, T.K.; Orton, G.S.; Conrath, B.J.; Simon-Miller, A.A.; Teanby, N.; Guerlet, S.; Irwin, P.G.J.; Flasar, F.M. Seasonal change on Saturn from Cassini/CIRS observations, 2004–2009. Icarus 2010, 208, 337–352. [Google Scholar] [CrossRef]
  15. Fletcher, L.N.; Greathouse, T.K.; Guerlet, S.; Moses, J.I.; West, R.A. Saturn’s Seasonally Changing Atmosphere. In Saturn in the 21st Century; Baines, K.H., Flasar, F.M., Krupp, N., Stallard, T., Eds.; Cambridge University Press: Cambridge, UK, 2018; pp. 251–294. [Google Scholar] [CrossRef]
  16. Smith, B.A.; Soderblom, L.A.; Johnson, T.V.; Ingersoll, A.P.; Collins, S.A.; Shoemaker, E.M.; Hunt, G.E.; Masursky, H.; Carr, M.H.; Davies, M.E.; et al. The Jupiter System Through the Eyes of Voyager 1. Science 1979, 204, 951–972. [Google Scholar] [CrossRef]
  17. Smith, B.A.; Soderblom, L.A.; Beebe, R.; Boyce, J.; Briggs, G.; Carr, M.; Collins, S.A.; Cook, A.F.; Danielson, G.E.; Davies, M.E.; et al. The Galilean Satellites and Jupiter: Voyager 2 Imaging Science Results. Science 1979, 206, 927–950. [Google Scholar] [CrossRef]
  18. Smith, B.A.; Soderblom, L.; Beebe, R.; Boyce, J.; Briggs, G.; Bunker, A.; Collins, S.A.; Hansen, C.J.; Johnson, T.V.; Mitchell, J.L.; et al. Encounter with Saturn: Voyager 1 Imaging Science Results. Science 1981, 212, 163–191. [Google Scholar] [CrossRef]
  19. Smith, B.A.; Soderblom, L.; Batson, R.; Bridges, P.; Inge, J.; Masursky, H.; Shoemaker, E.; Beebe, R.; Boyce, J.; Briggs, G.; et al. A New Look at the Saturn System: The Voyager 2 Images. Science 1982, 215, 504–537. [Google Scholar] [CrossRef]
  20. Smith, B.A.; Soderblom, L.A.; Beebe, R.; Bliss, D.; Boyce, J.M.; Brahic, A.; Briggs, G.A.; Brown, R.H.; Collins, S.A.; Cook, A.F.; et al. Voyager 2 in the Uranian System: Imaging Science Results. Science 1986, 233, 43–64. [Google Scholar] [CrossRef] [Green Version]
  21. Smith, B.A.; Soderblom, L.A.; Banfield, D.; Barnet, C.; Basilevsky, A.T.; Beebe, R.F.; Bollinger, K.; Boyce, J.M.; Brahic, A.; Briggs, G.A.; et al. Voyager 2 at Neptune: Imaging Science Results. Science 1989, 246, 1422–1449. [Google Scholar] [CrossRef] [Green Version]
  22. Vasavada, A.R.; Ingersoll, A.P.; Banfield, D.; Bell, M.; Gierasch, P.J.; Belton, M.J.; Orton, G.S.; Klaasen, K.P.; DeJong, E.; Breneman, H.; et al. Galileo Imaging of Jupiter’s Atmosphere: The Great Red Spot, Equatorial Region, and White Ovals. Icarus 1998, 135, 265–275. [Google Scholar] [CrossRef]
  23. Porco, C.C.; Baker, E.; Barbara, J.; Beurle, K.; Brahic, A.; Burns, J.A.; Charnoz, S.; Cooper, N.; Dawson, D.D.; Genio, A.D.D.; et al. Cassini Imaging Science: Initial Results on Saturn’s Atmosphere. Science 2005, 307, 1243–1247. [Google Scholar] [CrossRef] [Green Version]
  24. García-Melendo, E.; Pérez-Hoyos, S.; Sánchez-Lavega, A.; Hueso, R. Saturn’s zonal wind profile in 2004–2009 from Cassini ISS images and its long-term variability. Icarus 2011, 215, 62–74. [Google Scholar] [CrossRef]
  25. Porco, C.C.; West, R.A.; McEwen, A.; Genio, A.D.D.; Ingersoll, A.P.; Thomas, P.; Squyres, S.; Dones, L.; Murray, C.D.; Johnson, T.V.; et al. Cassini Imaging of Jupiter’s Atmosphere, Satellites, and Rings. Science 2003, 299, 1541–1547. [Google Scholar] [CrossRef] [Green Version]
  26. Li, L.; Ingersoll, A.P.; Vasavada, A.R.; Simon-Miller, A.A.; Genio, A.D.D.; Ewald, S.P.; Porco, C.C.; West, R.A. Vertical wind shear on Jupiter from Cassini images. J. Geophys. Res. 2006, 111, E04004. [Google Scholar] [CrossRef]
  27. Simon, A.A.; Li, L.; Reuter, D.C. Small-scale waves on Jupiter: A reanalysis of New Horizons, Voyager, and Galileo data. Geophys. Res. Lett. 2015, 42, 2612–2618. [Google Scholar] [CrossRef]
  28. Simon, A.A.; Wong, M.H.; Rogers, J.H.; Orton, G.S.; de Pater, I.; Asay-Davis, X.; Carlson, R.W.; Marcus, P.S. Dramatic Change in Jupiter’s Great Red Spot from Spacecraft Observations. Astrophys. J. Lett. 2014, 797, L31. [Google Scholar] [CrossRef] [Green Version]
  29. Sanchez-Lavega, A.; Fischer, G.; Fletcher, L.N.; Garcia-Melendo, E.; Hesman, B.; Perez-Hoyos, S.; Sayanagi, K.M.; Sromovsky, L.A. The Great Saturn Storm of 2010–2011. In Saturn in the 21st Century; Baines, K.H., Flasar, F.M., Krupp, N., Stallard, T., Eds.; Cambridge University Press: Cambridge, UK, 2018; pp. 377–416. [Google Scholar] [CrossRef]
  30. Elliot, J.L.; Olkin, C.B. Probing Planetary Atmospheres with Stellar Occultations. Ann. Rev. Earth Planet. Sci. 1996, 24, 89–124. [Google Scholar] [CrossRef] [Green Version]
  31. Greathouse, T.K.; Gladstone, G.R.; Moses, J.I.; Stern, S.A.; Retherford, K.D.; Vervack, R.J.; Slater, D.C.; Versteeg, M.H.; Davis, M.W.; Young, L.A.; et al. New Horizons Alice ultraviolet observations of a stellar occultation by Jupiter’s atmosphere. Icarus 2010, 208, 293–305. [Google Scholar] [CrossRef]
  32. Fletcher, L.N.; Orton, G.S.; Greathouse, T.K.; Rogers, J.H.; Zhang, Z.; Oyafuso, F.A.; Eichstädt, G.; Melin, H.; Li, C.; Levin, S.M.; et al. Jupiter’s Equatorial Plumes and Hot Spots: Spectral Mapping from Gemini/TEXES and Juno/MWR. J. Geophys. Res. (Planets) 2020, 125, e06399. [Google Scholar] [CrossRef]
  33. Atkinson, D.H.; Ingersoll, A.P.; Seiff, A. Deep winds on Jupiter as measured by the Galileo probe. Nature 1997, 388, 649–650. [Google Scholar] [CrossRef]
  34. Niemann, H.B.; Atreya, S.K.; Carignan, G.R.; Donahue, T.M.; Haberman, J.A.; Harpold, D.N.; Hartle, R.E.; Hunten, D.M.; Kasprzak, W.T.; Mahaffy, P.R.; et al. The composition of the Jovian atmosphere as determined by the Galileo probe mass spectrometer. J. Geophys. Res. 1998, 103, 22831–22846. [Google Scholar] [CrossRef]
  35. Rinnert, K.; Lanzerotti, L.J.; Uman, M.A.; Dehmel, G.; Gliem, F.O.; Krider, E.P.; Bach, J. Measurements of radio frequency signals from lightning in Jupiter’s atmosphere. J. Geophys. Res. 1998, 103, 22979–22992. [Google Scholar] [CrossRef]
  36. Nagy, A.F.; Kliore, A.J.; Mendillo, M.; Miller, S.; Moore, L.; Moses, J.I.; Müller-Wodarg, I.; Shemansky, D. Upper Atmosphere and Ionosphere of Saturn. In Saturn from Cassini-Huygens; Dougherty, M.K., Esposito, L.W., Krimigis, S.M., Eds.; Springer: New York, NY, USA, 2009; p. 181. [Google Scholar] [CrossRef]
  37. Bader, A.; Cowley, S.W.H.; Badman, S.V.; Ray, L.C.; Kinrade, J.; Palmaerts, B.; Pryor, W.R. The Morphology of Saturn’s Aurorae Observed During the Cassini Grand Finale. Geophys. Res. Lett. 2020, 47, e85800. [Google Scholar] [CrossRef] [Green Version]
  38. Dinelli, B.M.; Adriani, A.; Mura, A.; Altieri, F.; Migliorini, A.; Moriconi, M.L. JUNO/JIRAM’s view of Jupiter’s H 3 + emissions. Philos. Trans. R. Soc. Lond. Ser. A 2019, 377, 20180406. [Google Scholar] [CrossRef] [Green Version]
  39. Lockwood, G.W. Final compilation of photometry of Uranus and Neptune, 1972–2016. Icarus 2019, 324, 77–85. [Google Scholar] [CrossRef]
  40. Lockwood, G.W. Lowell Observatory Uranus and Neptune b (472 nm) and y (551 nm) Photometry (1972–2016) Data Archive. 2019; PDS Atmospheres Node (ATM). [Google Scholar] [CrossRef]
  41. Burke, B.F.; Franklin, K.L. Observations of a Variable Radio Source Associated with the Planet Jupiter. J. Geophys. Res. 1955, 60, 213–217. [Google Scholar] [CrossRef]
  42. Gurnett, D.; Persoon, A.; Kurth, W.; Groene, J.; Averkamp, T.; Dougherty, M.; Southwood, D. The Variable Rotation Peripod of the Inner Region of Saturn’s Plasma Disk. Science 2007, 316, 442–445. [Google Scholar] [CrossRef]
  43. Zarka, P. Auroral radio emissions at the outer planets: Observations and theories. J. Geophys. Res. 1998, 103, 20159–20194. [Google Scholar] [CrossRef]
  44. Kaspi, Y.; Galanti, E.; Showman, A.P.; Stevenson, D.J.; Guillot, T.; Iess, L.; Bolton, S.J. Comparison of the Deep Atmospheric Dynamics of Jupiter and Saturn in Light of the Juno and Cassini Gravity Measurements. Space Sci. Rev. 2020, 216, 84. [Google Scholar] [CrossRef]
  45. Iess, L.; Folkner, W.M.; Durante, D.; Parisi, M.; Kaspi, Y.; Galanti, E.; Guillot, T.; Hubbard, W.B.; Stevenson, D.J.; Anderson, J.D.; et al. Measurement of Jupiter’s asymmetric gravity field. Nature 2018, 555, 220–222. [Google Scholar] [CrossRef]
  46. Hedman, M.M.; Nicholson, P.D.; El Moutamid, M.; Smotherman, S. Kronoseismology. VI. Reading the recent history of Saturn’s gravity field in its rings. Planet. Sci. J. 2022, 3, 61. [Google Scholar] [CrossRef]
  47. Galilei, G. Sidereus Nuncius Magna, Longeque Admirabilia Spectacula Pandens Lunae Facie, Fixis Innumeris, Lacteo Circulo, Stellis Nebulosis, … Galileo Galileo: Nuper a se Reperti Beneficio Sunt Observata in Apprime vero in Quatuor Planetis Circa Iovis Stellam Disparibus Intervallis, Atque Periodis, Celeritate Mirabili Circumvolutis … atque Medicea Sidera Nuncupandos Decrevit; Thomas Baglioni: Republic of Venice, 1610. [Google Scholar] [CrossRef]
  48. Hastie, T.; Tibshirani, R.; Friedman, J.H.; Friedman, J.H. The Elements of Statistical Learning: Data Mining, Inference, Furthermore, Prediction; Springer: Berlin/Heidelberg, Germany, 2009; Volume 2. [Google Scholar]
  49. Edgington, S.G.; Tapella, R.K.; Beebe, R.F.; Buratti, B.J.; Burton, M.E.; Weld, K.R.; Streiffert, B.A.; Connell, A.M.; Ray, T.L.; Brooks, S.M.; et al. Cassini-Huygens Scientific Legacy: The Cassini Mission Archive at the Planetary Data System. In Proceedings of the 50th Annual Lunar and Planetary Science Conference, The Woodlands, TX, USA, 18–22 March 2019; Lunar and Planetary Institute: Houston, TX, USA, 2019; p. 2932. [Google Scholar]
  50. Bailen, M.S.; Sucharski, R.M.; Akins, S.W.; Hare, T.M.; Gaddis, L.R. Using the PDS Planetary Image Locator Tool (PILOT) to Identify and Download Spacecraft Data for Research. In Proceedings of the 44th Lunar and Planetary Science Conference, The Woodlands, TX, USA, 18–22 March 2013; Lunar and Planetary Institute: Houston, TX, USA, 2013; p. Abstract #2246. [Google Scholar]
  51. Akins, S.W.; Gaddis, L.; Becker, K.; Barrett, J.; Bailen, M.; Hare, T.; Soderblom, L.A.; Raub, R. Status of the PDS Unified Planetary Coordinates Database and the Planetary Image Locator Tool (PILOT). In Proceedings of the 40th Lunar and Planetary Science Conference, The Woodlands, TX, USA, 23–27 March 2009; Lunar and Planetary Institute: Houston, TX, USA, 2009; p. Abstract #2002. [Google Scholar]
  52. Hare, T.M.; Akins, S.W.; Sucharski, R.M.; Bailen, M.S.; Anderson, J.A. Map Projection Web Service for PDS Images. In Proceedings of the 44th Lunar and Planetary Science Conference, The Woodlands, TX, USA, 18–22 March 2013; Lunar and Planetary Institute: Houston, TX, USA, 2013; p. Abstract #2068. [Google Scholar]
  53. Akins, S.W.; Hare, T.M.; Sucharski, R.M.; Bailen, M.S.; Gaddis, L.R. POW and MAP2: Job Management and Advanced Processing. In Proceedings of the Second Planetary Data Workshop, Flagstaff, AZ, USA, 8–11 June 2015; Lunar and Planetary Institute: Houston, TX, USA, 2015; p. Abstract #7037. [Google Scholar]
  54. Sides, S.C.; Becker, T.L.; Becker, K.J.; Edmundson, K.L.; Backer, J.W.; Wilson, T.J.; Weller, L.A.; Humphrey, I.R.; Berry, K.L.; Shepherd, M.R.; et al. The USGS Integrated Software for Imagers and Spectrometers (ISIS 3) Instrument Support, New Capabilities, and Releases. In Proceedings of the 48th Lunar and Planetary Science Conference, The Woodlands, TX, USA, 20–24 March 2017; Lunar and Planetary Institute: Houston, TX, USA, 2017; p. Abstract #2739. [Google Scholar]
  55. Hare, T.M.; Plesea, L. Planetary GIS Updates for 2007. In Proceedings of the 39th Lunar and Planetary Science Conference; Lunar and Planetary Institute: Houston, TX, USA, 2008; p. Abstract #2536. [Google Scholar]
  56. Padams, J.; Grimes, K.; Hollins, G.; Lavoie, S.; Stanboli, A. NASA PDS IMG: Accessing Your Planetary Image Data. In Proceedings of the 3rd Planetary Data Workshop, Flagstaff, AZ, USA, 12–15 June 2017; Lunar and Planetary Institute: Houston, TX, USA, 2017; p. Abstract #7114. [Google Scholar]
  57. Altinok, A.; Bornstein, B.; Estlin, T.; Gaines, D.; Schaffer, S.; Thompson, D.R.; Anderson, R.C.; Burl, M.; Castano, R.; Wiens, R. Automatic Image Analysis for Adaptive Instrument Targeting: Applications to MSL and Mars 2020. In Proceedings of the 45th Lunar and Planetary Science Conference, The Woodlands, TX, USA, 17–21 March 2014; Lunar and Planetary Institute: Houston, TX, USA, 2014; p. Abstract #2871. [Google Scholar]
  58. Stanboli, A.; Bue, B.; Wagstaff, K.; Altinok, A. Automated Content Detection for Cassini Images. In Proceedings of the 3rd Planetary Data Workshop, Flagstaff, AZ, USA, 12–15 June 2017; Lunar and Planetary Institute: Houston, TX, USA, 2017; p. Abstract #7048. [Google Scholar]
  59. García-Melendo, E.; Sánchez-Lavega, A. Saturn Zonal Wind Bundle Data Archive. 2011; PDS Atmospheres Node (ATM). [Google Scholar] [CrossRef]
  60. Koskinen, T. Structure of Saturn’s Thermosphere from Stellar Occultations Bundle Data Archive. 2018; PDS Atmospheres Node (ATM). [Google Scholar] [CrossRef]
  61. Bernath, P. Laboratory Study of Hydrocarbon IR Spectra Bundle Data Archive. 2022; newblock PDS Atmospheres Node (ATM). [Google Scholar] [CrossRef]
  62. Newman, C.; Airapetian, V.; Battalio, M.; Bougher, S.; Brown, A.; Domagal-Goldman, S.D.; Fan, S.; Guzewich, S.D.; Heavens, N.G.; Jackson, D.; et al. An Urgently Needed Repository for Planetary Atmospheric Model Output. Bull. Am. Astron. Soc. 2021, 53, 505. [Google Scholar] [CrossRef]
  63. Final Report of the Planetary Data Ecosystem Independent Review Board. Technical Report, NASA Science Mission Directorate. 2021. Available online: https://science.nasa.gov/science-pink/s3fs-public/atoms/files/PDE%20IRB%20Final%20Report.pdf (accessed on 30 October 2022).
  64. Hsu, A.I.; Wong, M.H.; Simon, A.A. Lifetimes and Occurrence Rates of Dark Vortices on Neptune from 25 Years of Hubble Space Telescope Images. Astron. J. 2019, 157, 152. [Google Scholar] [CrossRef]
  65. Clarke, J.T.; Gérard, J.C.; Grodent, D.; Wannawichian, S.; Gustin, J.; Connerney, J.; Crary, F.; Dougherty, M.; Kurth, W.; Cowley, S.W.H.; et al. Morphological differences between Saturn’s ultraviolet aurorae and those of Earth and Jupiter. Nature 2005, 433, 717–719. [Google Scholar] [CrossRef] [Green Version]
  66. Tollefson, J.; Wong, M.H.; Pater, I.d.; Simon, A.A.; Orton, G.S.; Rogers, J.H.; Atreya, S.K.; Cosentino, R.G.; Januszewski, W.; Morales-Juberías, R.; et al. Changes in Jupiter’s Zonal Wind Profile preceding and during the Juno mission. Icarus 2017, 296, 163–178. [Google Scholar] [CrossRef]
  67. Karkoschka, E. Spectrophotometry of the Jovian Planets and Titan at 300- to 1000-nm Wavelength: The Methane Spectrum. Icarus 1994, 111, 174–192. [Google Scholar] [CrossRef]
  68. Karkoschka, E. Spectrophotometry of the Jovian Planets and Titan Data Archive. 1998; newblock PDS Atmospheres Node (ATM). [Google Scholar] [CrossRef]
  69. Mayorga, L.C.; Jackiewicz, J.; Rages, K.; West, R.A.; Knowles, B.; Lewis, N.; Marley, M.S. Jupiter’s Phase Variations from Cassini: A Testbed for Future Direct-imaging Missions. Astron. J. 2016, 152, 209. [Google Scholar] [CrossRef] [Green Version]
  70. Gupta, P.; Atreya, S.K.; Steffes, P.G.; Fletcher, L.N.; Guillot, T.; Allison, M.D.; Bolton, S.J.; Helled, R.; Levin, S.; Li, C.; et al. Jupiter’s Temperature Structure: A Reassessment of the Voyager Radio Occultation Measurements. Planet. Sci. J. 2022, 3, 159. [Google Scholar] [CrossRef]
Figure 1. Organizational structure of the PDS. The Discipline Nodes are shown in blue boxes. The support nodes, shown in gold boxes, contain experts in areas that cover numerous missions. The Radio Science Subnode, currently at RMS, supports data providers and users with the specialized needs of radio science data.
Remotesensing 14 06112 g001
Figure 2. Helium abundances of Jupiter [9], Saturn [10], Uranus [11], and Neptune [12] derived from Voyager 1 and 2 IRIS observations.
Remotesensing 14 06112 g002
Figure 3. Six cyclones in Jupiter’s south polar region as revealed by a Juno/JIRAM image taken on February 2, 2017, at a wavelength of roughly 5 microns. Image Credit: NASA/JPL-Caltech/SwRI/ASI/INAF/JIRAM (NASA PIA23556).
Remotesensing 14 06112 g003
Figure 4. UVIS observations of Saturn’s northern (ad) and southern (e,f) auroral ovals during the Grand Finale phase of the Cassini mission. Figure reproduced from Bader et al. [37].
Remotesensing 14 06112 g004
Figure 5. Cassini ISS image of the 2010 Saturn storm acquired on 24 December 2010. This image was downloaded from the PDS using the RMS OPUS tool (Section 3.1); the tint of this browse image is indicative of the wavelength range of the ISS filter through which the image was acquired (in this case, 429–492 nm).
Remotesensing 14 06112 g005
Figure 6. Disk integrated light curves of Uranus (left) and Neptune (right) in the Strömgren b (blue points) and y (green points) filters from 1972 to 2016.
Remotesensing 14 06112 g006
Figure 7. The radio spectra observed at Jupiter, Saturn, Earth, Uranus, and Neptune [43].
Remotesensing 14 06112 g007
Figure 8. ENA images of Saturn’s magnetospheric ions and auroral EUV emissions during an particle acceleration event on 8 May 2008 ((A) 0749–0849UT, (B) 0919–1019UT (C) 1043–1143UT, (D) 1141–1149UT). Currents along the magnetic field accelerate the particles producing the aurora. (Figure courtesy of Donald Mitchell, a movie of the ENA images can be found at https://doi.org/10.17189/1519607, accessed on 30 October 2022.)
Remotesensing 14 06112 g008
Figure 9. Step-by-step instructions on how to find and obtain UVIS data from the PDS via RMS Viewmaster for an observation of Saturn’s aurora carried out around 03:35 on day 172 of year 2005. All links in this figure were accessed on 30 October 2022.
Remotesensing 14 06112 g009
Figure 10. Step-by-step instructions on how to find and obtain UVIS data from the PDS via RMS OPUS for an observation of Saturn’s aurora carried out around 03:35 on day 172 of year 2005. All links in this figure were accessed on 30 October 2022.
Remotesensing 14 06112 g010
Figure 11. Galileo Galilei’s observations [47] on the nights of 21 and 22 January 1610 (left) and the corresponding diagrams from the RMS Node’s Jupiter Viewer tool (right) for the same approximate observing times.
Remotesensing 14 06112 g011
Table 1. Optical and near-infrared imagers used for remote sensing of Jupiter (J), Saturn (S), Uranus (U) and Neptune (N), and the Digital Object Identifiers (DOIs) for accessing the data. All links in this table were accessed on 30 October 2022.
SpacecraftInstrumentTargetAccess DOIs
Pioneer 10, 11Imaging Photopolarimeter (IPP)J, Snot available *
Voyager 1Imaging Science Subsystem (ISS)Jhttps://doi.org/10.17189/1520214
Shttps://doi.org/10.17189/1520304
Voyager 2ISSJhttps://doi.org/10.17189/1520214
Shttps://doi.org/10.17189/1520304
Uhttps://doi.org/10.17189/1520365
Nhttps://doi.org/10.17189/1520412
GalileoSolid State Imager (SSI)Jhttps://doi.org/10.17189/1520425
Near Infrared Mapping Spectrometer (NIMS)Jhttps://doi.org/10.17189/1520293
CassiniImaging Science Subsystem (ISS)Jhttps://doi.org/10.17189/1520210
Shttps://doi.org/10.17189/1520177
Visual and Infrared Mapping Spectrometer (VIMS)J, Shttps://doi.org/10.17189/1520275
New HorizonsLong Range Reconnaissance Imager (LORRI)Jhttps://doi.org/10.26007/tcne-cm20
Multispectral Visible Imaging Camera (MVIC) https://doi.org/10.26007/xmy5-zx84
JunoJunoCamJhttps://doi.org/10.17189/1520191
* Pioneer 11 imaging data can be obtained from NSSDC, but not from the PDS.
Table 2. Ultraviolet spectrometers used for remote sensing of Jupiter (J), Saturn (S), Uranus (U) and Neptune (N), and the DOIs for accessing the data. All links in this table were accessed on 30 October 2022.
SpacecraftInstrumentTargetAccess DOIs
Voyager 1Ultraviolet Spectrometer (UVS)Jhttps://doi.org/10.17189/4p9r-gc87
Shttps://doi.org/10.17189/8ads-fr53
Voyager 2UVSJhttps://doi.org/10.17189/0w47-dq75
Shttps://doi.org/10.17189/emh4-v313
Uhttps://doi.org/10.17189/fec9-4c64
Nhttps://doi.org/10.17189/2e17-9r73
GalileoUVSJhttps://doi.org/10.17189/dv1z-cx79
https://doi.org/10.17189/8n8q-xf47
CassiniUltraviolet Imaging Spectrograph (UVIS)J, Shttps://doi.org/10.17189/4be3-xq57
https://doi.org/10.17189/zzgw-f046
https://doi.org/10.17189/kthj-r777
NewAlice Ultraviolet Imaging SpectrographJhttps://doi.org/10.26007/qfvg-5k41
HorizonsLinear Etalon Imaging Spectral Array (LEISA)Jhttps://doi.org/10.26007/0cc7-4a49
JunoUltraviolet Spectrograph (UVS)Jhttps://doi.org/10.17189/b29k-pv96
https://doi.org/10.17189/c32j-7r56
Table 3. Radio astronomy, plasma wave, and particle data for Jupiter (J), Saturn (S), Uranus (U) and Neptune (N) available in the PDS, and the DOIs for accessing the data. Several of the investigations listed have multiple data sets; in those cases, the range of sequential DOIs is given. All links in this table were accessed on 30 October 2022.
SpacecraftInstrumentTargetAccess DOIs
Voyager 1Planetary Radio Astronomy Receiver (PRA)Jhttps://doi.org/10.17189/1522972
Shttps://doi.org/10.17189/1522966
Plasma Wave Spectrometer (PWS)Jhttps://doi.org/10.17189/1519900https://doi.org/10.17189/1519905
Shttps://doi.org/10.17189/1519905
https://doi.org/10.17189/1519927https://doi.org/10.17189/1519928
J, Shttps://doi.org/10.17189/wp0z-1c51https://doi.org/10.17189/g5fy-rz59
Voyager 2PRAJhttps://doi.org/10.17189/1519955
Shttps://doi.org/10.17189/1520011
Uhttps://doi.org/10.17189/1520041https://doi.org/10.17189/1520043
Nhttps://doi.org/10.17189/1519984https://doi.org/10.17189/1519986
PWSJhttps://doi.org/10.17189/1519957https://doi.org/10.17189/1519962
Shttps://doi.org/10.17189/1519960https://doi.org/10.17189/1519962
Uhttps://doi.org/10.17189/1519960https://doi.org/10.17189/1519962
https://doi.org/10.17189/1520044https://doi.org/10.17189/1520046
Nhttps://doi.org/10.17189/1519987https://doi.org/10.17189/1519989
J, S, U, Nhttps://doi.org/10.17189/86sw-jn08https://doi.org/10.17189/bwn5-bs17
UlyssesUnified Radio and Plasma Wave Experiment (URAP)Jhttps://doi.org/10.17189/1519865https://doi.org/10.17189/1519873
GalileoPWSJhttps://doi.org/10.17189/1519678https://doi.org/10.17189/1519684
CassiniRadio and Plasma Wave Science (RPWS)Jhttps://doi.org/10.17189/1519614https://doi.org/10.17189/1519617
Shttps://doi.org/10.17189/1519610https://doi.org/10.17189/1519617
Magnetospheric Imaging Instrument (MIMI) Imaging Neutral Camera (INCA)Shttps://doi.org/10.17189/1519607
New HorizonsPluto Energetic Particle Spectrometer Science Investigation (PEPSSI)Jhttps://doi.org/10.26007/v0m7-pw47; https://doi.org/10.26007/hggb-f658
Radio Science Experiment (REX)Jhttps://doi.org/10.26007/61tf-4r89; https://doi.org/10.26007/f0cb-zn89
Solar Wind Around Pluto (SWAP)Jhttps://doi.org/10.26007/dfhh-kn63; https://doi.org/10.26007/q952-d227
Student Dust Counter (SDC)Jhttps://doi.org/10.26007/02b6-rm36; https://doi.org/10.26007/ke28-ke10
JunoRPWSJhttps://doi.org/10.17189/1519708https://doi.org/10.17189/1520498
Radio Jove (Earth-based)Radio TelescopeJhttps://doi.org/10.17189/1520498https://doi.org/10.17189/1522500
Publisher’s Note: MDPI stays neutral with regard to jurisdictional claims in published maps and institutional affiliations.

