Article

Polarization Lidar Measurements of Dust Optical Properties at the Junction of the Taklimakan Desert–Tibetan Plateau

1
Key Laboratory for Semi-Arid Climate Change of the Ministry of Education, College of Atmospheric Sciences, Lanzhou University, Lanzhou 730000, China
2
Collaborative Innovation Center for West Ecological Safety (CIWES), Lanzhou University, Lanzhou 730000, China
*
Author to whom correspondence should be addressed.
Remote Sens. 2022, 14(3), 558; https://doi.org/10.3390/rs14030558
Submission received: 14 December 2021 / Revised: 14 January 2022 / Accepted: 18 January 2022 / Published: 25 January 2022
(This article belongs to the Special Issue Optical and Laser Remote Sensing of Atmospheric Composition)

Abstract

:
Previous studies have shown that dust aerosols may accelerate the melting of snow and glaciers over the Tibetan Plateau. To investigate the vertical structure of dust aerosols, we conducted a ground-based observation by using multi-wavelength polarization lidar which is designed for continuous network measurements. In this study, we used the lidar observation from September to October 2020 at the Ruoqiang site (39.0°N, 88.2°E; 894 m ASL), located at the junction of the Taklimakan Desert–Tibetan Plateau. Our results showed that dust aerosols can be lifted up to 5 km from the ground, which is comparable with the elevation of the Tibetan Plateau in autumn with a mass concentration of 400–900 μg m−3. Moreover, the particle depolarization ratio (PDR) of the lifted dust aerosols at 532 nm and 355 nm are 0.34 ± 0.03 and 0.25 ± 0.04, respectively, indicating the high degree of non-sphericity in shape. In addition, extinction-related Ångström exponents are very small (0.11 ± 0.24), implying the large values in size. Based on ground-based lidar observation, this study proved that coarse non-spherical Taklimakan dust with high concentration can be transported to the Tibetan Plateau, suggesting its possible impacts on the regional climate and ecosystem.

Graphical Abstract

1. Introduction

Dust is an important component of tropospheric aerosol [1,2], and it is estimated that about 2000 tons of dust are injected into the atmosphere every year [3]. It participates in various cycles of the Earth’s system [4,5,6] and directly affects the Earth’s energy budget [7,8,9,10,11]. It can also become cloud condensation nuclei and modify the microphysical characteristics of clouds, which can eventually influence the global climate [12,13,14,15]. Understanding the vertical distribution of dust properties would assist in revealing the impact of dust on air quality assessment, human health, and the climate [16,17,18,19,20].
The research conducted by Goudie et al. and Tanaka et al. demonstrated that the dust emission from East Asia is second only to the Sahara Desert, which contributes the most to the global dust budget [21,22]. The Taklimakan Desert (TD), located in Northwest China and the northern edge of the Tibetan Plateau, is the main dust source in East Asia [23,24,25]. Many studies have confirmed the transportation of dust from the TD over a long distance through the westerlies, which affected East China and even the Pacific and North America [26,27,28,29,30]. Yuan et al. [31] reported that due to the special terrain of TD and the prevailing east wind at low altitude, the dust below 5 km near the ground is not easy to be transported to the East in summer. Based on Cloud-Aerosol Lidar and Infrared Pathfinder Satellite Observations (CALIPSO), Huang et al. [32] found the radial transmission of the dust aerosol from the TD in summer to the northern slope of the Tibetan Plateau which resulted in dust accumulation. Liu et al. [33] also indicated that TD dust is the main source of dust aerosol in the Tibetan Plateau. Moreover, the absorptive aerosols (e.g., dust and black carbon) transmitted to the glaciers and snow on the Tibetan Plateau can absorb more solar radiation to influence the surface radiation flux and the South Asian monsoon [34,35,36,37]. Wang et al. [38] also pointed out that the glacial retreat and snow melting in the Tibetan Plateau are closely related to the transmission of dust particles.
Earlier studies on dust in the TD mainly relied on the data of meteorological stations to analyze the frequency of dust occurrence [39,40]. The vertical distribution characteristics of dust aerosols were often studied by means of satellite remote sensing, such as CALIPSO, moderate-resolution imaging spectroradiometer (MODIS) and simulation results [41,42,43]. By analyzing the seasonal and vertical distributions of aerosols using satellite remote sensing data, Pan et al. [44] found that dust is the main type in the TD, accounting for 88.38% of all aerosols. However, due to the limitation of satellite remote sensing, it is difficult to study the diurnal variation of aerosol vertical characteristics. Besides, model simulation results still exhibit large uncertainty, especially in East Asia [45]. Ground-based lidar observation with high temporal and spatial resolutions is very useful to study the vertical characteristics of aerosols [46,47,48,49,50,51]. Zhou et al. [52] conducted a lidar observation in Northwest China, indicating that the high-intensity dust layer mainly occurs in the planetary boundary layer (PBL), and its occurrence frequency is above 88%. However, few studies have focused on dust aerosol in the TD using ground-based lidar, and most of them were concentrated in the north of TD [53,54].
In this study, we firstly investigate the vertical distribution of dust optical properties at the Ruoqiang site (88.2°E, 39.0°N) by using a ground-based polarization lidar in Autumn (from September to October 2020). Section 2 briefly describes the study area and lidar system used in this study. Two dust cases and the characteristics of dust optical properties during the study period are presented in Section 3 and Section 4. Our conclusions are then briefly summarized in Section 5.

2. Study Areas and Lidar System

2.1. Study Areas

The ground-based lidar system used in this study is located at the Ruoqiang site (39.0°N, 88.2°E; Altitude: 894 m), Xinjiang Province, China (see Figure 1). Ruoqiang lidar site is the seventh of the “Belt and Road” lidar network conducted by Lanzhou University, China. It is located in the east of the TD, and is very close to the snow cover and glaciers at the northeastern part of the Tibetan Plateau. In addition, it belongs to the warm temperate and continental desert arid climate, with much dust loading and little precipitation.

2.2. Ground-Based Multi-Wavelength Mie Polarization Lidar System (MMPL)

The multi-wavelength Mie polarization lidar system developed by Lanzhou University can collect the backscattering signals of 1064 nm, 532 nm and 355 nm simultaneously. The schematic diagram of the lidar system used in this study is shown in Figure 2. The lidar system employs a Nd: YAG laser which can emit lasers with fundamental frequency (1064 nm), double frequency (532 nm) and triple frequency (355 nm). Then, lasers are collimated and amplified by beam expanders. The telescope with a diameter of 400 mm is used to receive the backscattering signals. The signals at 532 nm and 355 nm are divided into parallel components and vertical components using polarizing beamsplitters respectively, and consequently detected by photomultiplier tubes (PMT). The 1064 nm signal is detected by an avalanche photo diode (APD). The temporal and spatial resolutions of the observed data are 2 min and 3.75 m, respectively. The lidar system is installed in a container with the temperature of around 23 °C. It is equipped with UPS that can supply power continuously for more than 8 h.
We determined the dust extinction coefficient and backscattering coefficient by use of the Fernald method [55,56]. In this study, the lidar ratio of dust aerosols is assumed to be 50 sr [57]. Then, the backscattering coefficient and extinction coefficient of dust can be retrieved from Equation (1),
β 1 ( I ) = β 2 ( I ) + X ( I ) exp [ A ( I , I + 1 ) ] X ( I + 1 ) β 1 ( I + 1 ) + β 2 ( I + 1 ) + S 1 { X ( I + 1 ) + X ( I ) exp [ A ( I , I + 1 ) ] } Δ Z
where A ( I , I + 1 ) = ( S 1 S 2 ) [ β 2 ( I ) + β 2 ( I + 1 ) ] Δ Z , β 1 and β 2 are the backscattering coefficient of aerosols and air molecules, respectively; while S 1 and S 2 (=8π/3) are the lidar ratios of aerosols and air molecules, respectively. X is the normalized signal after backgroud subtraption, range correction as well as overlap correction, and ∆Z is the spatial resolution.
The lidar used in this study can perform polarization measurement and distinguish spherical or non-spherical aerosols, especially in dust detection [58,59]. The particle depolarization ratio (PDR) is given by Equation (2) [57],
δ p = ( 1 + δ m ) δ v R ( 1 + δ v ) δ m ( 1 + δ m ) R ( 1 + δ v )
where δ m is the molecular depolarization ratio (the typical value is 0.00376 [60]), δ v is the volume depolarization ratio, and R is the ratio of total backscattering to air molecule backscattering. The volume depolarization ratio can be calculated by multiplying the calibration factor with the ratio of vertical channel to parallel channel. The calibration factor k can be determined from the experiment [61]. In this study, the atmospheric molecular method is used. PDR is an important parameter for identifying dust aerosols. For spherical targets, the depolarization ratio is equal to 0. However, for non-spherical particles (e.g., dust aerosols), the depolarization ratio is greater than 0. For fine aerosols, the PDR is often less than 0.05 [62,63].
Ångström exponent is an important parameter to characterize the optical characteristics of atmospheric aerosols [64]. It reflects the dependence of aerosol extinction on the wavelength of incident light. It is related to the size of aerosols, and small values mean large particle sizes. The extinction-related Ångström exponent (EAE) is expressed by,
A λ 1 / λ 2 α = ln ( α λ 1 / α λ 2 ) ln ( λ 2 / λ 1 )
In this study, λ 1 and λ 2 represent the wavelengths of 355 nm and 532 nm, respectively.

2.3. CALIPSO Lidar Data

The Cloud-Aerosol Lidar and Infrared Pathfinder Satellite Observation (CALIPSO) is a polar orbiting satellite of the NASA A-train satellite group. It is equipped with the Cloud Aerosol Lidar With Orthogonal Polarization (CALIOP), which can provide vertical profiles of clouds and aerosols globally. Polarization measurement is conducted at the wavelength of 532 nm. The vertical resolution is 30 m below 8.2 km [65]. It is an effective tool to study dust aerosols. The level-1B data from CALIPSO products, including 532 nm total attenuated backscattering coefficient, depolarization ratio (532 nm) and attenuated color ratio, are used to confirm the vertical structure of dust aerosols observed by ground-based lidar in this study.

3. Results

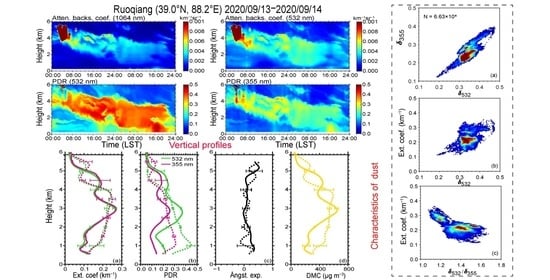
3.1. Dust Case 1: 13 September 2020

A dust event which occurred in Northwest China from 13 to 14 September 2020 was also detected by the CALIPSO spaceborne lidar, as shown in Figure 3. The total attenuated backscattering coefficient at 532 nm was quite large. The depolarization ratio (532 nm) and color ratio were also high in value, indicating that it was mainly composed of particles with high non-sphericity and large particle size. It is suggested that there was an obvious thick dust layer. In addition, CALIPSO lidar found the main distribution of dust in the TD from the ground to about 2 km height with a wide horizontal scale. Moreover, dust aerosols also appeared over the Tibetan Plateau at an altitude of about 4 km near the TD.
Figure 4 shows the vertical structure of clouds and dust aerosols detected by the ground-based polarization lidar at the Ruoqiang site (39.0°N, 88.2°E, 894 m) from 13 to 14 September 2020. The attenuated backscattering coefficient both at 1064 nm and 532 nm, and the PDRs at 532 nm and 355 nm, are shown. It can be seen that there was an obvious dust layer during the observed period, mainly distributed from the ground to 5 km height. The attenuated backscattering coefficients of the dust layer at 1064 nm and 532 nm were larger than 0.003 km 1 sr 1 . PDR at 532 nm ( δ 532 p ) was greater than 0.3, and that at 355 nm ( δ 355 p ) was greater than 0.2, indicating highly non-spherical particles. It is similar to the typical values of dust aerosols observed by lidar in Dushanbe [65]. Regarding the dust event on 13 September, the dust layer was mainly distributed around 2–5.6 km height. In addition, the dust distribution exhibited an obvious stratification phenomenon. For example, the dust layer located at 2–5 km height from 8:00 to 16:00 was not distributed uniformly. On 14 September, the dust layer settled continuously with time, mainly distributed below 4 km. However, the layer was distributed at 5–6 km from 0:00 to 8:00, and then descended down to 4 km with time.
To specifically analyze the vertical structure of dust aerosols at the Ruoqiang site during the dust event, vertical profiles of dust optical properties from 13 to 14 September 2020, as shown in Figure 5. The profiles of extinction coefficients and particle depolarization ratios (PDR) both at 532 nm and 355 nm, extinction-related Ångström exponent (EAE) as well as dust mass concentration are used to discuss in detail. The uncertainty of extinction coefficient caused by the lidar ratio with error within 10% is about 8–17%, which is acceptable. On 13 September, the extinction coefficient of aerosols was small at 1–2 km height from the ground, but was large at 3 km height up to 0.27 km 1 at 532 nm. The variation of vertical profiles on 14 September was slightly different. Dust extinction coefficients at 532 nm reach a peak of 0.24 km 1 around 4 km. Moreover, it increased slightly at about 5.5 km height, which was related to another dust layer at high altitude. The variation trend of depolarization ratio profile (see Figure 5b) is consistent with the extinction coefficients on 13 September. The situation on 14 September is slightly different. The maximum value of PDR is distributed around 1 km, rather than around 4 km as with the extinction coefficient. We see that that PDR at 532 (355) nm was about 0.3 (0.2) for the dust layer. In particular, the EAE was small, indicating that the size of such particles is coarse. Wang et al. proposed a method for estimating the mass concentration of dust from lidar measurements at Dunhuang which is closed to the Ruoqiang site. So, we assume the optical properties of dust at Ruoqiang are similar to those at Dunhuang. Consequently, for calculating mass concentration of dust from extinction coefficients at 532 nm, we suppose the conversion coefficient is 0.41 [66]. In Figure 5d, we can see that the dust mass concentration was very high and reached up to 650 μ g   m 3 from 13 to 14 September.

3.2. Dust Case 2: 2 October 2020

On 2 October 2020, CALIPSO lidar captured another dust event near Ruoqiang site. Figure 6 shows that the dust concentration was high, and the depolarization ratio and color ratio also showed large values, indicating that the dust particles had high non-sphericity and large particle size. Compared with the case on 14 September, the height of the dust layer for this case was higher. In particular, some dust aerosols were very close to the Tibetan Plateau at an altitude of 4–5 km. According to ground-based observation as shown in Figure 7, the dust layer was mainly distributed from 2 km to 4 km height, and the dust concentration near the ground was low. It can be seen that the dust intensity was large, but the dust was not evenly distributed in the vertical direction. For example, there was a thin layer of dust at about 4 km height from 2:00 to 6:00 (LST), and there was a thick layer of dust at 2–3.8 km height with high concentration. PDR at 532 (355) nm is larger than 0.3 (0.2), implying that the particles were highly non-spherical.
The vertical distribution of dust optical properties (Figure 8b) shows that the dust layer was mainly concentrated at 2–4 km height from the ground, and extinction coefficients at two wavelengths were greater than 0.35 km 1 . The extinction coefficient increased slightly between 4.2 km and 4.8 km height, mainly related to another thin dust layer. The variation of δ 532 p and δ 355 p profiles were generally consistent with those of extinction coefficients. The PDR at 355 nm of the dust layer appeared at 2–3 km height was larger than 0.25, and 0.3 for PDR at 532 nm. In addition, the EAE of the dust layer was close to zero, indicating that the particle size is very large in this layer. In particular, the mass concentration of dust was also very high, reaching up to 900 μ g   m 3 .

4. Discussion

4.1. Characteristics of Dust Optical Properties

To further understand the characteristics of dust properties, we investigated the relationships among key optical properties of dust using two months’ observational data. The selection of dust data is based on the aerosol temporal and spatial distribution and PDR observed by lidar. Figure 9 presents the frequency histograms of δ 532 p (green) and δ 355 p (magenta) of dust aerosols during the observed period. It can be seen that δ 355 p is mainly concentrated in 0.2–0.3, with an average value of 0.25 and a standard deviation of 0.04. The peak of PDR is located in the range of 0.225–0.25. For the range less than 0.15 and greater than 0.3, the relative frequency of PDR at 355 nm is very small. The frequency distribution characteristics of δ 532 p are similar to those of δ 355 p , but mainly concentrated in the range of 0.3–0.375, with an average value of 0.34 and a standard deviation of 0.03.
Figure 10 shows relationships between the PDR and extinction coefficient (532 nm) obtained from the polarization lidar from September to October 2020. The contoured color at panels represents the number of points for each grid. We can see that they are mainly distributed in the range of 0.1–0.4, and there is a strong linear correlation between the PDR at 355 nm and 532 nm. The averaged extinction coefficient of 532 nm is 0.22 ± 0.04 km 1 . In particular, the extinction coefficient α 532 increased with the PDR δ 532 p , indicating that α 532 of dust aerosol is positively correlated with non-sphericity. Analyzing the relationship between α 532 and δ 532 p / δ 355 p is helpful for understanding the wavelength dependence of α 532 , δ 532 p / δ 355 p of dust aerosol is greater than 1, and mainly concentrated in 1.3–1.5, which is consistent with the results reported by Huang et al. [67]. There is a negative correlation between α 532 and δ 532 p / δ 355 p . The α 532 of dust aerosol is mainly about 0.15–0.3 km 1 .
To study the relation between PDR and the size of particles, the extinction-related Ångström exponent (EAE) is used to analyze the data (as shown in Figure 11). It can be seen that the average EAE is about 0.11 ± 0.24, indicating the size of particles is quite large. The reason might be due to Ruoqiang being situated in the south-eastern part of the TD. The linear relationship between EAE and δ 532 p is not obvious, and δ 532 p is mainly concentrated in 0.3–0.4. Nevertheless, EAE decreases with the increase of PDR, and the size of dust particles with high non-sphericity is also large. In addition, δ 532 p / δ 355 p slightly increases with EAE. It is suggested dust particles with high nonsphericity, large particle size and strong extinction can be observed at Ruoqiang. They can be lifted up to 3–5 km height and transmitted to the Tibetan Plateau, which can change the albedo of glaciers and snow, accelerate melting, and influence the radiation balance of the earth-atmosphere system [68,69].

4.2. Comparison with Previous Studies

To compare our results with other previous reports, we summarize an overview of dust PDR and the extinction-related Ångström exponent (EAE) for the TD and the Sahara Desert in literature, as shown in Table 1. Hu et al. [70] reported that the PDR was 0.28–32 (0.36 ± 0.05) at 355 (532) nm, and the particle size was also large with EAE of −0.01 ± 0.30, observed by a Multi-wavelength lidar in Kashi located at the west of the TD. For dust aerosols in Dushanbe, the averaged PDR was 0.18–0.29 at 355 nm and 0.31–0.35 at 532 nm [71,72]. In addition, for Sahara dust, the PDR was about 0.24–0.27 at 355 nm and 0.28–0.31 at 532 nm. Moreover, the EAE of dust was between −0.2 and 0.35 [58,63,73,74,75,76]. In this study, it is represented that our results are in general agreement with those of Asian dust. The PDRs of dust aerosols are 0.25 ± 0.04 at 355 nm and 0.34 ± 0.03 at 532 nm. The Ångström exponents related to extinction coefficient are 0.11 ± 0.24.

5. Conclusions

To investigate the vertical structure of dust aerosols, we conducted a ground-based observation by use of a multi-wavelength Mie polarization lidar which was designed for continuous network measurements at Ruoqiang site in TD. The lidar system was developed with the ability to detect the total backscattering signals at 1064 nm, 532 nm and 355 nm simultaneously, and achieve polarization measurements both at visible and ultraviolet wavelengths. Based on the lidar observations from September to October 2020, we analyzed the vertical distribution of dust aerosols.
We found dust aerosols can be lifted up to 3–5 km from the ground, which is comparable with the elevation of the Tibetan Plateau in autumn (with a mass concentration of 400–900 μ g   m 3 ). The dust layer is quite thick with an obvious and complex structure for some dust cases. The PDR of the lifted dust aerosols is 0.34 ± 0.03 at 532 nm and 0.25 ± 0.04 at 355 nm, respectively. The extinction-related Ångström exponents are very small (0.11± 0.24). The extinction coefficient of dust layer aerosol is positively correlated with non-sphericity. Moreover, the ratio of depolarization ratios at visible and ultraviolet wavelengths ( δ 532 p / δ 355 p ) is 1.37 ± 0.12, and has a negative correlation with the extinction coefficient of dust.
Many studies have shown that glaciers and snow near dust sources are vulnerable to dust particles, especially in Asia [77,78]. Coarse dust particles with high extinction coefficients probably have larger impacts on the melting of snow and glaciers [79,80]. This study showed that such dust particles in the TD can be lifted up to the Tibetan Plateau, implying the importance of evaluating their influence on the snow melting and radiation budget in the future.

Author Contributions

Conceptualization and methodology, Z.H. and Q.D.; software, Q.D.; validation, Z.H.; formal analysis, Z.H. and Q.D.; resources, J.S., W.L. (Wuren Li) and Z.L.; data curation, X.S. and W.L. (Wentao Liu); writing—original draft preparation, Z.H. and Q.D.; writing—review and editing, T.W. and J.B.; visualization, Q.D.; supervision, T.W. All authors have read and agreed to the published version of the manuscript.

Funding

This research was funded by National Natural Science Foundation of China (41875029, 41627807); Higher Education Discipline Innovation Project—111 Project (B 13045); the Project of Field Scientific Observation and Research Station of Gansu Province (18JR2RA013); the Fundamental Research Funds for the Central Universities (lzujbky-2021-kb12, lzujbky-2021-kb02, lzujbky-2021-sp04).

Institutional Review Board Statement

Not applicable.

Data Availability Statement

Not applicable.

Acknowledgments

We are grateful to Yun Jia, who works in Ruoqiang Meteorological Bureau. Her daily maintenance is very important for obtaining the continuous observation data of lidar. We are also grateful to the CALIPSO science team for providing CALIPSO data. And the foundation of Key Laboratory for Semi-Arid Climate Change of the Ministry of Education in Lanzhou University.

Conflicts of Interest

The authors declare no conflict of interest.

References

  1. Han, Z.; Ueda, H.; Matsuda, K.; Zhang, R.; Arao, K.; Kanai, Y.; Hasome, H. Model study on particle size segregation and deposition during Asian dust events in March 2002. J. Geophys. Res. D Atmos. 2004, 109, 1–25. [Google Scholar] [CrossRef]
  2. Mahowald, N.; Albani, S.; Kok, J.F.; Engelstaeder, S.; Scanza, R.; Ward, D.S.; Flanner, M.G. The size distribution of desert dust aerosols and its impact on the Earth system. Aeolian Res. 2014, 15, 53–71. [Google Scholar] [CrossRef] [Green Version]
  3. Ginoux, P.; Prospero, J.M.; Torres, O.; Chin, M. Long-term simulation of global dust distribution with the GOCART model: Correlation with North Atlantic Oscillation. Environ. Model. Softw. 2004, 19, 113–128. [Google Scholar] [CrossRef]
  4. Shao, Y.; Wyrwoll, K.H.; Chappell, A.; Huang, J.; Lin, Z.; McTainsh, G.H.; Mikami, M.; Tanaka, T.Y.; Wang, X.; Yoon, S. Dust cycle: An emerging core theme in Earth system science. Aeolian Res. 2011, 2, 181–204. [Google Scholar] [CrossRef]
  5. Yang, F.; Huang, J.; Zhou, C.; Yang, X.; Ali, M.; Li, C.; Pan, H.; Huo, W.; Yu, H.; Liu, X.; et al. Taklimakan desert carbon-sink decreases under climate change. Sci. Bull. 2020, 65, 431–433. [Google Scholar] [CrossRef]
  6. Alizadeh-Choobari, O.; Sturman, A.; Zawar-Reza, P. A global satellite view of the seasonal distribution of mineral dust and its correlation with atmospheric circulation. Dyn. Atmos. Ocean. 2014, 68, 20–34. [Google Scholar] [CrossRef]
  7. Wang, Z.; Zhang, H.; Jing, X.; Wei, X. Effect of non-spherical dust aerosol on its direct radiative forcing. Atmos. Res. 2013, 120–121, 112–126. [Google Scholar] [CrossRef]
  8. Spyrou, C.; Kallos, G.; Mitsakou, C.; Athanasiadis, P.; Kalogeri, C.; Iacono, M.J. Modeling the radiative effects of desert dust on weather and regional climate. Atmos. Chem. Phys. 2013, 13, 5489–5504. [Google Scholar] [CrossRef] [Green Version]
  9. Kok, J.F.; Ridley, D.A.; Zhou, Q.; Miller, R.L.; Zhao, C.; Heald, C.L.; Ward, D.S.; Albani, S.; Haustein, K. Smaller desert dust cooling effect estimated from analysis of dust size and abundance. Nat. Geosci. 2017, 10, 274–278. [Google Scholar] [CrossRef]
  10. Bi, J.; Huang, J.; Holben, B.; Zhang, G. Comparison of key absorption and optical properties between pure and transported anthropogenic dust over East and Central Asia. Atmos. Chem. Phys. 2016, 16, 15501–15516. [Google Scholar] [CrossRef] [Green Version]
  11. Bi, J.; Huang, J.; Shi, J.; Hu, Z.; Zhou, T.; Zhang, G.; Huang, Z.; Wang, X.; Jin, H. Measurement of scattering and absorption properties of dust aerosol in a Gobi farmland region of northwestern China—A potential anthropogenic influence. Atmos. Chem. Phys. 2017, 17, 7775–7792. [Google Scholar] [CrossRef] [Green Version]
  12. Creamean, J.M.; Suski, K.J.; Rosenfeld, D.; Cazorla, A.; DeMott, P.J.; Sullivan, R.C.; White, A.B.; Ralph, F.M.; Minnis, P.; Comstock, J.M.; et al. Dust and biological aerosols from the Sahara and Asia influence precipitation in the Western U.S. Science 2013, 340, 1572–1578. [Google Scholar] [CrossRef] [PubMed] [Green Version]
  13. DeMott, P.J.; Prenni, A.J.; Liu, X.; Kreidenweis, S.M.; Petters, M.D.; Twohy, C.H.; Richardson, M.S.; Eidhammer, T.; Rogers, D.C. Predicting global atmospheric ice nuclei distributions and their impacts on climate. Proc. Natl. Acad. Sci. USA 2010, 107, 11217–11222. [Google Scholar] [CrossRef] [PubMed] [Green Version]
  14. Li, Z.; Wang, Y.; Guo, J.; Zhao, C.; Cribb, M.C.; Dong, X.; Fan, J.; Gong, D.; Huang, J.; Jiang, M.; et al. East Asian Study of Tropospheric Aerosols and their Impact on Regional Clouds, Precipitation, and Climate (EAST-AIRCPC). J. Geophys. Res. Atmos. 2019, 124, 13026–13054. [Google Scholar] [CrossRef] [Green Version]
  15. Huang, J.; Minnis, P.; Yan, H.; Yi, Y.; Chen, B.; Zhang, L.; Ayers, J.K. Dust aerosol effect on semi-arid climate over Northwest China detected from A-Train satellite measurements. Atmos. Chem. Phys. 2010, 10, 6863–6872. [Google Scholar] [CrossRef] [Green Version]
  16. Behzad, H.; Mineta, K.; Gojobori, T. Global Ramifications of Dust and Sandstorm Microbiota. Genome Biol. Evol. 2018, 10, 1970–1987. [Google Scholar] [CrossRef]
  17. Han, Y.; Fang, X.; Xi, X.; Song, L.; Yang, S. Dust storm in Asia continent and its bio-environmental effects in the North Pacific: A case study of the strongest dust event in April, 2001 in central Asia. Chin. Sci. Bull. 2006, 51, 723–730. [Google Scholar] [CrossRef]
  18. Querol, X.; Tobías, A.; Pérez, N.; Karanasiou, A.; Amato, F.; Stafoggia, M.; Pérez García-Pando, C.; Ginoux, P.; Forastiere, F.; Gumy, S.; et al. Monitoring the impact of desert dust outbreaks for air quality for health studies. Environ. Int. 2019, 130, 104867. [Google Scholar] [CrossRef]
  19. De Longueville, F.; Hountondji, Y.C.; Henry, S.; Ozer, P. What do we know about effects of desert dust on air quality and human health in West Africa compared to other regions? Sci. Total Environ. 2010, 409, 1–8. [Google Scholar] [CrossRef] [Green Version]
  20. Sarkar, S.; Chauhan, A.; Kumar, R.; Singh, R.P. Impact of Deadly Dust Storms (May 2018) on Air Quality, Meteorological, and Atmospheric Parameters Over the Northern Parts of India. GeoHealth 2019, 3, 67–80. [Google Scholar] [CrossRef] [Green Version]
  21. Goudie, A.S. Desert dust and human health disorders. Environ. Int. 2014, 63, 101–113. [Google Scholar] [CrossRef] [PubMed]
  22. Tanaka, T.Y.; Chiba, M. A numerical study of the contributions of dust source regions to the global dust budget. Glob. Planet. Change 2006, 52, 88–104. [Google Scholar] [CrossRef]
  23. Zhu, B.; Yu, J.; Qin, X.; Rioual, P.; Liu, Z.; Xiong, H. Formation and evolution of sand deserts in Xinjiang, Northwest China: I. Provenances of desert sands. J. Geogr. Sci. 2014, 24, 177–190. [Google Scholar] [CrossRef]
  24. Wu, F.; Zhang, D.; Cao, J.; Xu, H.; An, Z. Soil-derived sulfate in atmospheric dust particles at Taklimakan desert. Geophys. Res. Lett. 2012, 39, 4–9. [Google Scholar] [CrossRef] [Green Version]
  25. Huang, J.; Zhang, W.; Zuo, J.; Bi, J.; Shi, J.; Wang, X.; Chang, Z.; Huang, Z.; Yang, S.; Zhang, B.; et al. An overview of the semi-arid climate and environment research observatory over the loess plateau. Adv. Atmos. Sci. 2008, 25, 906–921. [Google Scholar] [CrossRef]
  26. Chen, S.; Yuan, T.; Zhang, X.; Zhang, G.; Feng, T.; Zhao, D.; Zang, Z.; Liao, S.; Ma, X.; Jiang, N.; et al. Dust modeling over East Asia during the summer of 2010 using the WRF-Chem model. J. Quant. Spectrosc. Radiat. Transf. 2018, 213, 1–12. [Google Scholar] [CrossRef]
  27. Yumimoto, K.; Uno, I.; Sugimoto, N.; Shimizu, A.; Liu, Z.; Winker, D.M. Adjoint inversion modeling of Asian dust emission using lidar observations. Atmos. Chem. Phys. 2008, 8, 2869–2884. [Google Scholar] [CrossRef] [Green Version]
  28. Huang, J.; Wang, T.; Wang, W.; Li, Z.; Yan, H. Climate effects of dust aerosols over East Asian arid and semiarid regions. J. Geophys. Res. Atmos. 2014, 175, 238. [Google Scholar] [CrossRef]
  29. Jia, R.; Liu, Y.; Chen, B.; Zhang, Z.; Huang, J. Source and transportation of summer dust over the Tibetan Plateau. Atmos. Environ. 2015, 123, 210–219. [Google Scholar] [CrossRef]
  30. Huang, Z.; Huang, J.; Hayasaka, T.; Wang, S.; Zhou, T.; Jin, H. Short-cut transport path for Asian dust directly to the Arctic: A case study. Environ. Res. Lett. 2015, 10, 114018. [Google Scholar] [CrossRef] [Green Version]
  31. Yuan, T.; Chen, S.; Huang, J.; Wu, D.; Lu, H.; Zhang, G.; Ma, X.; Chen, Z.; Luo, Y.; Ma, X. Influence of dynamic and thermal forcing on the meridional transport of Taklimakan Desert dust in spring and summer. J. Clim. 2019, 32, 749–767. [Google Scholar] [CrossRef]
  32. Huang, J.; Minnis, P.; Yi, Y.; Tang, Q.; Wang, X.; Hu, Y.; Liu, Z.; Ayers, K.; Trepte, C.; Winker, D. Summer dust aerosols detected from CALIPSO over the Tibetan Plateau. Geophys. Res. Lett. 2007, 34, 1–5. [Google Scholar] [CrossRef] [Green Version]
  33. Liu, Y.; Sato, Y.; Jia, R.; Xie, Y.; Huang, J.; Nakajima, T. Modeling study on the transport of summer dust and anthropogenic aerosols over the Tibetan Plateau. Atmos. Chem. Phys. 2015, 15, 12581–12594. [Google Scholar] [CrossRef] [Green Version]
  34. Yuan, T.; Chen, S.; Wang, L.; Yang, Y.; Bi, H.; Zhang, X.; Zhang, Y. Impacts of Two East Asian Atmospheric Circulation Modes on Black Carbon Aerosol Over the Tibetan Plateau in Winter. J. Geophys. Res. Atmos. 2020, 125, e2020JD032458. [Google Scholar] [CrossRef]
  35. Qian, Y.; Gustafson, W.I.; Leung, L.R.; Ghan, S.J. Effects of soot-induced snow albedo change on snowpack and hydrological cycle in western United States based on weather research and forecasting chemistry and regional climate simulations. J. Geophys. Res. Atmos. 2009, 114, 1–19. [Google Scholar] [CrossRef] [Green Version]
  36. Lau, W.K.M.; Kim, M.K.; Kim, K.M.; Lee, W.S. Enhanced surface warming and accelerated snow melt in the Himalayas and Tibetan Plateau induced by absorbing aerosols. Environ. Res. Lett. 2010, 5. [Google Scholar] [CrossRef]
  37. Yin, Z.; Yi, F.; He, Y.; Liu, F.; Yu, C.; Zhang, Y.; Wang, W. Asian dust impacts on heterogeneous ice formation at Wuhan based on polarization lidar measurements. Atmos. Environ. 2021, 246, 118166. [Google Scholar] [CrossRef]
  38. Wang, X.; Wei, H.; Liu, J.; Xu, B.; Wang, M.; Ji, M.; Jin, H. Quantifying the light absorption and source attribution of insoluble light-absorbing particles on Tibetan Plateau glaciers between 2013 and 2015. Cryosphere 2019, 13, 309–324. [Google Scholar] [CrossRef] [Green Version]
  39. Yang, X.; Shen, S.; Yang, F.; He, Q.; Ali, M.; Huo, W.; Liu, X. Spatial and temporal variations of blowing dust events in the Taklimakan Desert. Theor. Appl. Climatol. 2016, 125, 669–677. [Google Scholar] [CrossRef]
  40. Xiao, F.; Zhou, C.; Liao, Y. Dust storms evolution in Taklimakan Desert and its correlation with climatic parameters. J. Geogr. Sci. 2008, 18, 415–424. [Google Scholar] [CrossRef]
  41. Zeng, Y.; Wang, M.; Zhao, C.; Chen, S.; Liu, Z.; Huang, X.; Gao, Y. WRF-Chem v3.9 simulations of the East Asian dust storm in May 2017: Modeling sensitivities to dust emission and dry deposition schemes. Geosci. Model Dev. 2020, 13, 2125–2147. [Google Scholar] [CrossRef]
  42. Zhang, X.; Chen, S.; Kang, L.; Yuan, T.; Luo, Y.; Alam, K.; Li, J.; He, Y.; Bi, H.; Zhao, D. Direct Radiative Forcing Induced by Light-Absorbing Aerosols in Different Climate Regions Over East Asia. J. Geophys. Res. Atmos. 2020, 125, e2019JD032228. [Google Scholar] [CrossRef]
  43. Nan, Y.; Wang, Y. De-coupling interannual variations of vertical dust extinction over the Taklimakan Desert during 2007–2016 using CALIOP. Sci. Total Environ. 2018, 633, 608–617. [Google Scholar] [CrossRef]
  44. Pan, H.; Wang, M.; Kumar, K.R.; Lu, H.; Mamtimin, A.; Huo, W.; Yang, X.; Yang, F.; Zhou, C. Seasonal and vertical distributions of aerosol type extinction coefficients with an emphasis on the impact of dust aerosol on the microphysical properties of cirrus over the Taklimakan Desert in Northwest China. Atmos. Environ. 2019, 203, 216–227. [Google Scholar] [CrossRef]
  45. Kok, J.F.; Adebiyi, A.A.; Albani, S.; Balkanski, Y.; Checa-Garcia, R.; Chin, M.; Colarco, P.R.; Hamilton, D.S.; Huang, Y.; Ito, A.; et al. Contribution of the world’s main dust source regions to the global cycle of desert dust. Atmos. Chem. Phys. 2021, 21, 8169–8193. [Google Scholar] [CrossRef]
  46. Sugimoto, N.; Huang, Z. Lidar methods for observing mineral dust. J. Meteorol. Res. 2014, 28, 173–184. [Google Scholar] [CrossRef]
  47. Huang, Z.; Huang, J.; Bi, J.; Wang, G.; Wang, W.; Fu, Q.; Li, Z.; Tsay, S.-C.; Shi, J. Dust aerosol vertical structure measurements using three MPL lidars during 2008 China-U.S. joint dust field experiment. J. Geophys. Res. 2010, 115. [Google Scholar] [CrossRef] [Green Version]
  48. Qi, S.; Huang, Z.; Ma, X.; Huang, J.; Zhou, T.; Zhang, S.; Dong, Q.; Bi, J.; Shi, J. Classification of atmospheric aerosols and clouds by use of dual-polarization lidar measurements. Opt. Express 2021, 29, 23461–23476. [Google Scholar] [CrossRef]
  49. Liu, B.; Ma, Y.; Gong, W.; Zhang, M. Observations of aerosol color ratio and depolarization ratio over Wuhan. Atmos. Pollut. Res. 2017, 8, 1113–1122. [Google Scholar] [CrossRef]
  50. Liu, F.; Yi, F.; Yin, Z.; Zhang, Y.; He, Y.; Yi, Y. Measurement report: Characteristics of clear-day convective boundary layer and associated entrainment zone as observed by a ground-based polarization lidar over Wuhan. Atmos. Chem. Phys. 2021, 21, 2981–2998. [Google Scholar] [CrossRef]
  51. Kong, Z.; Ma, T.; Zheng, K.; Cheng, Y.; Gong, Z.; Hua, D.; Mei, L. Development of an all-day portable polarization lidar system based on the division-of-focal-plane scheme for atmospheric polarization measurements. Opt. Express 2021, 29, 38512. [Google Scholar] [CrossRef] [PubMed]
  52. Zhou, T.; Xie, H.; Bi, J.; Huang, Z.; Huang, J.; Shi, J.; Zhang, B.; Zhang, W. Lidar Measurements of Dust Aerosols during Three Field Campaigns in 2010, 2011 and 2012 over Northwestern China. Atmosphere 2018, 9, 173. [Google Scholar] [CrossRef] [Green Version]
  53. Jin, Y.; Kai, K.; Shibata, T.; Zhang, K.; Zhou, H. Validation of the dust layer structure over the Taklimakan Desert, China by the CALIOP space-borne lidar using ground-based lidar. Sci. Online Lett. Atmos. 2010, 6, 121–124. [Google Scholar] [CrossRef] [Green Version]
  54. Tsunematsu, N. Observed Dust Storm in the Taklimakan Desert on April 13, 2002. Sola 2005, 1, 21–24. [Google Scholar] [CrossRef] [Green Version]
  55. Fernald, F.G. Analysis of atmospheric lidar observations: Some comments. Appl. Opt. 1984, 23, 652–653. [Google Scholar] [CrossRef]
  56. Welton, E.J.; Campbell, J.R. Micropulse lidar signals: Uncertainty analysis. J. Atmos. Ocean. Technol. 2002, 19, 2089–2094. [Google Scholar] [CrossRef]
  57. Liu, Z.; Sugimoto, N.; Murayama, T. Extinction-to-backscatter ratio of Asian dust observed with high-spectral-resolution lidar and Raman lidar. Appl. Opt. 2002, 41, 2760. [Google Scholar] [CrossRef] [Green Version]
  58. Freudenthaler, V.; Esselborn, M.; Wiegner, M.; Heese, B.; Tesche, M.; Ansmann, A.; Müller, D.; Althausen, D.; Wirth, M.; Fix, A.; et al. Depolarization ratio profiling at several wavelengths in pure Saharan dust during SAMUM 2006. Tellus Ser. B Chem. Phys. Meteorol. 2009, 61, 165–179. [Google Scholar] [CrossRef] [Green Version]
  59. Murayama, T.; Okamoto, H.; Kaneyasu, N.; Kamataki, H.; Miura, K. Application of lidar depolarization measurement in the atmospheric boundary layer: Effects of dust and sea-salt particles. J. Geophys. Res. Atmos. 1999, 104, 31781–31792. [Google Scholar] [CrossRef]
  60. Behrendt, A.; Nakamura, T. Calculation of the calibration constant of polarization lidar and its dependency on atmospheric temperature. Opt. Express 2002, 10, 805. [Google Scholar] [CrossRef]
  61. Alvarez, J.M.; Vaughan, M.A.; Hostetler, C.A.; Hunt, W.H.; Winker, D.M. Calibration technique for polarization-sensitive lidars. J. Atmos. Ocean. Technol. 2006, 23, 683–699. [Google Scholar] [CrossRef]
  62. Sugimoto, N.; Lee, C.H. Characteristics of dust aerosols inferred from lidar depolarization measurements at two wavelengths. Appl. Opt. 2006, 45, 7468–7474. [Google Scholar] [CrossRef] [PubMed]
  63. Haarig, M.; Ansmann, A.; Althausen, D.; Klepel, A.; Groß, S.; Freudenthaler, V.; Toledano, C.; Mamouri, R.E.; Farrell, D.A.; Prescod, D.A.; et al. Triple-wavelength depolarization-ratio profiling of Saharan dust over Barbados during SALTRACE in 2013 and 2014. Atmos. Chem. Phys. 2017, 17, 10767–10794. [Google Scholar] [CrossRef] [Green Version]
  64. Ångström, A. The parameters of atmospheric turbidity. Tellus 1964, 16, 64–75. [Google Scholar] [CrossRef] [Green Version]
  65. Winker, D.M.; Hunt, W.H.; McGill, M.J. Initial performance assessment of CALIOP. Geophys. Res. Lett. 2007, 34, 1–5. [Google Scholar] [CrossRef] [Green Version]
  66. Wang, T.; Han, Y.; Hua, W.; Tang, J.; Huang, J.; Zhou, T.; Huang, Z.; Bi, J.; Xie, H. Profiling dust mass concentration in northwest china using a joint lidar and sun-photometer setting. Remote Sens. 2021, 13, 1099. [Google Scholar] [CrossRef]
  67. Huang, Z.; Qi, S.; Zhou, T.; Dong, Q.; Ma, X.; Zhang, S.; Bi, J.; Shi, J. Investigation of aerosol absorption with dual-polarization lidar observations. Opt. Express 2020, 28, 7028. [Google Scholar] [CrossRef]
  68. Painter, T.H.; Deems, J.S.; Belnap, J.; Hamlet, A.F.; Landry, C.C.; Udall, B. Response of Colorado river runoff to dust radiative forcing in snow. Proc. Natl. Acad. Sci. USA 2010, 107, 17125–17130. [Google Scholar] [CrossRef] [Green Version]
  69. Dagsson-Waldhauserova, P.; Arnalds, O.; Olafsson, H.; Hladil, J.; Skala, R.; Navratil, T.; Chadimova, L.; Meinander, O. Snow-Dust Storm: Unique case study from Iceland, March 6-7, 2013. Aeolian Res. 2015, 16, 69–74. [Google Scholar] [CrossRef]
  70. Hu, Q.; Wang, H.; Goloub, P.; Li, Z.; Veselovskii, I.; Podvin, T.; Li, K.; Korenskiy, M. The characterization of Taklamakan dust properties using a multiwavelength Raman polarization lidar in Kashi, China. Atmos. Chem. Phys. 2020, 20, 13817–13834. [Google Scholar] [CrossRef]
  71. Hofer, J.; Ansmann, A.; Althausen, D.; Engelmann, R.; Baars, H.; Wadinga Fomba, K.; Wandinger, U.; Abdullaev, S.F.; Makhmudov, A.N. Optical properties of Central Asian aerosol relevant for spaceborne lidar applications and aerosol typing at 355 and 532 nm. Atmos. Chem. Phys. 2020, 20, 9265–9280. [Google Scholar] [CrossRef]
  72. Hofer, J.; Althausen, D.; Abdullaev, S.F.; Makhmudov, A.N.; Nazarov, B.I.; Schettler, G.; Engelmann, R.; Baars, H.; Fomba, K.W.; Müller, K.; et al. Long-term profiling of mineral dust and pollution aerosol with multiwavelength polarization Raman lidar at the Central Asian site of Dushanbe, Tajikistan: Case studies. Atmos. Chem. Phys. 2017, 17, 14559–14577. [Google Scholar] [CrossRef] [Green Version]
  73. Veselovskii, I.; Goloub, P.; Podvin, T.; Bovchaliuk, V.; Derimian, Y.; Augustin, P.; Fourmentin, M.; Tanre, D.; Korenskiy, M.; Whiteman, D.N.; et al. Retrieval of optical and physical properties of African dust from multiwavelength Raman lidar measurements during the SHADOW campaign in Senegal. Atmos. Chem. Phys. 2016, 16, 7013–7028. [Google Scholar] [CrossRef] [Green Version]
  74. Groß, S.; Tesche, M.; Freudenthaler, V.; Toledano, C.; Wiegner, M.; Ansmann, A.; Althausen, D.; Seefeldner, M. Characterization of Saharan dust, marine aerosols and mixtures of biomass-burning aerosols and dust by means of multi-wavelength depolarization and Raman lidar measurements during SAMUM 2. Tellus Ser. B Chem. Phys. Meteorol. 2011, 63, 706–724. [Google Scholar] [CrossRef]
  75. Preißler, J.; Wagner, F.; Pereira, S.N.; Guerrero-Rascado, J.L. Multi-instrumental observation of an exceptionally strong Saharan dust outbreak over Portugal. J. Geophys. Res. Atmos. 2011, 116, 1–12. [Google Scholar] [CrossRef]
  76. Tesche, M.; Gross, S.; Ansmann, A.; Müller, D.; Althausen, D.; Freudenthaler, V.; Esselborn, M. Profiling of Saharan dust and biomass-burning smoke with multiwavelength polarization Raman lidar at Cape Verde. Tellus Ser. B Chem. Phys. Meteorol. 2011, 63, 649–676. [Google Scholar] [CrossRef] [Green Version]
  77. Krinner, G.; Boucher, O.; Balkanski, Y. Ice-free glacial northern Asia due to dust deposition on snow. Clim. Dyn. 2006, 27, 613–625. [Google Scholar] [CrossRef]
  78. Shi, Z.; Xie, X.; Li, X.; Yang, L.; Xie, X.; Lei, J.; Sha, Y.; Liu, X. Snow-darkening versus direct radiative effects of mineral dust aerosol on the Indian summer monsoon: Role of the Tibetan Plateau. Atmos. Chem. Phys. Discuss. 2018, 1–29. [Google Scholar] [CrossRef]
  79. Skiles, S.M.K.; Painter, T.H.; Deems, J.S.; Bryant, A.C.; Landry, C.C. Dust radiative forcing in snow of the Upper Colorado River Basin: 2. Interannual variability in radiative forcing and snowmelt rates. Water Resour. Res. 2012, 48, 1–11. [Google Scholar] [CrossRef]
  80. Skiles, S.M.K.; Painter, T. Daily evolution in dust and black carbon content, snow grain size, and snow albedo during snowmelt, Rocky Mountains, Colorado. J. Glaciol. 2017, 63, 118–132. [Google Scholar] [CrossRef] [Green Version]
Figure 1. Topography of the study area and its surroundings. The red triangle represents the Ruoqiang site (39.0°N, 88.2°E, 894 m ASL).
Remotesensing 14 00558 g001
Figure 2. The schematic diagram of the developed ground-based multi-wavelength Mie polarization lidar system (MMPL) used in this study.
Remotesensing 14 00558 g002
Figure 3. The vertical structure of clouds and aerosols detected by CALIPSO in Northwest China on 14 September 2020, (a) total attenuated backscattering coefficient at 532 nm; (b) PDR at 532 nm; (c) attenuation color ratio (1064 nm/532 nm). The red line represents the closest location of ground-based lidar site.
Remotesensing 14 00558 g003
Figure 4. The vertical structure of clouds and dust aerosols detected by ground-based Mie polarization lidar at the Ruoqiang site (39.0°N, 88.2°E, 894 m) from 13 to 14 September 2020.
Remotesensing 14 00558 g004
Figure 5. Vertical profiles of dust optical properties at Ruoqiang from 13 to 14 September 2020. Green and magenta lines represent profiles at 532 nm and 355 nm, respectively. The solid line is the averaged values from 11:00 to 12:00 (LST) on 13 September, and the dotted line is averaged values from 3:00 to 5:00 (LST) on 14 September. (a) extinction coefficients at 532 nm and 355 nm; (b) PDR at 532 nm and 355 nm; (c) extinction-related Ångström exponent (355 nm/532 nm); (d) DMC presents dust mass concentration calculated using a method proposed by Wang et al. (2021).
Remotesensing 14 00558 g005
Figure 6. Same as Figure 3 but for 2 October 2020. (a) total attenuated backscattering coefficient at 532 nm; (b) PDR at 532 nm; (c) attenuation color ratio (1064 nm/532 nm). The red line represents the closest location of ground-based lidar site.
Remotesensing 14 00558 g006
Figure 7. Same as Figure 4 but for 2 October 2020.
Remotesensing 14 00558 g007
Figure 8. Vertical profiles of dust optical properties at Ruoqiang averaged from 2:00 to 5:00 on 2 October 2020. Green and magenta lines represent profiles at 532 nm and 355 nm, respectively. (a) extinction coefficients at 532 nm and 355 nm; (b) PDR at 532 nm and 355 nm; (c) extinction-related Ångström exponent (355 nm/532 nm); (d) DMC presents dust mass concentration calculated using a method proposed by Wang et al. (2021).
Remotesensing 14 00558 g008
Figure 9. Frequency distributions of dust PDRs at 532 nm and 355 nm observed by the polarization lidar during September to October 2020 at Ruoqiang site (39.0°N, 88.2°E, 894 m). The total number of data points is 66, 300 for each panel.
Remotesensing 14 00558 g009
Figure 10. Relationships between the PDR and extinction coefficient (532 nm) obtained from the polarization lidar during September to October 2020 at Ruoqiang site (39.0°N, 88.2°E, 894 m). (a) relationship between the PDR at 532 nm and the PDR at 355 nm; (b) relationship between the PDR at 532 nm and extinction coefficients at 532 nm; (c) relationship between the δ 532 p / δ 355 p and extinction coefficient at 532 nm. The contoured color at panels represents the number of points for each grid, and the total number of data points is 66, 300 for each panel.
Remotesensing 14 00558 g010
Figure 11. Relationships between the PDR and extinction-related Ångström exponent (355 nm/532 nm) obtained from the polarization lidar during September to October 2020 at Ruoqiang site (39.0°N, 88.2°E, 894 m). (a) relationship between the PDR at 532 nm and the extinction-related Ångström exponent (355 nm/532 nm); (b) relationship between the δ 532 p / δ 355 p and the extinction-related Ångström exponent (355 nm/532 nm). The contoured color at panels represents the number of points for each grid, and the total number of data points is 66, 300 for each panel.
Remotesensing 14 00558 g011
Table 1. Summary of dust PDR and the extinction-related Ångström exponent (355 nm/532 nm) observed by lidar in literatures.
Dust SourceLocationPDR
(355 nm)
PDR
(532 nm)
Ångström
Exponent
References
Taklimakan DesertKashi0.28–0.320.36 ± 0.05−0.01 ± 0.30Hu et al., 2020 [70]
Dushanbe0.24 ± 0.0030.33 ± 0.040.1 ± 0.2Hofer et al., 2020 [71]
Dushanbe0.18–0.290.31–0.35−0.08–0.12Hofer et al., 2017 [72]
Ruoqiang0.25 ± 0.0030.34 ± 0.040.11 ± 0.24This study
Saharan DesertBarbados0.25 ± 0.030.28 ± 0.02Haarig et al., 2017 [63]
Mbour0.3 ± 0.045−0.2~0.2Veselovskii et al., 2016 [73]
Cape Verde0.24–0.270.29–0.31Groß et al., 2011 [74]
Cape Verde0.31 ± 0.10.2 ± 0.3Tesche et al., 2011 [76]
Évora0.28 ± 0.040.0 ± 0.2Preißler et al., 2011 [75]
Ouarzazate0.31 ± 0.020.04–0.35Freudenthaler et al., 2008 [58]
Publisher’s Note: MDPI stays neutral with regard to jurisdictional claims in published maps and institutional affiliations.

