Sensitivity of Green-Up Date to Meteorological Indicators in Hulun Buir Grasslands of China
Abstract
:1. Introduction
2. Materials and Methods
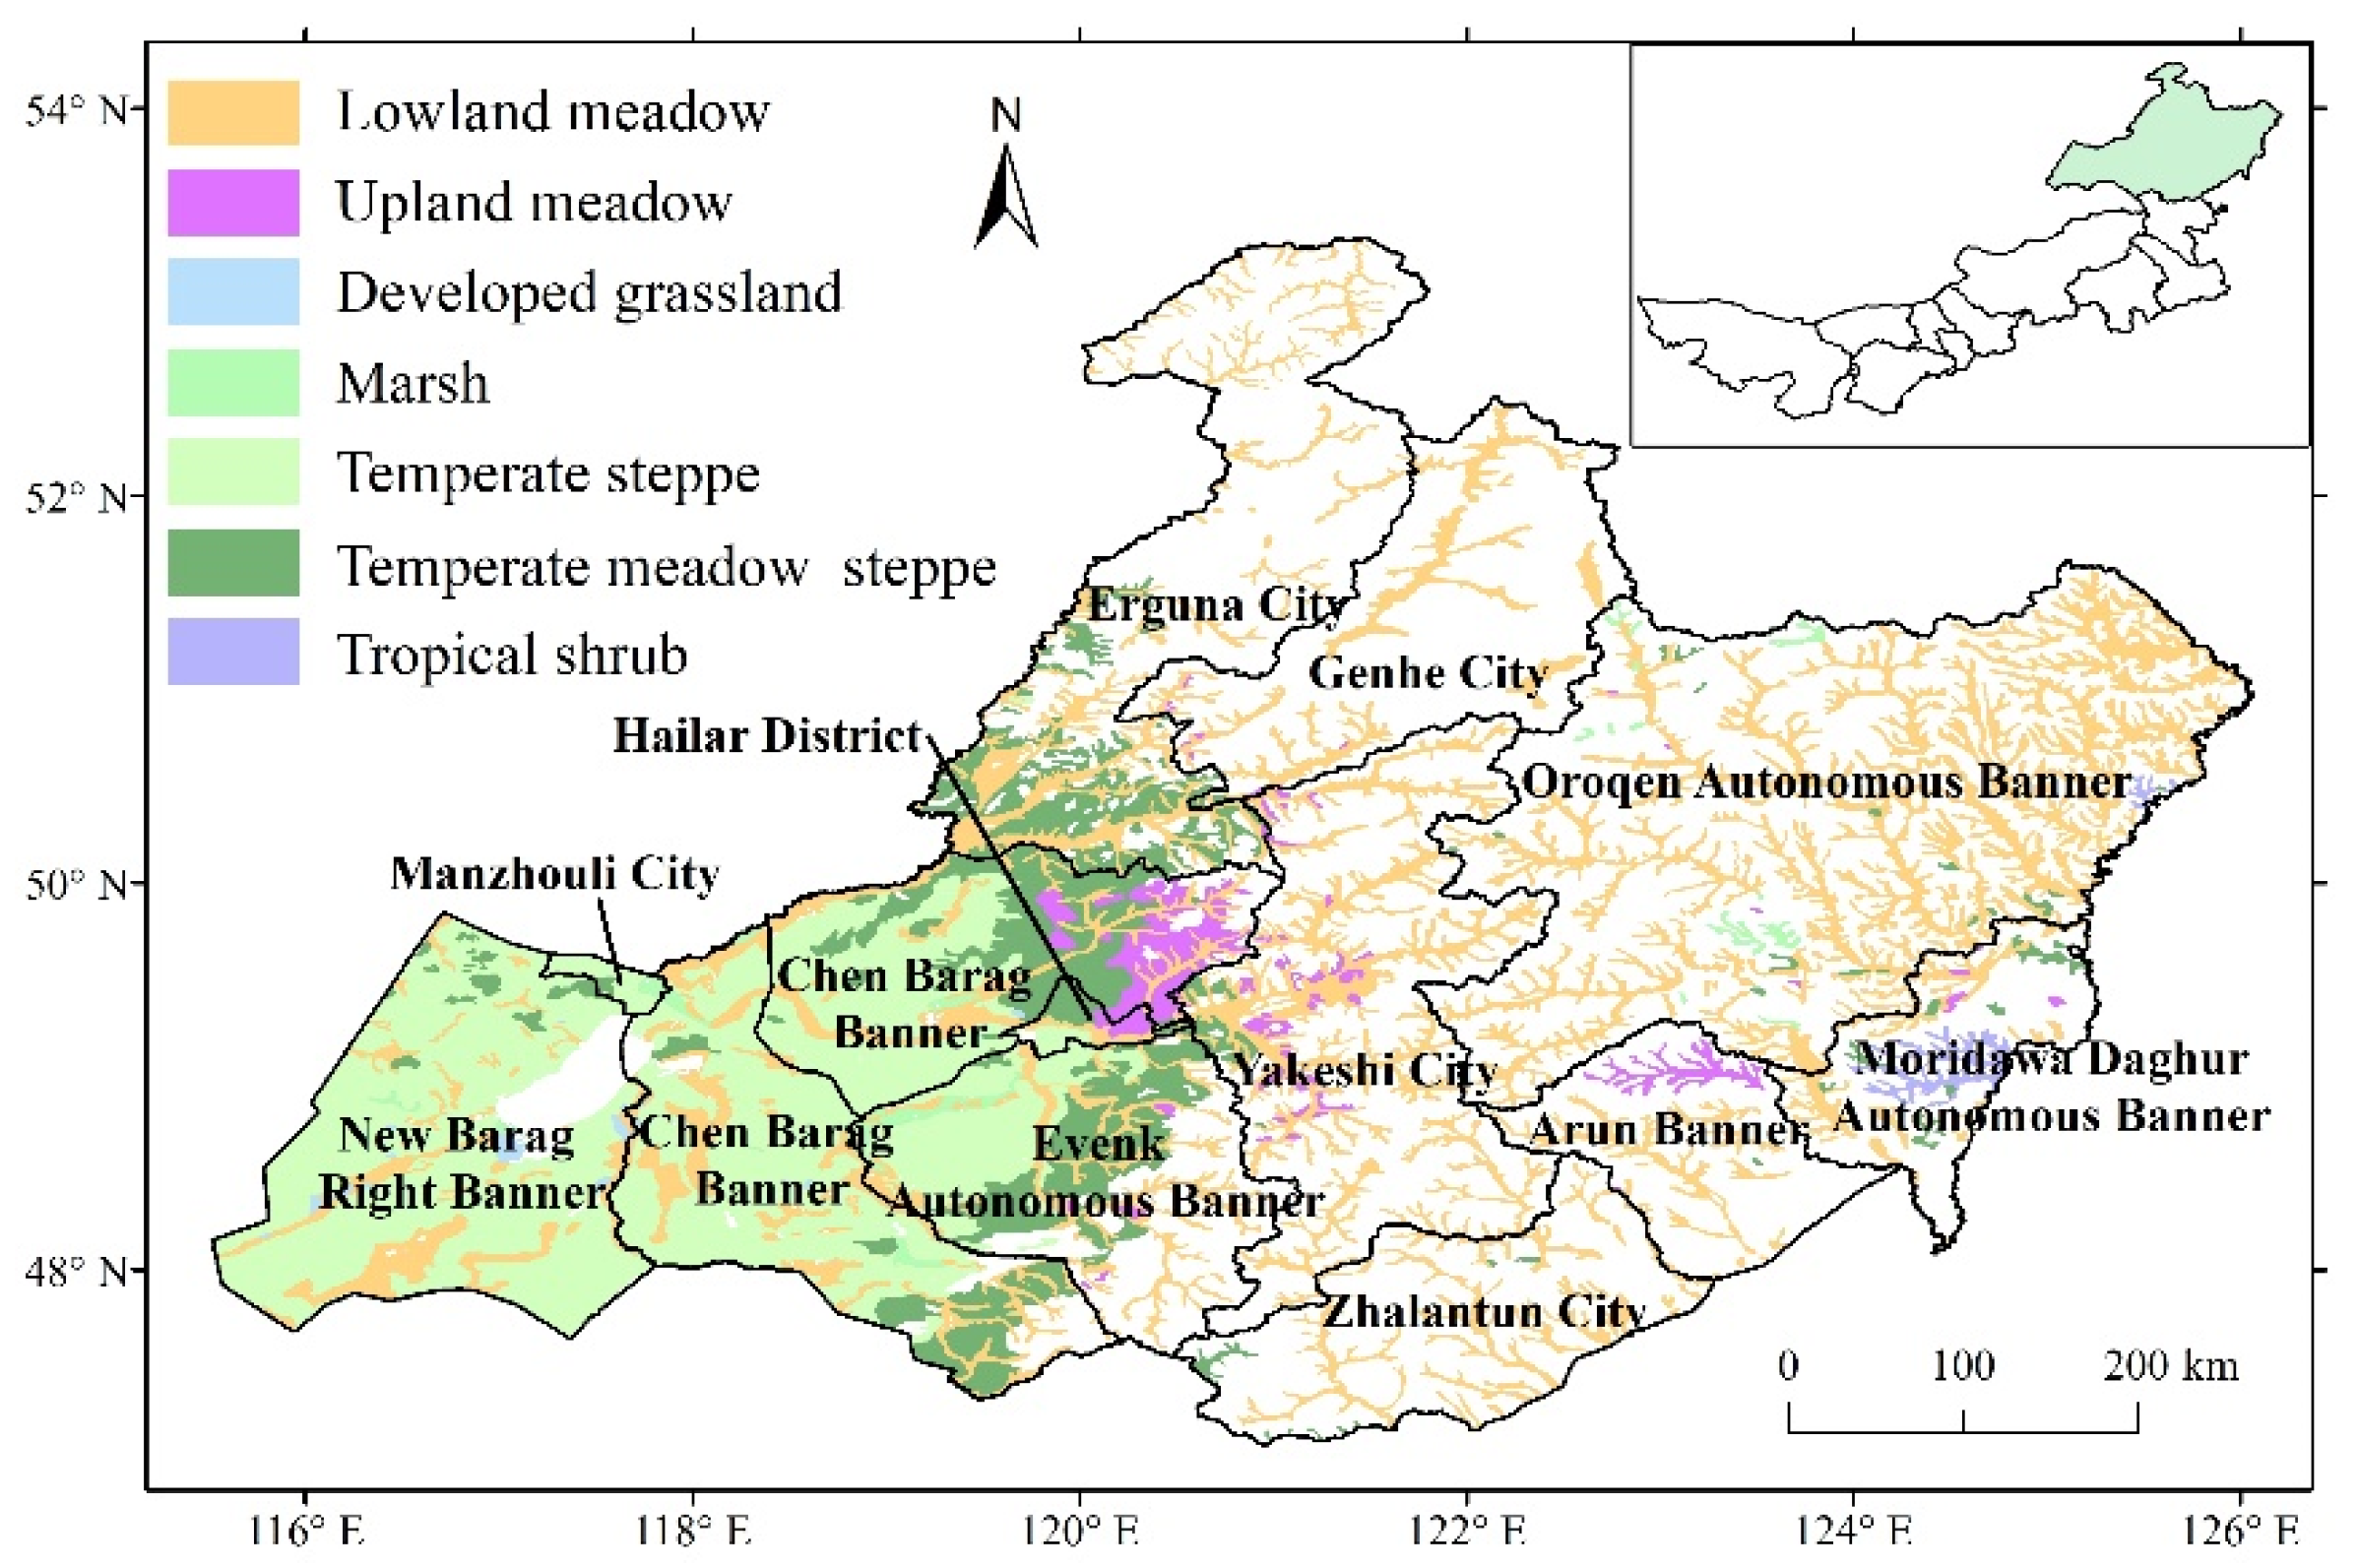
2.1. Study Area
2.2. Determination of Vegetation Green-Up Date
2.3. Calculation of the Key Meteorological Indicators
2.4. Trend Analysis Method
2.5. Partial Correlation
2.6. Sensitivity Analysis
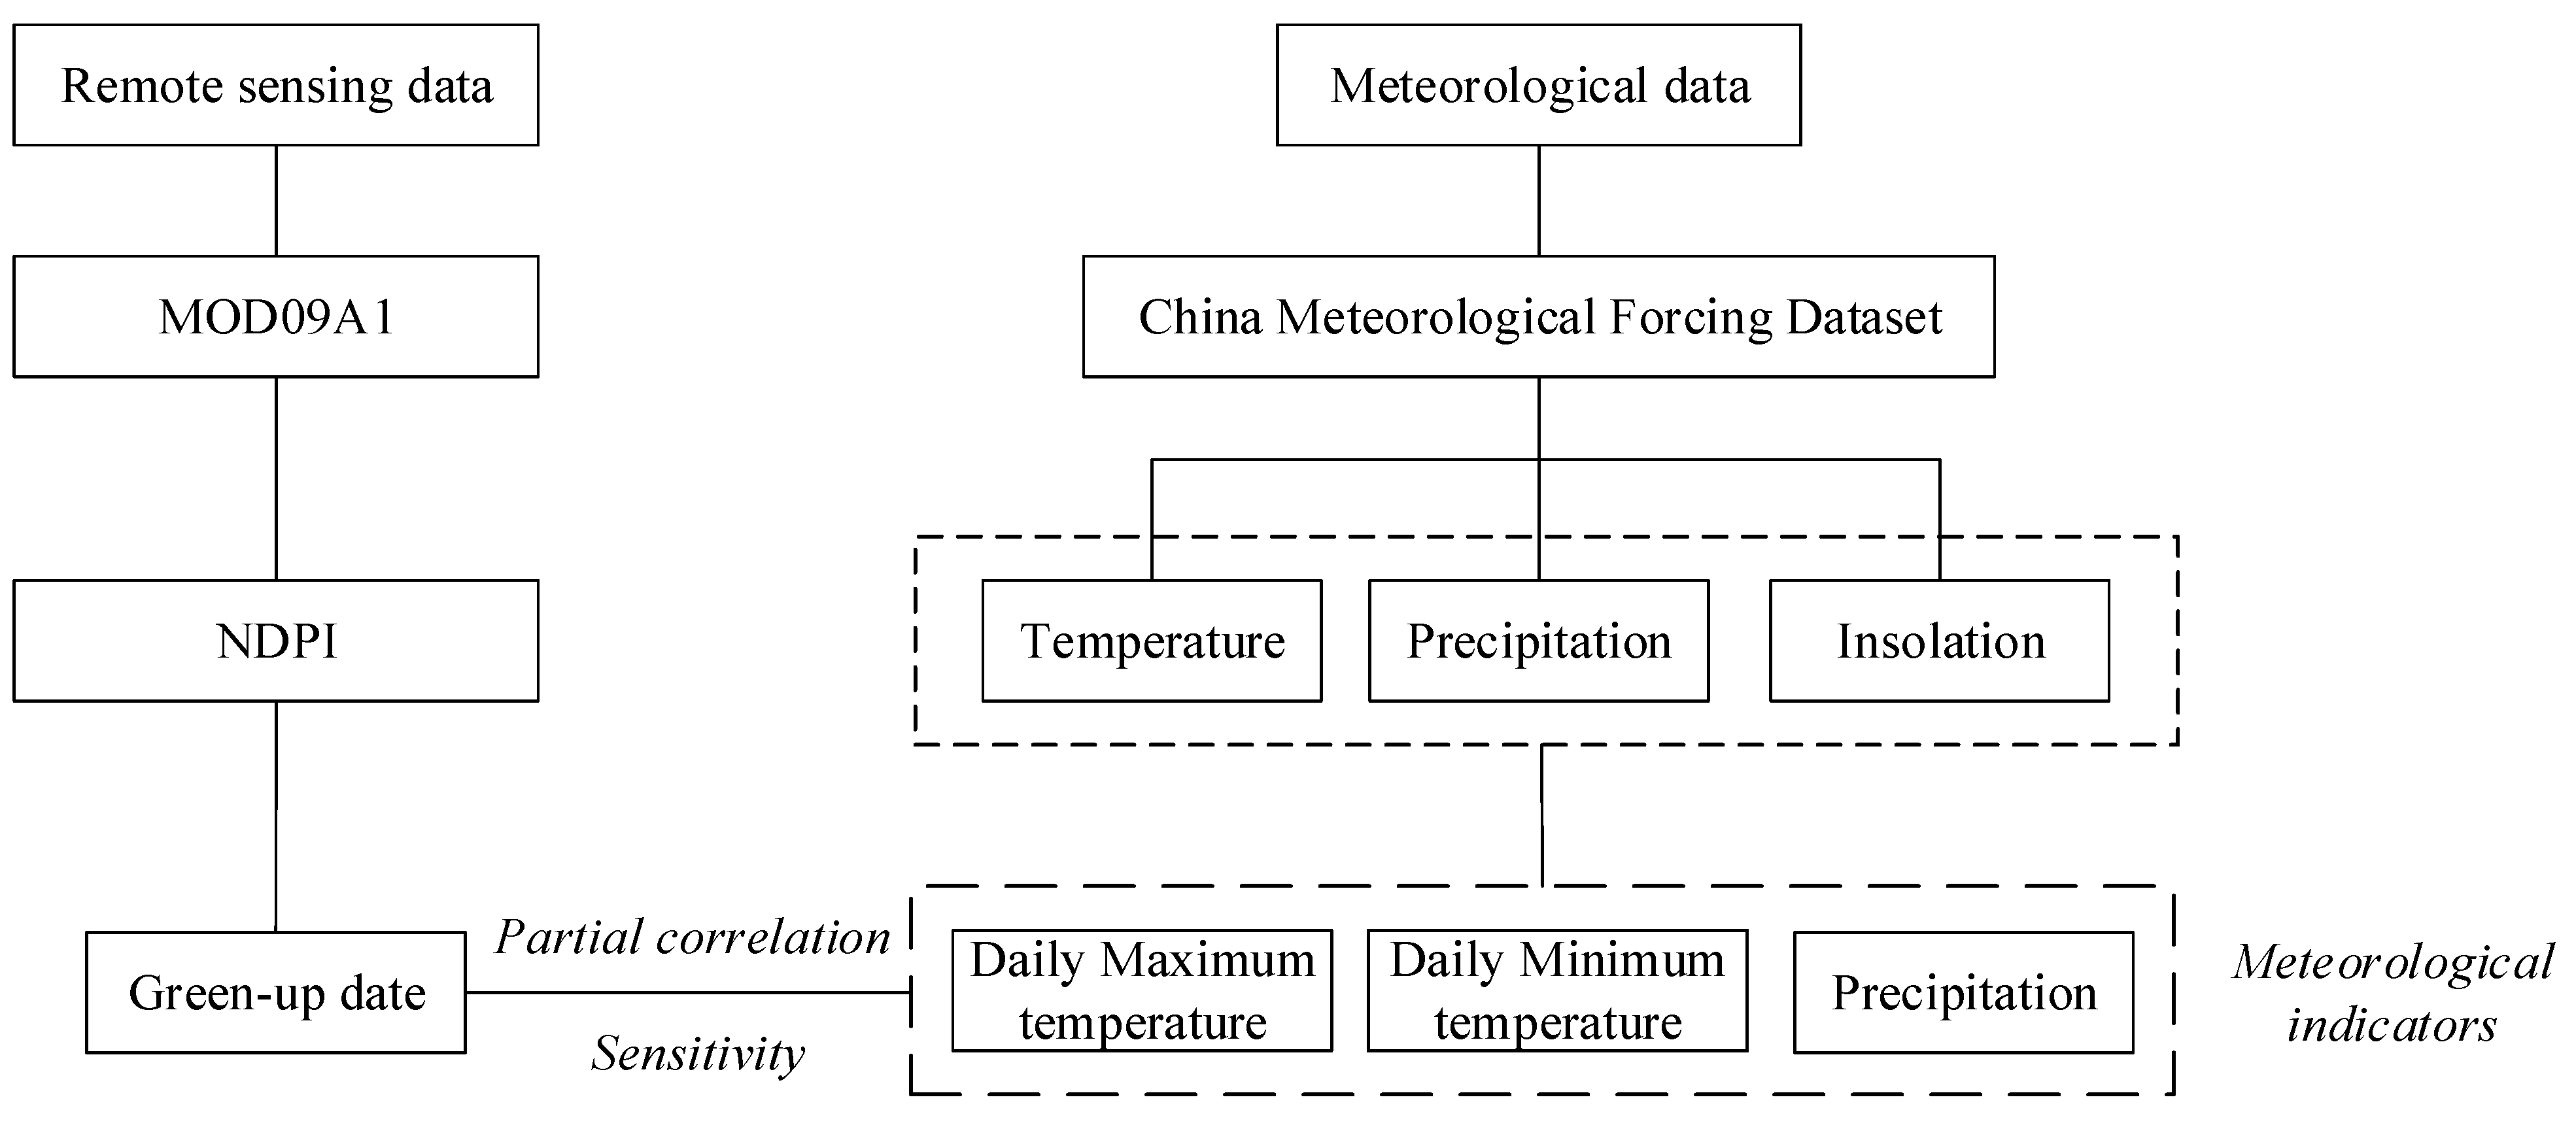
2.7. Flow Chart
3. Results
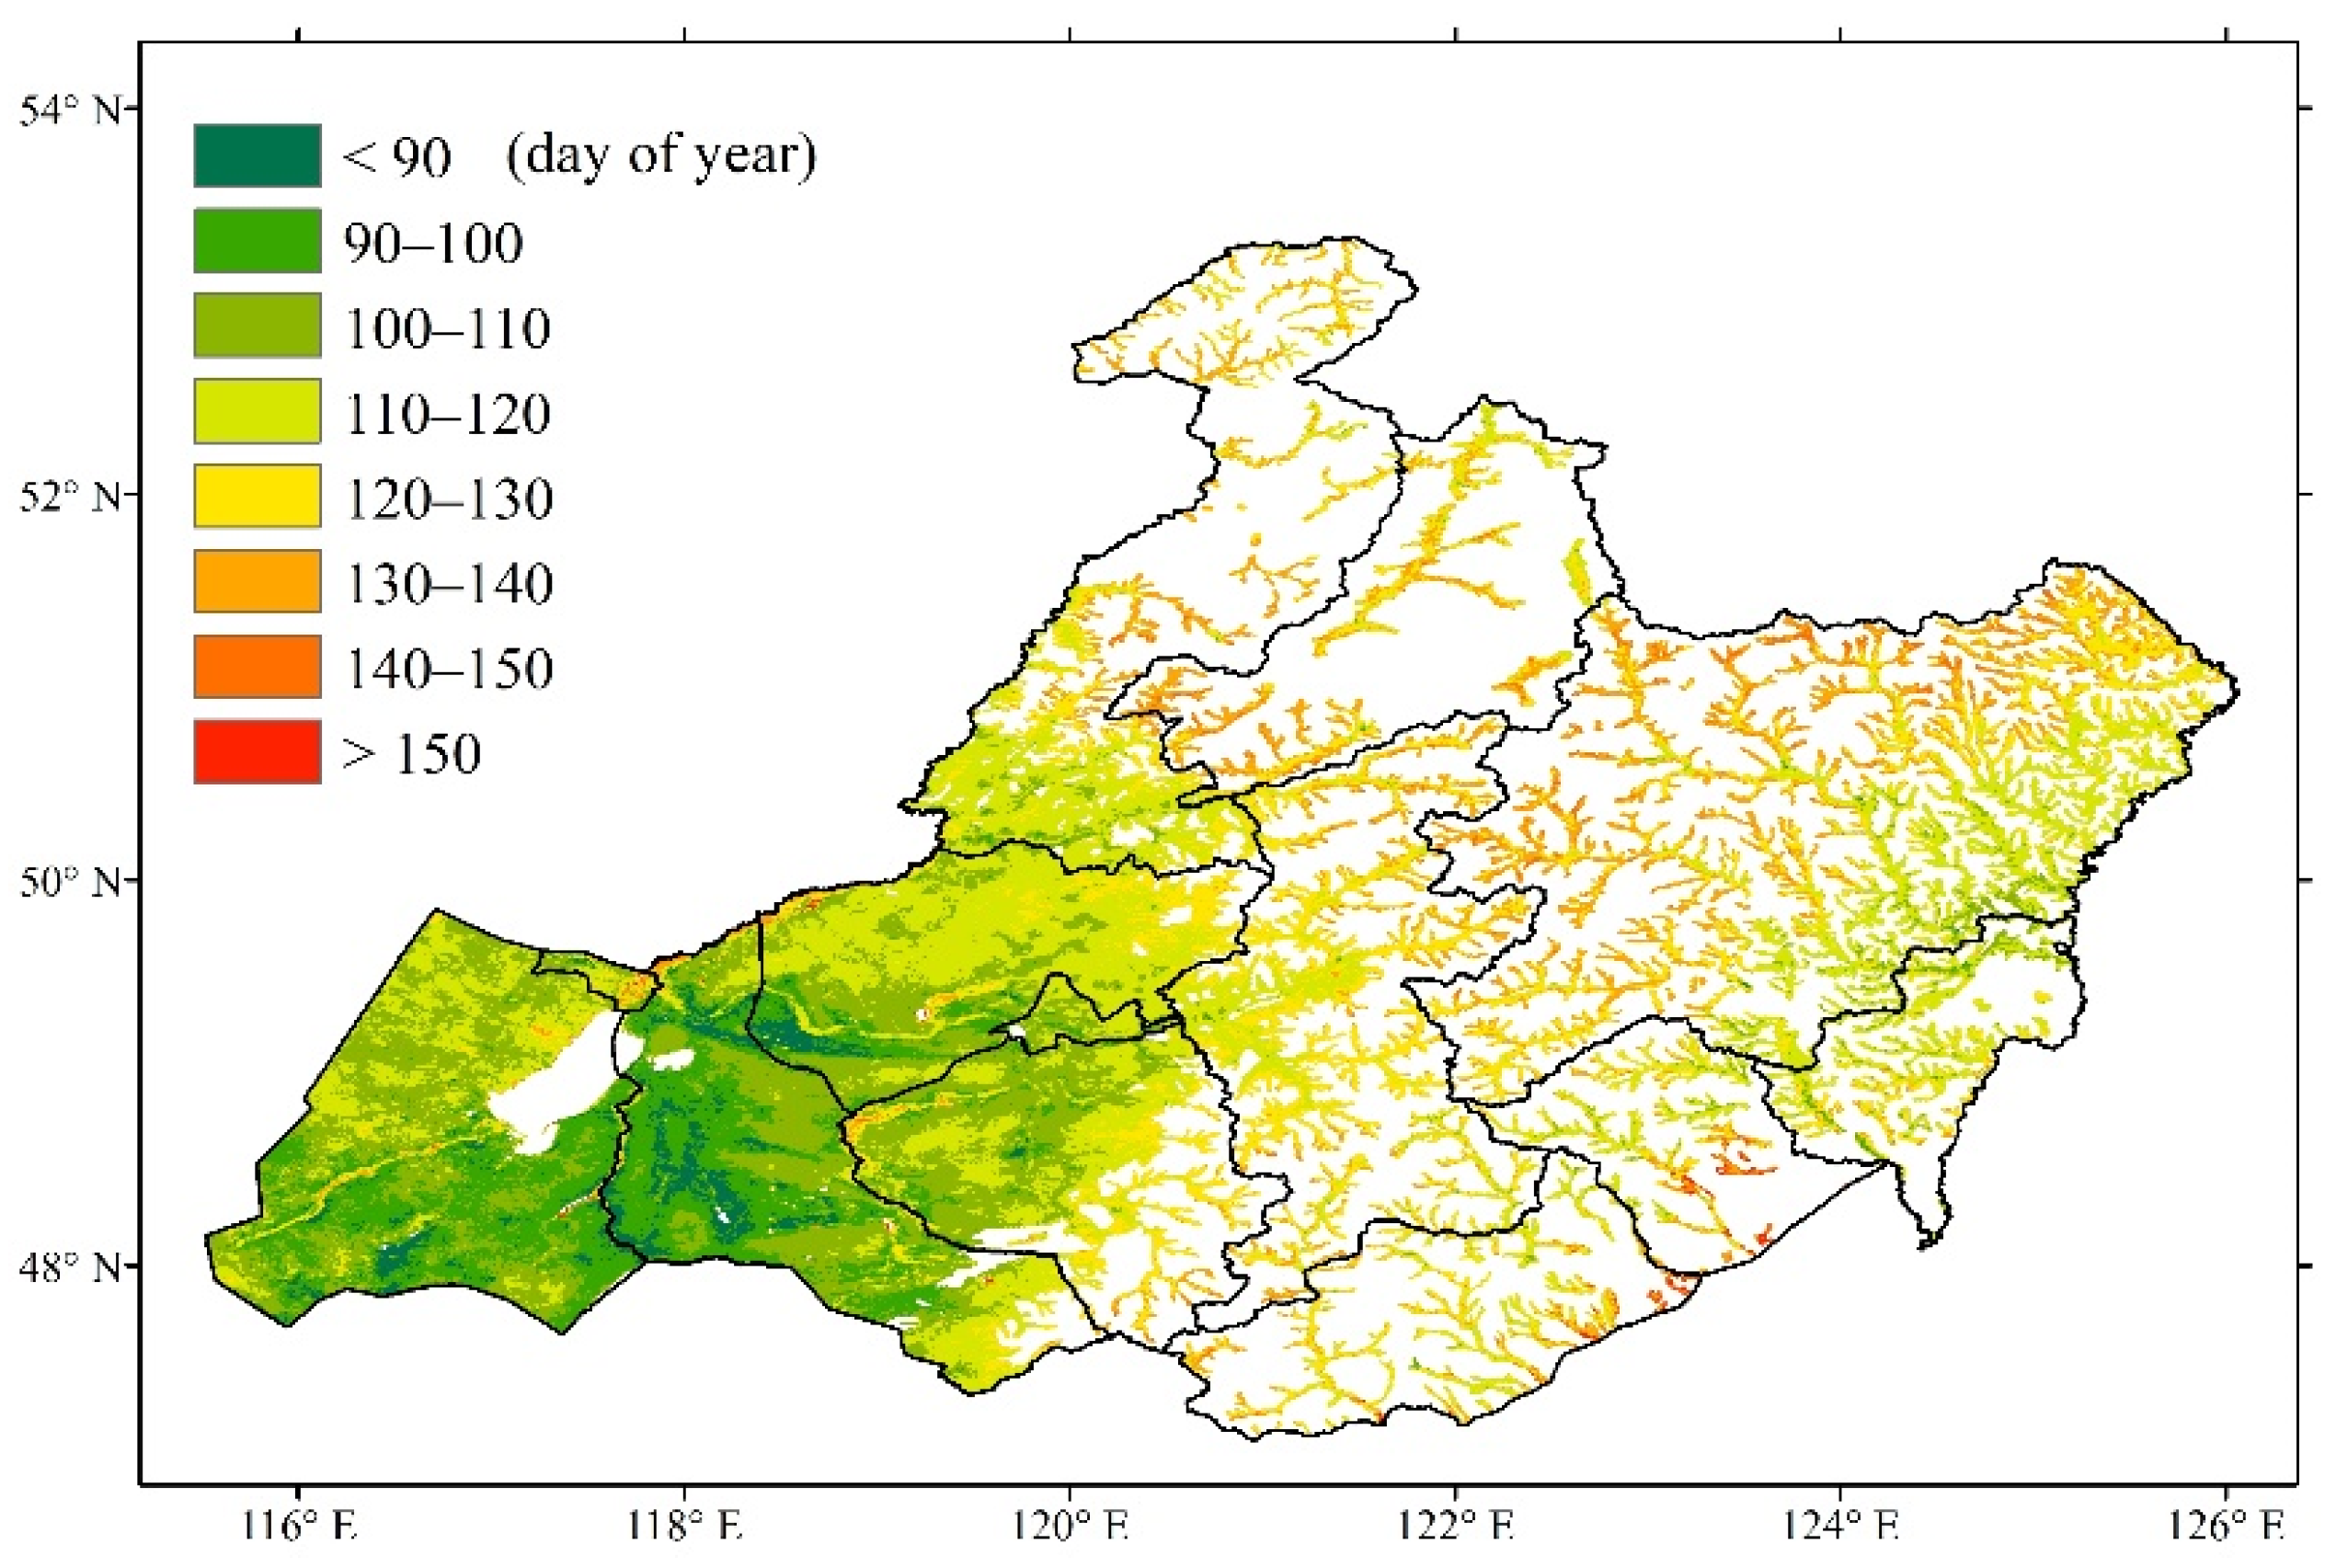
3.1. Spatial and Temporal Patterns of GUD
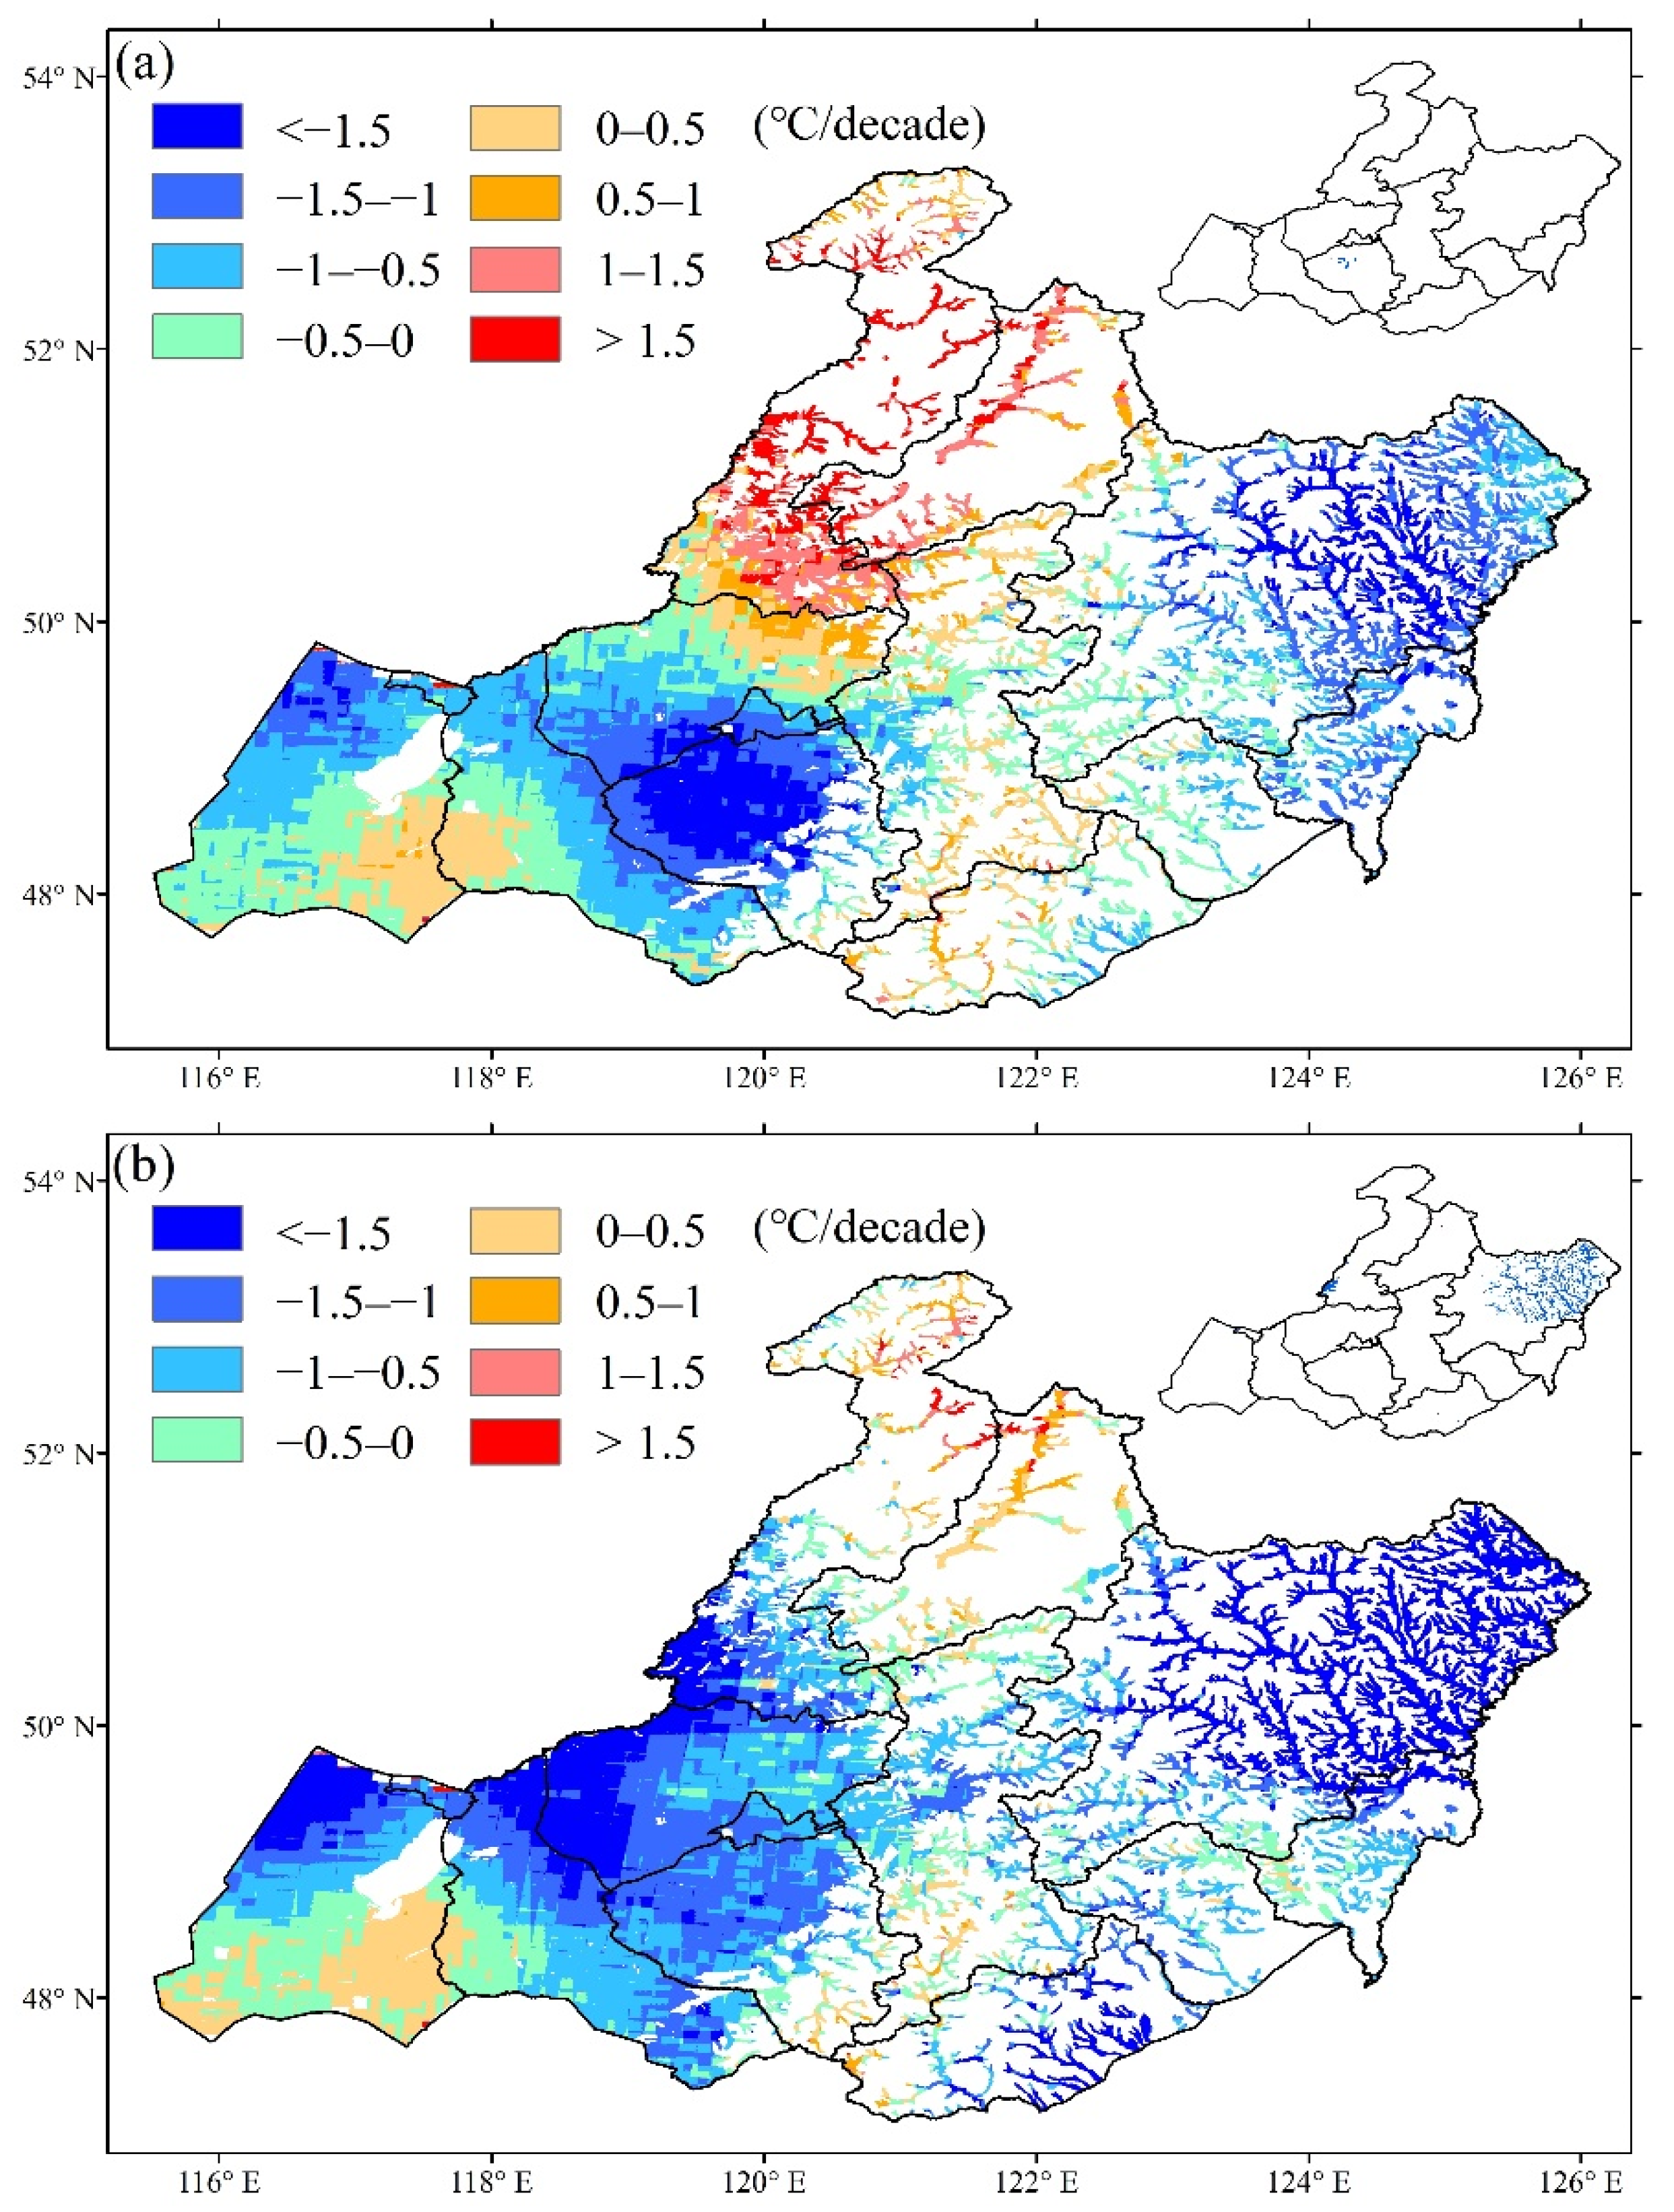
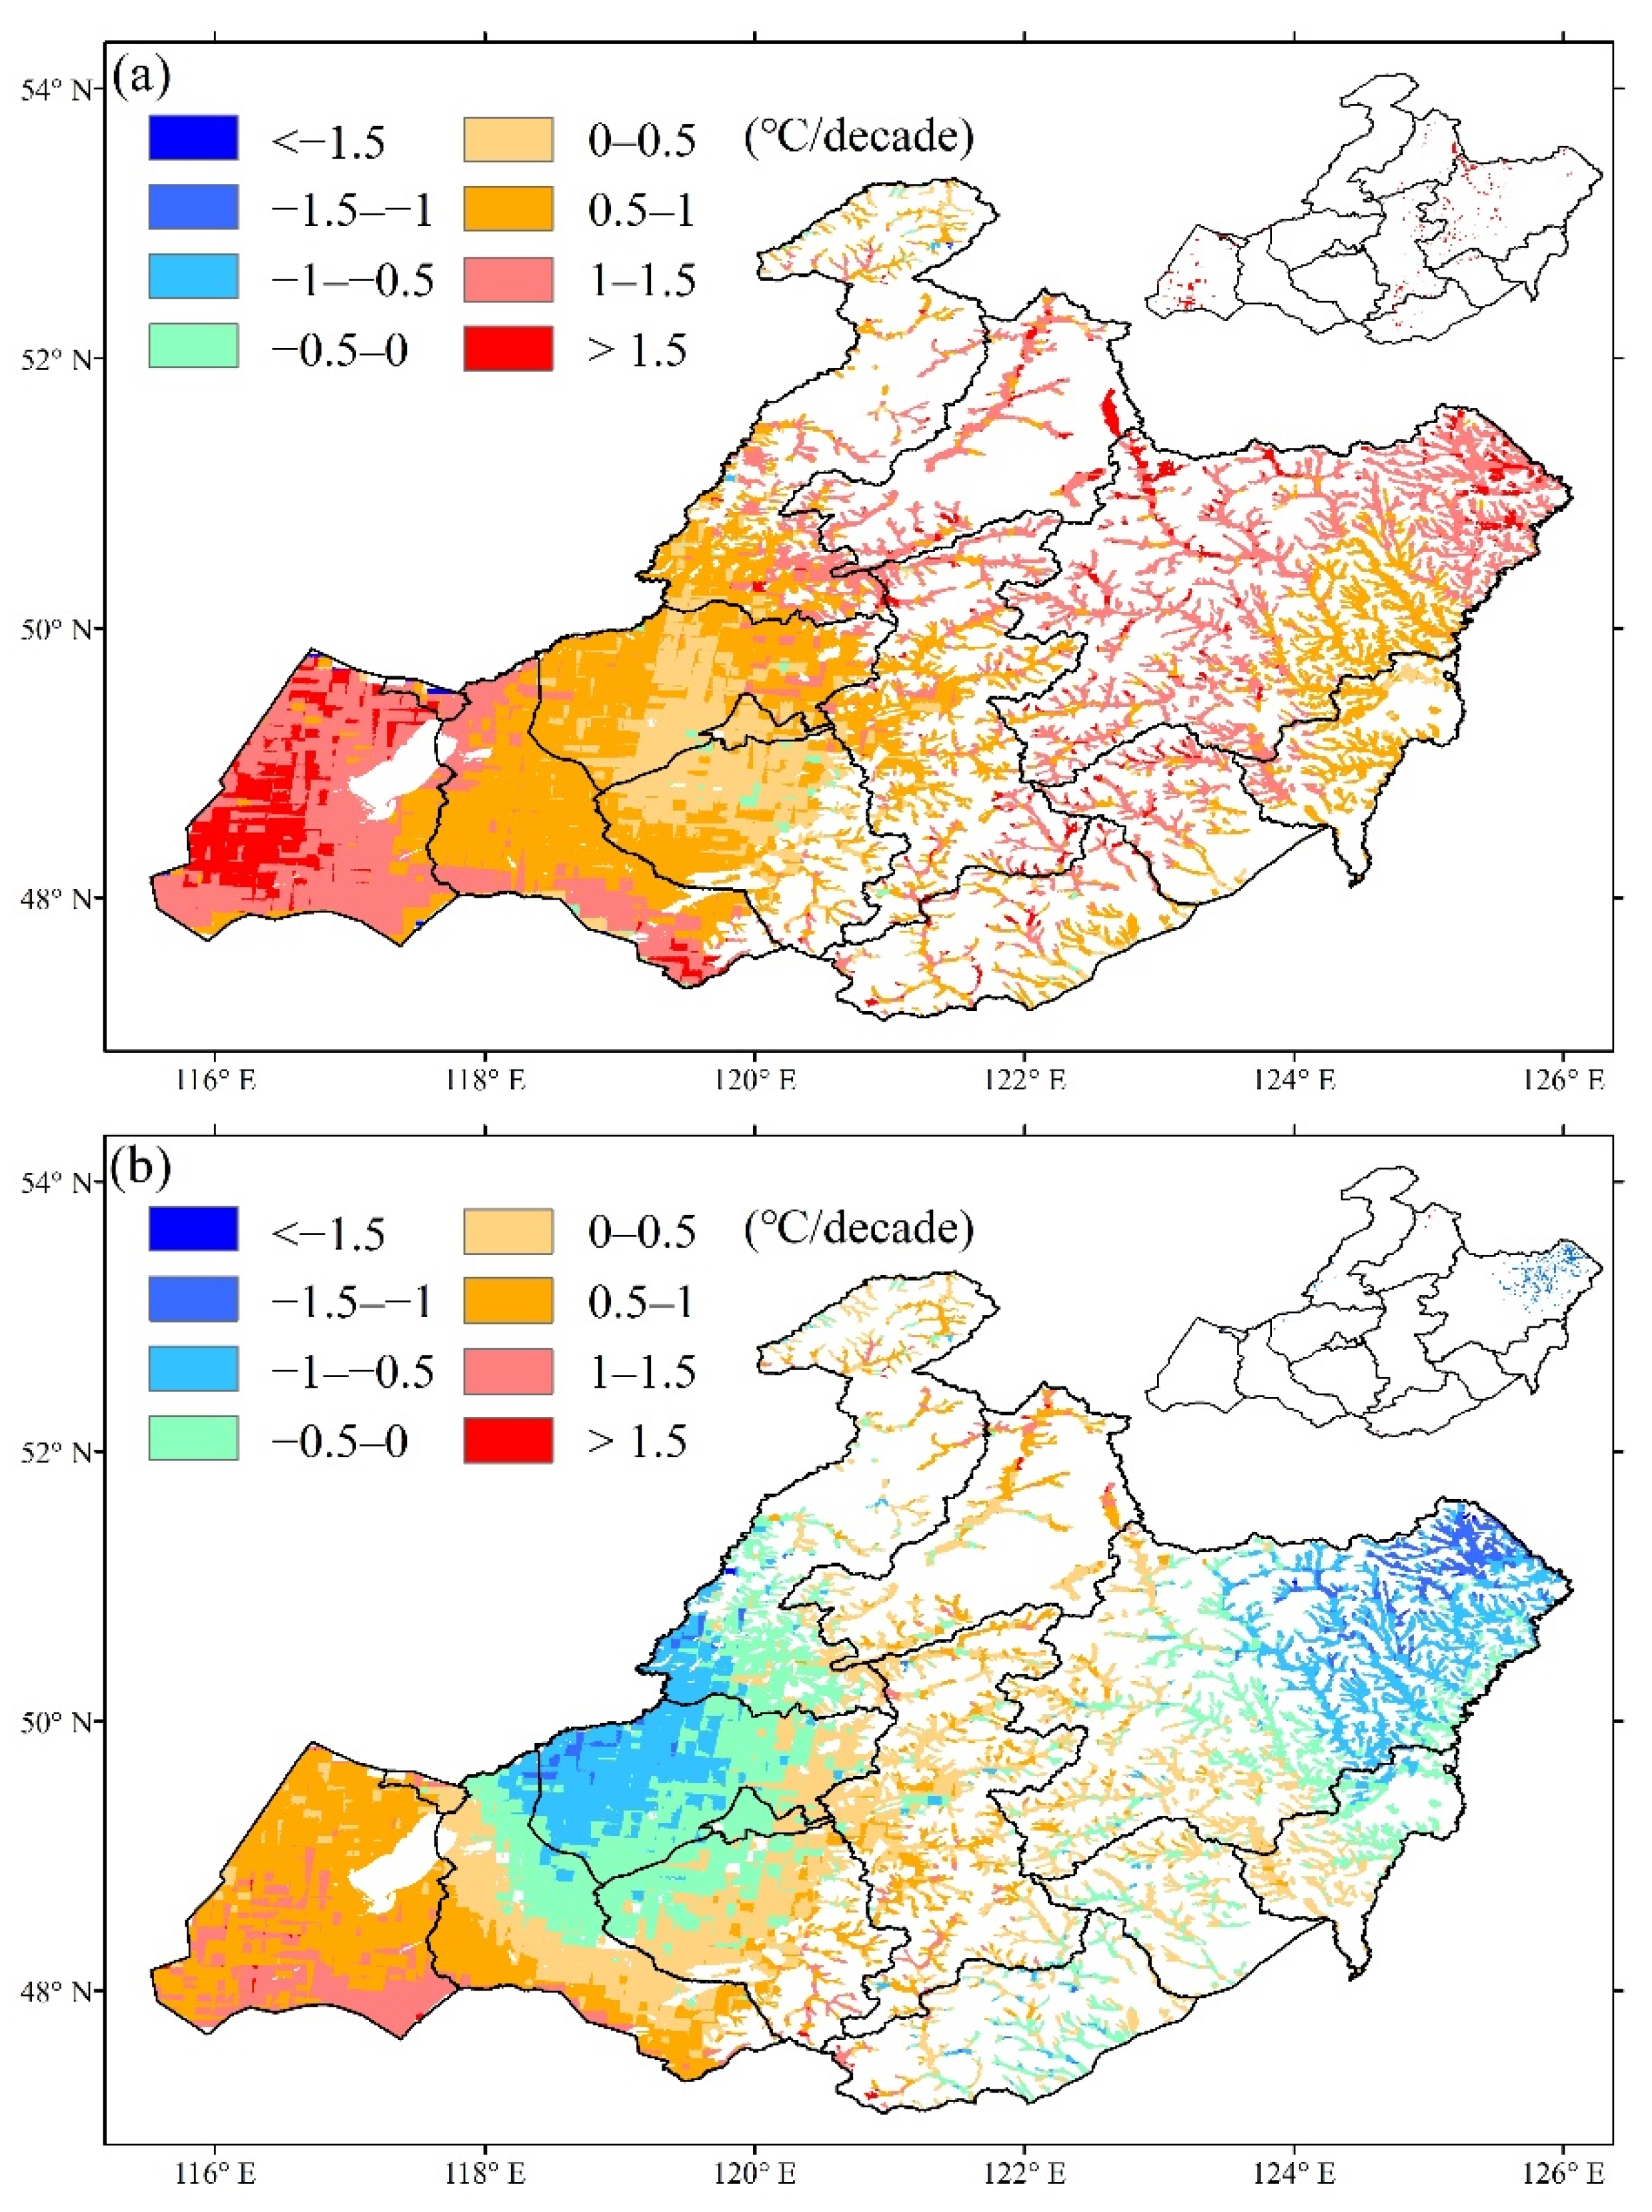
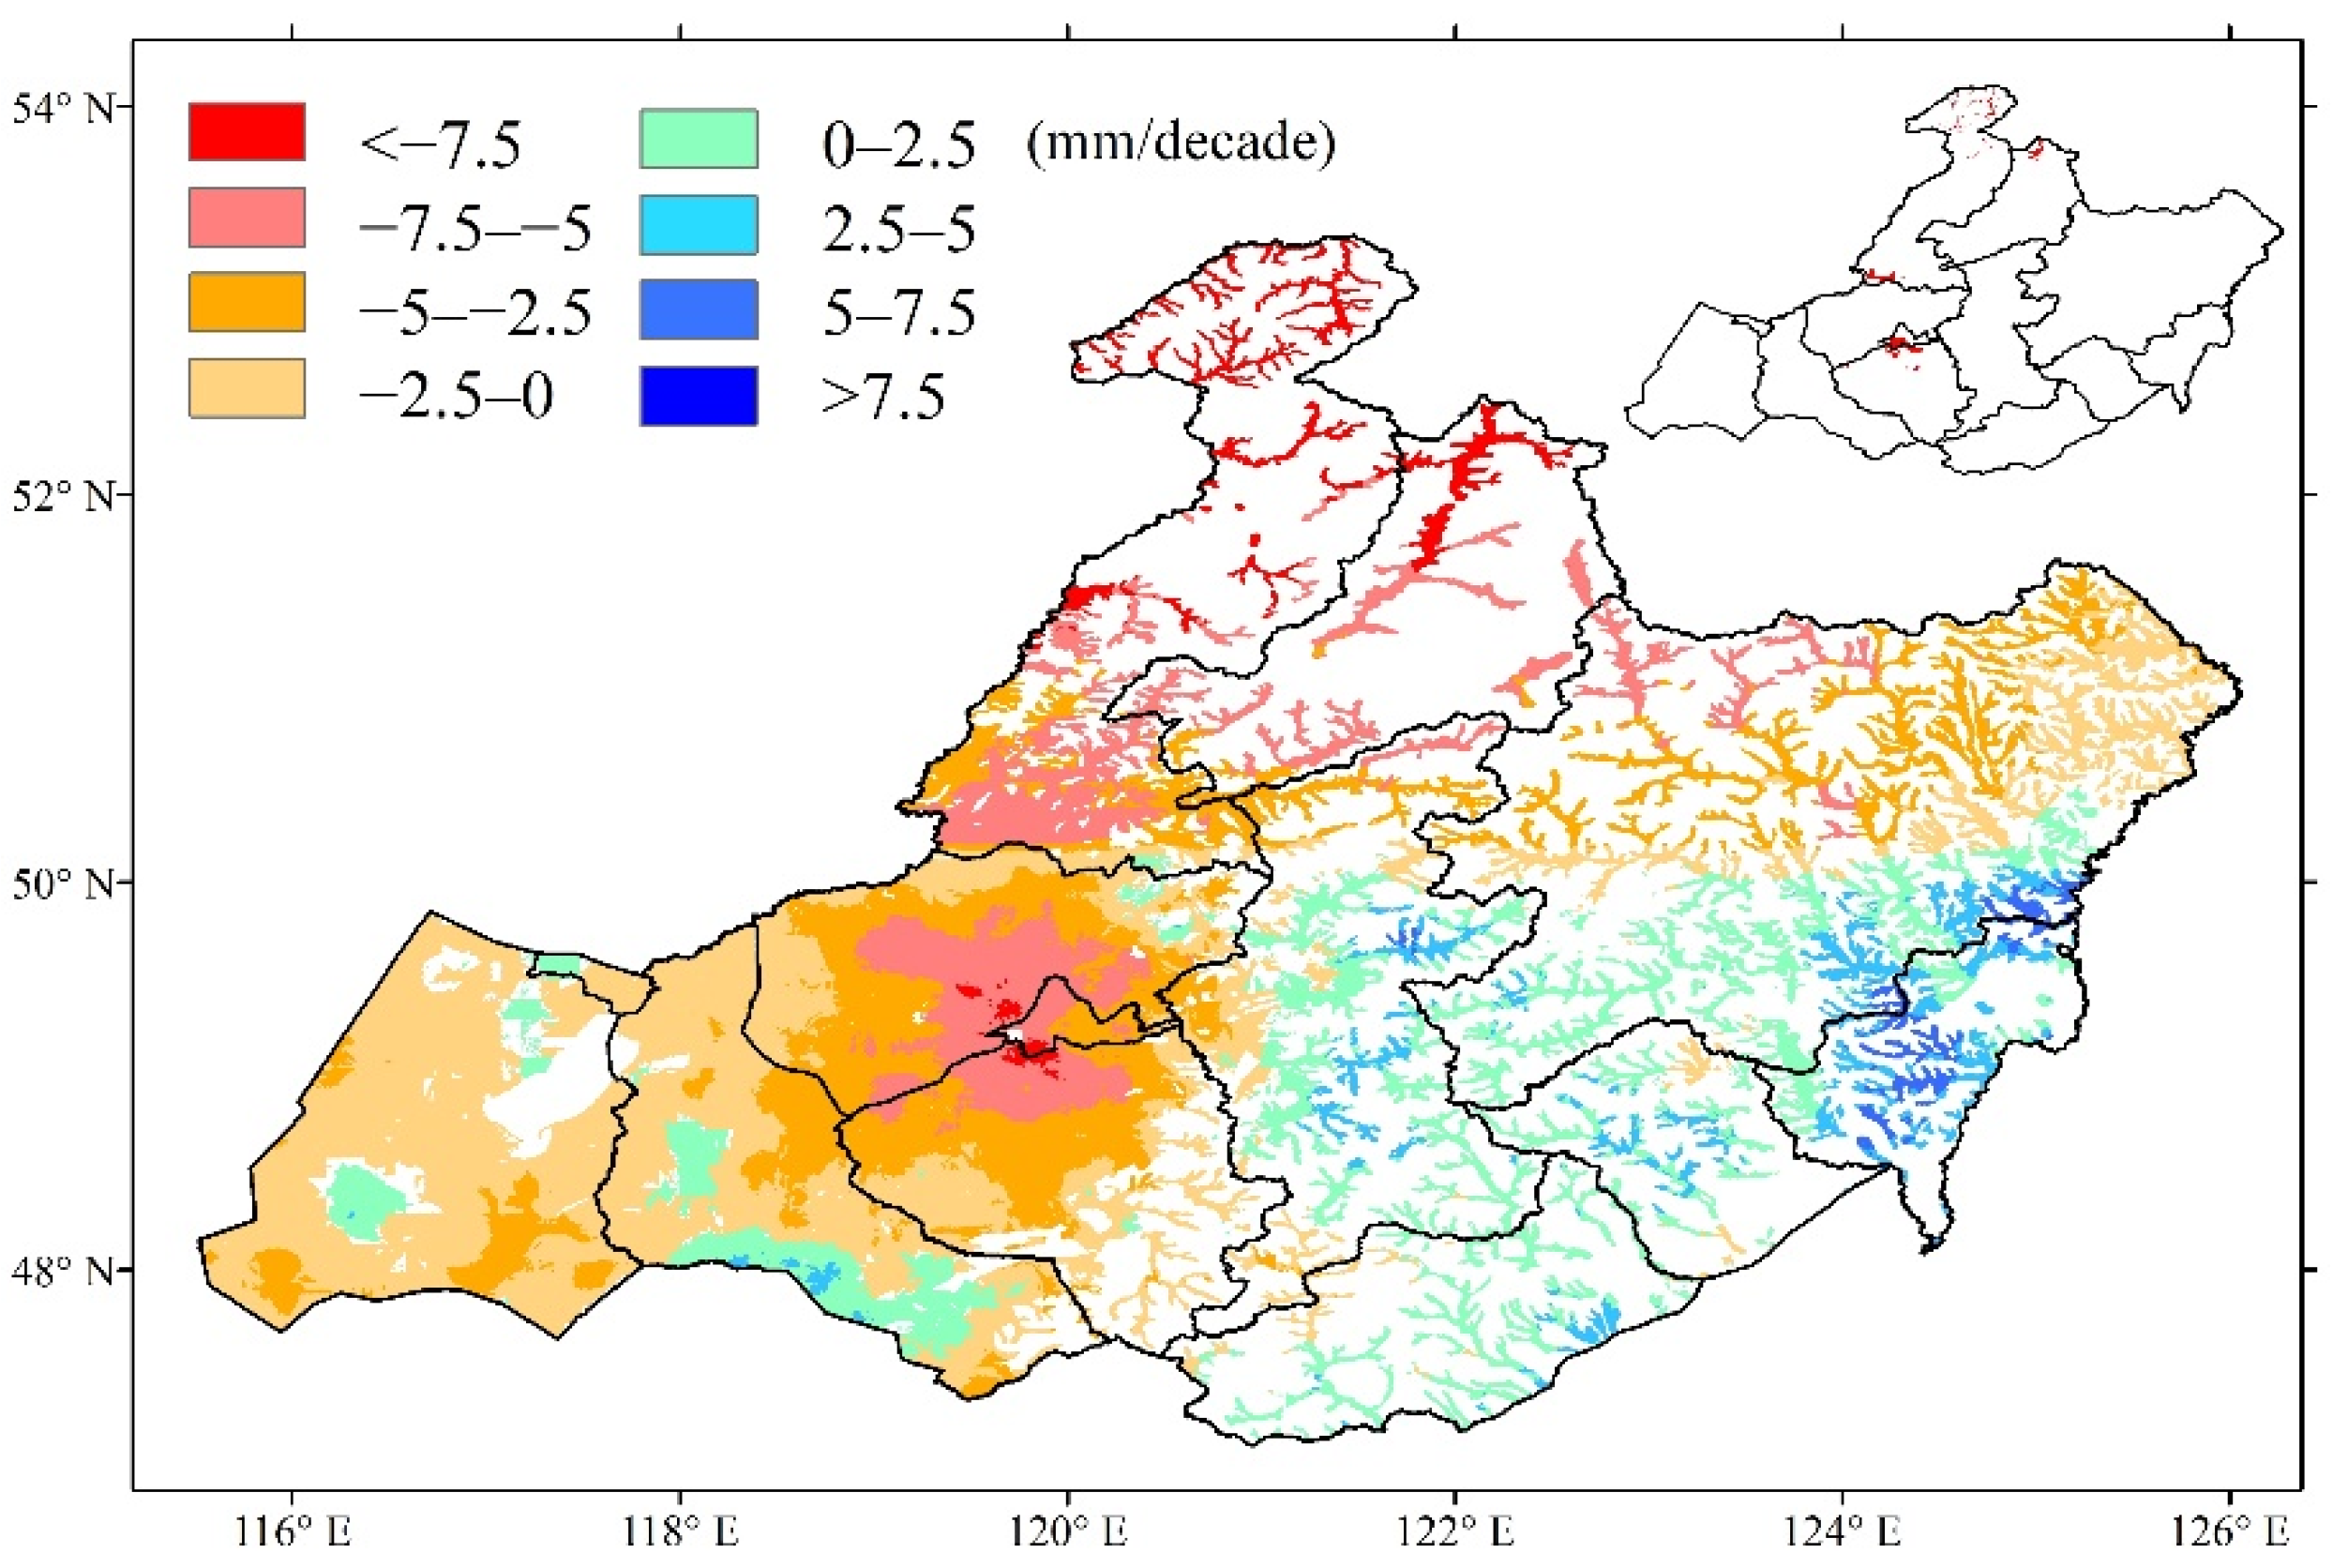
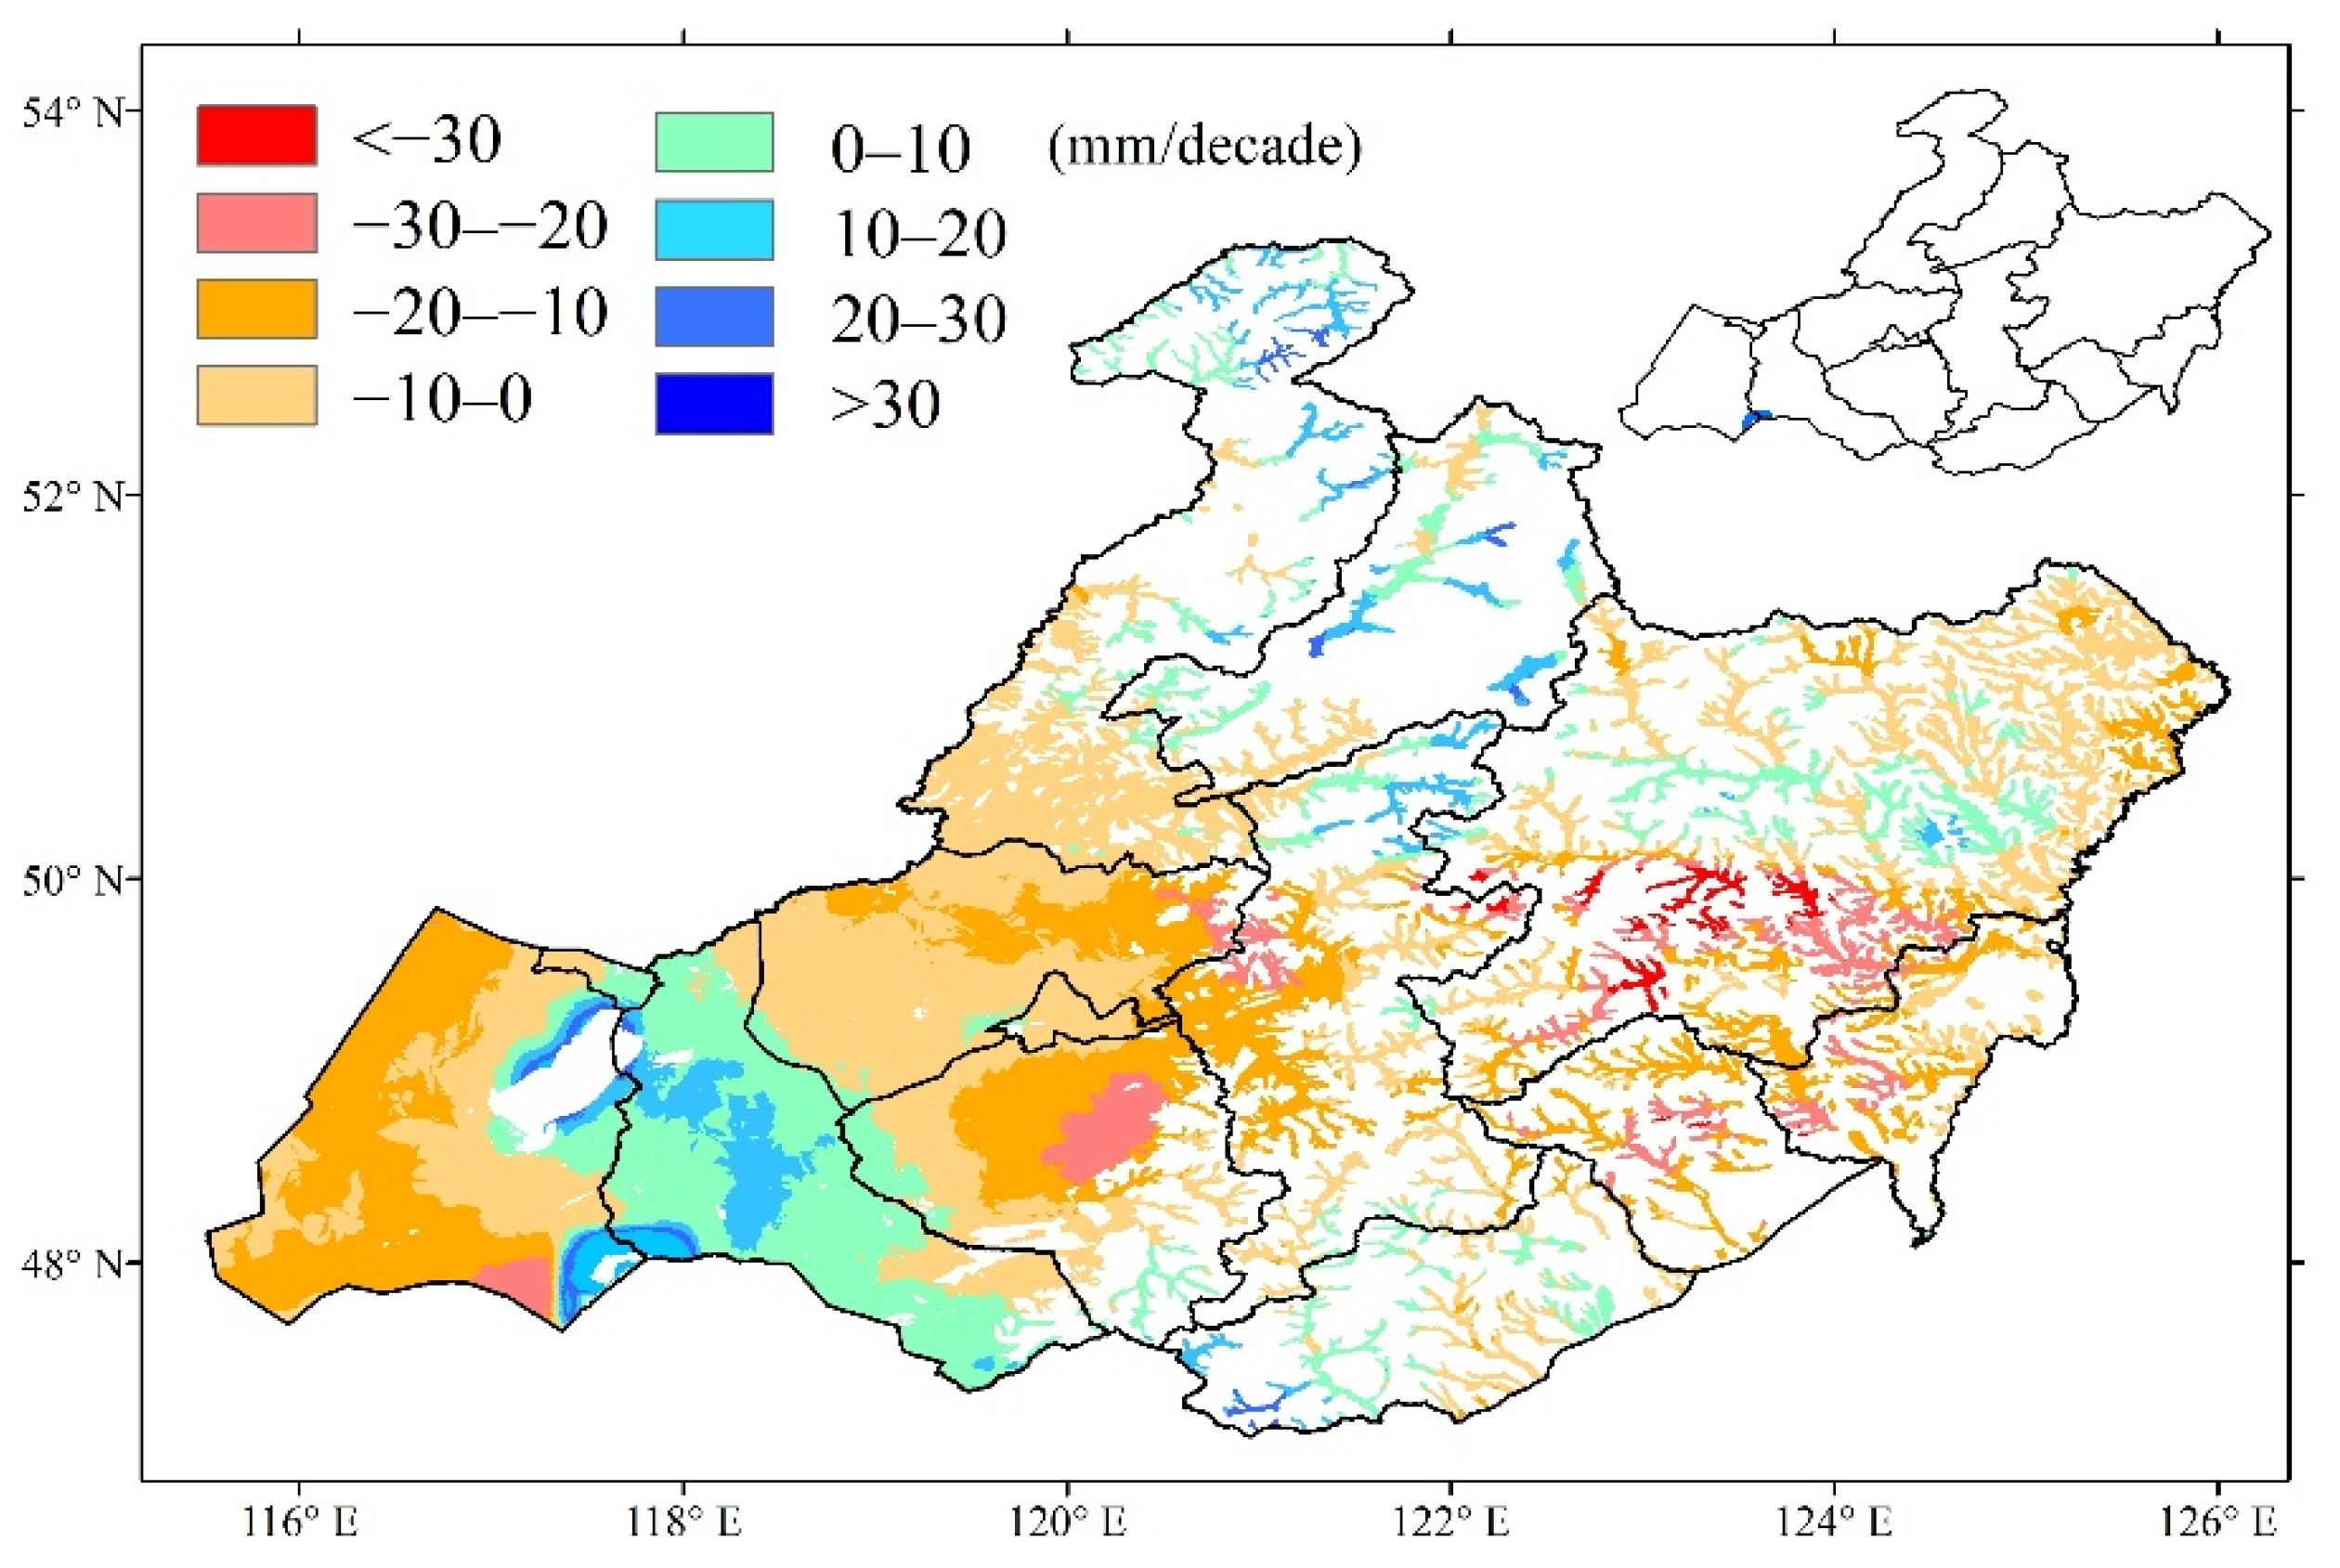
3.2. Spatial and Temporal Patterns of Meteorological Indicators
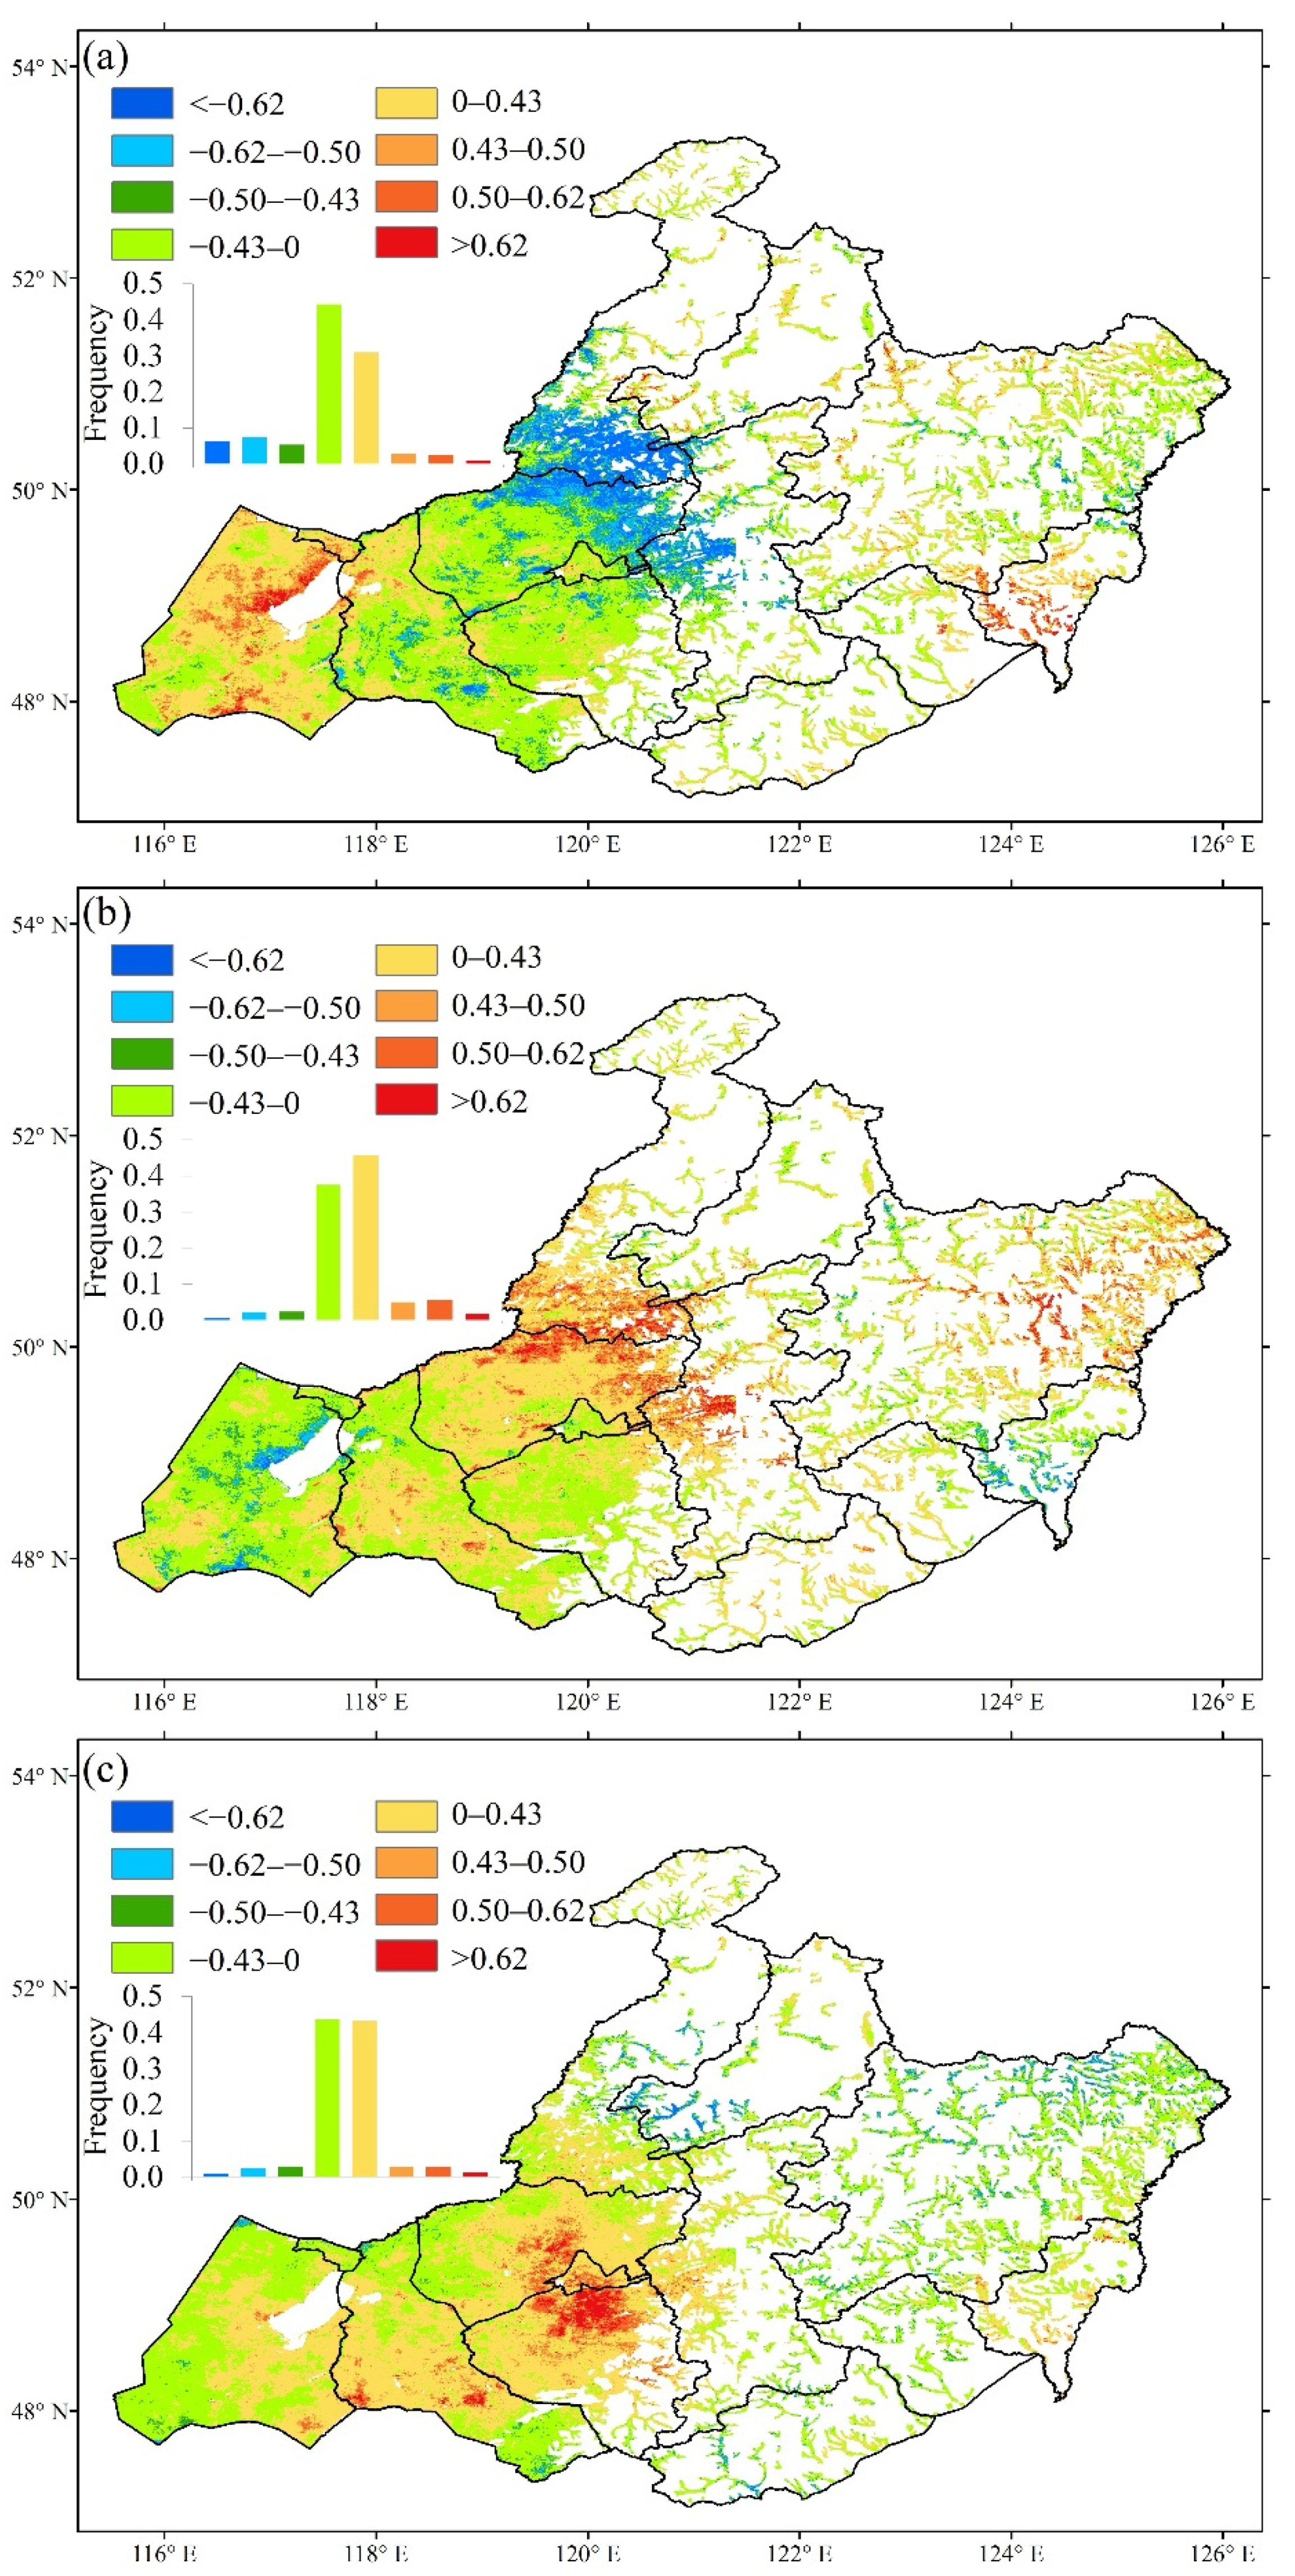
3.3. Partial Correlation Analysis between Green-Up Date and Meteorological Indicators
3.3.1. Partial Correlation Analysis in Winter
3.3.2. Partial Correlation Analysis in Spring
3.3.3. Partial Correlation Analysis in March
3.3.4. Partial Correlation Analysis in April
3.3.5. Partial Correlation Analysis in May
3.4. Sensitivity Analysis of Green-Up Date to Meteorological Indicators
3.4.1. Sensitivity Analysis of TS
3.4.2. Sensitivity Analysis of TMS
3.4.3. Sensitivity Analysis of UM
3.4.4. Sensitivity Analysis of LM
4. Discussion
4.1. Comparisons with Previous Studies
4.2. Results in Terms of Plant Physiology
4.3. Factors Affecting the Spatial Variation of Sensitivity
5. Conclusions
Author Contributions
Funding
Data Availability Statement
Conflicts of Interest
Abbreviations
| GUD | green-up date |
| Tmax | daily maximum temperature |
| Tmin | daily minimum temperature |
| TS | temperate steppe |
| TMS | temperate meadow steppe |
| UM | upland meadow |
| LM | lowland meadow |
| MODIS | Moderate Resolution Imaging Spectroradiometer |
| NASA | National Aeronautics and Space Administration |
| NDPI | normalized difference phenology index |
| DOY | day of year |
References
- IPCC. Climate Change 2013: The Physical Science Basis. Contribution of Working Group I to the Fifth Assessment Report of the Intergovernmental Panel on Climate Change; Stocker, T.F., Qin, D., Plattner, G.-K., Tignor, M., Allen, S.K., Boschung, J., Nauels, A., Xia, Y., Bex, V., Midgley, P.M., Eds.; Cambridge University Press: Cambridge, UK, 2013; p. 188. [Google Scholar]
- Lieth, H. Purposes of a Phenology Book; Springer: Berlin/Heidelberg, Germany, 1974. [Google Scholar] [CrossRef]
- Myneni, R.B.; Keeling, C.D.; Tucker, C.J.; Asrar, G.; Nemani, R.R. Increased plant growth in the northern high latitudes from 1981 to 1991. Nature 1997, 386, 698–702. [Google Scholar] [CrossRef]
- Sparks, T.H.; Menzel, A. Observed changes in seasons: An overview. Int. J. Climatol. 2002, 22, 1715–1725. [Google Scholar] [CrossRef]
- Thackeray, S.J.; Henrys, P.A.; Hemming, D.; Bell, J.R.; Botham, M.S.; Burthe, S.; Helaouet, P.; Johns, D.G.; Jones, I.D.; Leech, D.I.; et al. Phenological sensitivity to climate across taxa and trophic levels. Nature 2016, 535, 241–245. [Google Scholar] [CrossRef] [PubMed] [Green Version]
- Yang, L.H.; Rudolf, V.H. Phenology, ontogeny and the effects of climate change on the timing of species interactions. Ecol. Lett. 2010, 13, 1–10. [Google Scholar] [CrossRef]
- Kharouba, H.M.; Ehrlen, J.; Gelman, A.; Bolmgren, K.; Allen, J.M.; Travers, S.E.; Wolkovich, E.M. Global shifts in the phenological synchrony of species interactions over recent decades. Proc. Natl. Acad. Sci. USA 2018, 115, 5211–5216. [Google Scholar] [CrossRef] [Green Version]
- Renner, S.S.; Zohner, C.M. Climate Change and Phenological Mismatch in Trophic Interactions Among Plants, Insects, and Vertebrates. Annu. Rev. Ecol. Evol. Syst. 2018, 49, 165–182. [Google Scholar] [CrossRef]
- Wolkovich, E.M.; Cook, B.I.; Allen, J.M.; Crimmins, T.M.; Betancourt, J.L.; Travers, S.E.; Pau, S.; Regetz, J.; Davies, T.J.; Kraft, N.J.; et al. Warming experiments underpredict plant phenological responses to climate change. Nature 2012, 485, 494–497. [Google Scholar] [CrossRef]
- Menzel, A.; Sparks, T.H.; Estrella, N.; Koch, E.; Aasa, A.; Ahas, R.; Alm-Kubler, K.; Bissolli, P.; Braslavska, O.; Briede, A.; et al. European phenological response to climate change matches the warming pattern. Glob. Chang. Biol. 2006, 12, 1969–1976. [Google Scholar] [CrossRef]
- Lapenis, A.; Henry, H.; Vuille, M.; Mower, J. Climatic factors controlling plant sensitivity to warming. Clim. Chang. 2014, 122, 723–734. [Google Scholar] [CrossRef]
- Still, C. As different as night and day. Nature 2013, 501, 39–40. [Google Scholar] [CrossRef]
- Diez, J.M.; Ibanez, I.; Miller-Rushing, A.J.; Mazer, S.J.; Crimmins, T.M.; Crimmins, M.A.; Bertelsen, C.D.; Inouye, D.W. Forecasting phenology: From species variability to community patterns. Ecol. Lett. 2012, 15, 545–553. [Google Scholar] [CrossRef] [PubMed] [Green Version]
- Pau, S.; Wolkovich, E.M.; Cook, B.I.; Davies, T.J.; Kraft, N.J.B.; Bolmgren, K.; Betancourt, J.L.; Cleland, E.E. Predicting phenology by integrating ecology, evolution and climate science. Glob. Chang. Biol. 2011, 17, 3633–3643. [Google Scholar] [CrossRef]
- Zhang, X.Y.; Friedl, M.A.; Schaaf, C.B.; Strahler, A.H. Climate controls on vegetation phenological patterns in northern mid- and high latitudes inferred from MODIS data. Glob. Chang. Biol. 2004, 10, 1133–1145. [Google Scholar] [CrossRef]
- Cleland, E.E.; Chiariello, N.R.; Loarie, S.R.; Mooney, H.A.; Field, C.B. Diverse responses of phenology to global changes in a grassland ecosystem. Proc. Natl. Acad. Sci. USA 2006, 103, 13740–13744. [Google Scholar] [CrossRef] [PubMed] [Green Version]
- Penuelas, J.; Rutishauser, T.; Filella, I. Ecology. Phenology feedbacks on climate change. Science 2009, 324, 887–888. [Google Scholar] [CrossRef] [PubMed] [Green Version]
- Parmesan, C.; Yohe, G. A globally coherent fingerprint of climate change impacts across natural systems. Nature 2003, 421, 37–42. [Google Scholar] [CrossRef]
- Gonsamo, A.; Chen, J.M.; D’Odorico, P. Deriving land surface phenology indicators from CO2 eddy covariance measurements. Ecol. Indic. 2013, 29, 203–207. [Google Scholar] [CrossRef]
- Zheng, Z.T.; Zhu, W.Q.; Chen, G.S.; Jiang, N.; Fan, D.Q.; Zhang, D.H. Continuous but diverse advancement of spring-summer phenology in response to climate warming across the Qinghai-Tibetan Plateau. Agric. For. Meteorol. 2016, 223, 194–202. [Google Scholar] [CrossRef]
- Ji, L.; Peters, A.J. A spatial regression procedure for evaluating the relationship between AVHRR-NDVI and climate in the northern Great Plains. Int. J. Remote Sens. 2004, 25, 297–311. [Google Scholar] [CrossRef]
- Xu, X.; Riley, W.J.; Koven, C.D.; Jia, G. Observed and Simulated Sensitivities of Spring Greenup to Preseason Climate in Northern Temperate and Boreal Regions. J. Geophys. Res. Biogeosci. 2018, 123, 60–78. [Google Scholar] [CrossRef] [Green Version]
- Fu, Y.H.; Liu, Y.; De Boeck, H.J.; Menzel, A.; Nijs, I.; Peaucelle, M.; Penuelas, J.; Piao, S.; Janssens, I.A. Three times greater weight of daytime than of night-time temperature on leaf unfolding phenology in temperate trees. New Phytol. 2016, 212, 590–597. [Google Scholar] [CrossRef] [PubMed] [Green Version]
- Shen, X.; Liu, B.; Henderson, M.; Wang, L.; Wu, Z.; Wu, H.; Jiang, M.; Lu, X. Asymmetric effects of daytime and nighttime warming on spring phenology in the temperate grasslands of China. Agric. For. Meteorol. 2018, 259, 240–249. [Google Scholar] [CrossRef]
- Meng, L.; Zhou, Y.Y.; Li, X.; Asrar, G.R.; Mao, J.F.; Wanamaker, A.D.; Wang, Y.Q. Divergent responses of spring phenology to daytime and nighttime warming. Agric. For. Meteorol. 2020, 281, 107832. [Google Scholar] [CrossRef]
- Piao, S.; Tan, J.; Chen, A.; Fu, Y.H.; Ciais, P.; Liu, Q.; Janssens, I.A.; Vicca, S.; Zeng, Z.; Jeong, S.J.; et al. Leaf onset in the northern hemisphere triggered by daytime temperature. Nat. Commun. 2015, 6, 6911. [Google Scholar] [CrossRef] [Green Version]
- Vitasse, Y.; Delzon, S.; Dufrêne, E.; Pontailler, J.-Y.; Louvet, J.-M.; Kremer, A.; Michalet, R. Leaf phenology sensitivity to temperature in European trees: Do within-species populations exhibit similar responses? Agric. For. Meteorol. 2009, 149, 735–744. [Google Scholar] [CrossRef]
- Shen, M.; Tang, Y.; Chen, J.; Yang, X.; Wang, C.; Cui, X.; Yang, Y.; Han, L.; Li, L.; Du, J.; et al. Earlier-season vegetation has greater temperature sensitivity of spring phenology in northern hemisphere. PLoS ONE 2014, 9, e88178. [Google Scholar] [CrossRef]
- Cong, N.; Wang, T.; Nan, H.; Ma, Y.; Wang, X.; Myneni, R.B.; Piao, S. Changes in satellite-derived spring vegetation green-up date and its linkage to climate in China from 1982 to 2010: A multimethod analysis. Glob. Chang. Biol. 2013, 19, 881–891. [Google Scholar] [CrossRef]
- Wu, C.Y.; Gonsamo, A.; Chen, J.M.; Kurz, W.A.; Price, D.T.; Lafleur, P.M.; Jassal, R.S.; Dragoni, D.; Bohrer, G.; Gough, C.M.; et al. Interannual and spatial impacts of phenological transitions, growing season length, and spring and autumn temperatures on carbon sequestration: A North America flux data synthesis. Glob. Planet Chang. 2012, 92–93, 179–190. [Google Scholar] [CrossRef] [Green Version]
- Rossi, S.; Isabel, N. Bud break responds more strongly to daytime than night-time temperature under asymmetric experimental warming. Glob. Chang. Biol. 2017, 23, 446–454. [Google Scholar] [CrossRef]
- Shen, M.G.; Piao, S.L.; Chen, X.Q.; An, S.; Fu, Y.S.H.; Wang, S.P.; Cong, N.; Janssens, I.A. Strong impacts of daily minimum temperature on the green-up date and summer greenness of the Tibetan Plateau. Glob. Chang. Biol. 2016, 22, 3057–3066. [Google Scholar] [CrossRef]
- Crimmins, T.M.; Crimmins, M.A.; David Bertelsen, C. Complex responses to climate drivers in onset of spring flowering across a semi-arid elevation gradient. J. Ecol. 2010, 98, 1042–1051. [Google Scholar] [CrossRef]
- Julitta, T.; Cremonese, E.; Migliavacca, M.; Colombo, R.; Galvagno, M.; Siniscalco, C.; Rossini, M.; Fava, F.; Cogliati, S.; Morra di Cella, U.; et al. Using digital camera images to analyse snowmelt and phenology of a subalpine grassland. Agric. For. Meteorol. 2014, 198–199, 116–125. [Google Scholar] [CrossRef]
- Wu, X.; Liu, H. Consistent shifts in spring vegetation green-up date across temperate biomes in China, 1982–2006. Glob. Chang. Biol. 2013, 19, 870–880. [Google Scholar] [CrossRef] [PubMed]
- Tao, F.; Yokozawa, M.; Zhang, Z.; Hayashi, Y.; Ishigooka, Y. Land surface phenology dynamics and climate variations in the North East China Transect (NECT), 1982–2000. Int. J. Remote Sens. 2008, 29, 5461–5478. [Google Scholar] [CrossRef]
- Sun, Z.; Wang, Q.; Xiao, Q.; Batkhishig, O.; Watanabe, M. Diverse Responses of Remotely Sensed Grassland Phenology to Interannual Climate Variability over Frozen Ground Regions in Mongolia. Remote Sens. 2014, 7, 360–377. [Google Scholar] [CrossRef] [Green Version]
- Guo, J.; Yang, X.; Chen, F.; Niu, J.; Luo, S.; Zhang, M.; Jin, Y.; Shen, G.; Chen, A.; Xing, X.; et al. Examining Relationships between Heat Requirement of Remotely Sensed Green-Up Date and Meteorological Indicators in the Hulun Buir Grassland. Remote Sens. 2021, 13, 1044. [Google Scholar] [CrossRef]
- Wang, C.; Chen, J.; Wu, J.; Tang, Y.H.; Shi, P.J.; Black, T.A.; Zhu, K. A snow-free vegetation index for improved monitoring of vegetation spring green-up date in deciduous ecosystems. Remote Sens. Environ. 2017, 196, 1–12. [Google Scholar] [CrossRef]
- He, J.; Yang, K.; Tang, W.; Lu, H.; Qin, J.; Chen, Y.; Li, X. The first high-resolution meteorological forcing dataset for land process studies over China. Sci. Data 2020, 7, 25. [Google Scholar] [CrossRef] [Green Version]
- Mann, H.B. Nonparametric tests against trend. Econometrica 1945, 45, 245–259. [Google Scholar] [CrossRef]
- Kendall, M.G. Rank Correlation Methods; Griffin: London, UK, 1948. [Google Scholar] [CrossRef]
- Sen, P.K. Estimates of the Regression Coefficient Based on Kendall’s Tau. J. Am. Stat. Assoc. 1968, 63, 1379–1389. [Google Scholar] [CrossRef]
- Zhang, D.; Geng, X.; Chen, W.; Fang, L.; Yao, R.; Wang, X.; Zhou, X. Inconsistency of Global Vegetation Dynamics Driven by Climate Change: Evidences from Spatial Regression. Remote Sens. 2021, 13, 3442. [Google Scholar] [CrossRef]
- Nouri, M.; Homaee, M. Spatiotemporal changes of snow metrics in mountainous data-scarce areas using reanalyses. J. Hydrol. 2021, 603, 126858. [Google Scholar] [CrossRef]
- Ruan, Y.; Zhang, X.; Xin, Q.; Qiu, Y.; Sun, Y. Prediction and Analysis of Lake Ice Phenology Dynamics Under Future Climate Scenarios Across the Inner Tibetan Plateau. J. Geophys. Res. Atmos. 2020, 125, e2020JD033082. [Google Scholar] [CrossRef]
- Fu, Y.H.; Zhou, X.; Li, X.; Zhang, Y.; Geng, X.; Hao, F.; Zhang, X.; Hanninen, H.; Guo, Y.; De Boeck, H.J.; et al. Decreasing control of precipitation on grassland spring phenology in temperate China. Glob. Ecol. Biogeogr. 2020, 30, 490–499. [Google Scholar] [CrossRef]
- Fu, Y.H.; Piao, S.; Vitasse, Y.; Zhao, H.; De Boeck, H.J.; Liu, Q.; Yang, H.; Weber, U.; Hanninen, H.; Janssens, I.A. Increased heat requirement for leaf flushing in temperate woody species over 1980-2012: Effects of chilling, precipitation and insolation. Glob. Chang. Biol. 2015, 21, 2687–2697. [Google Scholar] [CrossRef]
- Shen, M.; Cong, N.; Cao, R. Temperature sensitivity as an explanation of the latitudinal pattern of green-up date trend in Northern Hemisphere vegetation during 1982-2008. Int. J. Climatol. 2015, 35, 3707–3712. [Google Scholar] [CrossRef]
- Peng, S.; Piao, S.; Ciais, P.; Myneni, R.B.; Chen, A.; Chevallier, F.; Dolman, A.J.; Janssens, I.A.; Penuelas, J.; Zhang, G.; et al. Asymmetric effects of daytime and night-time warming on Northern Hemisphere vegetation. Nature 2013, 501, 88–92. [Google Scholar] [CrossRef]
- Price, M.V.; Waser, N.M. Effects of experimental warming on plant reproductive phenology in a subalpine meadow. Ecology 1998, 79, 1261–1271. [Google Scholar] [CrossRef]
- Dunne, J.A.; Harte, J.; Taylor, K.J. Subalpine meadow flowering phenology responses to climate change: Integrating experimental and gradient methods. Ecol. Monogr. 2003, 73, 69–86. [Google Scholar] [CrossRef]
- Root, T.L.; Price, J.T.; Hall, K.R.; Schneider, S.H.; Rosenzweig, C.; Pounds, J.A. Fingerprints of global warming on wild animals and plants. Nature 2003, 421, 57–60. [Google Scholar] [CrossRef]
- Williams, A.P.; Allen, C.D.; Macalady, A.K.; Griffin, D.; Woodhouse, C.A.; Meko, D.M.; Swetnam, T.W.; Rauscher, S.A.; Seager, R.; Grissino-Mayer, H.D.; et al. Temperature as a potent driver of regional forest drought stress and tree mortality. Nat. Clim. Chang. 2013, 3, 292–297. [Google Scholar] [CrossRef]
- Beier, C.; Emmett, B.; Gundersen, P.; Tietema, A.; Penuelas, J.; Estiarte, M.; Gordon, C.; Gorissen, A.; Llorens, L.; Roda, F.; et al. Novel approaches to study climate change effects on terrestrial ecosystems in the field: Drought and passive nighttime warming. Ecosystems 2004, 7, 583–597. [Google Scholar] [CrossRef]
- Wan, S.; Xia, J.; Liu, W.; Niu, S. Photosynthetic overcompensation under nocturnal warming enhances grassland carbon sequestration. Ecology 2009, 90, 2700–2710. [Google Scholar] [CrossRef] [PubMed] [Green Version]
- Piao, S.L.; Friedlingstein, P.; Ciais, P.; Viovy, N.; Demarty, J. Growing season extension and its impact on terrestrial carbon cycle in the Northern Hemisphere over the past 2 decades. Glob. Biogeochem. Cycles 2007, 21, GB3018. [Google Scholar] [CrossRef]
- Tucker, C.J.; Slayback, D.A.; Pinzon, J.E.; Los, S.O.; Myneni, R.B.; Taylor, M.G. Higher northern latitude normalized difference vegetation index and growing season trends from 1982 to 1999. Int. J. Biometeorol. 2001, 45, 184–190. [Google Scholar] [CrossRef] [PubMed]


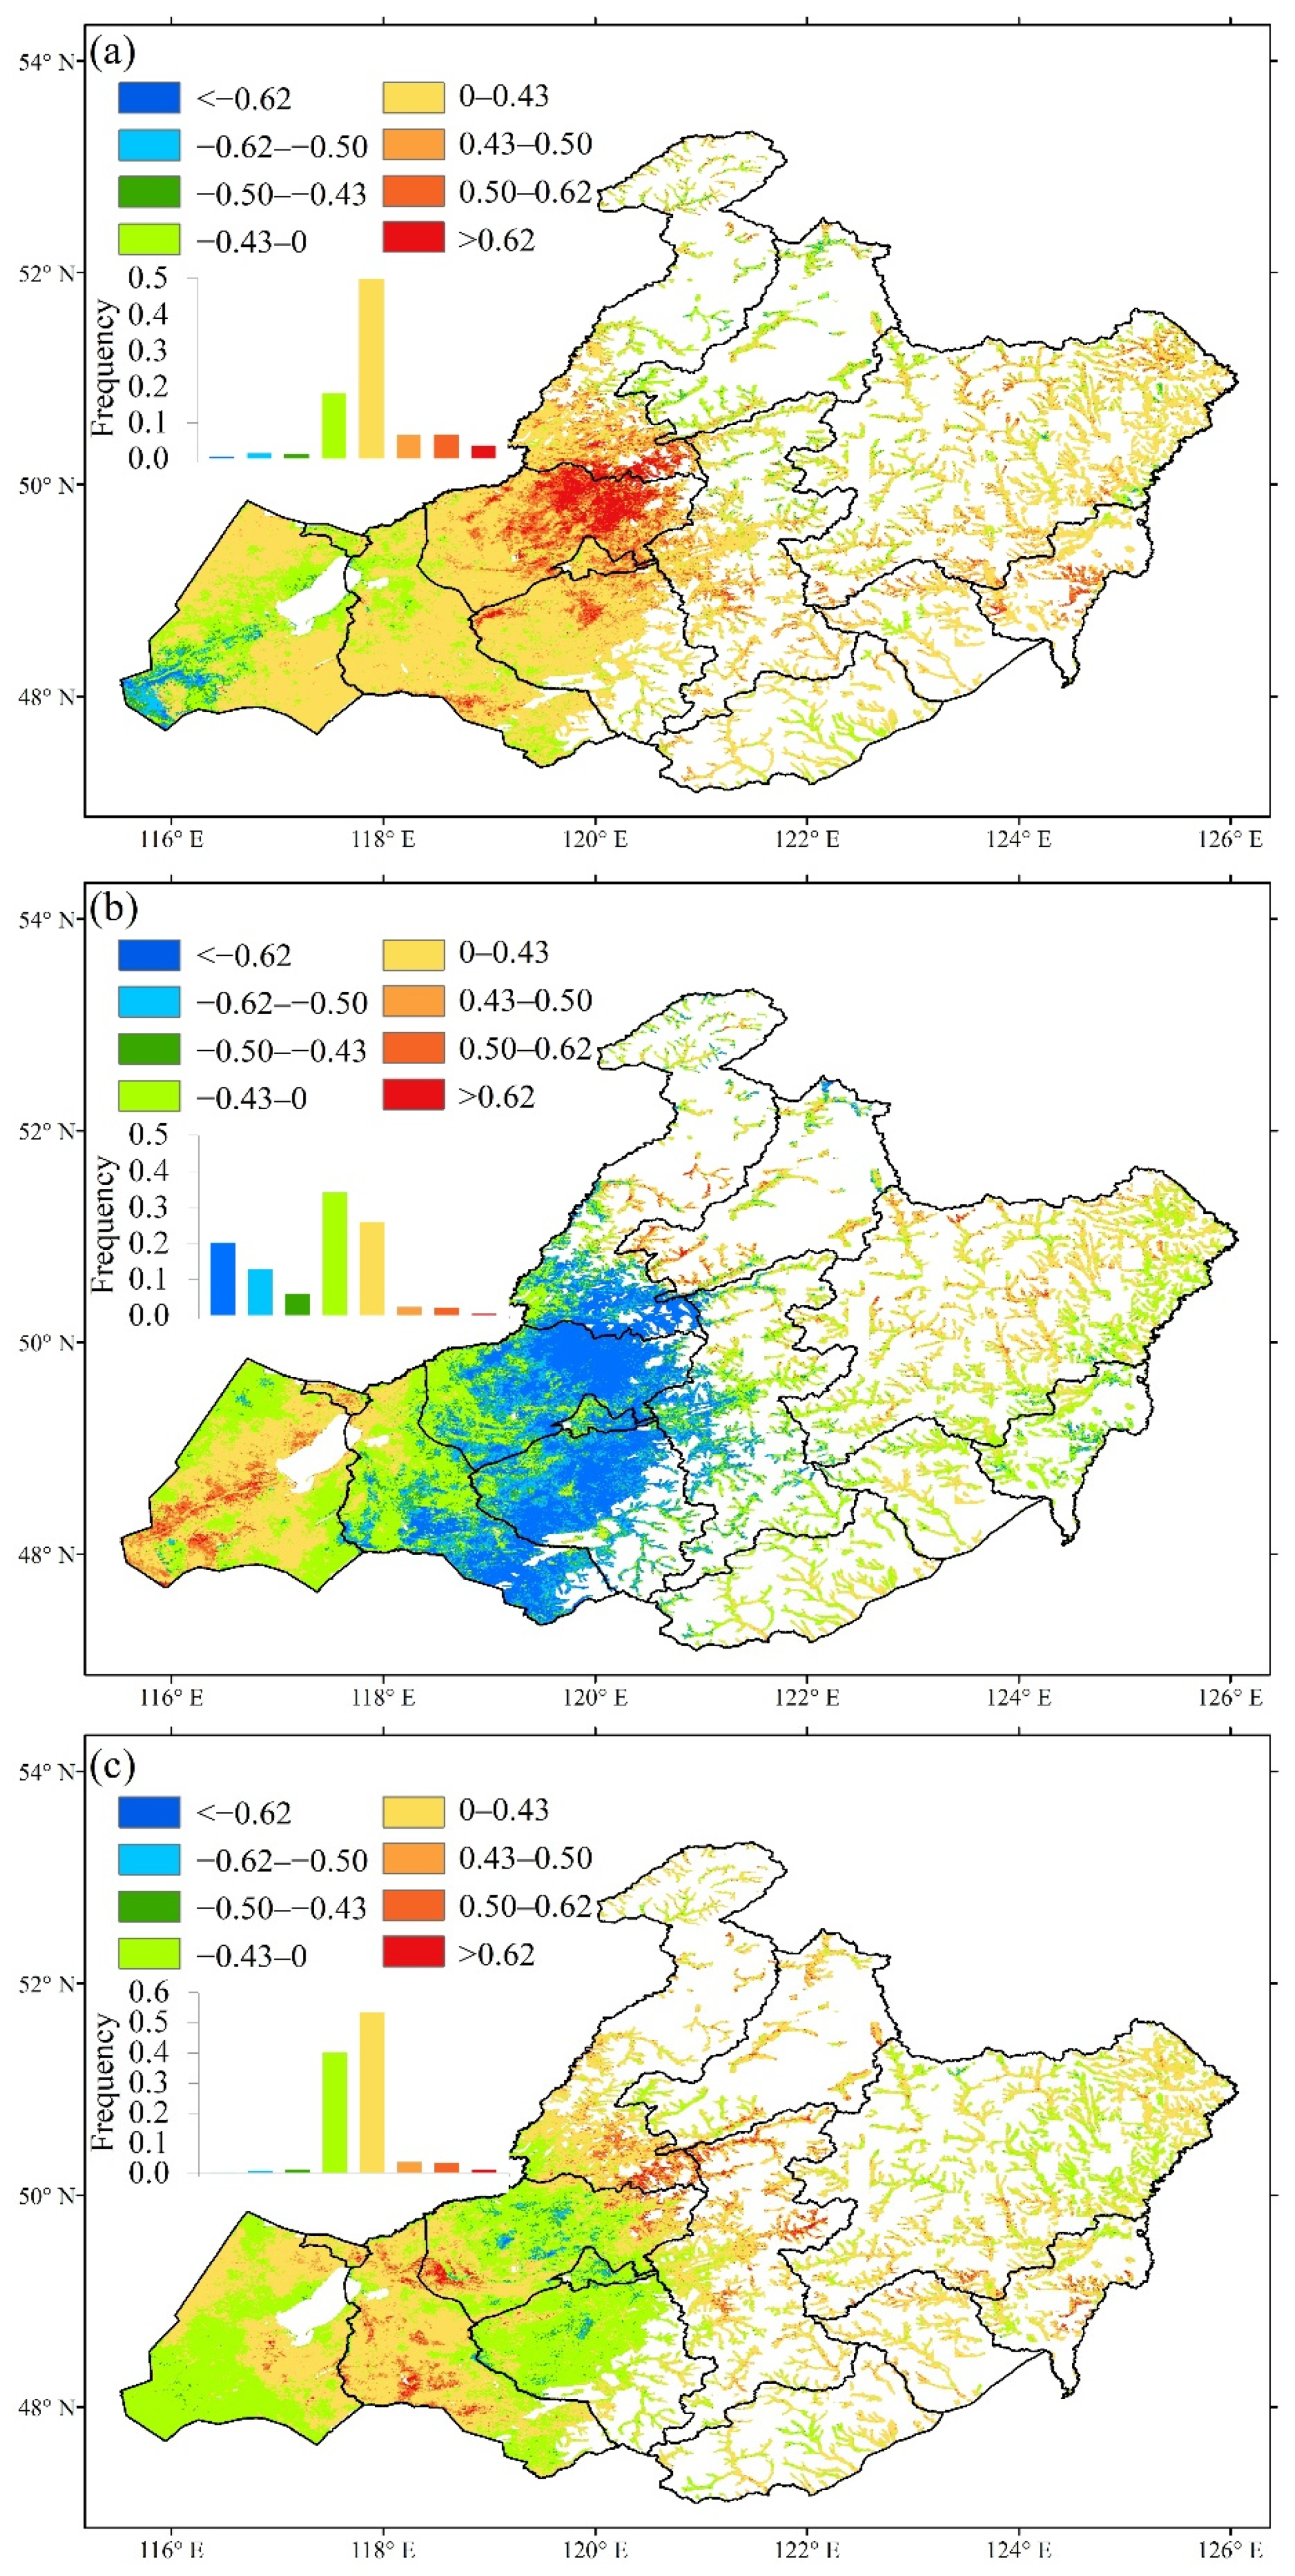
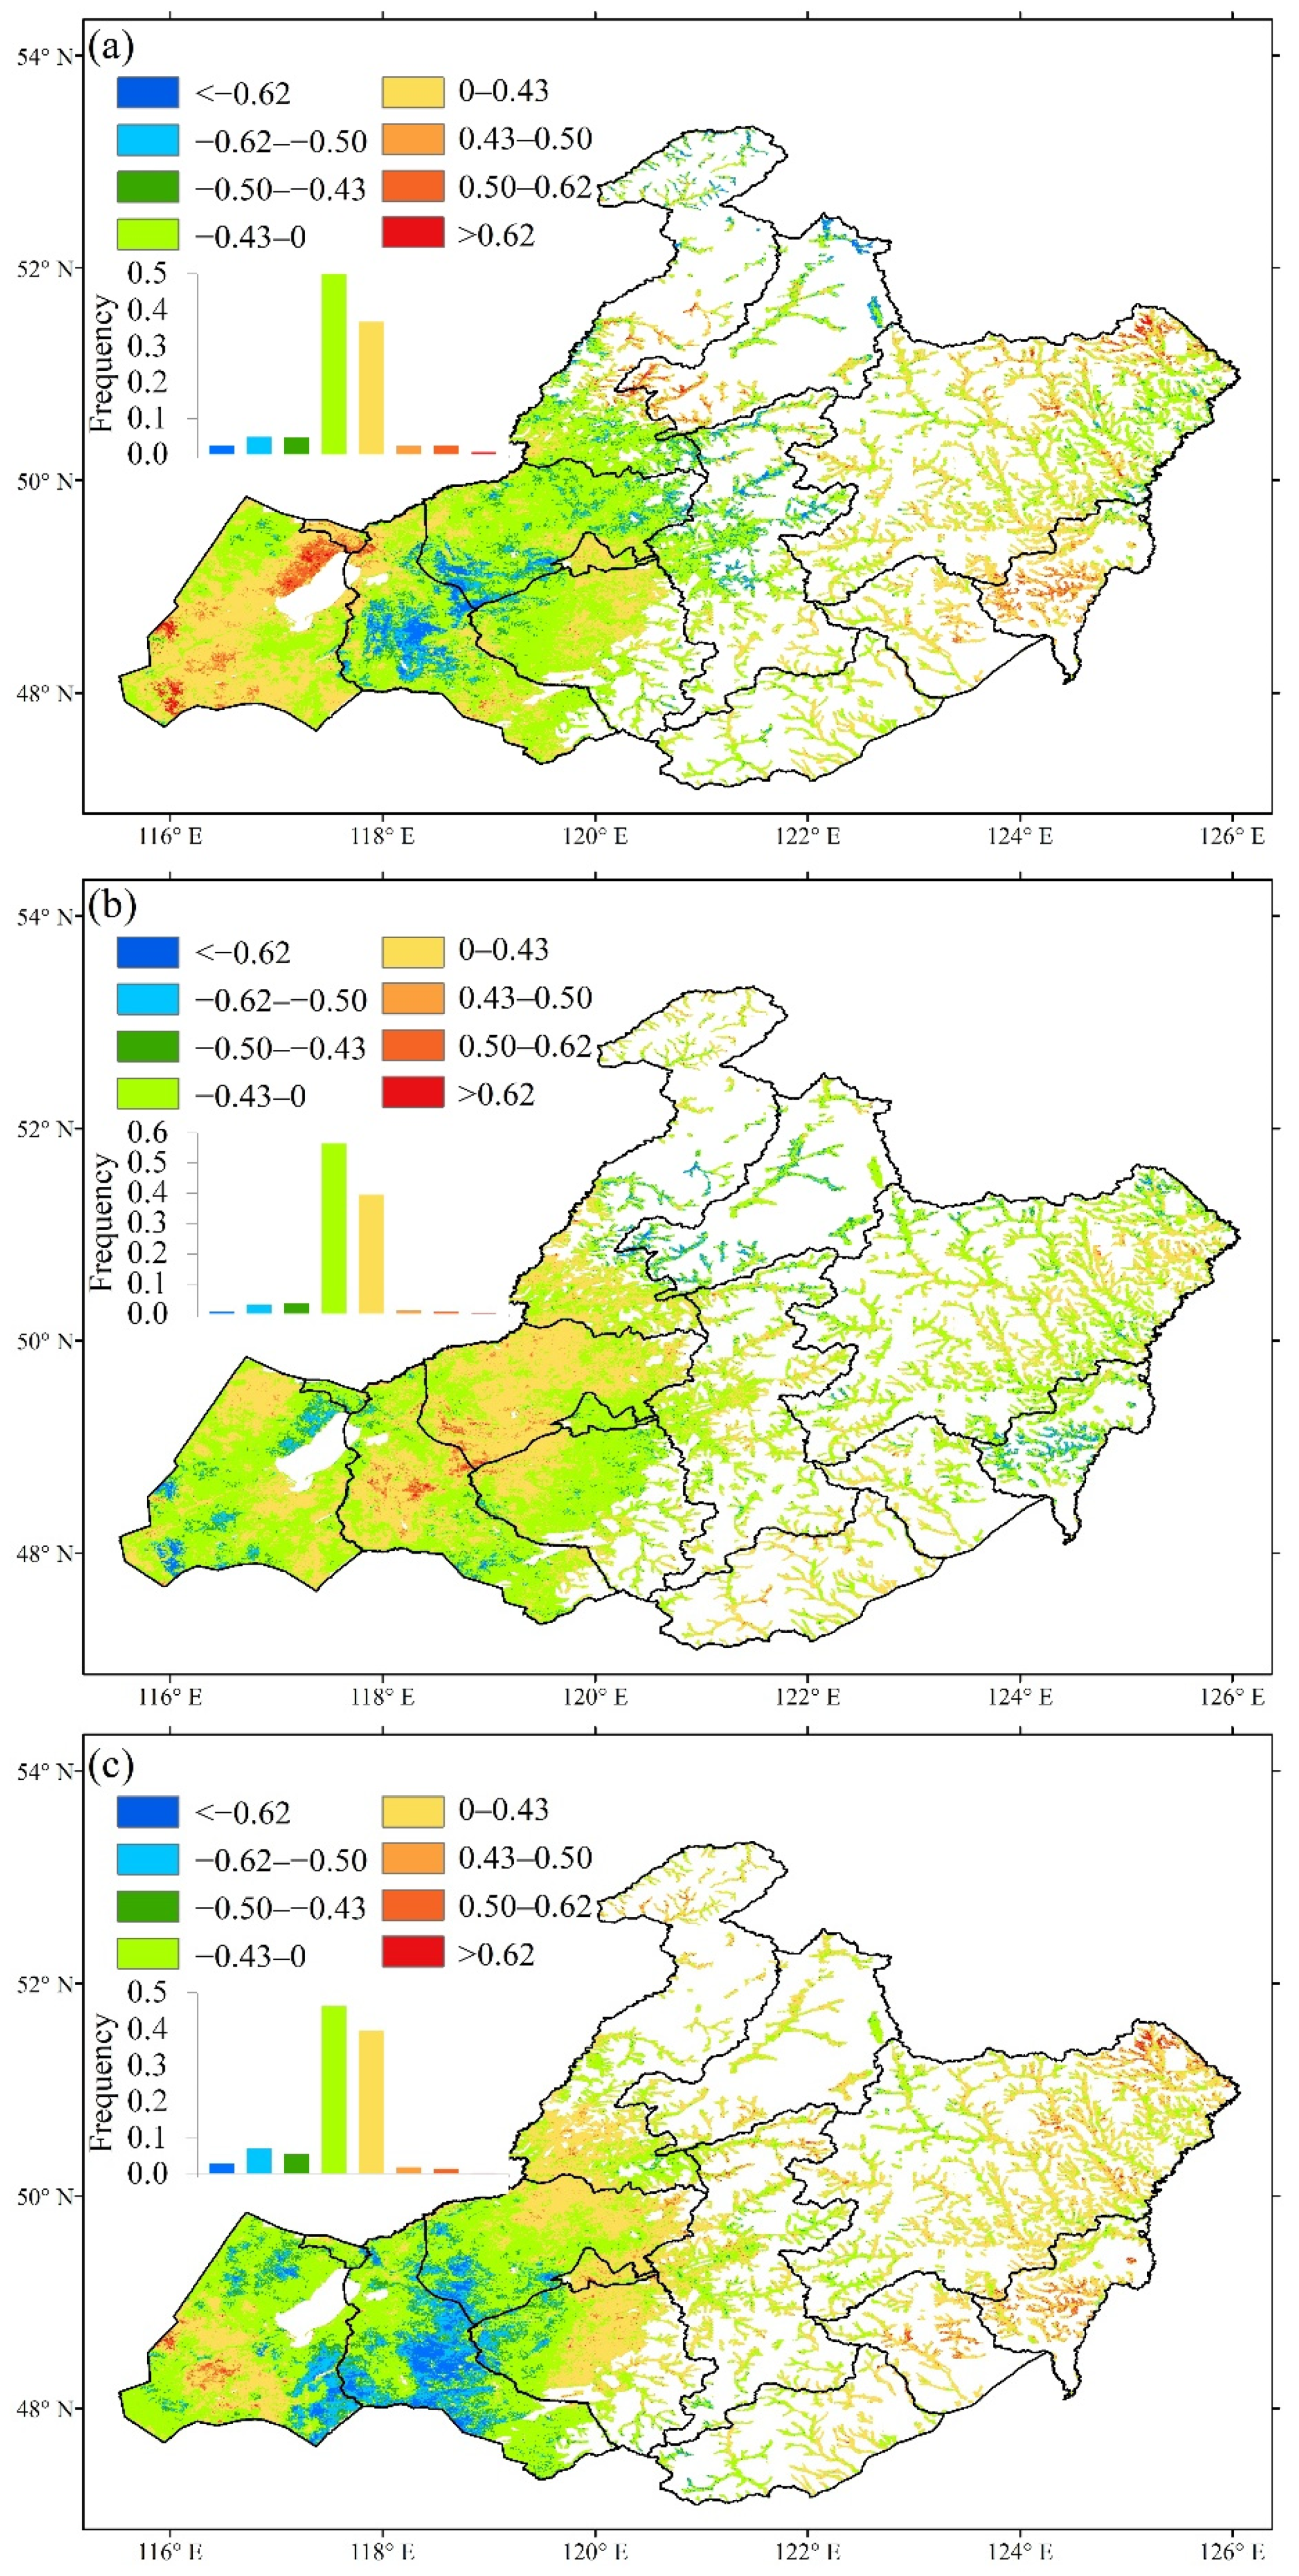
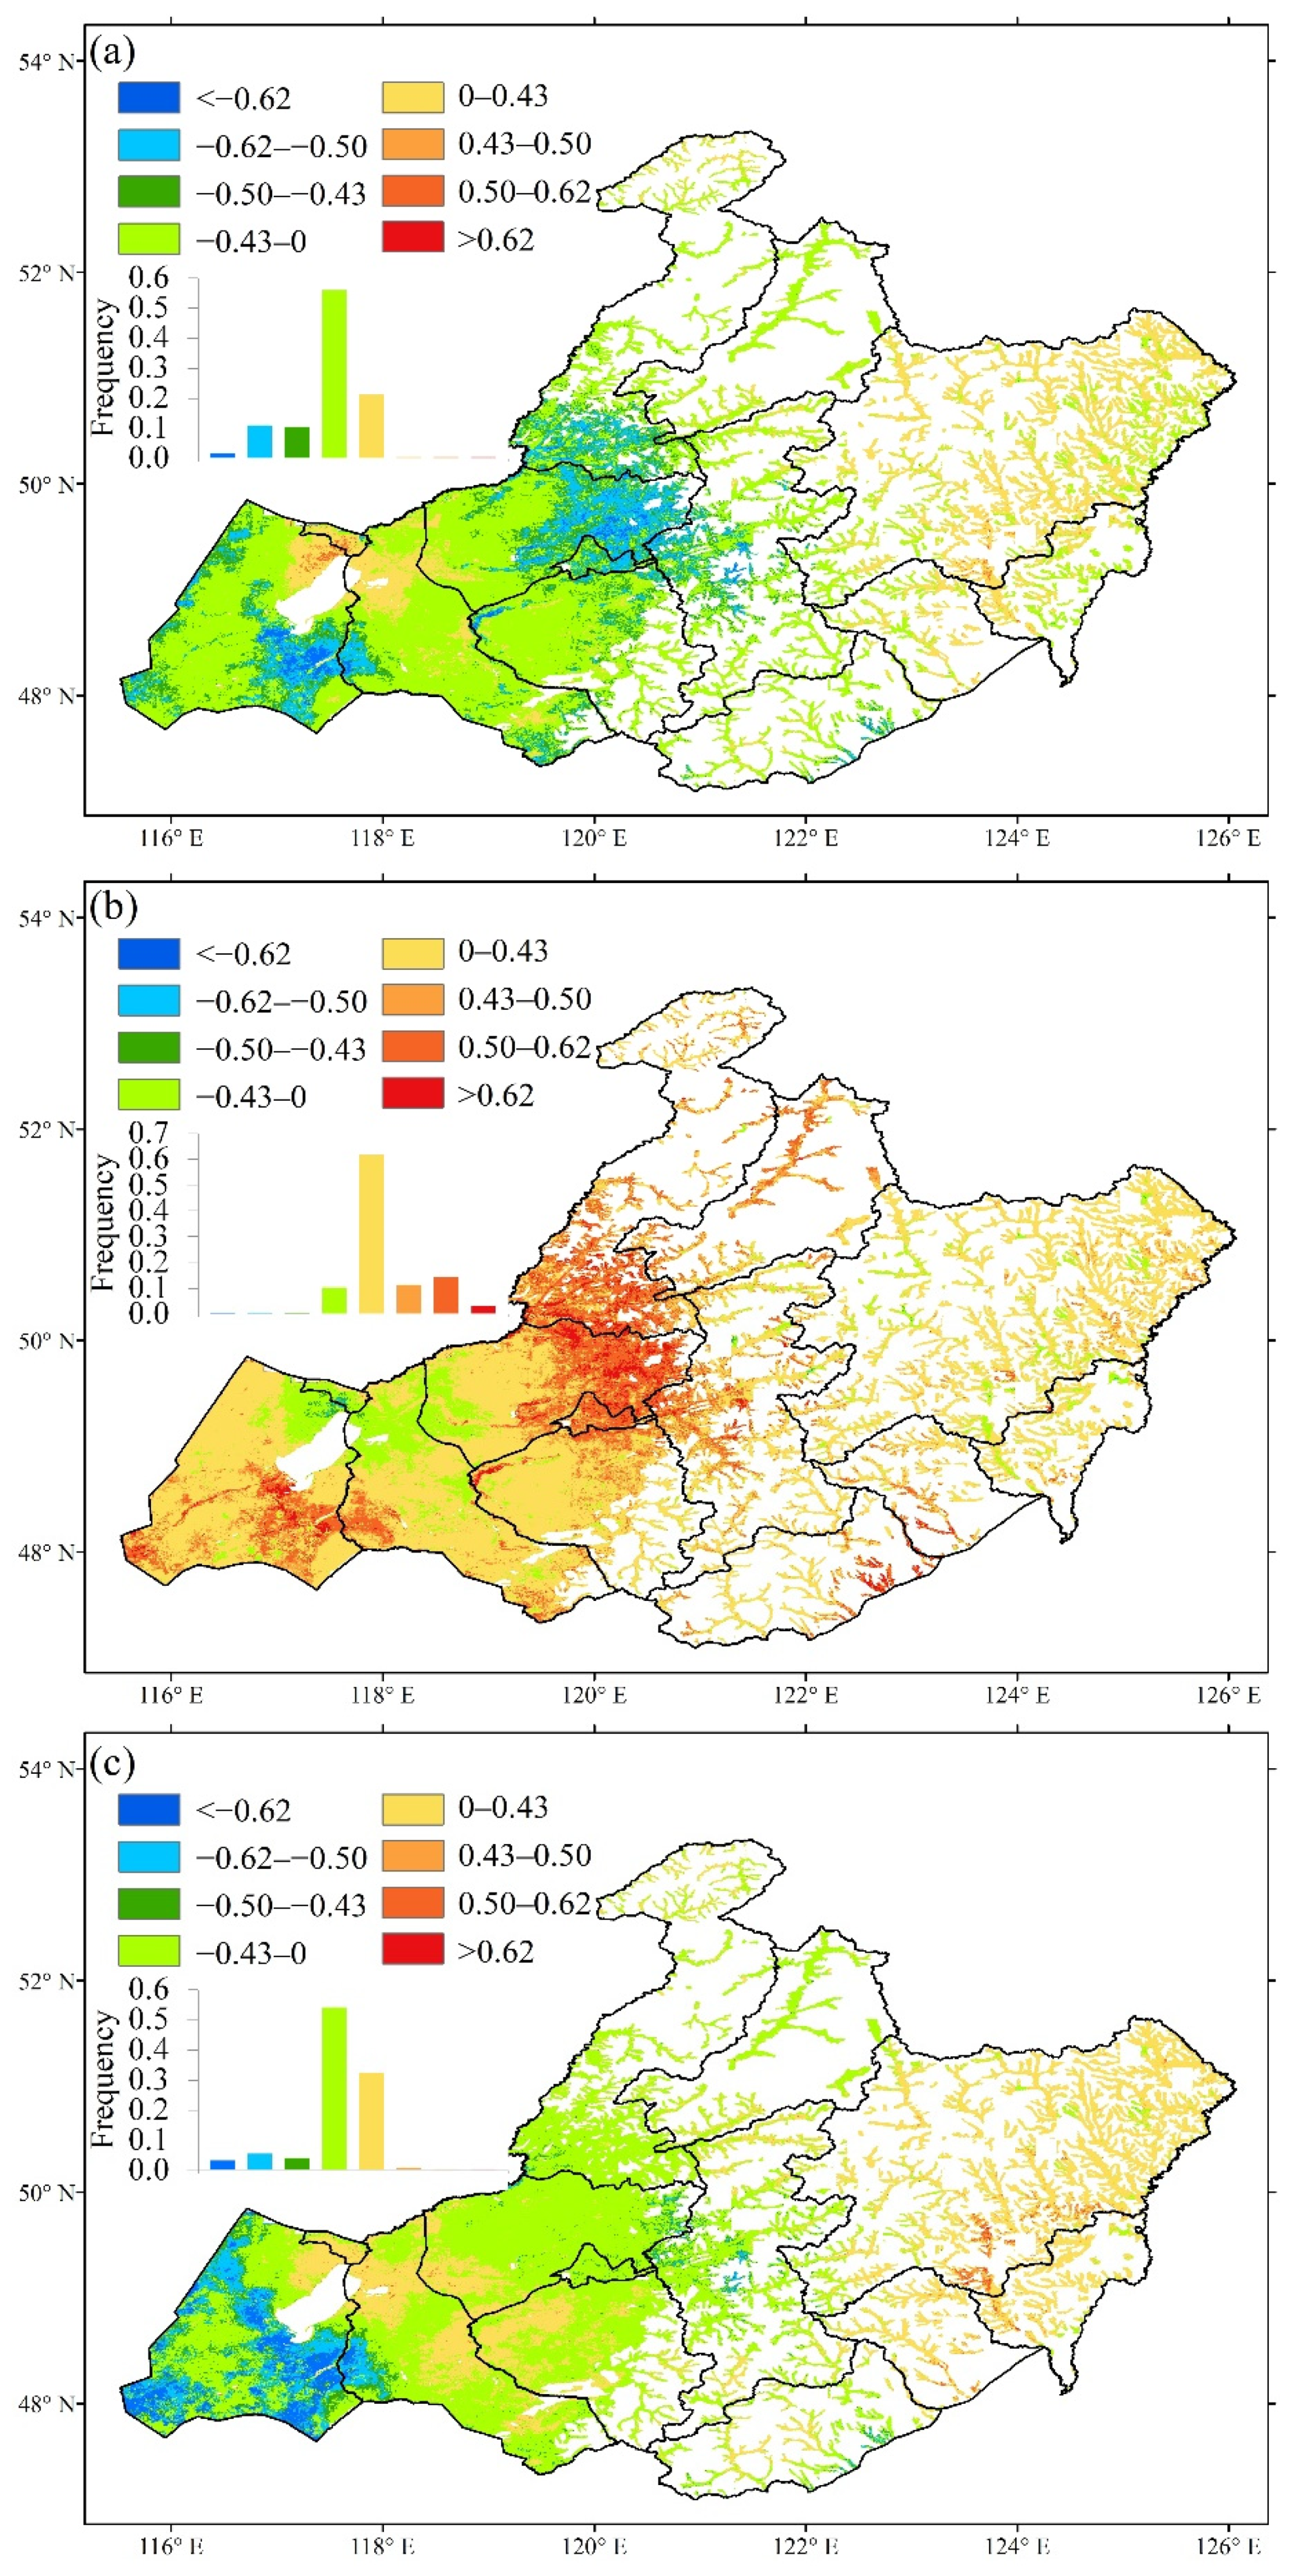
| Partial Correlation in Winter | Significant Negative (p < 0.05) | Significant Positive (p < 0.05) | Non-Significant Negative (p > 0.05) | Non-Significant Positive (p > 0.05) | |
|---|---|---|---|---|---|
| GUD and Tmax | TS | 4.5 | 4.6 | 49 | 41.9 |
| TMS | 33.9 | 1.1 | 51.3 | 13.7 | |
| UM | 46.6 | 0.3 | 40.7 | 12.4 | |
| LM | 13.3 | 2.9 | 50.4 | 33.4 | |
| study area | 13.7 | 3.3 | 49.5 | 33.5 | |
| GUD and Tmin | TS | 3.5 | 1.5 | 51.4 | 43.6 |
| TMS | 0.9 | 13.8 | 28.6 | 56.7 | |
| UM | 0.3 | 19.2 | 16 | 64.5 | |
| LM | 2.3 | 9.2 | 35.1 | 53.4 | |
| study area | 2.6 | 7.2 | 39.8 | 50.4 | |
| GUD and precipitation | TS | 0.3 | 4.9 | 38.4 | 56.4 |
| TMS | 1.3 | 9.2 | 33.3 | 56.2 | |
| UM | 1.7 | 2.4 | 29.4 | 66.5 | |
| LM | 7 | 2.2 | 57.8 | 33 | |
| study area | 3.6 | 4.1 | 46.3 | 46 | |
| Partial Correlation in Spring | Significant Negative (p < 0.05) | Significant Positive (p < 0.05) | Non-Significant Negative (p > 0.05) | Non-Significant Positive (p > 0.05) | |
|---|---|---|---|---|---|
| GUD and Tmax | TS | 0.8 | 3.4 | 50 | 45.8 |
| TMS | 14 | 1.5 | 60.6 | 23.9 | |
| UM | 26.2 | 0.9 | 53.7 | 19.2 | |
| LM | 9.6 | 3 | 55.4 | 32 | |
| study area | 7.5 | 3.1 | 53.7 | 35.7 | |
| GUD and Tmin | TS | 5 | 0.6 | 61.9 | 32.5 |
| TMS | 5 | 0.5 | 60 | 34.5 | |
| UM | 0.8 | 2.3 | 45.3 | 51.6 | |
| LM | 3.1 | 3.7 | 44.5 | 48.7 | |
| study area | 4.2 | 2.1 | 52.8 | 40.9 | |
| GUD and precipitation | TS | 18.3 | 0.1 | 66.6 | 15 |
| TMS | 0.2 | 0.2 | 57.2 | 42.4 | |
| UM | 0.3 | 1 | 59.7 | 39 | |
| LM | 3.1 | 0.5 | 36.6 | 59.8 | |
| study area | 8.3 | 0.3 | 50.7 | 40.7 | |
| Partial Correlation in March | Significant Negative (p < 0.05) | Significant Positive (p < 0.05) | Non-Significant Negative (p > 0.05) | Non-Significant Positive (p > 0.05) | |
|---|---|---|---|---|---|
| GUD and Tmax | TS | 3.2 | 3.7 | 21.3 | 71.8 |
| TMS | 0.1 | 25.3 | 8 | 66.6 | |
| UM | 0.3 | 33.1 | 4.3 | 62.3 | |
| LM | 1.5 | 8.2 | 21.1 | 69.2 | |
| study area | 1.9 | 10 | 18.9 | 69.2 | |
| GUD and Tmin | TS | 27.3 | 3.1 | 41 | 28.6 |
| TMS | 73.9 | 0.3 | 20.8 | 5 | |
| UM | 65.9 | 0.2 | 27.6 | 6.3 | |
| LM | 22.1 | 2.9 | 41.2 | 33.9 | |
| study area | 31.9 | 2.5 | 38.4 | 27.2 | |
| GUD and precipitation | TS | 0.8 | 3.4 | 46.5 | 49.3 |
| TMS | 1.9 | 4.5 | 52.2 | 41.4 | |
| UM | 1.1 | 9.1 | 28.5 | 61.3 | |
| LM | 0.6 | 4.6 | 32.5 | 62.2 | |
| study area | 0.9 | 4.4 | 39.8 | 54.9 | |
| Partial Correlation in April | Significant Negative (p < 0.05) | Significant Positive (p < 0.05) | Non-Significant Negative (p > 0.05) | Non-Significant Positive (p > 0.05) | |
|---|---|---|---|---|---|
| GUD and Tmax | TS | 9.1 | 3.7 | 50.4 | 36.8 |
| TMS | 4.1 | 0.8 | 68.1 | 27 | |
| UM | 11.7 | 0.8 | 65.4 | 22 | |
| LM | 6.5 | 3 | 50 | 40.5 | |
| study area | 7.2 | 3 | 52.6 | 37.2 | |
| GUD and Tmin | TS | 3.5 | 1.2 | 53 | 42.3 |
| TMS | 1.6 | 0.1 | 59.8 | 38.5 | |
| UM | 1.5 | 0.3 | 59.4 | 38.8 | |
| LM | 3.9 | 0.6 | 59.1 | 36.4 | |
| study area | 3.6 | 0.7 | 57.1 | 38.6 | |
| GUD and precipitation | TS | 21.7 | 0.8 | 61.9 | 15.6 |
| TMS | 2.1 | 0.7 | 49.3 | 47.9 | |
| UM | 0.2 | 1.6 | 35.7 | 62.4 | |
| LM | 3.3 | 2.3 | 41.6 | 52.8 | |
| study area | 0.4 | 1.7 | 49.2 | 39.7 | |
| Partial Correlation in May | Significant Negative (p < 0.05) | Significant Positive (p < 0.05) | Non-Significant Negative (p > 0.05) | Non-Significant Positive (p > 0.05) | |
|---|---|---|---|---|---|
| GUD and Tmax | TS | 11.1 | 0.3 | 77.6 | 11 |
| TMS | 22.3 | 0.1 | 70.1 | 7.5 | |
| UM | 44.5 | 0 | 44.4 | 11.1 | |
| LM | 8.2 | 0.1 | 59.6 | 32.2 | |
| study area | 12.3 | 0.2 | 66.2 | 21.3 | |
| GUD and Tmin | TS | 0.2 | 9.3 | 16.2 | 74.3 |
| TMS | 0.1 | 32.7 | 5.5 | 61.7 | |
| UM | 0 | 51.8 | 1.7 | 46.5 | |
| LM | 0 | 16.2 | 75.8 | 16.2 | |
| study area | 0.1 | 17.1 | 10.2 | 72.6 | |
| GUD and precipitation | TS | 19.4 | 0.1 | 57.9 | 22.6 |
| TMS | 0.6 | 0.2 | 84 | 15.2 | |
| UM | 2.2 | 0.2 | 77.1 | 20.5 | |
| LM | 3.6 | 0.7 | 51.1 | 44.5 | |
| study area | 8.6 | 0.4 | 57.9 | 33.1 | |
| Sensitivity of GUD to Meteorological Indicators 1 | Significant Negative (p < 0.05) | Significant Positive (p < 0.05) | |
|---|---|---|---|
| winter | GUD to Tmax | −0.09 | 0.02 |
| GUD to Tmin | −0.01 | 0.00 | |
| GUD to precipitation | −0.11 | 0.36 | |
| spring | GUD to Tmax | −0.07 | 0.02 |
| GUD to Tmin | −0.06 | 0.02 | |
| GUD to precipitation | −0.41 | 0.51 | |
| Sensitivity of GUD to Meteorological Indicators 1 | Significant Negative (p < 0.05) | Significant Positive (p < 0.05) | |
|---|---|---|---|
| March | GUD to Tmax | −0.09 | 0.01 |
| GUD to Tmin | −0.17 | 0.03 | |
| GUD to precipitation | −0.07 | 0.20 | |
| April | GUD to Tmax | −0.09 | 0.02 |
| GUD to Tmin | −0.02 | 0.00 | |
| GUD to precipitation | −0.32 | 0.11 | |
| May | GUD to Tmax | −0.01 | 0.01 |
| GUD to Tmin | −0.01 | 0.02 | |
| GUD to precipitation | −0.17 | 0.18 | |
| Sensitivity of GUD to Meteorological Indicators 1 | Significant Negative (p < 0.05) | Significant Positive (p < 0.05) | |
|---|---|---|---|
| Winter | GUD to Tmax | −0.11 | 0.04 |
| GUD to Tmin | −0.01 | 0.00 | |
| GUD to precipitation | −0.28 | 0.35 | |
| Spring | GUD to Tmax | −0.12 | 0.02 |
| GUD to Tmin | −0.08 | −0.02 | |
| GUD to precipitation | −0.11 | 0.72 | |
| Sensitivity of GUD to Meteorological Indicators 1 | Significant Negative (p < 0.05) | Significant Positive (p < 0.05) | |
|---|---|---|---|
| March | GUD to Tmax | −0.37 | −0.03 |
| GUD to Tmin | −0.15 | 0.09 | |
| GUD to precipitation | −0.04 | 0.30 | |
| April | GUD to Tmax | −0.18 | 0.02 |
| GUD to Tmin | −0.07 | −0.02 | |
| GUD to precipitation | −0.24 | 0.66 | |
| May | GUD to Tmax | −0.01 | 0.01 |
| GUD to Tmin | −0.01 | 0.03 | |
| GUD to precipitation | −0.14 | −0.10 | |
| Sensitivity of GUD to Meteorological Indicators 1 | Significant Negative (p < 0.05) | Significant Positive (p < 0.05) | |
|---|---|---|---|
| winter | GUD to Tmax | −0.10 | 0.03 |
| GUD to Tmin | −0.04 | 0.00 | |
| GUD to precipitation | −0.34 | 0.39 | |
| spring | GUD to Tmax | −0.14 | 0.03 |
| GUD to Tmin | −0.04 | 0.00 | |
| GUD to precipitation | - | 1.00 | |
| Sensitivity of GUD to Meteorological Indicators 1 | Significant Negative (p < 0.05) | Significant Positive (p < 0.05) | |
|---|---|---|---|
| March | GUD to Tmax | −0.21 | 0.02 |
| GUD to Tmin | −0.13 | 0.10 | |
| GUD to precipitation | −0.05 | 0.35 | |
| April | GUD to Tmax | −0.22 | 0.02 |
| GUD to Tmin | −0.04 | 0.01 | |
| GUD to precipitation | −0.17 | 1.03 | |
| May | GUD to Tmax | −0.02 | 0.02 |
| GUD to Tmin | - | 0.03 | |
| GUD to precipitation | −0.02 | 0.36 | |
| Sensitivity of GUD to Meteorological Indicators 1 | Significant Negative (p < 0.05) | Significant Positive (p < 0.05) | |
|---|---|---|---|
| winter | GUD to Tmax | −0.09 | 0.04 |
| GUD to Tmin | −0.02 | 0.04 | |
| GUD to precipitation | −0.40 | 0.33 | |
| spring | GUD to Tmax | −0.10 | 0.03 |
| GUD to Tmin | −0.04 | 0.02 | |
| GUD to precipitation | −0.20 | 0.40 | |
| Sensitivity of GUD to Meteorological Indicators 1 | Significant Negative (p < 0.05) | Significant Positive (p < 0.05) | |
|---|---|---|---|
| March | GUD to Tmax | −0.20 | 0.09 |
| GUD to Tmin | −0.14 | 0.09 | |
| GUD to precipitation | −0.10 | 0.34 | |
| April | GUD to Tmax | −0.16 | 0.04 |
| GUD to Tmin | −0.05 | 0.02 | |
| GUD to precipitation | −0.23 | 0.56 | |
| May | GUD to Tmax | −0.02 | 0.02 |
| GUD to Tmin | −0.02 | 0.02 | |
| GUD to precipitation | −0.08 | 0.28 | |
Publisher’s Note: MDPI stays neutral with regard to jurisdictional claims in published maps and institutional affiliations. |
© 2022 by the authors. Licensee MDPI, Basel, Switzerland. This article is an open access article distributed under the terms and conditions of the Creative Commons Attribution (CC BY) license (https://creativecommons.org/licenses/by/4.0/).
Share and Cite
Guo, J.; Yang, X.; Jiang, W.; Chen, F.; Zhang, M.; Xing, X.; Chen, A.; Yun, P.; Jiang, L.; Yang, D.; et al. Sensitivity of Green-Up Date to Meteorological Indicators in Hulun Buir Grasslands of China. Remote Sens. 2022, 14, 670. https://doi.org/10.3390/rs14030670
Guo J, Yang X, Jiang W, Chen F, Zhang M, Xing X, Chen A, Yun P, Jiang L, Yang D, et al. Sensitivity of Green-Up Date to Meteorological Indicators in Hulun Buir Grasslands of China. Remote Sensing. 2022; 14(3):670. https://doi.org/10.3390/rs14030670
Chicago/Turabian StyleGuo, Jian, Xiuchun Yang, Weiguo Jiang, Fan Chen, Min Zhang, Xiaoyu Xing, Ang Chen, Peng Yun, Liwei Jiang, Dong Yang, and et al. 2022. "Sensitivity of Green-Up Date to Meteorological Indicators in Hulun Buir Grasslands of China" Remote Sensing 14, no. 3: 670. https://doi.org/10.3390/rs14030670
APA StyleGuo, J., Yang, X., Jiang, W., Chen, F., Zhang, M., Xing, X., Chen, A., Yun, P., Jiang, L., Yang, D., & Xu, B. (2022). Sensitivity of Green-Up Date to Meteorological Indicators in Hulun Buir Grasslands of China. Remote Sensing, 14(3), 670. https://doi.org/10.3390/rs14030670


