Article

Spatiotemporal Variations of Aerosols in China during the COVID-19 Pandemic Lockdown

1
College of Geomatics, Shandong University of Science and Technology, Qingdao 266590, China
2
Land Satellite Remote Sensing Application Center, Ministry of Natural Resources, Beijing 100048, China
3
College of Resource Environment and Tourism, Capital Normal University, Beijing 100048, China
4
Institute of Disaster Prevention, College of Ecology and Environment, Langfang 065201, China
*
Author to whom correspondence should be addressed.
Remote Sens. 2022, 14(3), 696; https://doi.org/10.3390/rs14030696
Submission received: 16 December 2021 / Revised: 18 January 2022 / Accepted: 30 January 2022 / Published: 1 February 2022
(This article belongs to the Section Atmospheric Remote Sensing)

Abstract

:
The widespread nature of the coronavirus disease 2019 (COVID-19) pandemic is gradually changing people’s lives and impacting economic development worldwide. Owing to the curtailment of daily activities during the lockdown period, anthropogenic emissions of air pollutants have greatly reduced, and this influence is expected to continue in the foreseeable future. Spatiotemporal variations in aerosol optical depth (AOD) can be used to analyze this influence. In this study, we comprehensively analyzed AOD and NO2 data obtained from satellite remote sensing data inversion. First, data were corrected using Eidetic three-dimensional-long short-term memory to eliminate errors related to sensors and algorithms. Second, taking Hubei Province in China as the experimental area, spatiotemporal variations in AOD and NO2 concentration during the pandemic were analyzed. Finally, based on the results obtained, the impact of the COVID-19 pandemic on human life has been summarized. This work will be of great significance to the formulation of regional epidemic prevention and control policies and the analysis of spatiotemporal changes in aerosols.

1. Introduction

On 31 December 2019, China reported the first instance of coronavirus disease 2019 (COVID-19) to the World Health Organization (WHO), receiving worldwide attention [1,2]. Subsequently, 30 provinces and cities in China, led by Wuhan, started the first-level response to this major public health emergency, and began to strictly control the flow of people in an attempt to avoid potential further hazards [3]. After a concerted effort, COVID-19 in China was controlled by the end of March 2020, and people gradually returned to their normal lives. However, it remains a long-term process to completely control this worldwide pandemic [4]. During the COVID-19 pandemic, a dramatic reduction in human activities and pollutant emissions markedly improved the atmospheric environment, and aerosol optical depth (AOD) showed considerable changes compared with that in the equivalent period in previous years. Analyzing the changes in aerosols and atmospheric pollutants is not only of great significance for the study of global change, human health, and the greenhouse effect, but it also significantly affects the public perception of COVID-19 [5,6,7,8].
Aerosols have clear variation laws on both temporal and spatial scales, closely related to many complex external factors. However, it is difficult to analyze these using only a single variable [9,10]. During the initial COVID-19 lockdown, some external factors were reduced to their lowest possible levels. The spatiotemporal variations in aerosols could better reflect their own temporal and spatial variation laws and changes in human activities [11]. Based on data provided by the National Aeronautics and Space Administration (NASA) in 2019–2020, it was found that during the COVID-19 lockdown period, the AOD of all regions of the world decreased to some extent; for example, the AOD of the Ganges Plain in India declined by 30–40% compared with that of the same period in the previous year, and that of Poland decreased by 10%; similar trends also appeared in Spain, Italy, and other regions of China [12,13,14,15]. Saleem et al. [16] predicted and supplemented the missing AOD value in Moderate-resolution Imaging Spectroradiometer (MODIS) using the extremely randomized trees model, and analyzed the relationship between four meteorological variables and AOD in Europe during the lockdown period from March to June 2020. Li et al. [17,18] analyzed the influence of two meteorological precursors, nitrogen dioxide (NO2) and sulfur dioxide (SO2) and their column-integral concentration in the troposphere, on AOD. Their experimental results showed a positive spatial correlation between these two factors and AOD in most areas of China, indicating that NO2 and SO2 significantly affected the total aerosol concentration by forming secondary organic aerosols. Shi et al. [19,20] first proposed a spatiotemporal prediction network convolutional long short-term memory (ConvLSTM) technique, which captures temporal and spatial feature sequences by an encoding-for-casting structure, thus realizing the prediction of sequence images or videos, and achieving good performance in precipitation prediction. On this basis, Wang et al. [21] proposed the predictive recurrent neural network (PredRNN), which enhanced the spatial information relevance in the original module with the help of spatiotemporal–long short-term memory (ST–LSTM); however, this relied heavily on long-term data, and the gradient easily disappeared during training. Subsequently, Wang et al. [22] systematically analyzed and solved the potential gradient disappearance in PredRNN using the gradient highway units (GHU) unit and achieved good results on MovingMnist. Simultaneously, 3D–Convolutional Neural Networks (3D-CNN) and the Recurrent Neural Network (RNN) were shown to perform well in terms of spatiotemporal prediction. The former mainly extracts short-term local features from images, while the latter mainly extracts long-term sequence features [23,24,25]. Tsinghua and Google jointly proposed an Eidetic three-dimensional (E3D)–LSTM network, which can extract short-term- and long-term-dependent features through 3D-Conv and RNN modules. The test results using several datasets were better than those of the existing network structure [26].
In this study, Hubei Province in China was used as our experimental area, and Himawari-8 satellite images were used as experimental data to analyze the change in AOD during the initial outbreak of COVID-19 and its relationship with human activities. However, two difficulties must be overcome before data analysis: (1) the Himawari-8 AOD algorithm has great uncertainty, and the results of the optimization algorithm of Wang et al. are experimental data [27,28]; (2) the temporal and spatial distribution of aerosol optical depth is influenced by many complex factors such as human activities, temperature, and precipitation [29,30,31,32], the AOD in satellite image acquisition is only one component in the overall change rule, so long-term experimental data are mixed with discontinuous and abnormal values, significantly challenging data analysis. Here, we use E3D-LSTM to predict and analyze the long time-series data, correct the obvious errors in the raster data and make up for disordered missing values. Then, combined with observation data from ground stations, the causes of AOD changes are analyzed, and the impact of the pandemic situation on human society is assessed based on these two factors.

2. Methods and Materials

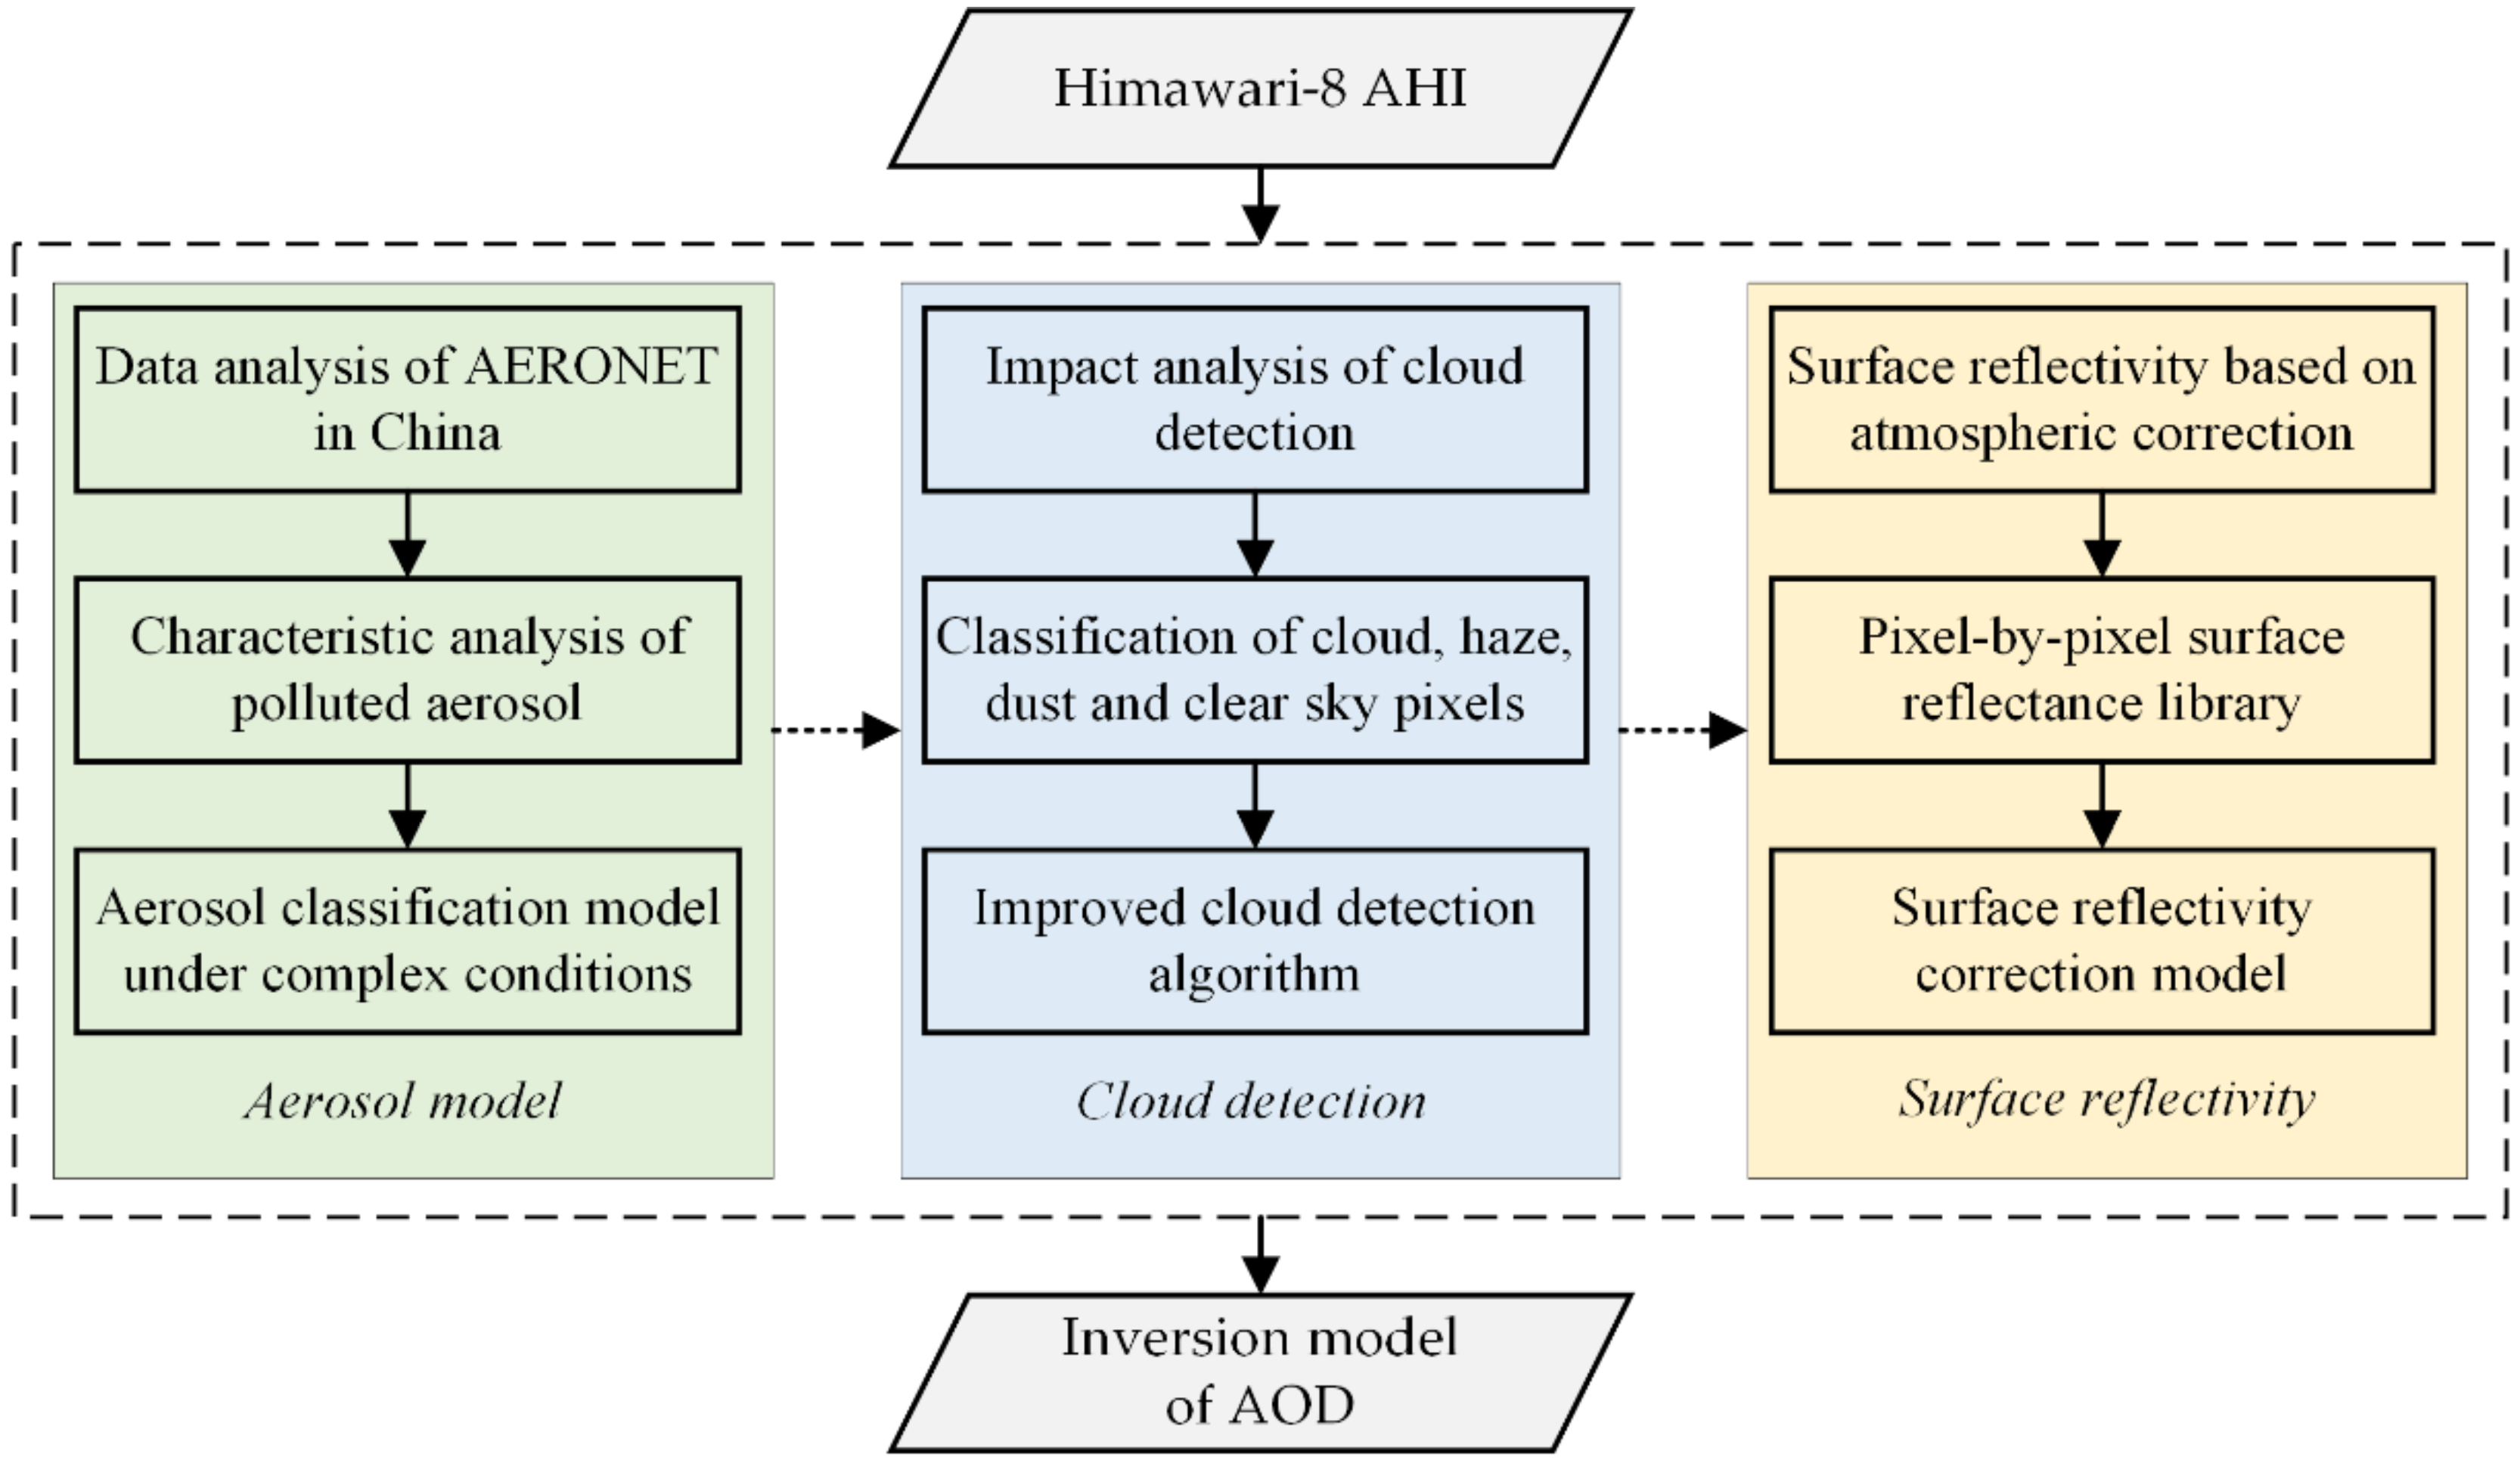
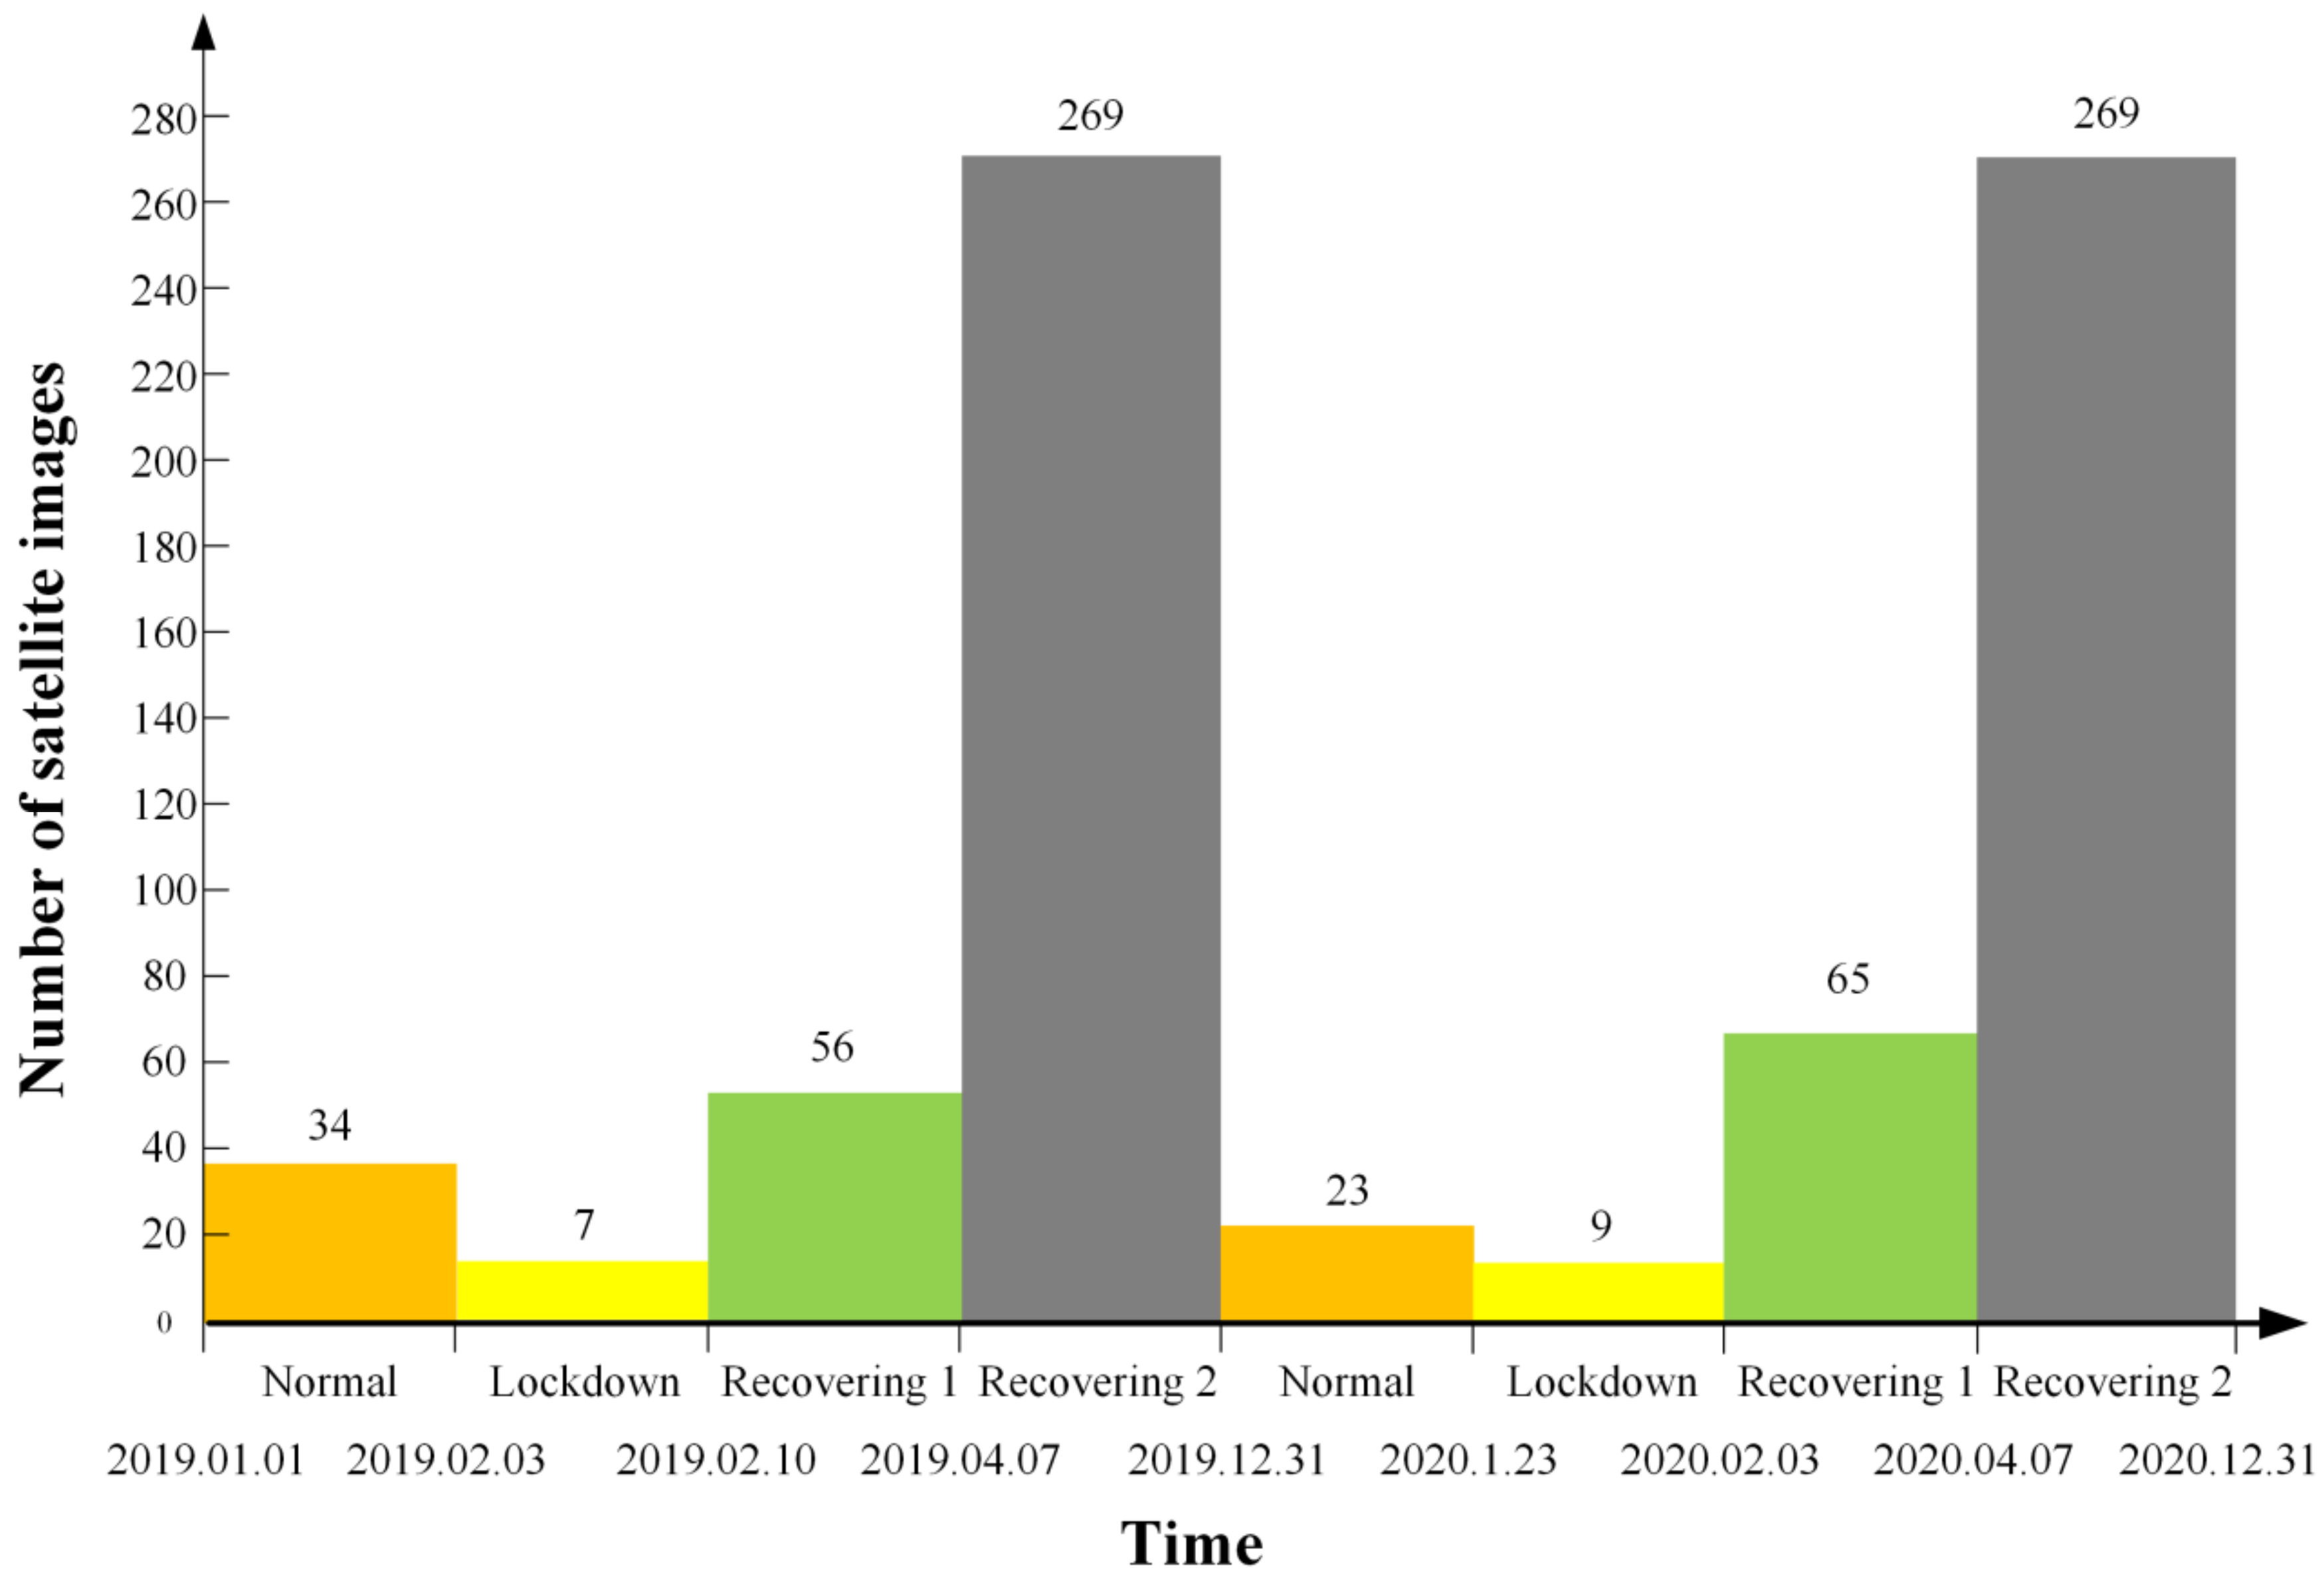
2.1. Retrieval of AOD from Himawari-8 Satellite Data

The Himawari-8 satellite is part of a new generation of geostationary meteorological satellites launched by the Japan Meteorological Agency in October 2014. It mainly covers the Asia-Pacific region, and its main payload is the Advanced Himawari Imager (AHI). It is used to acquire multispectral images with a spatial resolution of 0.5–2 km; it can observe the Asia-Pacific area once every 10 min, and Japan, or another designated area, once every 2.5 min [33]. As shown in Table 1, the AHI has 16 observation channels covering visible light to infrared, and AOD products are constructed using the dark pixel method [34]. However, Himawari-8 AOD products may contain uncertainties due to the following two reasons: (1) the misidentification of clouds and water bodies leads to missing AOD areas; (2) the misclassification of aerosol types leads to inversion errors. Zhao et al. verified the accuracy of Himawari-8 AOD products based on the data of 48 AErosol RObotic NETwork (AERONET) stations in China during 2015–2017. The experimental results showed a strong correlation between the data in most cases. However, there was a certain abnormal value in large AOD values, and there was a clear relationship with the water distribution, which verified the two reasons we summarized [35]. Therefore, we used the methods outlined in references [27,28] to calculate the AOD data for China.
Figure 1 shows the AOD inversion algorithm used in this study. To solve the aforementioned problems, Wang et al. optimized the traditional algorithm in three aspects: the aerosol model, cloud detection, and surface reflectivity [28].
(1) Aerosol model: Based on AERONET (in 3.0 Version) data in China, the apparent reflectance data corresponding to different aerosol types and different AODs were obtained using a radiation transmission simulation. Simultaneously, to reduce computational complexity, look-up tables under six typical conditions (marine, continental, sand, subcontinental, urban industrial, and biomass burning) were established, and aerosol classification models satisfying the required spatiotemporal characteristics and complex conditions were constructed [36].
(2) Cloud detection: Taking the traditional cloud detection algorithm, based on the visible light and near-infrared bands, characteristic pixels that may cause false detection were analyzed to improve the ability of the algorithm to distinguish between categories, and at the same time, avoid the influence of high reflectivity pixels on the inversion accuracy of the dark pixel method.
(3) Surface reflectivity: The traditional dark pixel algorithm is highly dependent on the consistency of surface reflectivity in time and space. The algorithm used in this manuscript is based on MODIS surface reflectivity data (bands 1, 3, and 6) and the mapping relationship between AHI and MODIS sensors, so as to create datasets of surface reflectivity in China during different seasons and different solar heights.
To verify the accuracy of the algorithm used in this manuscript, we refer the reader to the results given in references [27,28].

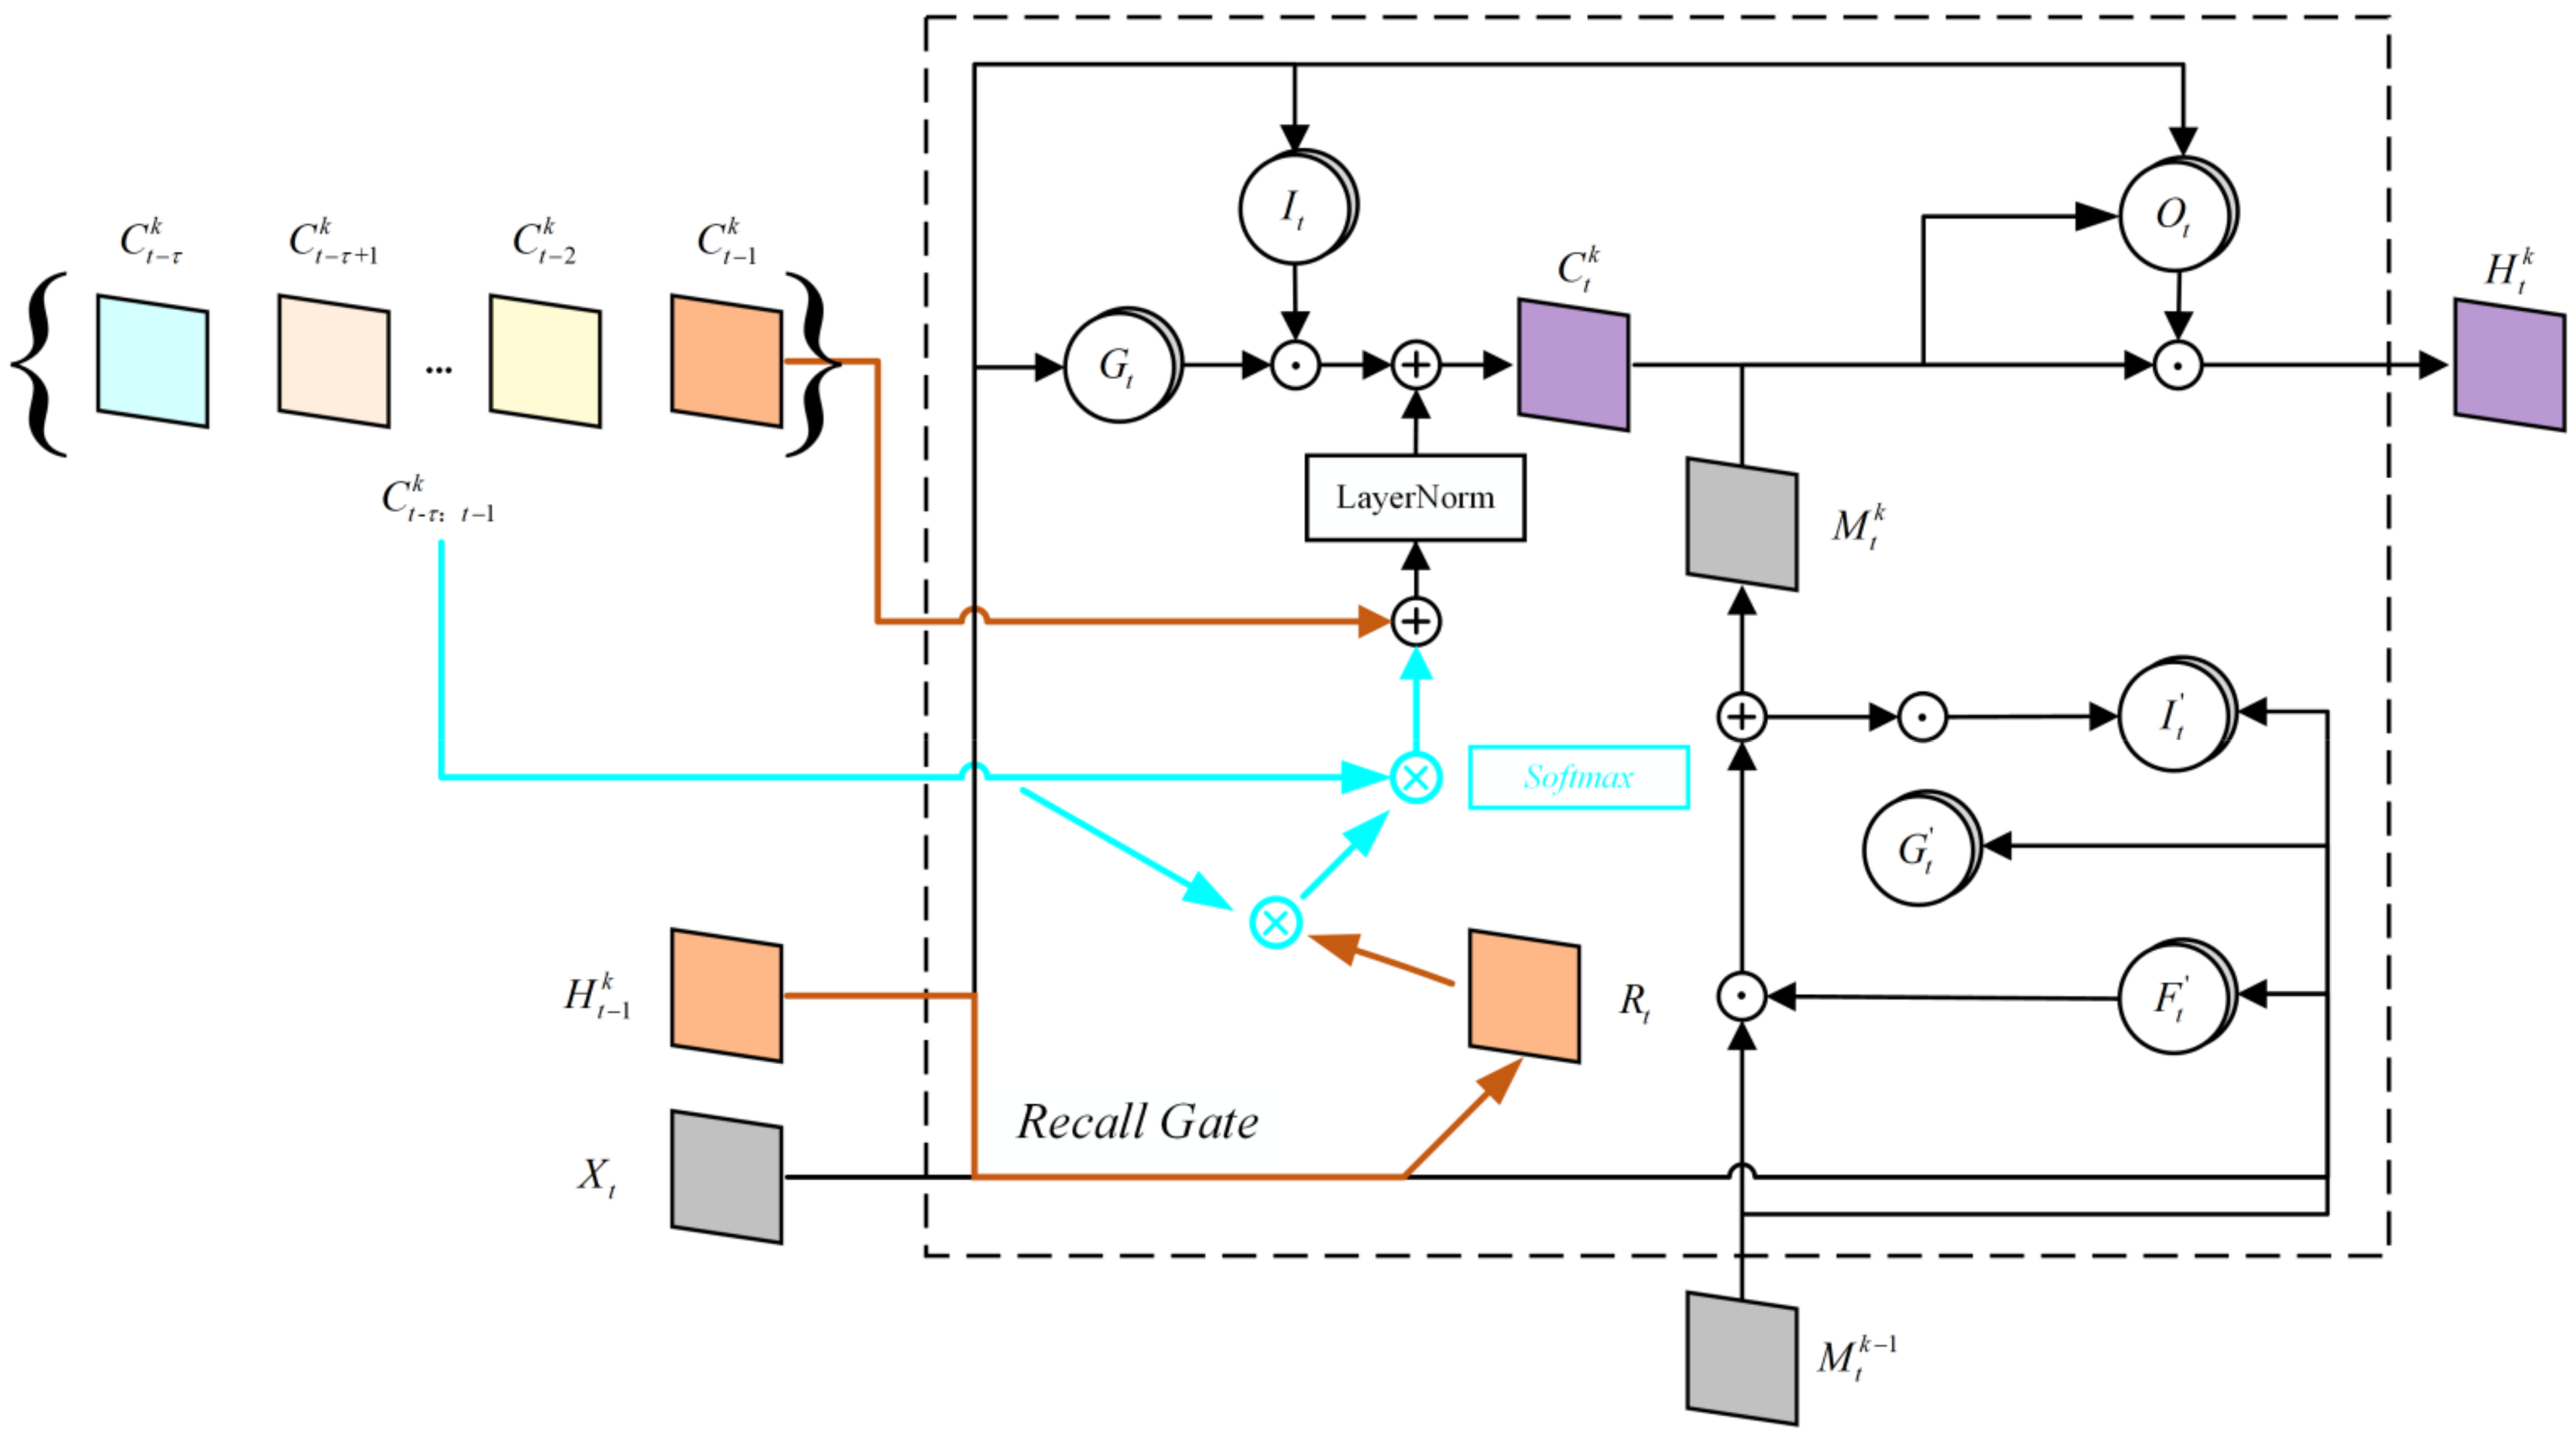
2.2. Spatiotemporal Prediction Principle of the E3D–LSTM Network

As mentioned earlier, spatiotemporal prediction modeling is a relatively new field in deep learning. Shi et al. combined the characteristics of the existing time-series and image data prediction networks at the module level to build a network structure suitable for spatiotemporal change prediction and achieved good application results in weather precipitation prediction and video action prediction [19,22,37,38]. E3D–LSTM is a network model, proposed in 2019, that differs from existing networks in that it can mine short-term dependency and long-term interactions of extended time-series data through 3D–Conv and LSTM modules. Short-term dependence refers to information such as the approaching and ongoing short-term movement of the target extracted by 3D–Conv, while long-term dependence refers to information such as the periodicity and higher-level time expression function of the LSTM-extracted target. As shown in Figure 2, the E3D–LSTM network integrates the 3D–Conv module into LSTM to incorporate convolution features into the recursive state transition that changes with time. In the network, each frame represents the input data group with the τ-th period length T, the 3D–CNN module is used to extract advanced 3D features, and the “classifier” represents a classifier that integrates multiple features.
As shown in Figure 3, the module is an Eidetic 3D–LSTM module, corresponding to the orange part in Figure 2. C t τ   : t 1 k represents the input time-series dataset, M t k 1 represents the memory state of the previous timestamp, H t 1 k represents the hidden state of the previous time stamp, and X t represents the feature matrix extracted by 3D–Conv. The orange arrows represent the short-term information flow (i.e., the target position information extracted from the image), and the blue arrow represents the long-term information flow (i.e., the advanced features of the time function extracted from periodic data). Integrating short-term and long-term features through LayerNorm Cylinders represents high-dimensional gate operations.
By expanding the memory state along the time dimension, E3D–LSTM can represent and store local or short-term movements (short-term dependent information). To capture long-term dependency information, the E3D–LSTM module proposes a new memory state conversion mechanism called RECALL, as shown in Equation (1):
R t = σ W x r X t + W h r H t 1 k + b r I t = σ W x i X t t + W h i H t 1 k + b i G t = tanh W x g X t + W h g H t 1 k + b g R E C A L L R t , C t τ : t 1 k = s o f t max R t · C t τ : t 1 k T · C t τ : t 1 k C t K = I t G t + L a y e r N o r m C t 1 k + R E C A L L R t , C t τ : t 1 k
where σ is the sigmoid function, ∗ is the 3D–Conv operation, is the Hadamard product, W represents the weight coefficient of each stage, and σ is a matrix operation unit that recombines the recall rate ( R t )   and memory state C t τ : t 1 k . The functions of I t and G t are close to those of the input gate and input modulation gate in the LSTM network. In contrast to the traditional memory state conversion function, RECALL is unique in that: first, the short-term change between adjacent timestamps is obtained by C t 1 k , and the long-term inter-frame relationship is established by X t and H t 1 k ; then, the relationship between the current local information and the whole is calculated by the RECALL module. It evokes memories of the past from long time stamps to store and extract useful information from perceived things. Compared with other networks, E3D–LSTM can effectively recover the missing data in long time-series AOD datasets.

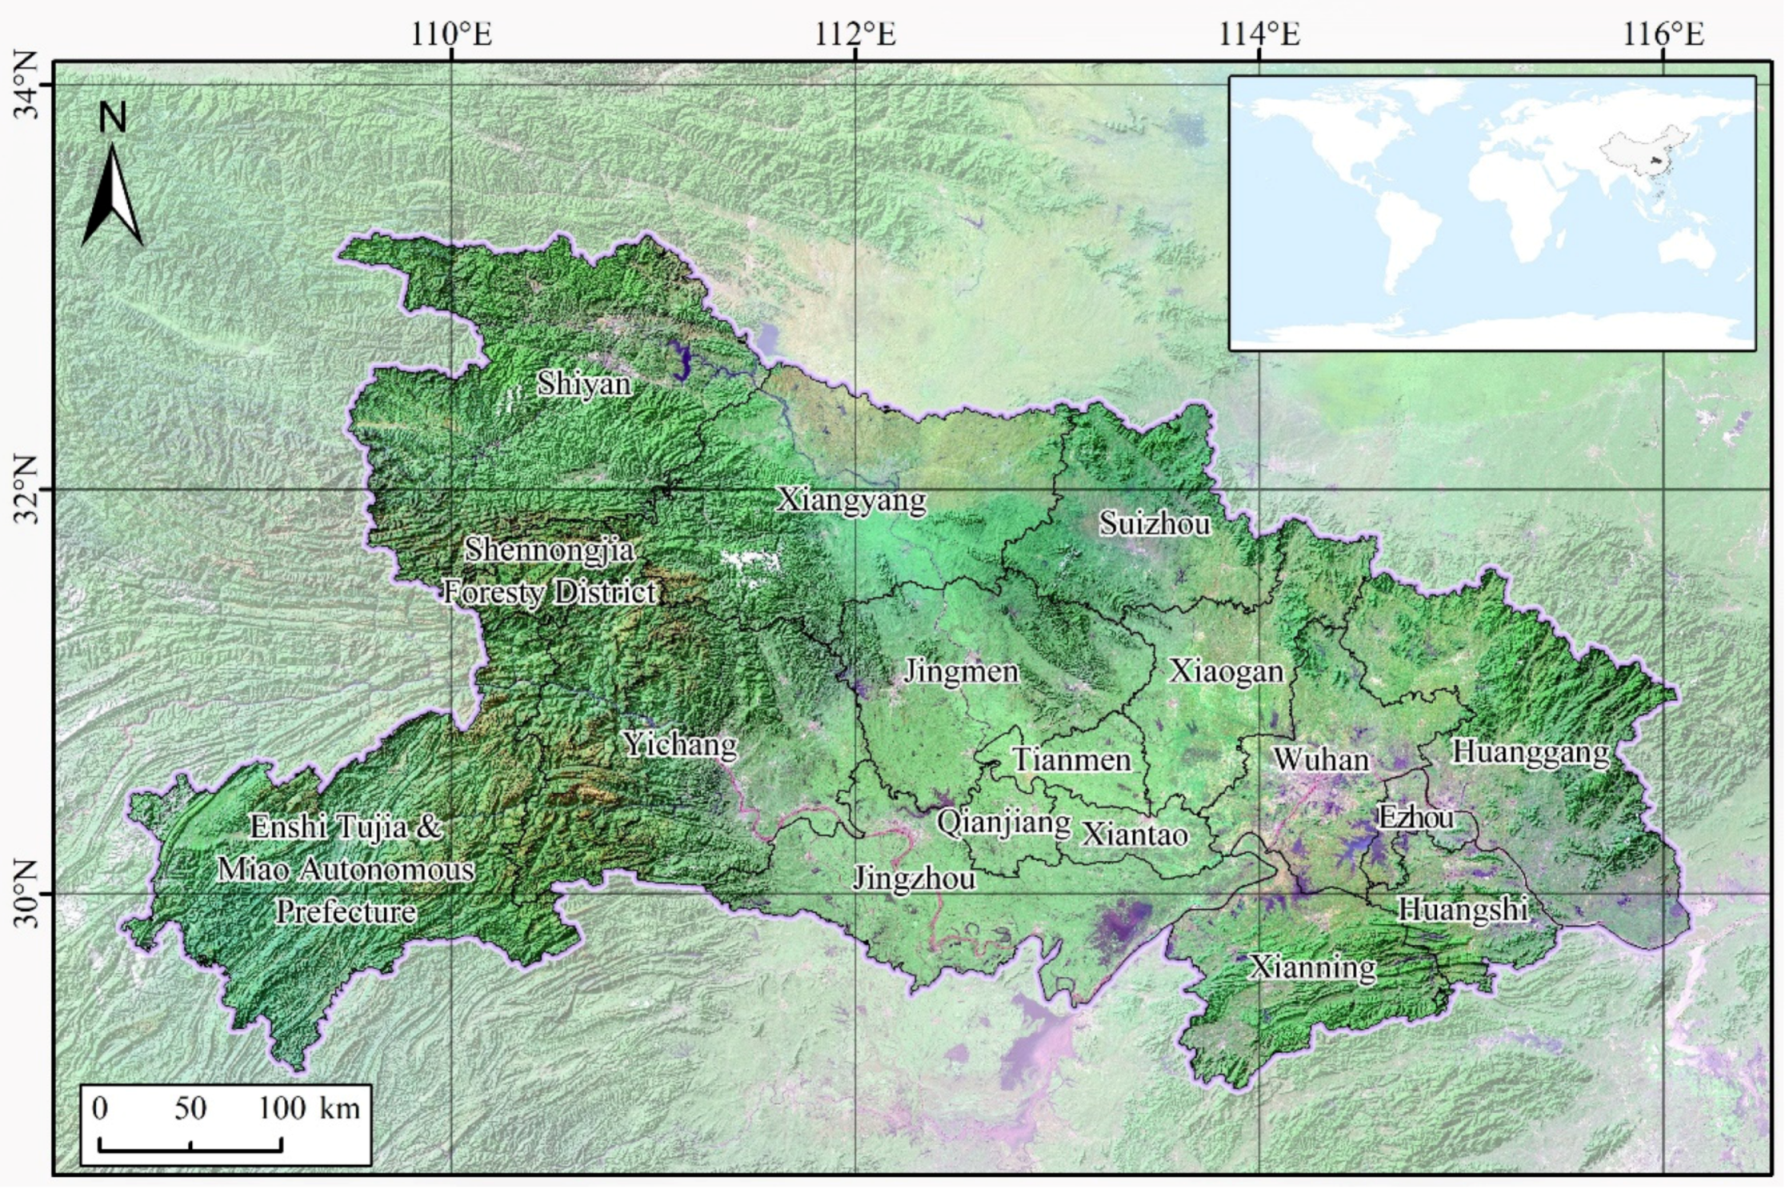
2.3. Overview of the Experimental Area

As shown in Figure 4, we used Hubei Province in China as the experimental area for this study. Wuhan City, Hubei Province, was the first area with large-scale cases in the COVID-19 pandemic and, initially, it was the area of greatest concern. In the early stages of the pandemic, it was the first province in China to enter lockdown. With rapid implementation of relevant policies, all trades and industries were closed, and all social activities ceased during the lockdown period; this was a typical provincial response to Chinese policies during the early stages of the pandemic. We chose Himawari-8 AHI, near a fixed time every day, as the input data for AOD inversion. When there were many missing or abnormal values with large optical depth, the time-series data of the current day data at 20 min intervals were inputted to E3D–LSTM to obtain a prediction.
Figure 5 shows statistical groupings of the experimental data selected for this study; the horizontal axis represents time, and the data are grouped into four key time nodes. Data from 2019, from the same periods as 2020, are taken as a control experiment; the vertical axis and histogram show the number of Himawari-8 satellite images used in each time node. Before 23 January 2020, the initial symptoms of COVID-19 were the same as those of influenza, and cases of COVID-19 were not specifically recognized. We have called this the Normal period, during which normal production activities were essentially maintained. From 23 January to 3 February 2020, around the Chinese Lunar New Year, the number of COVID-19 infections increased sharply, and cities in China began to gradually enter a Lockdown period in response to relevant policies; this was especially the case in Wuhan, Hubei Province, which was the fastest to enter lockdown, resulting in social activities falling to zero [39]. From 3 February to 7 April 2020, after the Lockdown period, the development of the COVID-19 epidemic within China was effectively suppressed, and cities in Hubei Province gradually recovered to an active state, which we have called Recovering 1. After 7 April 2020, there were gradual adaptations to some of the influences of the epidemic on daily life, such as wearing masks when going out and avoiding crowded public places. Social activities gradually recovered to the level seen before the COVID-19 epidemic, and we have called this Recovering 2. The main purpose of this study was to analyze the spatiotemporal variations in aerosols in Hubei Province during the period when COVID-19 was most prevalent, and combine these data with human activity and air pollution emission data. To better show the impact of the epidemic situation, we also conducted experiments using 2019 data to act as a control group.

3. Results

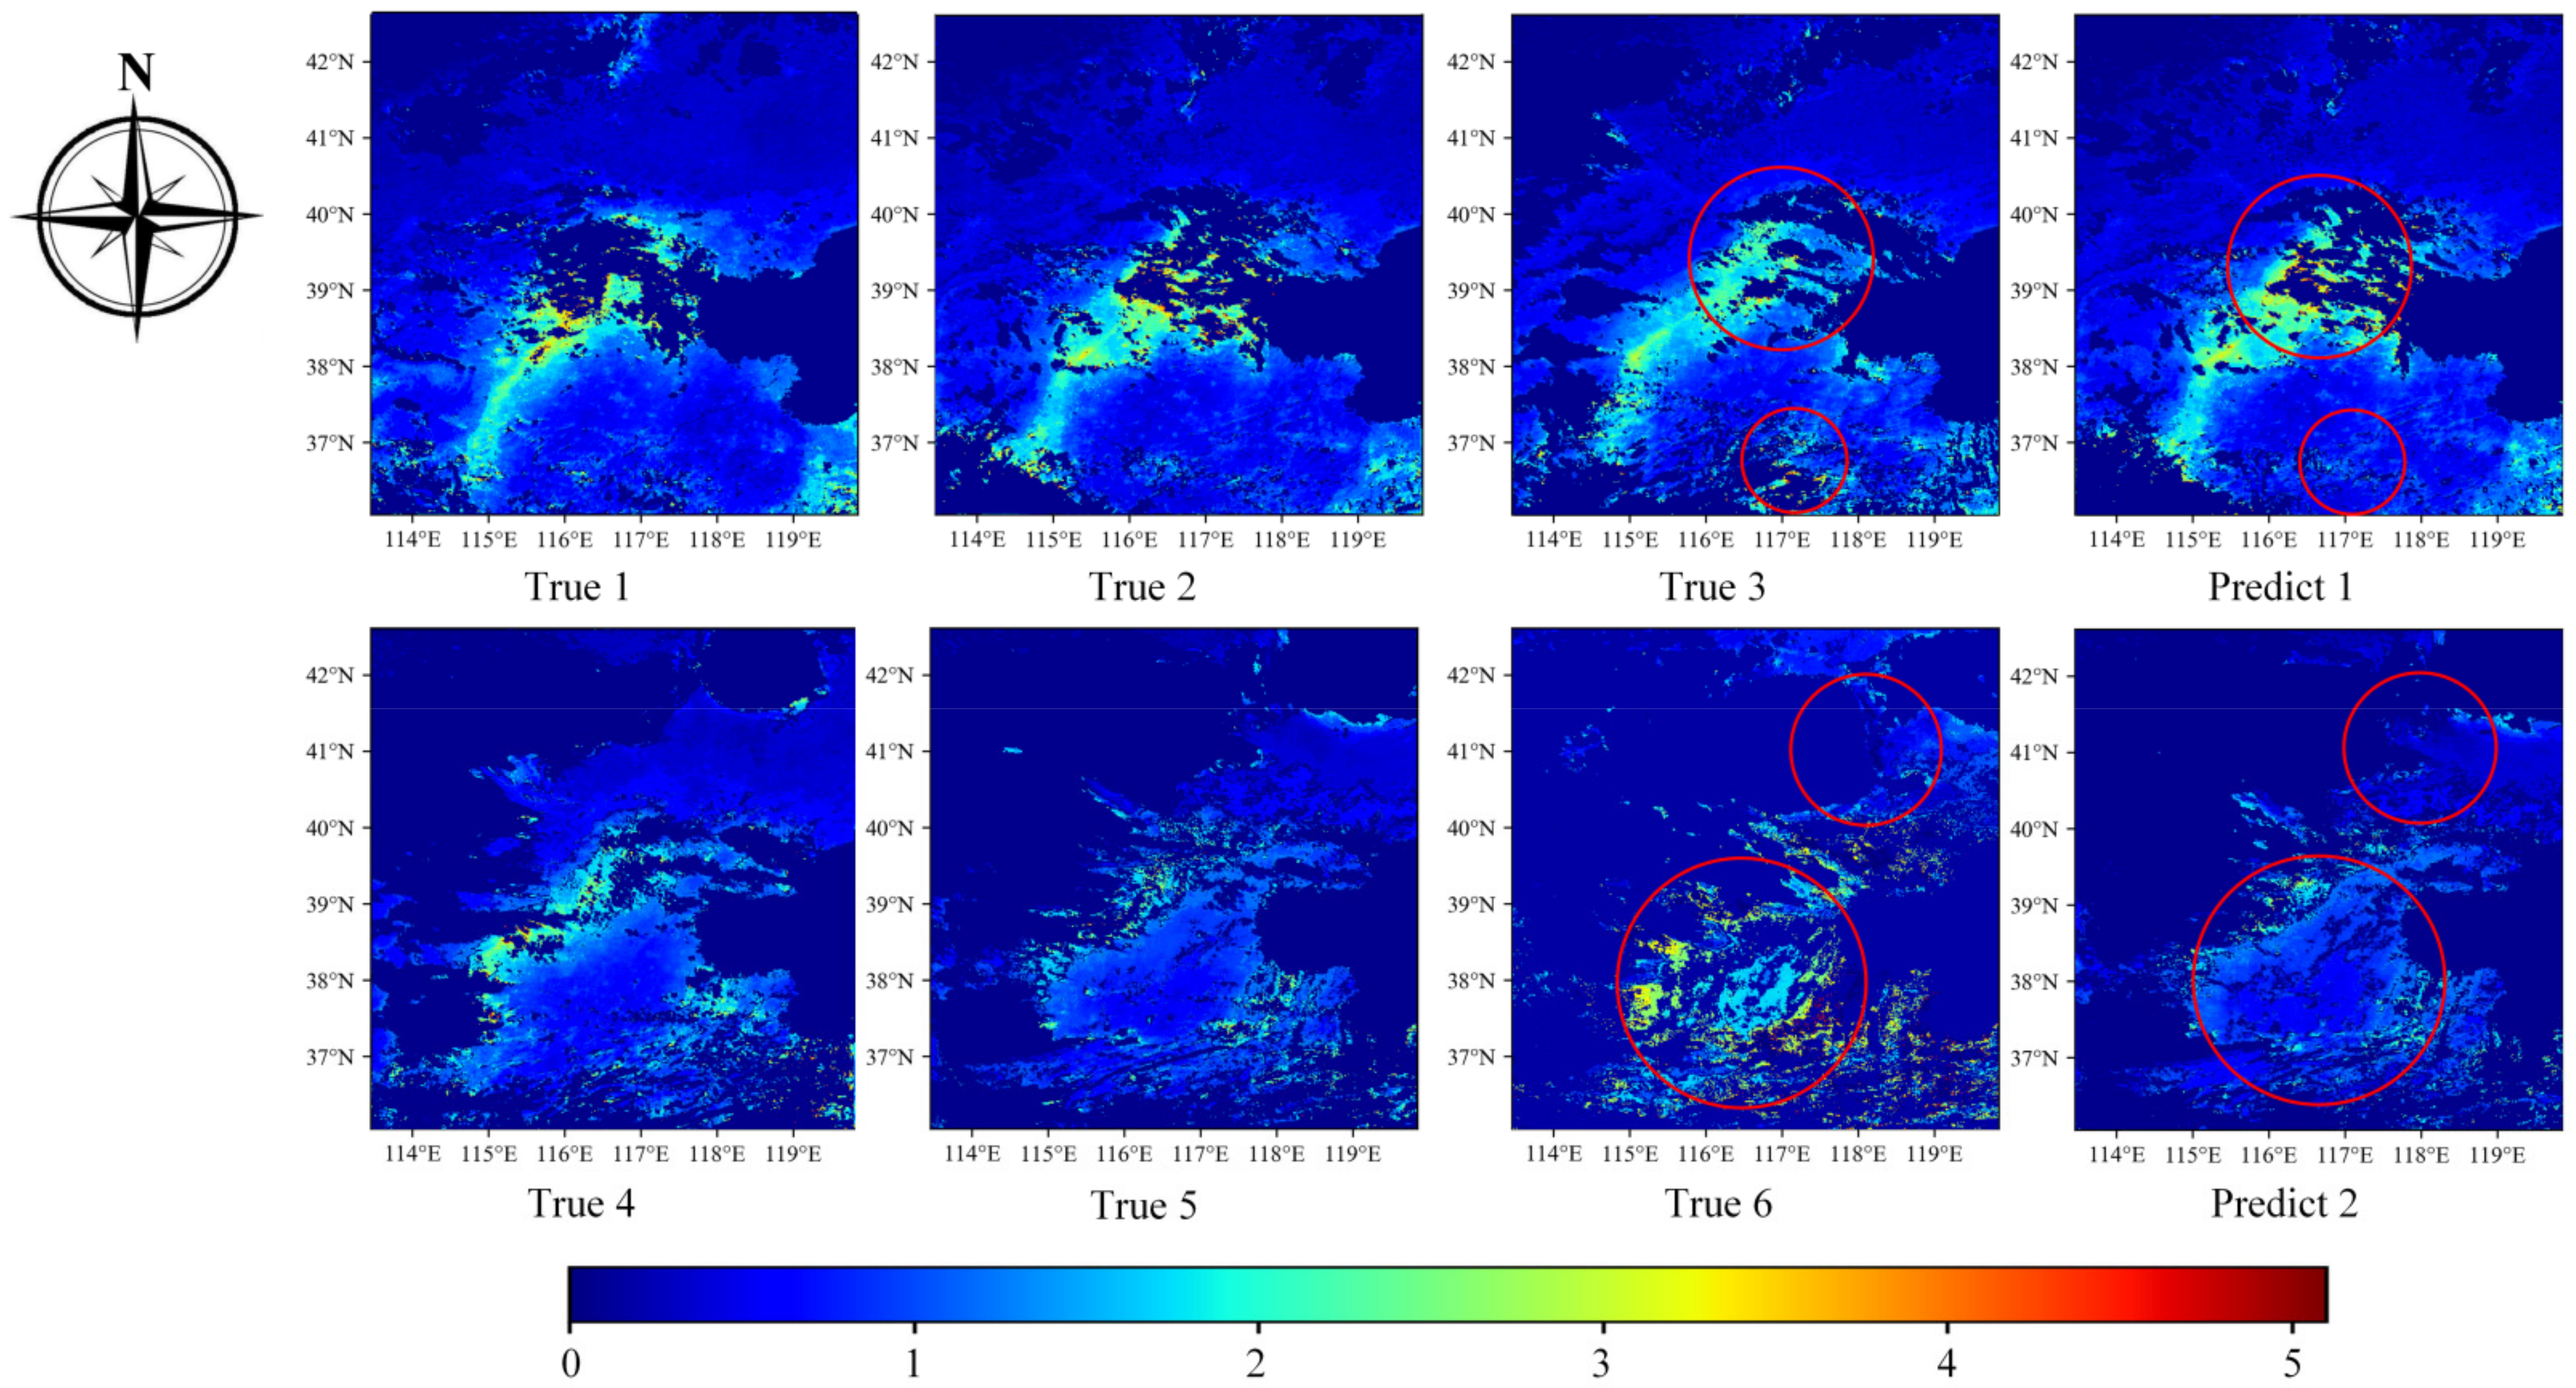
3.1. Spatiotemporal Prediction Model Effect

As mentioned earlier, we used Wang’s algorithm and Himawari-8 AHI as input data to obtain the AOD [28]. In the analysis of aerosol variation, we found two abnormal situations: (1) when the optical depth was high, there were abnormal values and missing values; (2) in some serial data, there was a discontinuity in spatial distribution. The reason underlying these two anomalies could be that the algorithm judges some high optical depth values as clouds and abnormal pixels, which are then eliminated from aerosol pixels. On the other hand, when the sensor acquires data, a detection error or sudden change in meteorological conditions likely causes the numerical value to drift.
For Himawari-8 AHI data, 10 min resolution data can be obtained under special circumstances; however, data can only be obtained at 20 min intervals under most conditions. Long-term and continuous data provide a good basis for repairing AOD errors, and we achieved this goal through the spatiotemporal prediction model E3D–LSTM. As shown in Figure 6, we selected the time-series data of a given area on 20 June 2020, as the analysis object, in which True 1–3 and True 4–6 were continuous data with 20 min intervals, and Predicts 1 and 2 were the E3D–LSTM prediction results of Trues 3 and 6, respectively. Compared with True 2, the values in True 3 showed unreasonable spatial distribution in the middle part, and abnormally high optical depth values appeared locally in the lower part, while the prediction result of Predict 1 was more in line with the changes in time and space, which corrected this anomaly. Compared with True 5, True 6 had a large area of abnormally high values in the middle and lower parts, and some of the upper parts were missing. Predict 2 compensated for this abnormality, which was more in line with the changing trend of True 4–6.
It can be seen that E3D–LSTM can compensate for errors caused by complex factors in the change of spatiotemporal data. Because we needed to use the number of n spatiotemporal data to predict the nth + 1, n + 2, … images, with the expansion of data, the prediction effect inevitably declined; therefore, we only used the first 10 training models of abnormal images to solve this problem. If there were multiple abnormal images in the same group, we took the image with the first abnormality as a sample and then replaced the original image with its predicted result to predict the next image until all abnormal values were repaired.
The disadvantage of this processing is that the variable input length leads to more complexity. The long time-series data does not account for the mutation factor, which can be regarded as a reasonable fitting of long-term spatiotemporal changes. However, during the initial COVID-19 outbreak, external factors such as human activities were greatly reduced, and this data processing method was more conducive to our analysis of single influencing factors.

3.2. Analysis of AOD Variation

Based on the work in Section 3.1, E3D–LSTM made a significant contribution to our analysis of the spatiotemporal variation of AOD. However, in Section 2.1, AOD was obtained by removing the cloud optical depth from the overall optical depth of the region (referring to a region with high optical depth); therefore, even though the E3D–LSTM prediction can compensate for the spatial discontinuity of data and remove some outliers, it is difficult to further process and analyze the time nodes with only a few AOD pixels in the experimental region. Therefore, we removed the data with <50% effective pixels of AOD raster data in the daily test area and calculated the mean value of the AOD spatial distribution in each period.
During the COVID-19 pandemic in 2020, there were four obvious changes in social activities compared with data from equivalent periods in 2019. Figure 7 shows the spatial distribution results of the mean AOD across our four selected time stages in 2019 and 2020. Overall, the mean AOD value in 2020 was approximately 0.2–0.5 lower than that in 2019, and the drop was most apparent in the central and eastern regions of Hubei Province. In the Normal period, the AOD was affected in 2020 before the Lockdown period, and the overall mean AOD was approximately 0.1 lower than that in 2019. In the Lockdown period, which coincided with the Chinese Lunar New Year, the overall mean value of AOD in 2019 was approximately 0.7. The local AOD value reached more than 1.4, while in 2020, the overall mean level of AOD declined to approximately 0.2–0.5, with marked changes concentrated in the central part of Hubei Province. In the Recovering 1 and 2 periods, social activities gradually recovered from an inactive state, but were still at a relatively low level, and the mean AOD decreased by approximately 0.2 compared with that in the same period in 2019. It can be seen that the COVID-19 pandemic greatly impacted Hubei Province, and mean the AOD changed considerably compared with data from the same period in 2019; this is closely related to social activities and changes in air pollutant emissions.
To further illustrate the influence of the COVID-19 pandemic on regional AOD changes in Hubei Province, China, we calculated the mean difference of AOD in our four selected periods, as shown in Figure 8. Overall, the mean value of AOD varied from approximately 0.2 to 0.3, and in some areas, it reached 1 (or even more) because of high local AOD values. Combining the three periods of Normal, Lockdown, and Recovering 1, we found that the influence of the COVID-19 situation reduced the AOD overall. However, there were still some high numerical areas in 2020 in central Hubei Province, leading to smaller differences. We found that although social activities ceased during the epidemic and the secondary organic aerosol of air pollutants related to social activities decreased, a natural concentration of aerosols (affected by other complex factors) remained, which led to some discontinuities in spatial distribution. Combining the pandemic prevention and control policy with news articles, we found that the discontinuous and high-value areas coincided with the central city of Hubei Province and the key areas of epidemic prevention and control in Wuhan. The dense population distribution and frequent human activities were also behind this phenomenon [40].

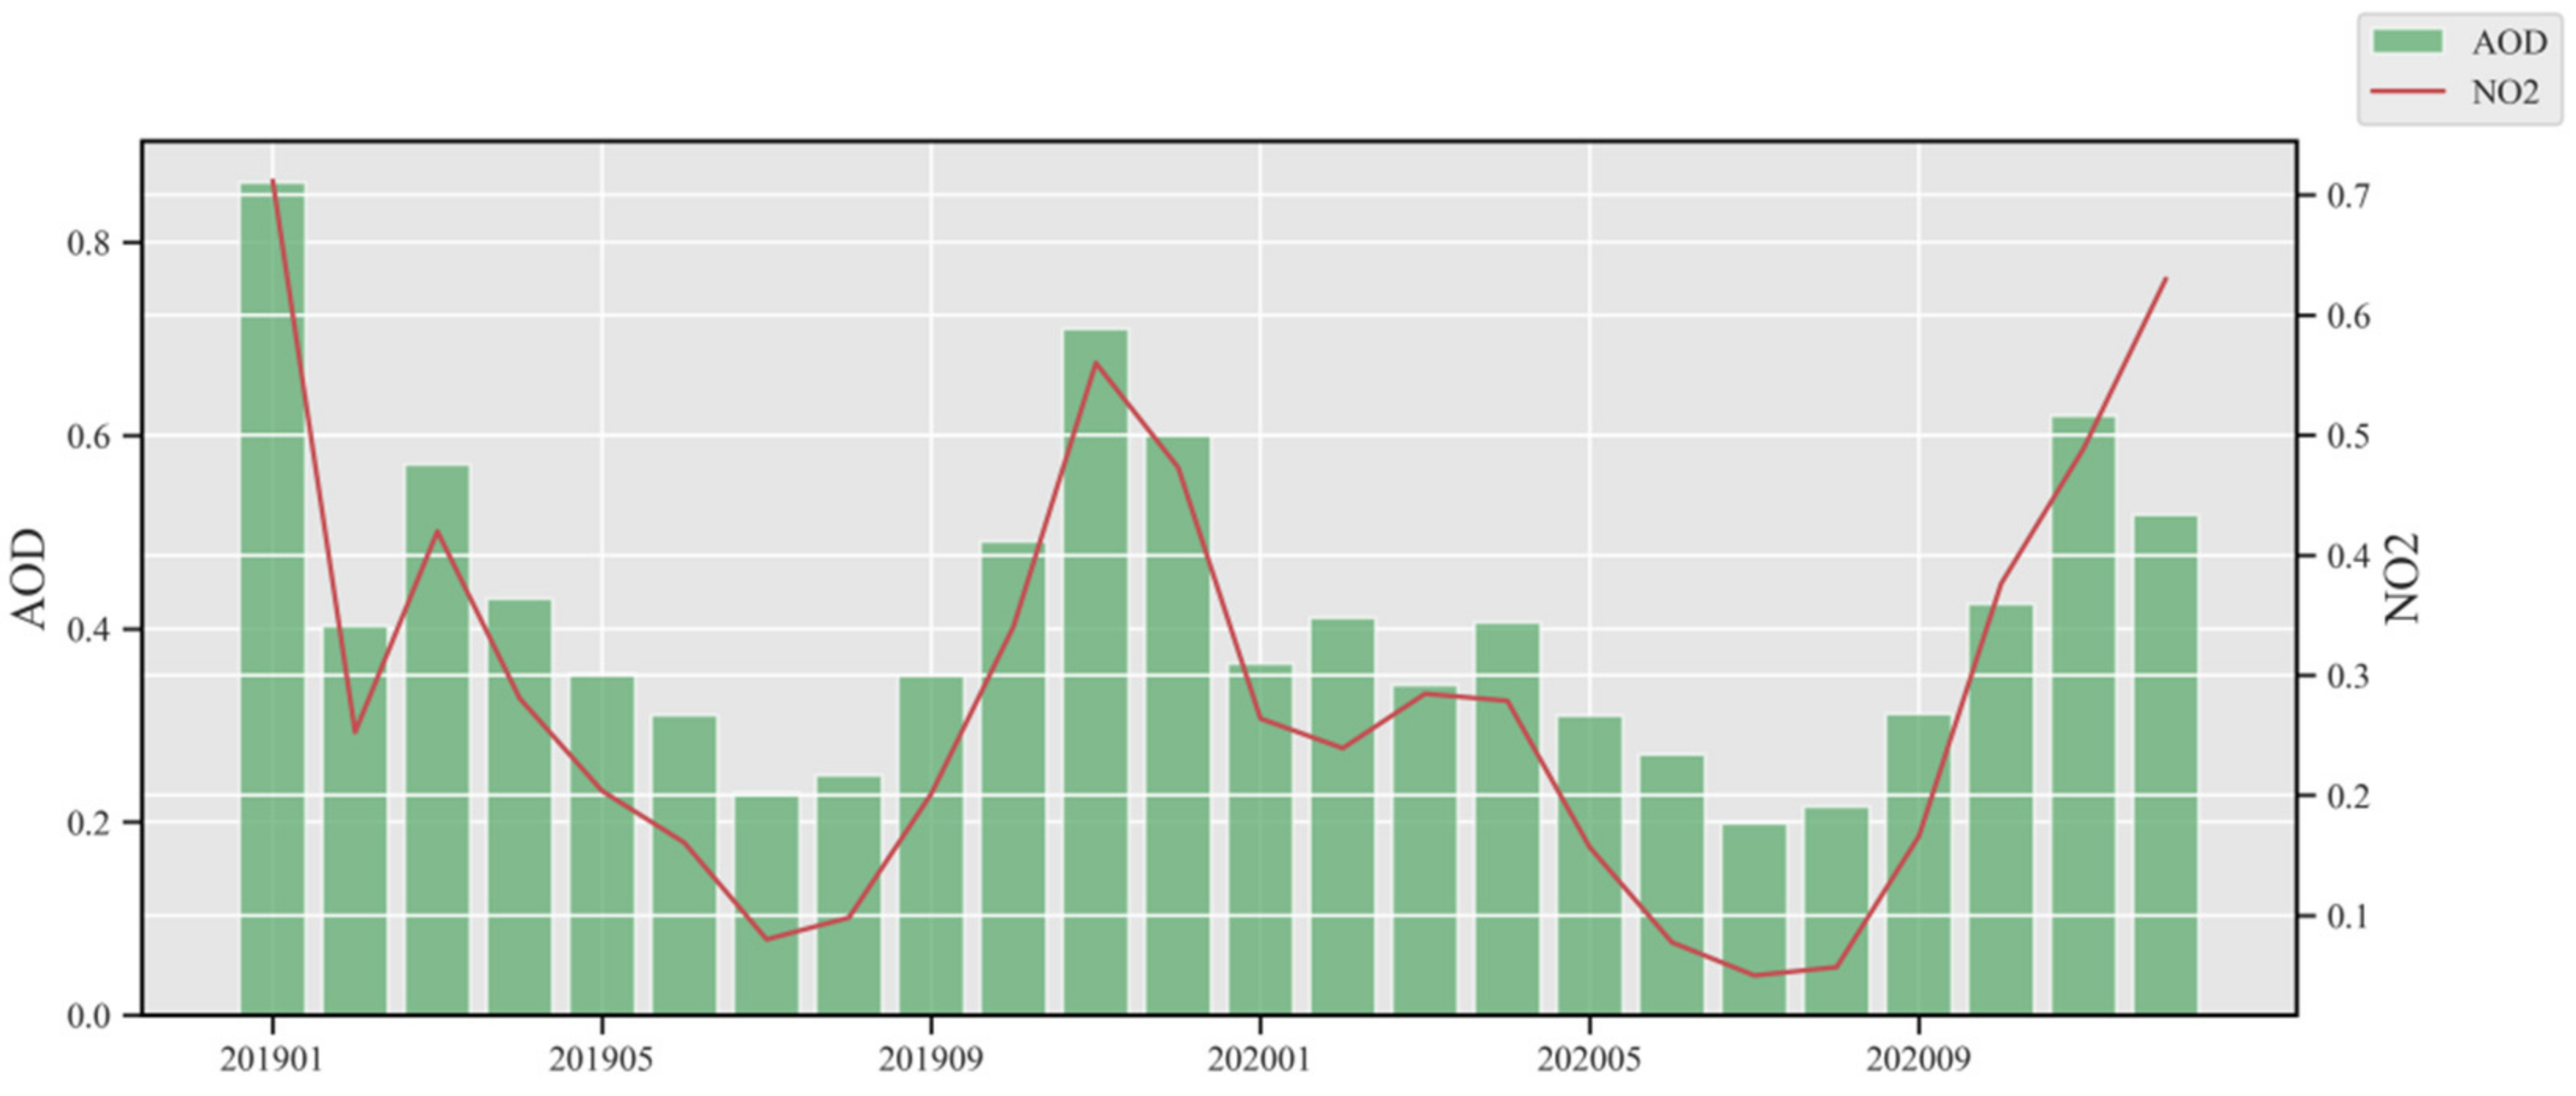
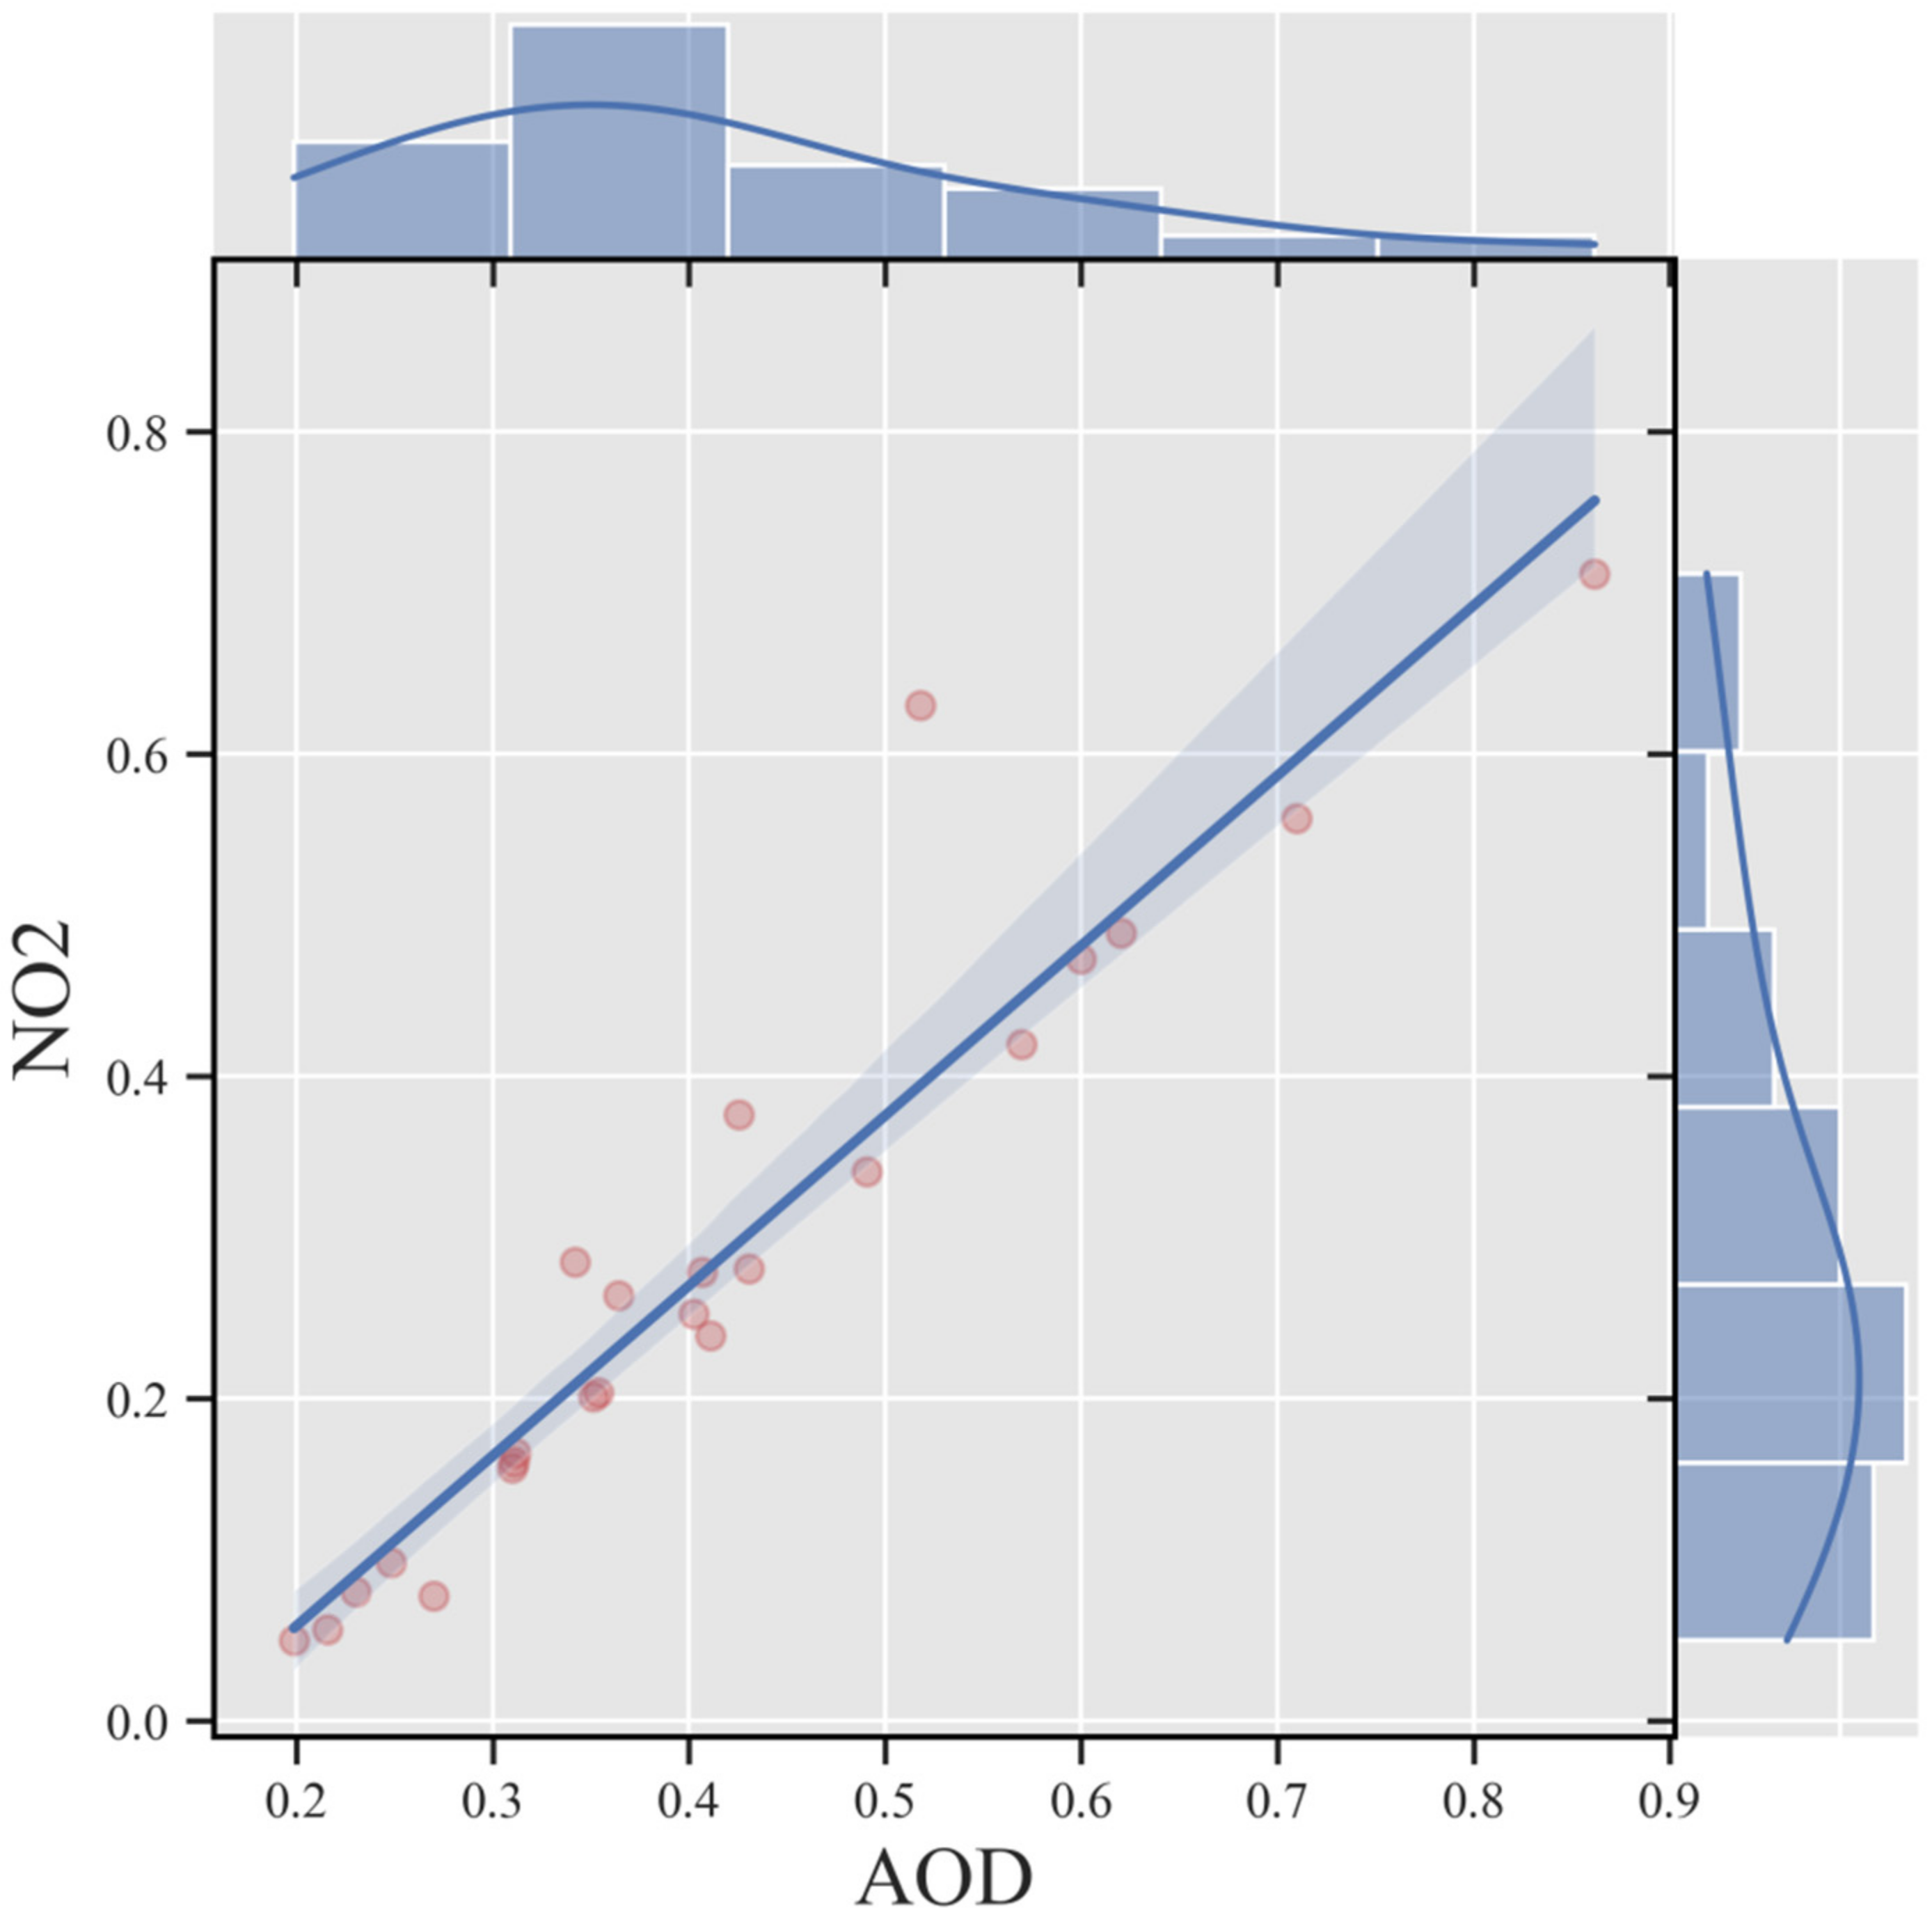
3.3. Combining Air Pollutant Analysis

In the previous section, the spatiotemporal distributions of AOD were analyzed. We found a similar spatiotemporal variation trend in NO2 during the pandemic, which may have been caused by atmospheric pollutants directly or indirectly forming aerosols. NO2 is an important component of the troposphere. Its changing distribution is not only a reflection of spatiotemporal changes in AOD but also a lateral mapping of human activities and social productivity. In this section, we further interpret and analyze the spatiotemporal changes in AOD based on ozone monitoring instrument (OMI) data from Hubei Province. The OMI is a sensor for detecting NO2 and O3 on the AURA satellite, which obtains information by observing the backscattered radiation of both the Earth’s atmosphere and the Earth’s surface. It has a wavelength range of 270–500 nm, an orbital scanning width of up to 2600 km, and a spatial resolution of 13 × 24 km. In this study, we mainly used the vertical column concentration data of ozone monitor OMI–NO2. We also used remote sensing product data, namely QA4ECV retrieved by the Royal Netherlands Institute of Meteorology, with a spatial resolution of 0.125° × 0.125°, and a time resolution of daily scale [41,42]. NO2 data were used only to explain the spatiotemporal variation of AOD, and it is not necessary to predict it by E3D–LSTM.
Table 2 shows regional air pollutant changes in Hubei Province from 2019 to 2020, where the means and standard deviations of AOD and NO2 across our four selected periods have been recorded. We regarded NO2 as mapping human activities and social production efficiency; then, we analyzed the influence of the COVID-19 situation on AOD and NO2 and analyzed the relationship between these parameters. The values given in Table 2 are the percentage of data changes in 2020 relative to the same period in 2019. Compared with data from the same period in 2019, the 2020 data generally showed a downward trend. The change in AOD was largest during the Lockdown period; the mean value decreased by approximately 70%, and the standard deviation increased by approximately 12%. The Lockdown period also witnessed a large (approximately 30%) decrease in mean NO2, possibly due to the strict blockade policy implemented in Hubei Province, whereby human activities, including air pollution, dropped to a relatively low level. The largest change in NO2 was observed during the Normal period; the mean value decreased by approximately 50%, and the standard deviation by approximately 58%. The mean value of AOD decreased by approximately 13% in this Normal period, which may have been due to the initial symptoms of the pandemic in Hubei Province before the Lockdown period. In addition, some areas began to implement policies to deal with highly infectious influenza; however, the overall trend of infection was relatively stable. In the Recovering 1 period, there was only a very small change in AOD between 2019 and 2020, but NO2 decreased by approximately 20%, suggesting that overall production efficiency recovered rather slowly after the Lockdown period, and the change was small compared with that in the same period. In Recovering 2, AOD decreased by approximately 14%, while NO2 showed little change. The NO2 data could partly be due to the long coverage time of the Recovering 2 period, and partly due to people gradually returning to normal life after the Lockdown period. However, the 14% change in AOD suggests that the influence of COVID-19 had not been completely eliminated.
Figure 9 shows a spatial distribution diagram of NO2 mean difference across our four selected periods; each pixel has a range of values from −1000 to 1000 × 1013 molecules/cm2. When calculating the mean value of spatial distribution in each stage, it was necessary to eliminate the data whose number of effective pixels per day was less than half of the experimental area to reduce errors caused by observation factors. Compared with Figure 8, we saw a high spatial similarity between NO2 and AOD. In the Normal period, low NO2 values (green areas) corresponded to low AOD values (blue areas); likewise, high values of NO2 and AOD shared similar spatial distributions. During the Lockdown period, the spatial distribution of low NO2 values was similar to that of low AOD values. Still, they did not completely overlap when their values were higher (Figure 9, pink areas). During the Recovering 1 and 2 periods, changes in NO2 and AOD were essentially the same.
There was a prevalent high spatial correlation between changes in AOD and NO2. Still, the correlation was poor in some areas with high numerical values, suggesting that: (1) NO2 in automobile exhaust and industrial waste gas was the main source of primary and secondary organic aerosol generation, and the spatial distribution of NO2 closely affects the aggregation and change in the quantity of aerosols; (2) as mentioned earlier, NO2 is closely related to human activities, and the high correlation between NO2 and AOD indicates a change in human activities during the pandemic.
Based on the above conclusions, the impact of the COVID-19 pandemic on human activities is summarized as follows: (1) in the Normal period, human activities in central Hubei Province mostly ceased, but the eastern and western areas Hubei Province maintained a higher level of activity. This is because in the early stage, only Wuhan, the central area of Hubei Province, was greatly affected by COVID-19, and the disease did not attract much attention; (2) during the Lockdown period, Hubei Province strengthened its COVID-19 prevention and control policy, and the whole province entered an inactive state; however, this was not completely enforced in the southeast of the province. By consulting relevant news reports, during the Lockdown period, there were still factories in this southeast area that maintained a basic work schedule, and the industrial waste gases discharged caused abnormal changes in their spatial distribution [43]; (3) during Recovering 1, after the lockdown was lifted, Hubei Province as a whole entered a state of rapid recovery. However, there was uneven point distribution of AOD and NO2, indicating that some cities did not recover to the level of the same period in 2019; (4) in the Recovering 2 period, Hubei Province as a whole recovered to the level seen before the pandemic, and even slightly exceeded the industrial distribution in areas in the northeast.
To analyze the temporal correlation between AOD and NO2 in Hubei Province, the monthly mean value from 2019 to 2020 was calculated. In Figure 10, the green bar chart represents AOD, the red curve indicates NO2, and the horizontal axis represents time. To facilitate data analysis, the NO2 data were normalized. From January to December 2019, there was a good correlation between NO2 and AOD, which indicates that the active generation of NO2 by human activities was the main driver for the formation of AOD. From January to April 2020, NO2 remained low, and human activity largely ceased. However, the poor correlation between NO2 and AOD indicates that NO2 was not the main factor driving AOD at this time; it only partly contributed to it. After May 2020, the correlation between NO2 and AOD was strong, with both parameters rising steadily and recovering to levels seen before the pandemic, indicating that Hubei Province quickly recovered from the pandemic to its normal way of life. This finding is consistent with the conclusions obtained from our four-stage analysis above.
Figure 11 shows an analysis of the correlation between the monthly mean dispersion of AOD and NO2 from 2019 to 2020. Combining this with Figure 10, it can be seen that the correlation between these parameters was strong during the COVID-19 pandemic period, and the Pearson correlation coefficient reached 0.85. The change in AOD might be attributed to the influence of both human and meteorological factors. However, the positive correlation between AOD and NO2 indicates that, compared with other factors such as meteorology, human and industrial activities were the main drivers of spatiotemporal changes in AOD.

4. Discussion and Conclusions

In this study, we used Hubei Province in China as our experimental area. First, based on an E3D–LSTM network, we corrected the temporal and spatial errors of the inversion results of the Himawari-8 AOD. Second, according to the influence of the COVID-19 pandemic, 2020 was divided into four periods, and 2019 (divided into the same four periods) was used as a control experiment to analyze spatiotemporal changes in AOD. Subsequently, to quantify the intensity of human activities, we introduced the NO2 vertical column concentration data of the OMI satellite into the experiment and analyzed its spatial distribution. Finally, by combining AOD and NO2 data, the influence of the COVID-19 pandemic on human activities was analyzed from the perspectives of time and space. Our main conclusions are as follows:
(1) When AOD was high, there were outliers and missing values. At the same time, in some datasets, the spatial distribution was discontinuous. These two types of errors may be caused by errors in the algorithm or the uncertainty of sensor observation. These effects can be eliminated using an E3D–LSTM network to ensure that all data are observed simultaneously, yielding reliable results;
(2) Compared with 2019, during the lockdown of Hubei Province in 2020, mean AOD decreased by 71.49% (a drop of approximately 0.2–0.5), and mean NO2 concentration decreased by 29.35% (a drop of approximately 300 × 1013 molecules/cm2);
(3) During the COVID-19 pandemic period, there was a high correlation between AOD and NO2 concentration, with a Pearson correlation coefficient reaching 0.85. This shows that NO2 in automobile exhaust and industrial waste gas was the main driver for the formation of AOD. Future studies analyzing the impact of meteorological factors on the spatiotemporal changes in AOD will provide insights into the applicability of spatiotemporal monitoring as a proxy for human activity.

Author Contributions

H.Z. (Haoran Zhai) proposed and implemented the methodology. J.Y. and X.Y. contributed to improving the methodology, wrote the manuscript, and acted as the corresponding authors. Z.W. and S.W. edited and improved the manuscript. H.Z. (Hong Zhu) and X.T. contributed to methodology testing. All authors have read and agreed to the published version of the manuscript.

Funding

This work was jointly supported by grants from the China Postdoctoral Science Foundation (No. 2021M693782) and the National Key Research and Development Project of China (2016YFB0501005).

Conflicts of Interest

The authors declare no conflict of interest.

References

  1. Pastor, L.; Vorsatz, M.B. Mutual fund performance and flows during the COVID-19 crisis. Mutual Fund Perform. Flow 2020, 10, 791–833. [Google Scholar]
  2. Stratakis, C.A.; Laybut, D.R.; Laudet, V.; Klinge, C.M. Epidemics will always come (and go): The need to prepare for the next one, research on COVID-19, and the role of molecular and cellular endocrinology. Mol. Cell. Endocrinol. 2020, 511, 110863. [Google Scholar] [CrossRef] [PubMed]
  3. Wu, N.; Li, Y.; Zhao, A.; Xiao, C.; Zhou, S. Operation strategy for public transportation in Wuhan after the COVID-19 epidemic. J. Transp. Eng. Inf. 2020, 18, 64–73. [Google Scholar]
  4. Huo, M.; Yin, Y.; Jiang, L.; Duan, X. Survey on the mental status of inhabitants living in Wuhan, Huanggang, Kunming and Yuxi during epidemic outbreak stage of COVID-19. J. Int. Psychiatry 2020, 47, 197–200. [Google Scholar]
  5. Mitchell, J.F.B.; Johns, T.C.; Gregory, J.M.; Tett, S.F.B. Climate response to increasing levels of greenhouse gases and sulphate aerosols. Nature 1995, 376, 501–504. [Google Scholar] [CrossRef]
  6. Fan, C.; Li, Y.; Guang, J.; Li, Z.; Elnashar, A.; Allam, M.; de Leeuw, G. The impact of the control measures during the COVID-19 outbreak on air pollution in China. Remote Sens. 2020, 12, 1613. [Google Scholar] [CrossRef]
  7. Ren, H.; Li, A.; Xie, P.; Hu, Z.; Xu, J.; Huang, Y.; Li, X.; Zhong, H.; Zhang, H.; Tian, X.; et al. The Characterization of haze and dust processes using MAX-DOAS in Beijing, China. Remote Sens. 2021, 13, 5133. [Google Scholar] [CrossRef]
  8. Lim, S.S.; Vos, T.; Flaxman, A.D.; Danaei, G.; Shibuya, K.; Adair-Rohani, H.; Amann, M.; Anderson, H.R.; Andrews, K.G.; Aryee, M.; et al. A comparative risk assessment of burden of disease and injury attributable to 67 risk factors and risk factor clusters in 21 regions, 1990–2010: A systematic analysis for the Global Burden of Disease Study 2010. Lancet 2013, 380, 2224–2260. [Google Scholar] [CrossRef] [Green Version]
  9. Menon, S.; Hansen, J.; Nazarenko, L.; Luo, Y. Climate effects of black carbon aerosols in China and India. Science 2002, 297, 2250–2253. [Google Scholar] [CrossRef] [Green Version]
  10. Li, Z.; Lei, L.; Li, Y.; Chen, C.; Wang, Q.; Zhou, W.; Sun, J.; Conghui, X.; Sun, Y. Aerosol characterization in a city in central China plain and implications for emission control. J. Environ. Sci. 2021, 104, 242–252. [Google Scholar] [CrossRef]
  11. Zhou, M.; Jiang, J.; Langerock, B.; Dils, B.; Sha, M.; Mazière, M. Change of CO concentration due to the COVID-19 lockdown in China observed by surface and satellite observations. Remote Sens. 2021, 13, 1129. [Google Scholar] [CrossRef]
  12. Bhawar, R.; Fadnavis, S.; Kumar, V.; Rahul, P.; Sinha, T.; Lolli, S. Radiative Impacts of aerosols during COVID-19 lockdown period over the Indian region. Front. Environ. Sci. 2021, 9, 411. [Google Scholar] [CrossRef]
  13. Grzybowski, P.; Markowicz, K.; Musial, J. Reduction of air pollution in Poland in spring 2020 during the lockdown caused by the COVID-19 pandemic. Remote Sens. 2021, 13, 3784. [Google Scholar] [CrossRef]
  14. Muhammad, S.; Long, X.; Salman, M. COVID-19 pandemic and environmental pollution: A blessing in disguise? Sci. Total Environ. 2020, 728, 138820. [Google Scholar] [CrossRef]
  15. Ali, G.; Abbas, S.; Qamer, F.M.; Irteza, S.M. Environmental Spatial Heterogeneity of the Impacts of COVID-19 on the Top-20 Metropolitan Cities of Asia-Pacific. Sci. Rep. 2021, 11, 20339. [Google Scholar] [CrossRef]
  16. Ibrahim, S.; Landa, M.; Pešek, O.; Pavelka, K.; Halounová, L. Space-time machine learning models to analyze COVID-19 pandemic lockdown effects on aerosol optical depth over Europe. Remote Sens. 2021, 13, 3027. [Google Scholar] [CrossRef]
  17. Li, R.; Li, J.; Liu, Z.; Hua, J.; Wang, Y.; Wang, W. Satellite observational study on correlations among aerosol optical depth, NO2 and SO2 over China. Chin. Sci. Bull. 2016, 61, 2524–2535. [Google Scholar] [CrossRef] [Green Version]
  18. Huang, R.-J.; Zhang, Y.; Bozzetti, C.; Ho, K.-F.; Cao, J.-J.; Han, Y.; Daellenbach, K.R.; Slowik, J.G.; Platt, S.M.; Canonaco, F.; et al. High secondary aerosol contribution to particulate pollution during haze events in China. Nature 2014, 514, 218–222. [Google Scholar] [CrossRef] [Green Version]
  19. Shi, X.; Chen, Z.; Wang, H.; Yeung, D.-Y.; Wong, W.K.; Woo, W.-C. Convolutional LSTM Network: A Machine Learning Approach for Precipitation Nowcasting. In Proceedings of the NIPS 2015, Montréal, ON, Canada, 7–12 December 2015. [Google Scholar]
  20. Hochreiter, S.; Schmidhuber, J. Long Short-term Memory. Neural Comput. 1997, 9, 1735–1780. [Google Scholar] [CrossRef]
  21. Wang, Y.; Long, M.; Wang, J.; Gao, Z.; Yu, P.S. PredRNN: Recurrent neural networks for predictive learning using spatiotemporal LSTMs. In Proceedings of the Neural Information Processing Systems, Long Beach, CA, USA, 4–9 December 2017. [Google Scholar]
  22. Wang, Y.; Gao, Z.; Long, M.; Wang, J.; Yu, P.S. PredRNN++: Towards a resolution of the deep-in-time dilemma in spatiotemporal predictive learning. In Proceedings of the ICML2018, Stockholm, Sweden, 10–15 July 2018. [Google Scholar]
  23. Ji, S.; Xu, W.; Yang, M.; Yu, K. 3D convolutional neural networks for human action recognition. IEEE Trans. Pattern Anal. Mach. Intell. 2013, 35, 221–231. [Google Scholar] [CrossRef] [Green Version]
  24. Bhujel, N.; Teoh, E.K.; Yau, W.Y. Pedestrian trajectory prediction using RNN encoder-decoder with spatio-temporal attentions. In Proceedings of the 2019 IEEE 5th International Conference on Mechatronics System and Robots (ICMSR), Singapore, 3–5 May 2019. [Google Scholar]
  25. Gomes, P.; Rossi, S.; Toni, L. Spatio-temporal graph-RNN for point cloud prediction. arXiv 2021, arXiv:2102.07482. [Google Scholar]
  26. Wang, Y.; Lu, J.; Yang, M.-H.; Li, L.-J.; Long, M.; Li, F.-F. Eidetic 3D LSTM: A model for video prediction and beyond. In Proceedings of the ICLR 2019, New Orleans, LA, USA, 6–9 May 2019. [Google Scholar]
  27. Wang, Y.; Chen, L.; Li, S.; Wang, X.; Yu, C.; Si, Y.; Zhang, Z. Interference of heavy aerosol loading on the VIIRS aerosol optical depth (AOD) retrieval algorithm. Remote Sens. 2017, 9, 397. [Google Scholar] [CrossRef] [Green Version]
  28. Wang, Y.; Chen, L.; Xin, J.; Wang, X. Impact of the dust aerosol model on the VIIRS aerosol optical depth (AOD) product across China. Remote Sens. 2020, 12, 991. [Google Scholar] [CrossRef] [Green Version]
  29. Piazzola, J.; Bruch, W.; Desnues, C.; Parent, P.; Yohia, C.; Canepa, E. Influence of meteorological conditions and aerosol properties on the COVID-19 contamination of the population in coastal and continental areas in France: Study of offshore and onshore winds. Atmosphere 2021, 12, 523. [Google Scholar] [CrossRef]
  30. Xue, R.; Ai, B.; Lin, Y.; Pang, B.; Shang, H. Spatial and temporal distribution of aerosol optical depth and its relationship with urbanization in Shandong Province. Atmosphere 2019, 10, 110. [Google Scholar] [CrossRef] [Green Version]
  31. Lee, S.-J.; Jeong, Y.-C.; Yeh, S.-W. The lagged effect of anthropogenic aerosol on East Asian precipitation during the summer monsoon season. Atmosphere 2020, 11, 1356. [Google Scholar] [CrossRef]
  32. Abou El-Magd, I.; Zanaty, N.; Ali, E.M.; Irie, H.; Abdelkader, A.I. Investigation of aerosol climatology, optical characteristics and variability over Egypt based on satellite observations and in-situ measurements. Atmosphere 2020, 11, 714. [Google Scholar] [CrossRef]
  33. Bessho, K.; Date, K.; Hayashi, M.; Ikeda, A.; Yoshida, R. An introduction to Himawari-8/9—Japan’s new-generation geostationary meteorological satellites. J. Meteorol. Soc. Jpn. 2016, 94, 151–183. [Google Scholar] [CrossRef] [Green Version]
  34. Gupta, P.; Levy, R.C.; Mattoo, S.; Remer, L.A.; Munchak, L.A. A surface reflectance scheme for retrieving aerosol optical depth over urban surfaces in MODIS dark target retrieval algorithm. Atmos. Meas. Tech. 2016, 9, 3293–3308. [Google Scholar] [CrossRef] [Green Version]
  35. Zhao, L.; Xin, J.; Yang, L.; Si, R.; Liu, G. Validation analysis of Himawari-8 aerosol optical depth products. Chin. J. Atmos. Sci. 2020, 44, 455–471. [Google Scholar]
  36. Yang, F.; Wang, Y.; Tao, J.; Wang, Z.; Fan, M.; De Leeuw, G.; Chen, L. Preliminary investigation of a new AHI aerosol optical depth (AOD) retrieval algorithm and evaluation with multiple source AOD measurements in China. Remote Sens. 2018, 10, 748. [Google Scholar] [CrossRef] [Green Version]
  37. Oprea, S.; Martinez-Gonzalez, P.; Garcia-Garcia, A.; Castro-Vargas, J.A.; Orts-Escolano, S.; Garcia-Rodriguez, J.; Argyros, A. A review on deep learning techniques for video prediction. IEEE Trans. Pattern Anal. Mach. Intell. 2020, 1, 1109. [Google Scholar] [CrossRef] [PubMed]
  38. Geng, Y.A.; Li, Q.; Lin, T.; Jiang, L.; Zhang, Y. LightNet: A dual spatiotemporal encoder network model for lightning prediction. In Proceedings of the the 25th ACM SIGKDD International Conference, Anchorage, AK, USA, 4–8 August 2019. [Google Scholar]
  39. Zhang, X.; Lin, H.; Zhu, C.; Wang, J.; Li, M.; Xu, C.; Hu, M.; Meng, B.; Cao, C. Spatiotemporal characteristics and dynamic process analysis of epidemic diagnosis time of COVID-19 at early stage in Chinese mainland. Geomat. Inf. Sci. Wuhan Univ. 2020, 45, 791–797. [Google Scholar]
  40. Liu, Z.; Qian, J.; Du, Y.; Wang, N.; Yi, J.; Sun, Y.; Ma, T.; Pei, T.; Zhou, C. Multi-level spatial distribution estimation model of the inter-regional migrant population using multi-source spatio-temporal big data: A case study of migrants from Wuhan during the spread of COVID-19. J. Geo-Inf. Sci. 2020, 22, 147–160. [Google Scholar]
  41. Boersma, K.F.; Eskes, H.J.; Ee Fkind, J.P.V.; Brinksma, E.J.; Van, D.; Sneep, M.; Van, D.; Levelt, P.F.; Stammes, P.; Gleason, J.F. Near-real time retrieval of tropospheric NO2 from OMI. Atmos. Chem. Phys. 2012, 6, 2103–2118. [Google Scholar]
  42. Russell, A.R.; Valin, L.C.; Cohen, R.C. Trends in OMI NO2 observations over the United States: Effects of emission control technology and the economic recession. Atmos. Chem. Phys. 2012, 12, 12197–12209. [Google Scholar] [CrossRef] [Green Version]
  43. Rao, Y.; Yang, J. Analysis on spatial and temporal evolution of industrial land under industry classification in Wuhan City. Resour. Environ. Yangtze Basin 2020, 29, 1525–1534. [Google Scholar]
Figure 1. Flow chart of the AOD inversion algorithm.
Remotesensing 14 00696 g001
Figure 2. Schematic diagram of the E3D–LSTM network.
Remotesensing 14 00696 g002
Figure 3. Eidetic 3D–LSTM module.
Remotesensing 14 00696 g003
Figure 4. Schematic diagram of the experimental area.
Remotesensing 14 00696 g004
Figure 5. Four key periods in our experimental analysis.
Remotesensing 14 00696 g005
Figure 6. Prediction of missing values using a spatiotemporal prediction model.
Remotesensing 14 00696 g006
Figure 7. Spatial distribution of mean AOD across four periods in 2019 and 2020.
Remotesensing 14 00696 g007
Figure 8. Spatial distribution of mean AOD differences between 2019 and 2020.
Remotesensing 14 00696 g008
Figure 9. Spatial distribution of NO2 mean difference between 2019 and 2020.
Remotesensing 14 00696 g009
Figure 10. Time variation trends of AOD and NO2 in Hubei Province from 2019 to 2020.
Remotesensing 14 00696 g010
Figure 11. Correlation analysis between AOD and NO2.
Remotesensing 14 00696 g011
Table 1. Main parameters of the AHI.
Spectral RangeChannel (Center Wavelength (μm))Resolution (km)
Visible bands1, 2 (0.46, 0.51)1
3 (0.64)0.5
Near-infrared4, 5 (0.86, 1.60)1
6 (2.30)2
Infrared7–16 (3.90, 6.20, 7.00, 7.30,
8.60, 9.60, 10.40, 11.20, 12.30, 13.30)
2
Table 2. Changes in air pollutants in Hubei Province from 2019 to 2020.
Air PollutantNormalLockdownRecovering 1Recovering 2
AOD (mean)−13.55%−71.49%−1.33%−14.01%
NO2 (mean)−50.32%−29.35%−20.50%−1.16%
AOD (std)1.77%12.39%4.28%−16.80%
NO2 (std)−58.47%−30.52%−25.67%3.38%
Publisher’s Note: MDPI stays neutral with regard to jurisdictional claims in published maps and institutional affiliations.

