Article

Early Detection of Basal Stem Rot Disease in Oil Palm Tree Using Unmanned Aerial Vehicle-Based Hyperspectral Imaging

1
Faculty of Science, Hokkaido University, Sapporo 001-0021, Japan
2
Faculty of Engineering and Technology, Multimedia University, Melaka 75450, Malaysia
3
iRadar Sdn Bhd, Jalan Eco 1, Zon Industri Ayer Keroh Baru, Melaka 75450, Malaysia
4
FGV R&D Sdn Bhd, Jalan Raja Laut, Kuala Lumpur 50350, Malaysia
*
Author to whom correspondence should be addressed.
Remote Sens. 2022, 14(3), 799; https://doi.org/10.3390/rs14030799
Submission received: 5 January 2022 / Revised: 1 February 2022 / Accepted: 3 February 2022 / Published: 8 February 2022
(This article belongs to the Section Remote Sensing in Agriculture and Vegetation)

Abstract

:
Early detection of basal stem rot (BSR) disease in oil palm trees is important for the sustainable production of palm oil in the limited land for plantation in Southeast Asia. However, previous studies based on satellite and aircraft hyperspectral remote sensing could not discriminate oil palm trees in the early-stage of the BSR disease from healthy or late-stage trees. In this study, hyperspectral imaging of oil palm trees from an unmanned aerial vehicle (UAV) and machine learning using a random forest algorithm were employed for the classification of four infection categories of the BSR disease: healthy, early-stage, late-stage, and dead trees. A concentric disk segmentation was applied to tree crown segmentation at the sub-plant scale, and recursive feature elimination was used for feature selection. The results revealed that the classification performance for the early-stage trees is maximum at the specific tree crown segments, and only a few spectral bands in the red-edge region are sufficient to classify the infection categories. These findings will be useful for future UAV-based multispectral imaging to efficiently cover a wide area of oil palm plantations for the early detection of BSR disease.

1. Introduction

Elaeis guineensis Jacq. is commonly known as African oil palm and is also simply called “oil palm”. It is a major species of palm oil crop [1]. Oil palm trees grow up to 20 m in height and the tree crowns expand to 10 m in diameter. The leaves, which are termed as fronds, are arranged spirally along the tree trunk. Viewed from above, the fronds extend radially from the center to the edge of the tree crown. A fresh frond emerges from the top of the trunk, called a spear. Fruit bunches, each comprising a few thousand individual fruits, are harvested from the base of fronds all year round. Crude palm oil is extracted from the mesocarp of the oil palm fruit, which provides a higher oil yield than other oil crops [2]. Commercial oil palm plantations have an average lifetime of 25 years, of which 21–23 years are productive, with peak oil yields of 12 tons ha−1 year−1 [3].
Palm oil is widely used for frying and is a constituent of food products, detergents, cosmetics, and biofuels [4]. The global production of palm oil is the largest among vegetable oils, increasing from 18 million tons in 1998 to 71 million tons in 2018 [5]. Indonesia and Malaysia are the two main producers of palm oil. Their combined production represents more than 80% of global production. In these two countries, biophysical suitability for oil palm in terms of climate, soil, topography, and other factors has resulted in the rapid expansion of the oil palm planting area in the last two decades. The oil palm harvesting area increased from 2.4 million ha to 11.3 million ha in Indonesia and from 2.6 million ha to 5.3 million ha in Malaysia between 1998 and 2018 [6]. However, Indonesia might face scarcity of available land for sustainable palm oil production in the next decade, and Malaysia has already suffered from the scarcity of land resources [7].
Basal stem rot (BSR) disease, caused by the pathogenic fungus Ganoderma boninense, is one of the most serious diseases affecting the oil palm, especially in Southeast Asia. BSR disease damages the trunk xylem tissue and interrupts the distribution of water and nutrients in the tree; hence, the infected tree exhibits a variety of symptoms, such as yellowing and necrotic leaves, unopened spears, small crowns, and skirt-like crown shapes [8]. The disease progresses slowly over years in a tree, but its infection spreads rapidly among neighboring trees, predominantly by airborne spores [9,10]. The yield loss of oil palm by BSR disease is severe in Indonesia and Malaysia, where trees over 15 years after planting have a mortality rate of up to 80% [3]. There is still no effective treatment for BSR disease in the late stages other than the removal of infected trees along with contaminated soil [11]. Therefore, early detection of infected trees is important not only for reducing significant economic losses from tree removal but also for sustainable production of palm oil in the limited land for plantation. However, as the symptoms are not clearly seen in early-stage trees, it is difficult for farmers to detect the infection by visual inspection until the late stages.
Remote sensing with optical imaging sensors is useful for the detection of plant diseases [12]. Many studies have reported the feasibility of optical remote sensing in detecting BSR disease [13]. Santoso et al. used QuickBird satellite multispectral imagery to create machine learning models for the classification of BSR disease infection at the plant scale, and reported that an overall accuracy of 91% using the random forest model [14]. However, it was possible only when oil palm trees showed severe symptoms corresponding to the late stage. Presumably, the spatial and spectral resolutions of the QuickBird imagery with a ground sample distance of 2.4 m and spectral band widths of 60–140 nm were not sufficient for early detection. In addition to satellite remote sensing, aircraft-based hyperspectral imaging has also been applied to detect BSR disease [15,16]. Although the spatial and spectral resolutions of the airborne hyperspectral imagery with a ground sample distance of approximately 1 m and band widths of <10 nm were much higher than those of the satellite imagery, they could not discriminate early-stage trees with high accuracy. On the contrary, ground-based hyperspectral measurements at the leaf scale by portable spectrometers showed good classification performance, even in the early stages [8,17,18,19]. When overviewing these past studies using optical remote sensing for BSR disease detection, it is reasonable to assume that certain thresholds of spatial and spectral resolutions exist for early detection.
In this study, hyperspectral imaging of oil palm trees from an unmanned aerial vehicle (UAV) was applied for early detection of BSR disease. UAV-based remote sensing has a higher spatial resolution than satellite and aircraft remote sensing, and larger spatial coverage than ground-based hyperspectral measurements. In addition, UAV-based remote sensing has a great advantage over satellite remote sensing in relatively high cloud cover areas, such as Southeast Asia, particularly during monsoon seasons. It has already been used for studies on individual tree detection, growth monitoring, and disease monitoring in oil palm plantations [20,21,22,23,24]. However, few studies addressed UAV-based hyperspectral imaging for the detection of BSR disease in oil palm trees.
The objectives of this study were: (1) to investigate the spectral features of the BSR disease-infected oil palm trees at the sub-plant scale; (2) to classify the asymptomatic and early-/late-stage trees using machine learning algorithm; and (3) to select useful spectral bands for early detection of the infected trees.

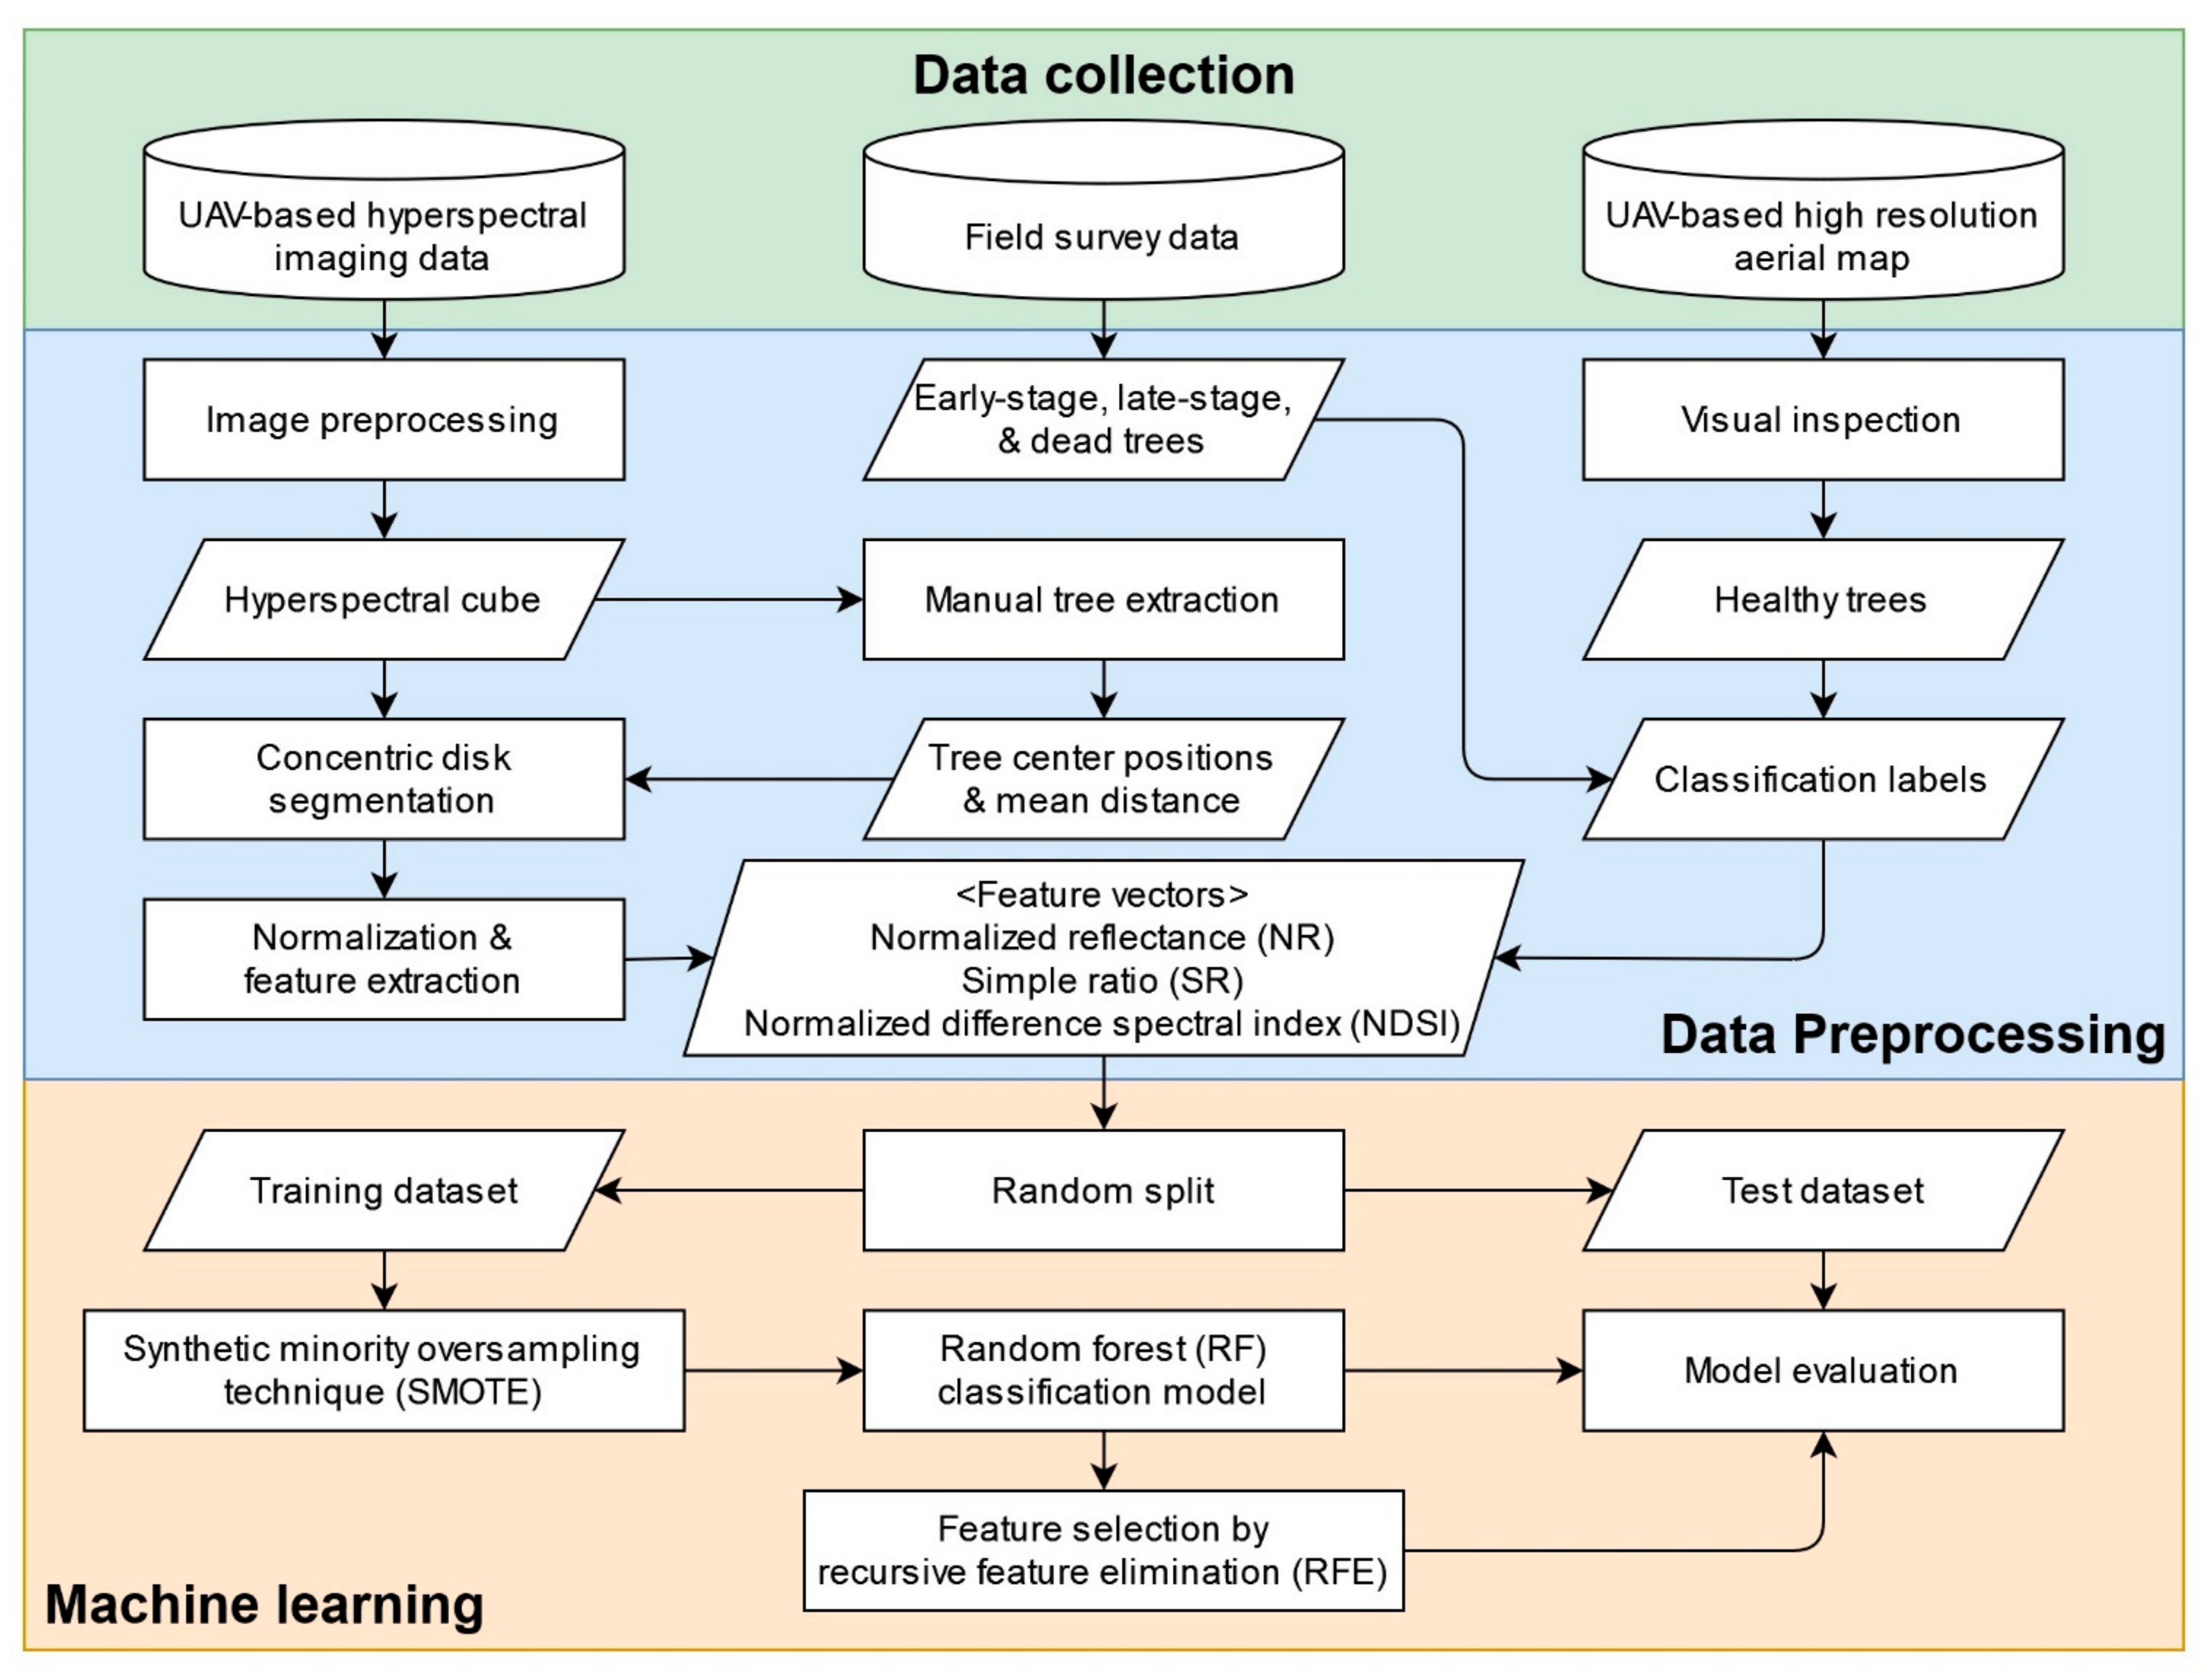
2. Materials and Methods

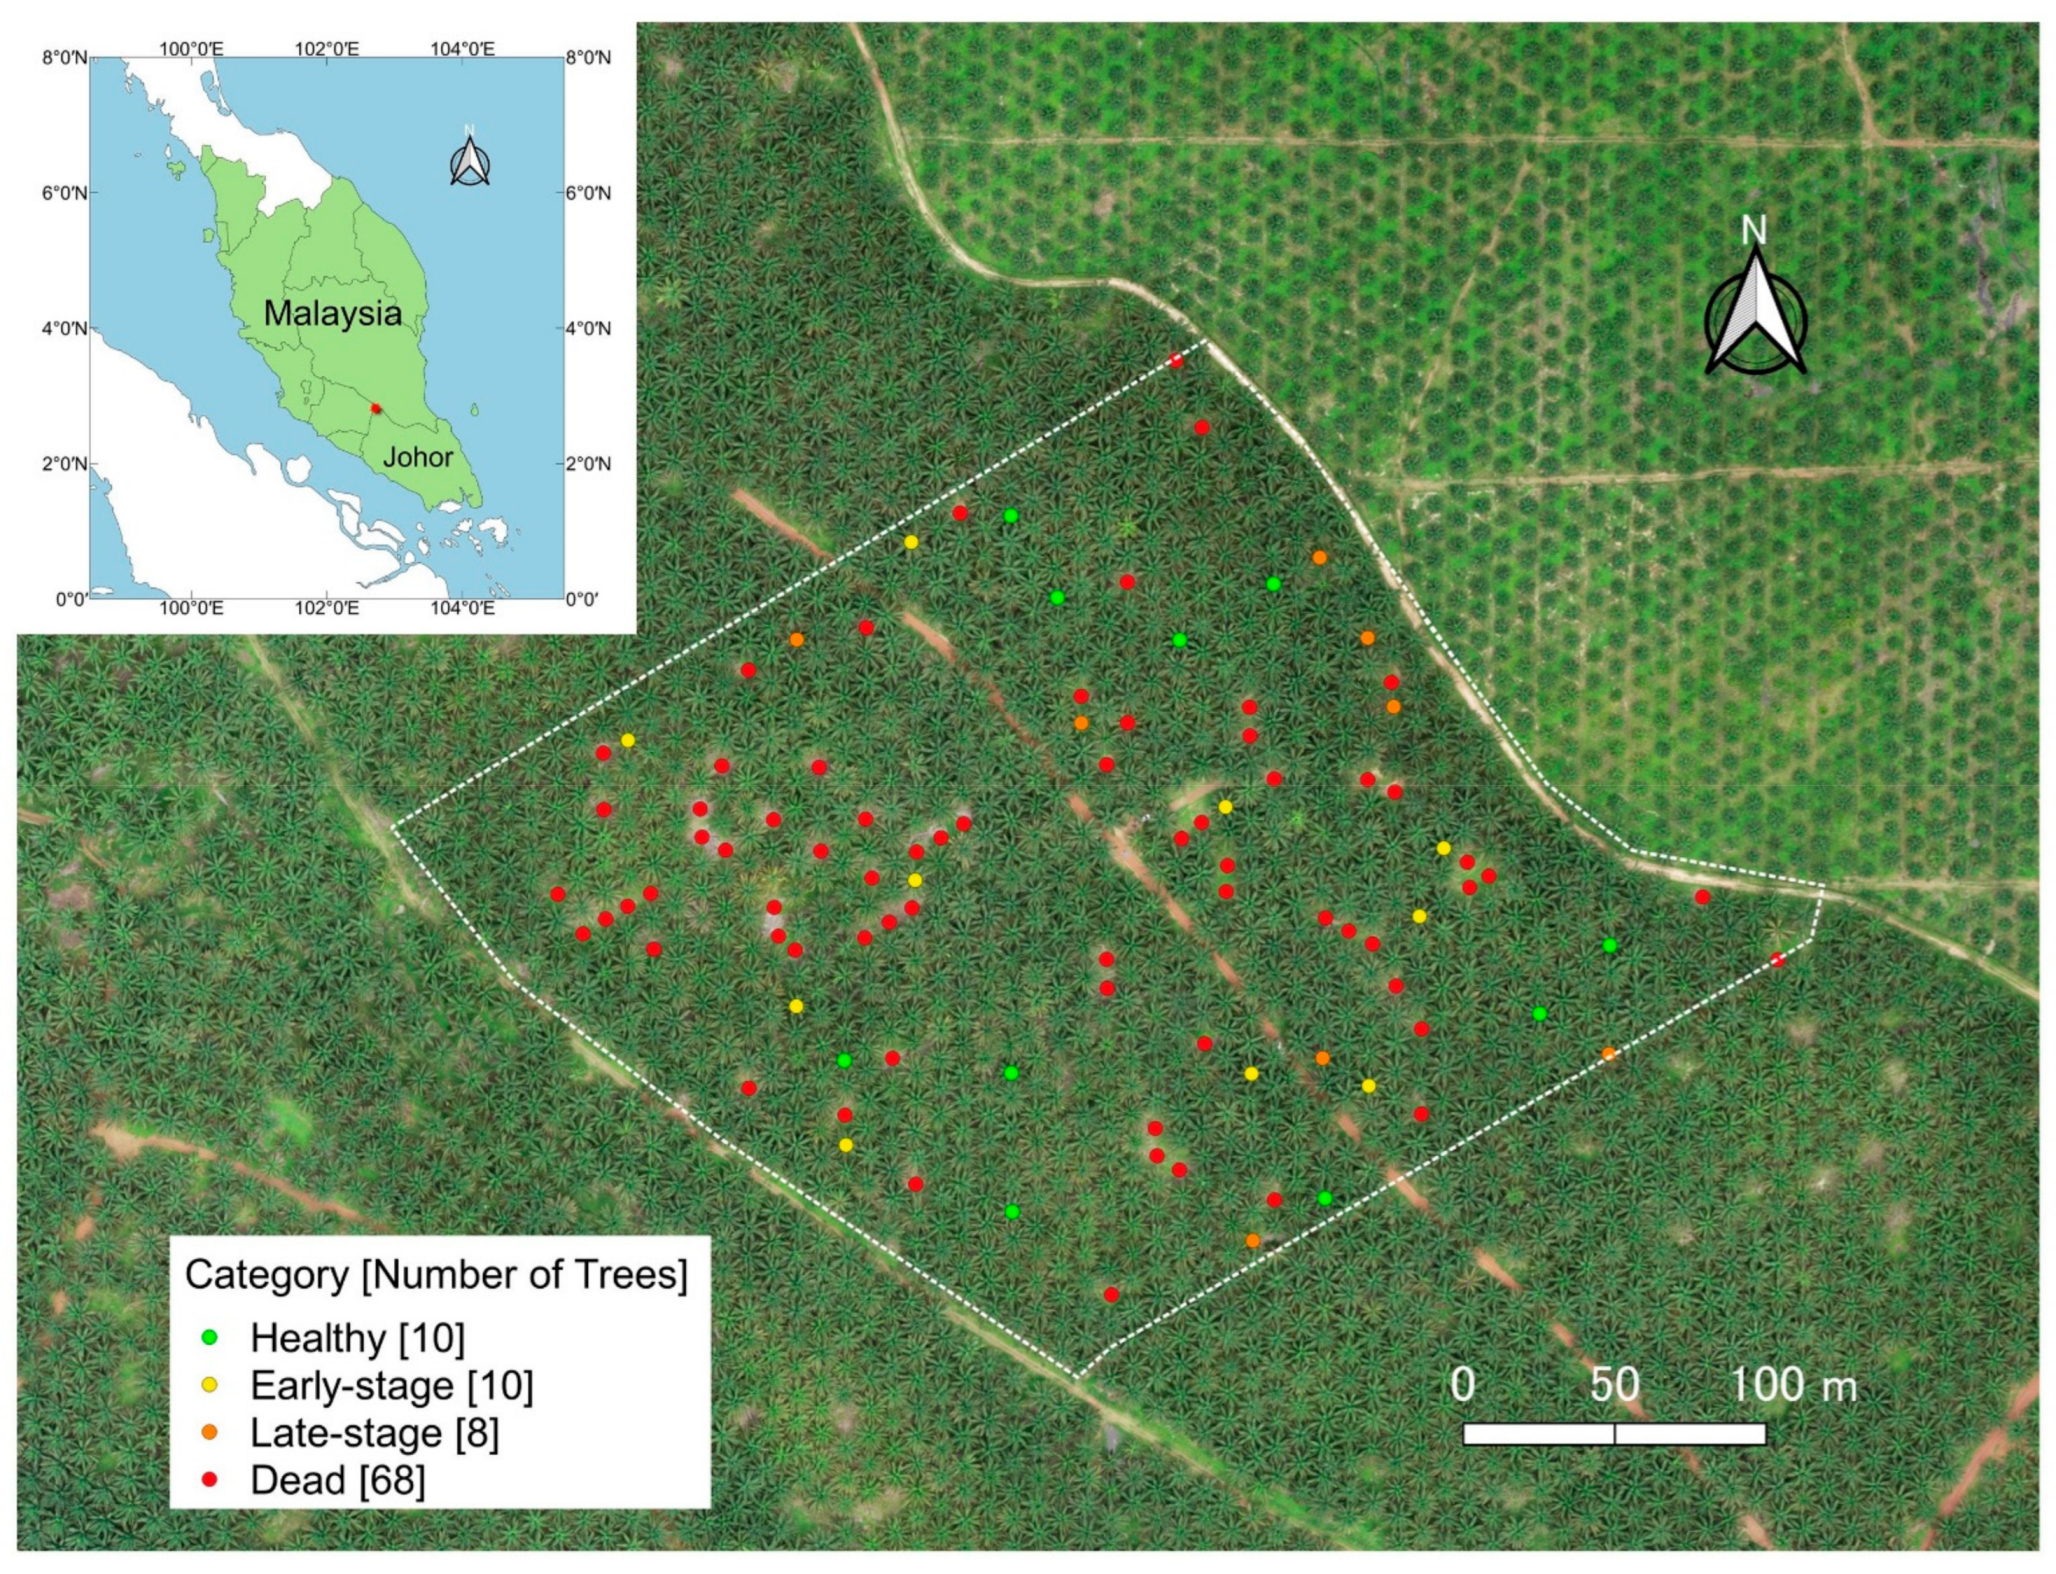
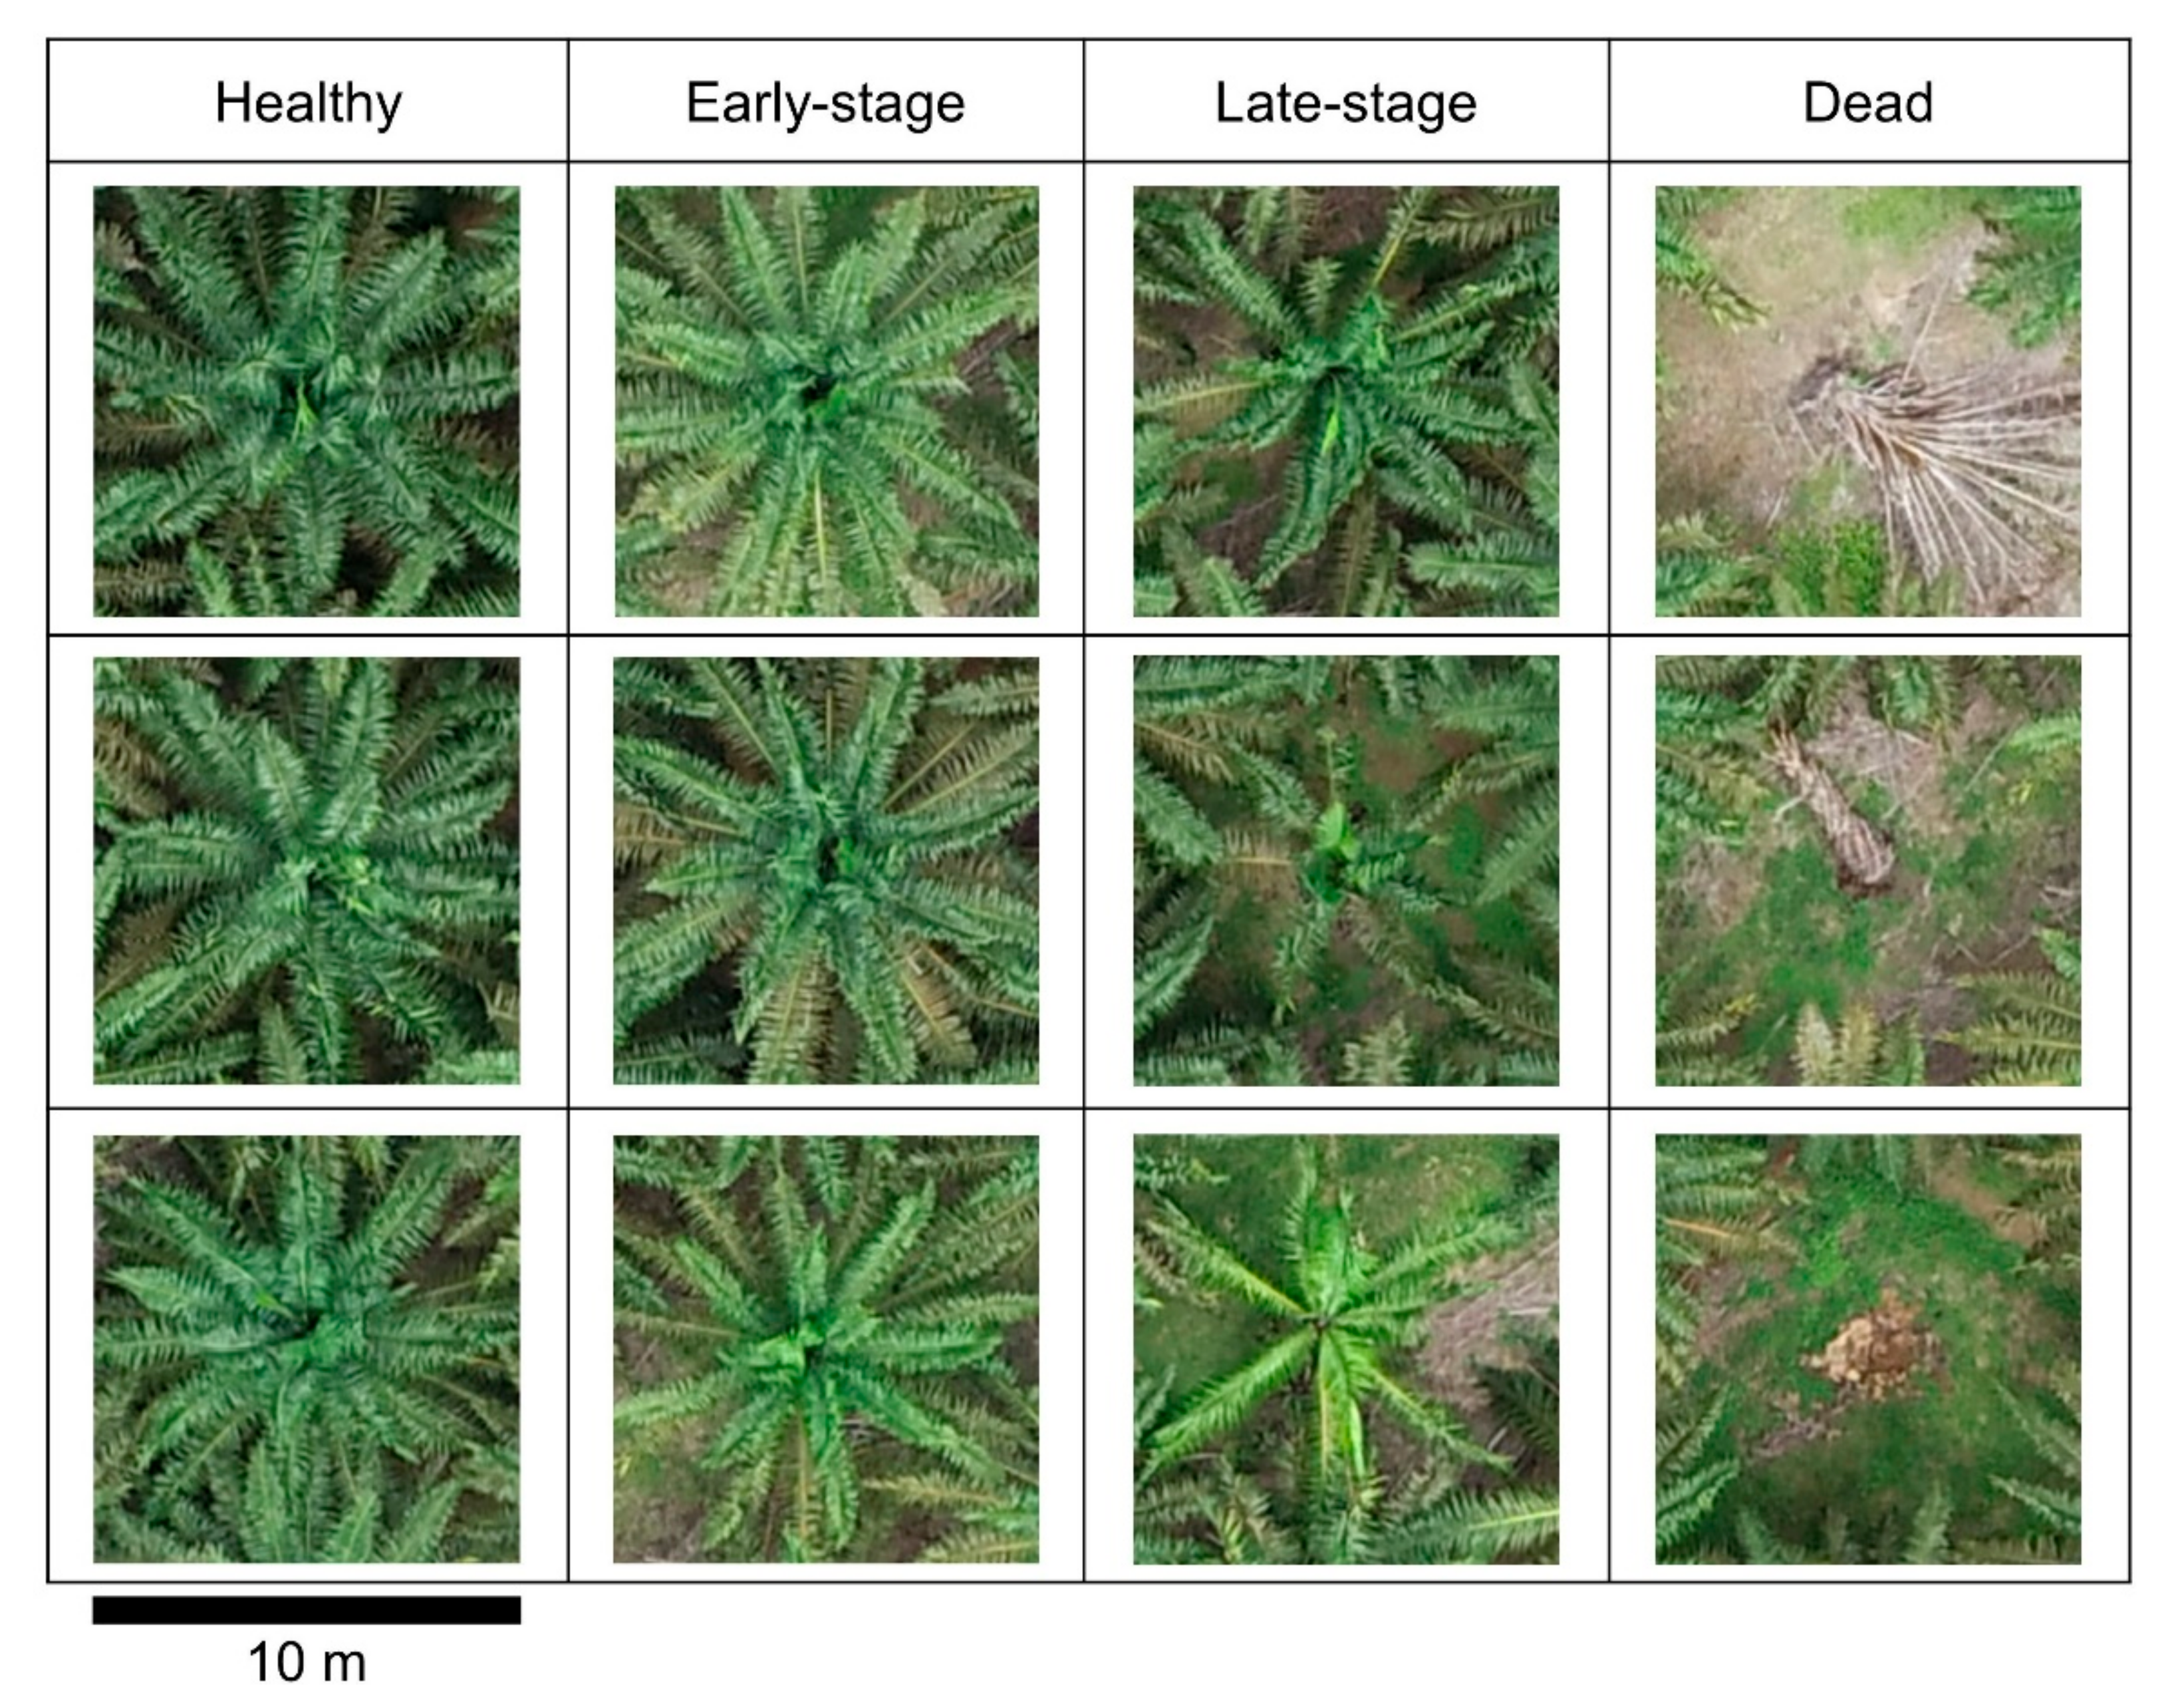
2.1. Study Area and Field Survey

The UAV-based hyperspectral imaging campaign was performed between 7–9 November 2018. The studied site (2°49′24″ N, 102°42′51″ E) is located in an oil palm plantation in Segamat district, north of Johor, Malaysia (Figure 1). This plantation is managed by the FGV R&D Sdn. Bhd., a research arm of the world’s third largest oil palm plantation operator. The site is nestled between two farm roads running from northwest to southeast. Along these roads, another farm road crosses the center of the site. The site has 1113 oil palm trees planted 13 years ago in an area of 8 ha. The trees were planted in triangular patterns at approximately 9 m intervals. The planting density of 139 trees ha−1 at this site is the average for commercial oil palm plantations on flat terrain.
All the trees in the site were inspected visually by eight experienced staff members for 3 h in the morning of the first day of the campaign on 7 November 2018. When the staff members found a tree infected by BSR disease, they recorded the geographical information of the tree. The infected trees were classified into three categories: early-stage, late-stage, and dead trees (Table 1). The category of dead trees included collapsed trees leaving a fallen tree or only a tree stump on the ground. Even if a tree was already removed from the originally planted position, the geographical information of the tree was labeled as a dead tree.
Separately from hyperspectral imaging, a high spatial resolution aerial map of the entire site was produced using a red, green, and blue (RGB) color camera on a DJI Phantom 4 Pro quadcopter (SZ DJI Technology Co., Ltd., Shenzhen, China). The spatial resolution of the map was approximately 50 mm. From this high spatial resolution map, asymptomatic trees that (1) did not show any visible symptoms of the BSR disease and (2) not adjacent to trees in the categories of early-stage, late-stage, and dead trees were classified manually into the category of healthy trees. Figure 2 shows an example of tree crown images extracted from the high spatial resolution map. Even from these images, trees categorized into late-stage and dead trees were recognized easily by their appearance. However, the healthy and early-stage trees showed only a slight difference in their appearance.

2.2. Hyperspectral Imaging and Data Acquisition

A sequential two-dimensional (2D) imager (Genesia Corp., Tokyo, Japan), which changes spectral bands sequentially using a tunable filter, was used for UAV-based hyperspectral imaging. This sequential 2D imager used a liquid crystal tunable filter technology for wavelength scanning and a monochrome charge-coupled device image sensor for 2D imaging. The central wavelength of the spectral bands was sequentially tunable from 460 to 780 nm at a minimum interval of 1 nm with a typical frame rate of 0.5–1 s. The band width increased linearly from 6 to 23 nm with the wavelength. A diagonal field of view (FOV) of the imager is 90° and each image had 656 × 494 pixels. When a flight altitude was 100 m, the imager covered an area of 160 m × 120 m on the ground with a spatial resolution of 0.24 m. Detailed specifications of the imager are described elsewhere [25].
The imager was mounted on a DJI Agriculture Series drone with a maximum flight time of up to 20 min. The UAV and the imager were controlled remotely from a temporary research base in an open space near the center of the study site, where the takeoff and landing of the UAV occurred safely. Among the eight flights in the campaign, two flights on November 7 and six flights on November 8–9 had flight altitudes of 50–60 m and 90–100 m, respectively (Table 2). These low and high flight altitudes caused the acquired images to have two different spatial resolution ranges of 0.12–0.14 m and 0.22–0.24 m, respectively. In each flight, the planned UAV flight route included several waypoints where the UAV remained motionless for a few minutes to permit sequential imaging, creating a scene of the hyperspectral imagery above each waypoint. Two adjacent waypoints were arranged to produce overlap of their scenes by at least 40%. A wavelength scanning of the imager was operated at 10 nm intervals. Thus, a sequence of 33 spectral bands was acquired within 30–40 s. From several sequences acquired at a waypoint, only the highest quality sequence was manually selected as a scene of the waypoint. A total of 73 scenes were obtained during the campaign.

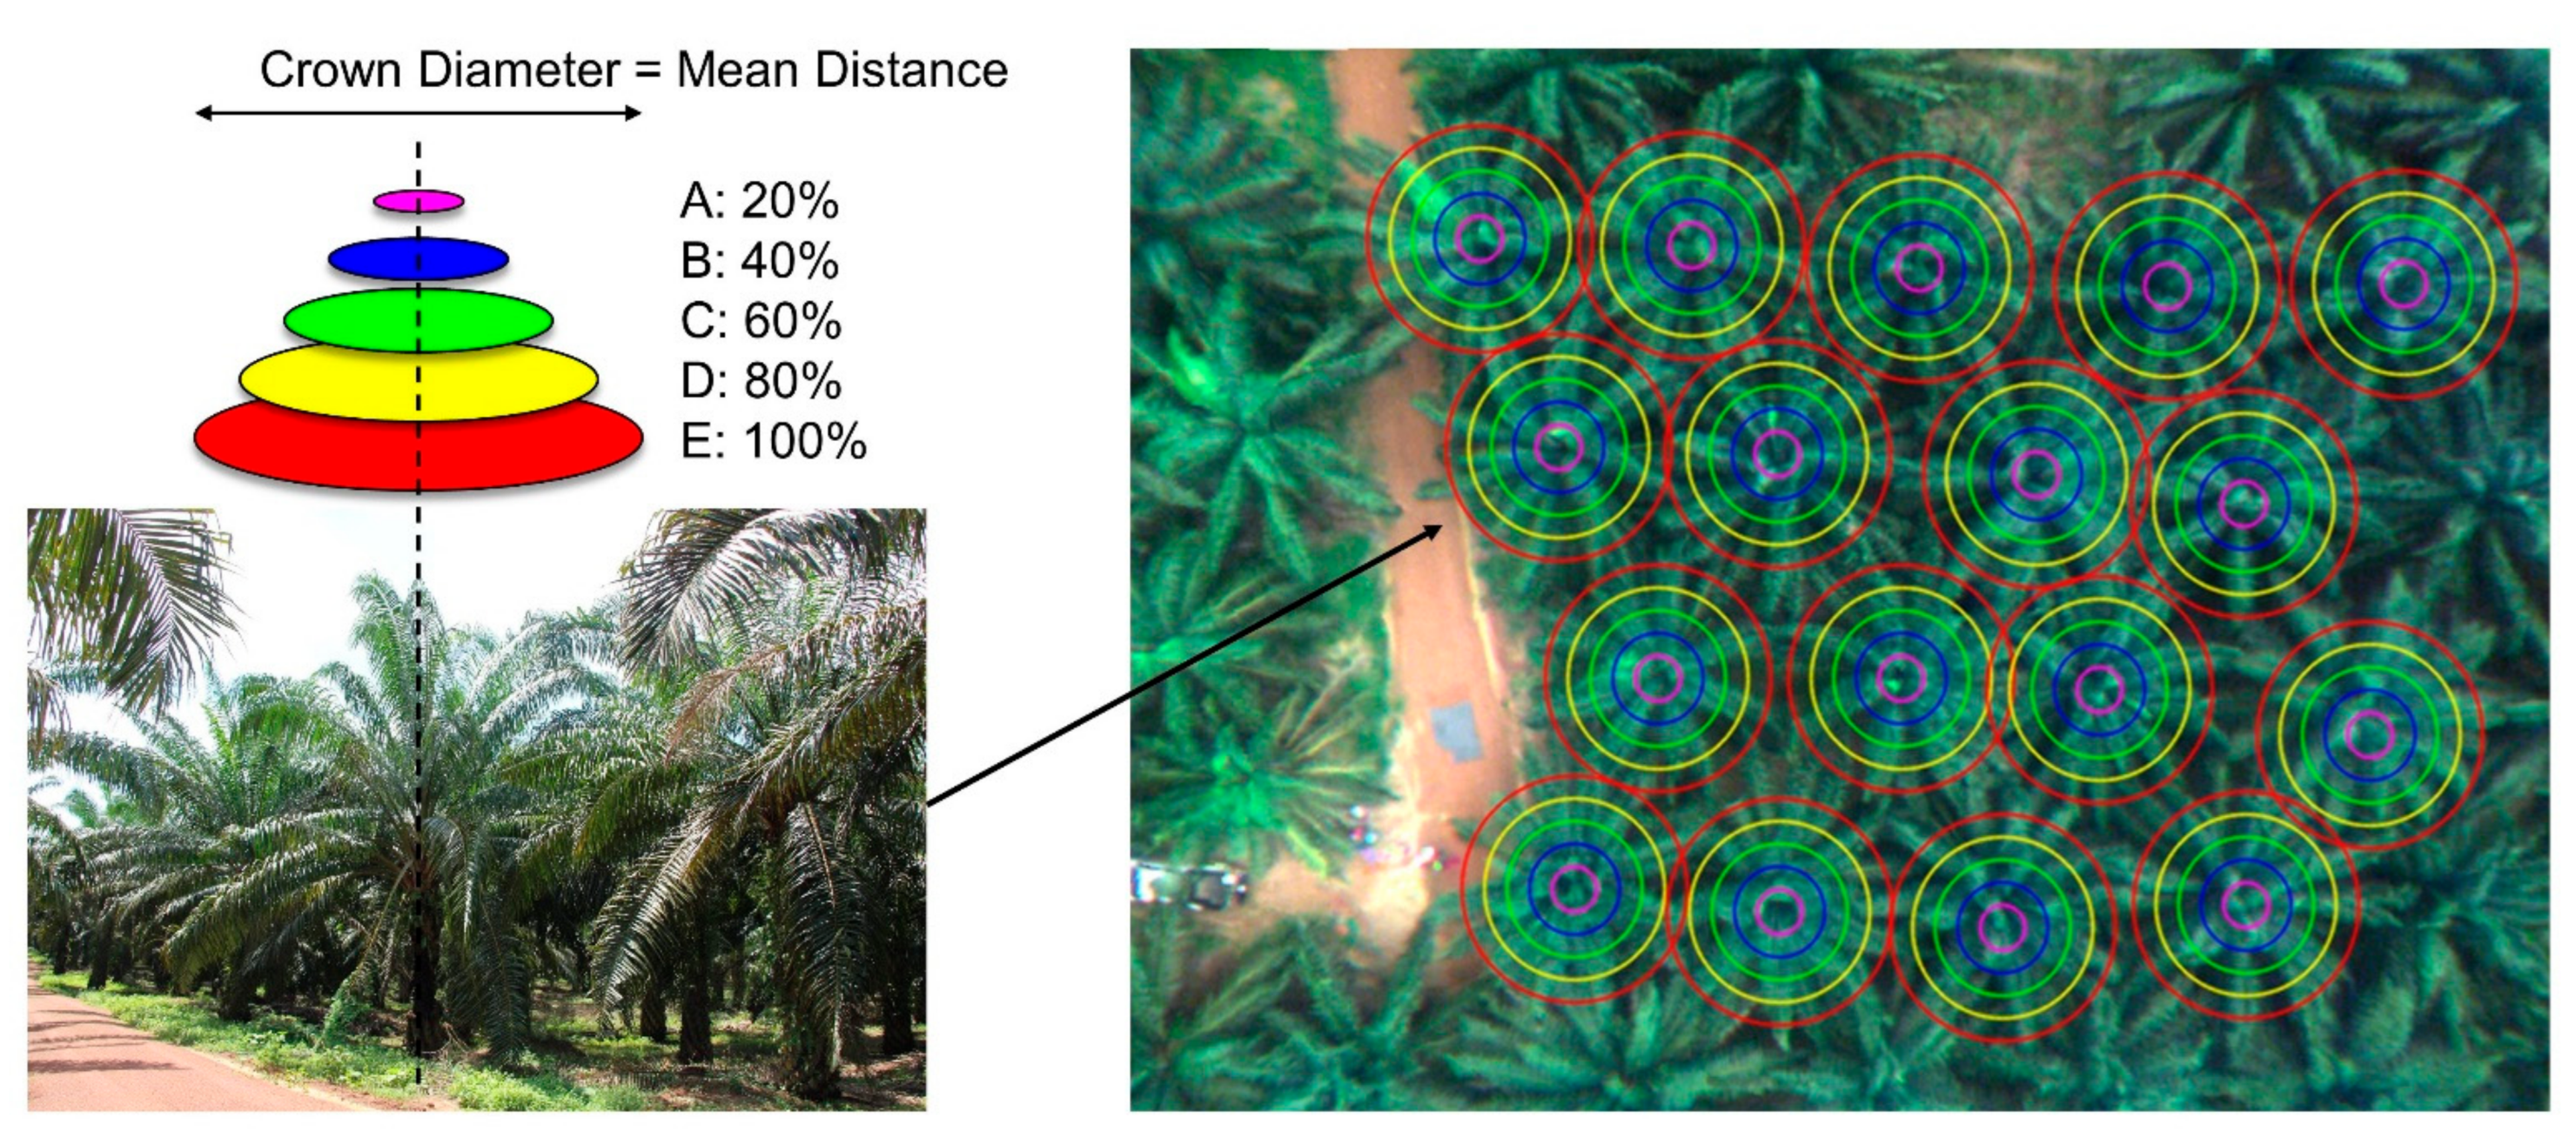
2.3. Image Processing

The acquired hyperspectral imagery was preprocessed in four steps. In the first step, digital numbers of the pixels in each image were converted to spectral radiance values by radiometric correction, whose calibration dataset was obtained separately by a laboratory experiment using a HELIOS USLR-D12LNMNN uniform light source (Labsphere, Inc., North Sutton, NH, USA). In the second step, significant barrel distortion of each image originating from the wide FOV of the imager was removed by distortion correction, whose camera calibration parameters were obtained separately by a laboratory experiment with a chessboard pattern imaging and related algorithms in the OpenCV open-source library [26]. In the third step, misregistration of the sequential images caused by attitude fluctuations of the UAV during the sequential imaging was corrected by band-to-band registration using feature-based matching algorithms available from the OpenCV library. In the fourth step, spectral radiance values of the pixels in each image were converted to spectral reflectance values using a reflectance reference target, whose spectral reflectance was measured separately by a portable spectroradiometer ASD FieldSpec 4 (Analytical Spectral Devices, Inc., Longmont, CO, USA). Detailed methods of image preprocessing are described elsewhere [25]. The image preprocessing produced a reflectance-based hyperspectral cube in each scene.
Individual tree detection is a practical application of remote sensing for forestry and forest management. Many approaches have been developed for oil palm tree counting based on image processing [27,28], machine learning [29], and deep learning [30]. However, in commercial oil palm plantations, mature oil palm trees densely cover the planting area, and their fronds partially overlap with adjacent trees. Thus, automatic extraction of mature tree crowns is not easy compared to young tree crowns, which have plenty of space between them. Moreover, automatic extraction of tree crowns might fail to work for dead trees, which lose the typical shape of tree crowns. On the contrary, as the fronds of an oil palm tree extend radially from the center of the tree crown, the center position can be easily recognized from above. Taking advantage of this feature for individual tree detection, pixels corresponding to the center positions of individual tree crowns were recorded manually in each scene. To increase the number of samples extracted from a relatively small number of trees in this study, each scene was analyzed separately instead of making a single mosaic of different scenes. A total of 303 samples were extracted from the 73 scenes, including duplicate counting of the same tree in different scenes (Table 1).
To investigate the reflectance spectra of individual oil palm trees at the sub-plant scale, concentric disk segmentation was applied to tree crown segmentation. Since the spatial resolution of the acquired images varies with the flight altitude, the pixel unit distance between the center positions of two adjacent trees also changes. The mean pixel unit distance of all the trees in each scene was calculated from their center positions. This value was utilized as an alternative indicator of the mean crown diameter in the scene. In terms of the measurable length, the mean crown diameter was approximately 9 m. Figure 3 shows the tree crown segmentation by concentric disks labeled A, B, C, D, and E, with 20%, 40%, 60%, 80%, and 100% of the mean distance, respectively. As shown in Figure 3, disk segments D and E of the tree crowns overlapped partially with those of the adjacent trees. However, segment C and smaller segments of the tree crowns were isolated from the adjacent trees. The mean reflectance spectra of each segment were calculated from the hyperspectral cube of the scene.

2.4. Normalization and Feature Extraction

Although the reflectance spectra of the same concentric disk in the same oil palm tree should be invariant with the scenes, they varied with the scenes primarily due to the sky conditions (clouds). As the UAV was not equipped with downwelling irradiance sensors, the measured spectral radiance was converted to spectral reflectance using the reflectance reference target. The UAV-based hyperspectral imaging of the target from above the temporal research base (Figure 3) was conducted at the beginning of every flight. However, solar irradiance on tree crowns changes spatially and temporally due to sky conditions during flight. To investigate the reflectance spectra and use them as a feature vector in machine learning, the spectral reflectance value was normalized to the total reflectance, calculated as:
NR(λi) = R(λi)/Σi R(λi),
where NR(λi) and R(λi) are the normalized and original spectral reflectance values, respectively, at the central wavelength λi of the i-th spectral band.
In addition to the normalized reflectance (NR), the simple ratio (SR) and normalized difference spectral index (NDSI) were also employed as feature vectors. SR and NDSI were derived from the spectral reflectance values of the two spectral bands, as follows:
SR(λi, λj) = R(λj)/R(λi),
NDSI(λi, λj) = [R(λj) − R(λi)]/[R(λj) + R(λi)],
where R(λi) and R(λj) are the spectral reflectance values of the i-th and j-th spectral bands, respectively. Note that the normalized and original spectral reflectance values result in the same values for the SR and NDSI. All combinations of two spectral bands drawn from 33 spectral bands (33C2 = 528) were assigned to SR and NDSI. Instead of using specific spectral indices, such as the normalized difference vegetation index and photochemical reflectance index, informative spectral indices can be explored exhaustively using SR and NDSI. In addition to these three feature vectors, all the features from the three feature vectors (1089 features in total) were used as feature vectors.

2.5. Classification and Evaluation

A random forest (RF) classification algorithm [31] was employed for supervised machine learning of the hyperspectral dataset. RF is an ensemble learning method that builds an ensemble of decision tree classifiers trained from the sub-samples of a training dataset. RF has been successfully applied to classify hyperspectral dataset in remote sensing [32]. In this study, the RF algorithm was implemented using the scikit-learn machine learning library [33] in Python 3.7 [34] with default parameters.
The hyperspectral dataset was divided into five disk segment A, B, C, D, and E, and the three feature vectors of NR, SR, and NDSI were calculated for each segment. Each dataset was randomly split into training and test subsets at a ratio of 0.75:0.25, with equal frequencies of class labels corresponding to the four infection categories of healthy, early-stage, late-stage, and dead trees. However, the number of minor samples labeled as late-stage trees was <10% of the number of major samples labeled as dead trees (Table 1). If a classification model is trained using this imbalanced dataset, the created model would be strongly biased toward the majority class. To overcome this problem, the synthetic minority oversampling technique (SMOTE) [35] was applied to the training subset using the imbalanced-learn library [36]. As a result, the number of training subsets increased to 227 samples per class, which is equal to the training samples in the initial majority class. In contrast, the test subsets remained highly imbalanced, and the number of test samples in the minor class were only five. The training and evaluation procedure was repeated 100 times to stabilize the evaluation results against random partitions of the dataset.
The performance of the trained model to predict classes was evaluated using performance metrics of precision, recall, F1-score, overall accuracy, and Cohen’s kappa coefficient. Precision is defined as the number of true positives (TP) divided by the sum of the numbers of TP and false positives (FP):
Precision = TP/(TP + FP).
Recall is defined as the number of TP divided by the sum of the number of TP and false negatives (FN):
Recall = TP/(TP + FN).
The F1-score is defined as the harmonic mean of precision and recall:
F1-score = 2 · precision · recall/(precision + recall).
In a multinomial classification, the precision, recall, and F1-score are performance metrics for each class, as in the case of binary classification. On the other hand, the overall accuracy and Cohen’s kappa coefficient are performance metrics for all classes. The overall accuracy (OA) is defined as the sum of the number of true positives in each class (TPi) divided by the total number of samples (Nt):
OA = Σi TPi/Nt.
The Cohen’s kappa coefficient (κ) is calculated by:
κ = (OAEA)/(1 − EA).
where EA is the expected accuracy, which is defined as the accuracy achieved by a random classifier, calculated as:
EAi ((TPi + FPi) (TPi + FNi)/Nt2).
In contrast to the overall accuracy, Cohen’s kappa coefficient considers the imbalance in class distribution.

2.6. Feature Selection

To select useful spectral bands for the early detection of infected trees, the recursive feature elimination (RFE) method was applied to feature selection of the hyperspectral dataset. RFE is a type of wrapper method that uses a machine learning algorithm to find optimal features [37]. In this study, RF was used as the selection algorithm, and RFE was implemented using the scikit-learn library. Initially, an RF classification model was trained on the entire set of features in the training subset, and the importance of each feature was obtained from the results of the RF classification. Subsequently, backward feature selection was performed recursively by eliminating the least important features based on the obtained importance. Finally, the specified number of the optimal features were selected. The performance of the trained model for the test subset was evaluated at each selection step, and the feature selection procedure was repeated 100 times to obtain a stabilized result.
The materials and methods used in this study are summarized in Figure 4.

3. Results

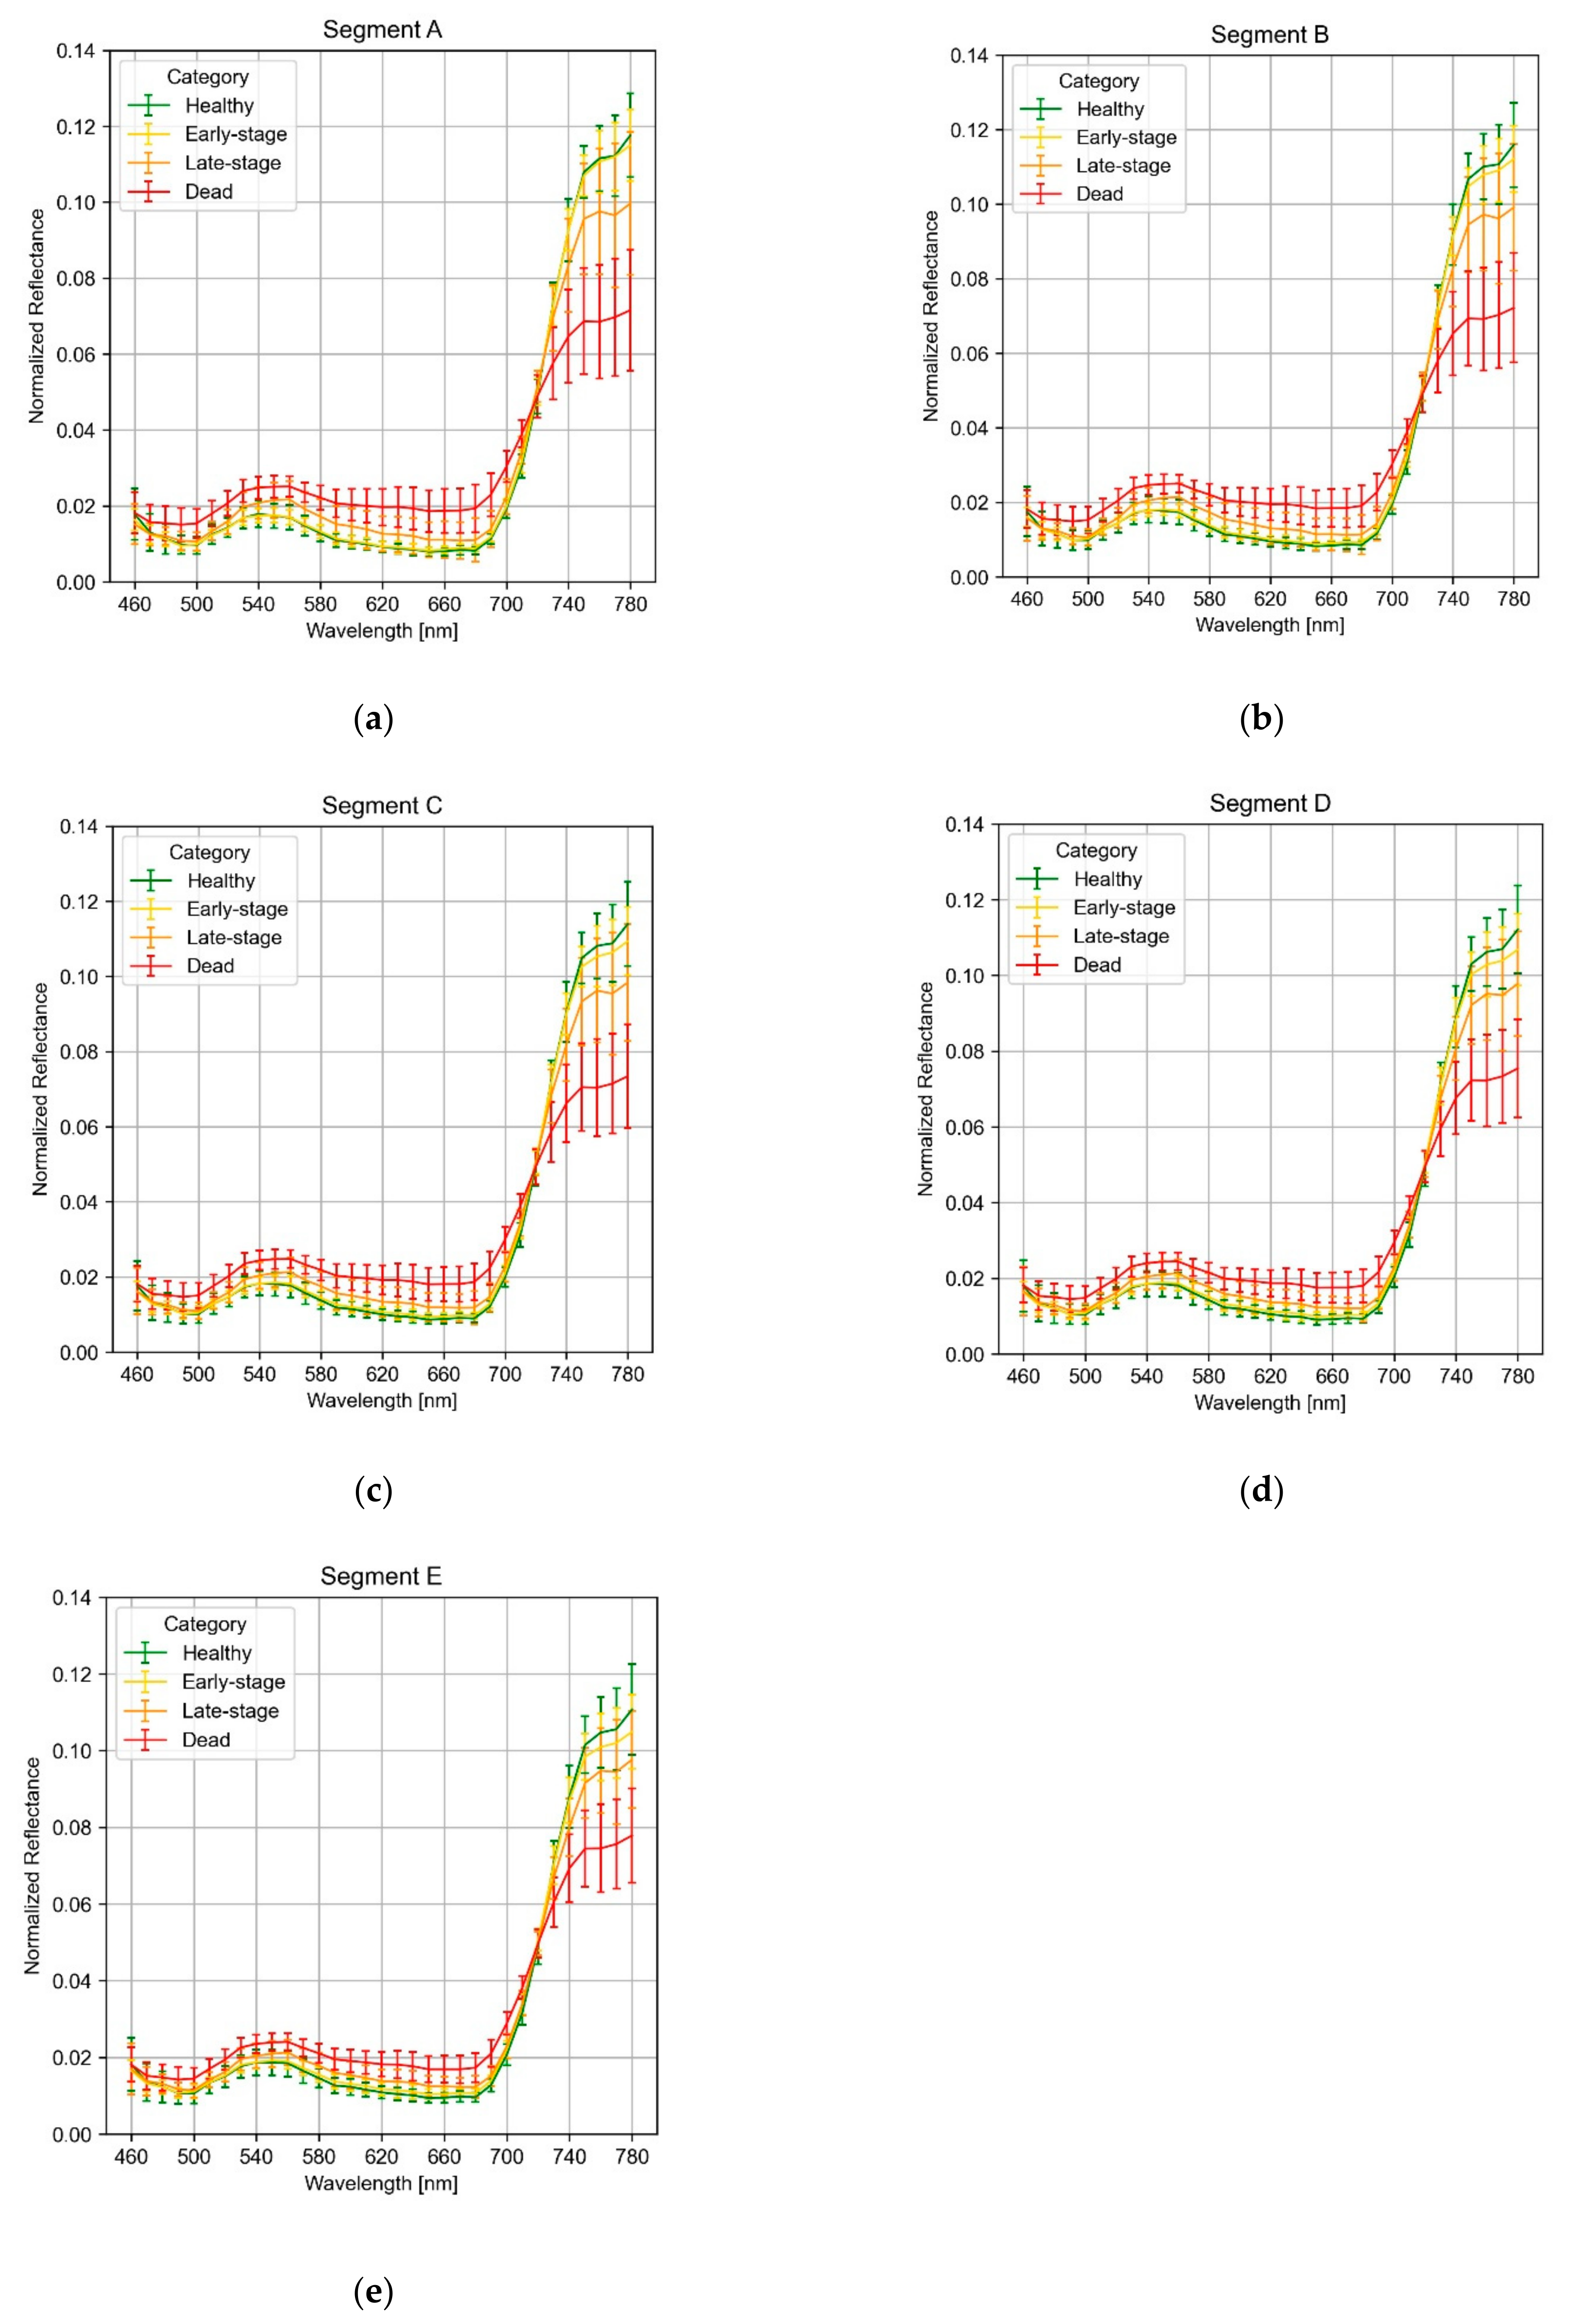
3.1. Spectral Normalization and Mean Spectra

Figure 5 shows the reflectance spectra of an oil palm tree, which was the most frequently acquired in different scenes (12 scenes). This tree was categorized as a dead tree, and the reflectance spectra were calculated for the concentric disk segment E. The original reflectance spectra in Figure 5a varied significantly from scene to scene by a factor of up to five. These variations were probably caused by changes in sky conditions during the flight. Figure 5b shows the NR spectra of the same tree, calculated according to Equation (1). In contrast to the original reflectance spectra, the NR spectra were consistent with each other, except for small fluctuations on the spectra. This means that the normalization by the total reflectance in Equation (1) is effective in canceling changes in sky conditions.
Figure 6 shows the mean NR of oil palm tree crowns divided by infection categories. In the near-infrared region of 750–780 nm, the NR of healthy trees was highest, followed by early-stage, late-stage, and dead trees. In the blue-to-red (visible) region of 460–680 nm, the order of infection categories was reversed. The crossing point was located at 720 nm in the red-edge region of 690–750 nm. In any spectral region, the difference in NR between healthy and late-stage/dead trees decreased with an increase in segment size from segment A to segment E, while the difference between healthy and early-stage trees increased with an increase in segment size. The dispersion of the dataset represented by the standard deviation was larger in late-stage and dead trees than in healthy and early-stage trees. This characteristic of the dispersion clearly reflected the variations in tree crown appearance in each infection category (Figure 2). The appearances of the healthy and early-stage tree crowns were slightly different between individual trees, and the appearances of late-stage and dead tree crowns displayed considerable individual variability.

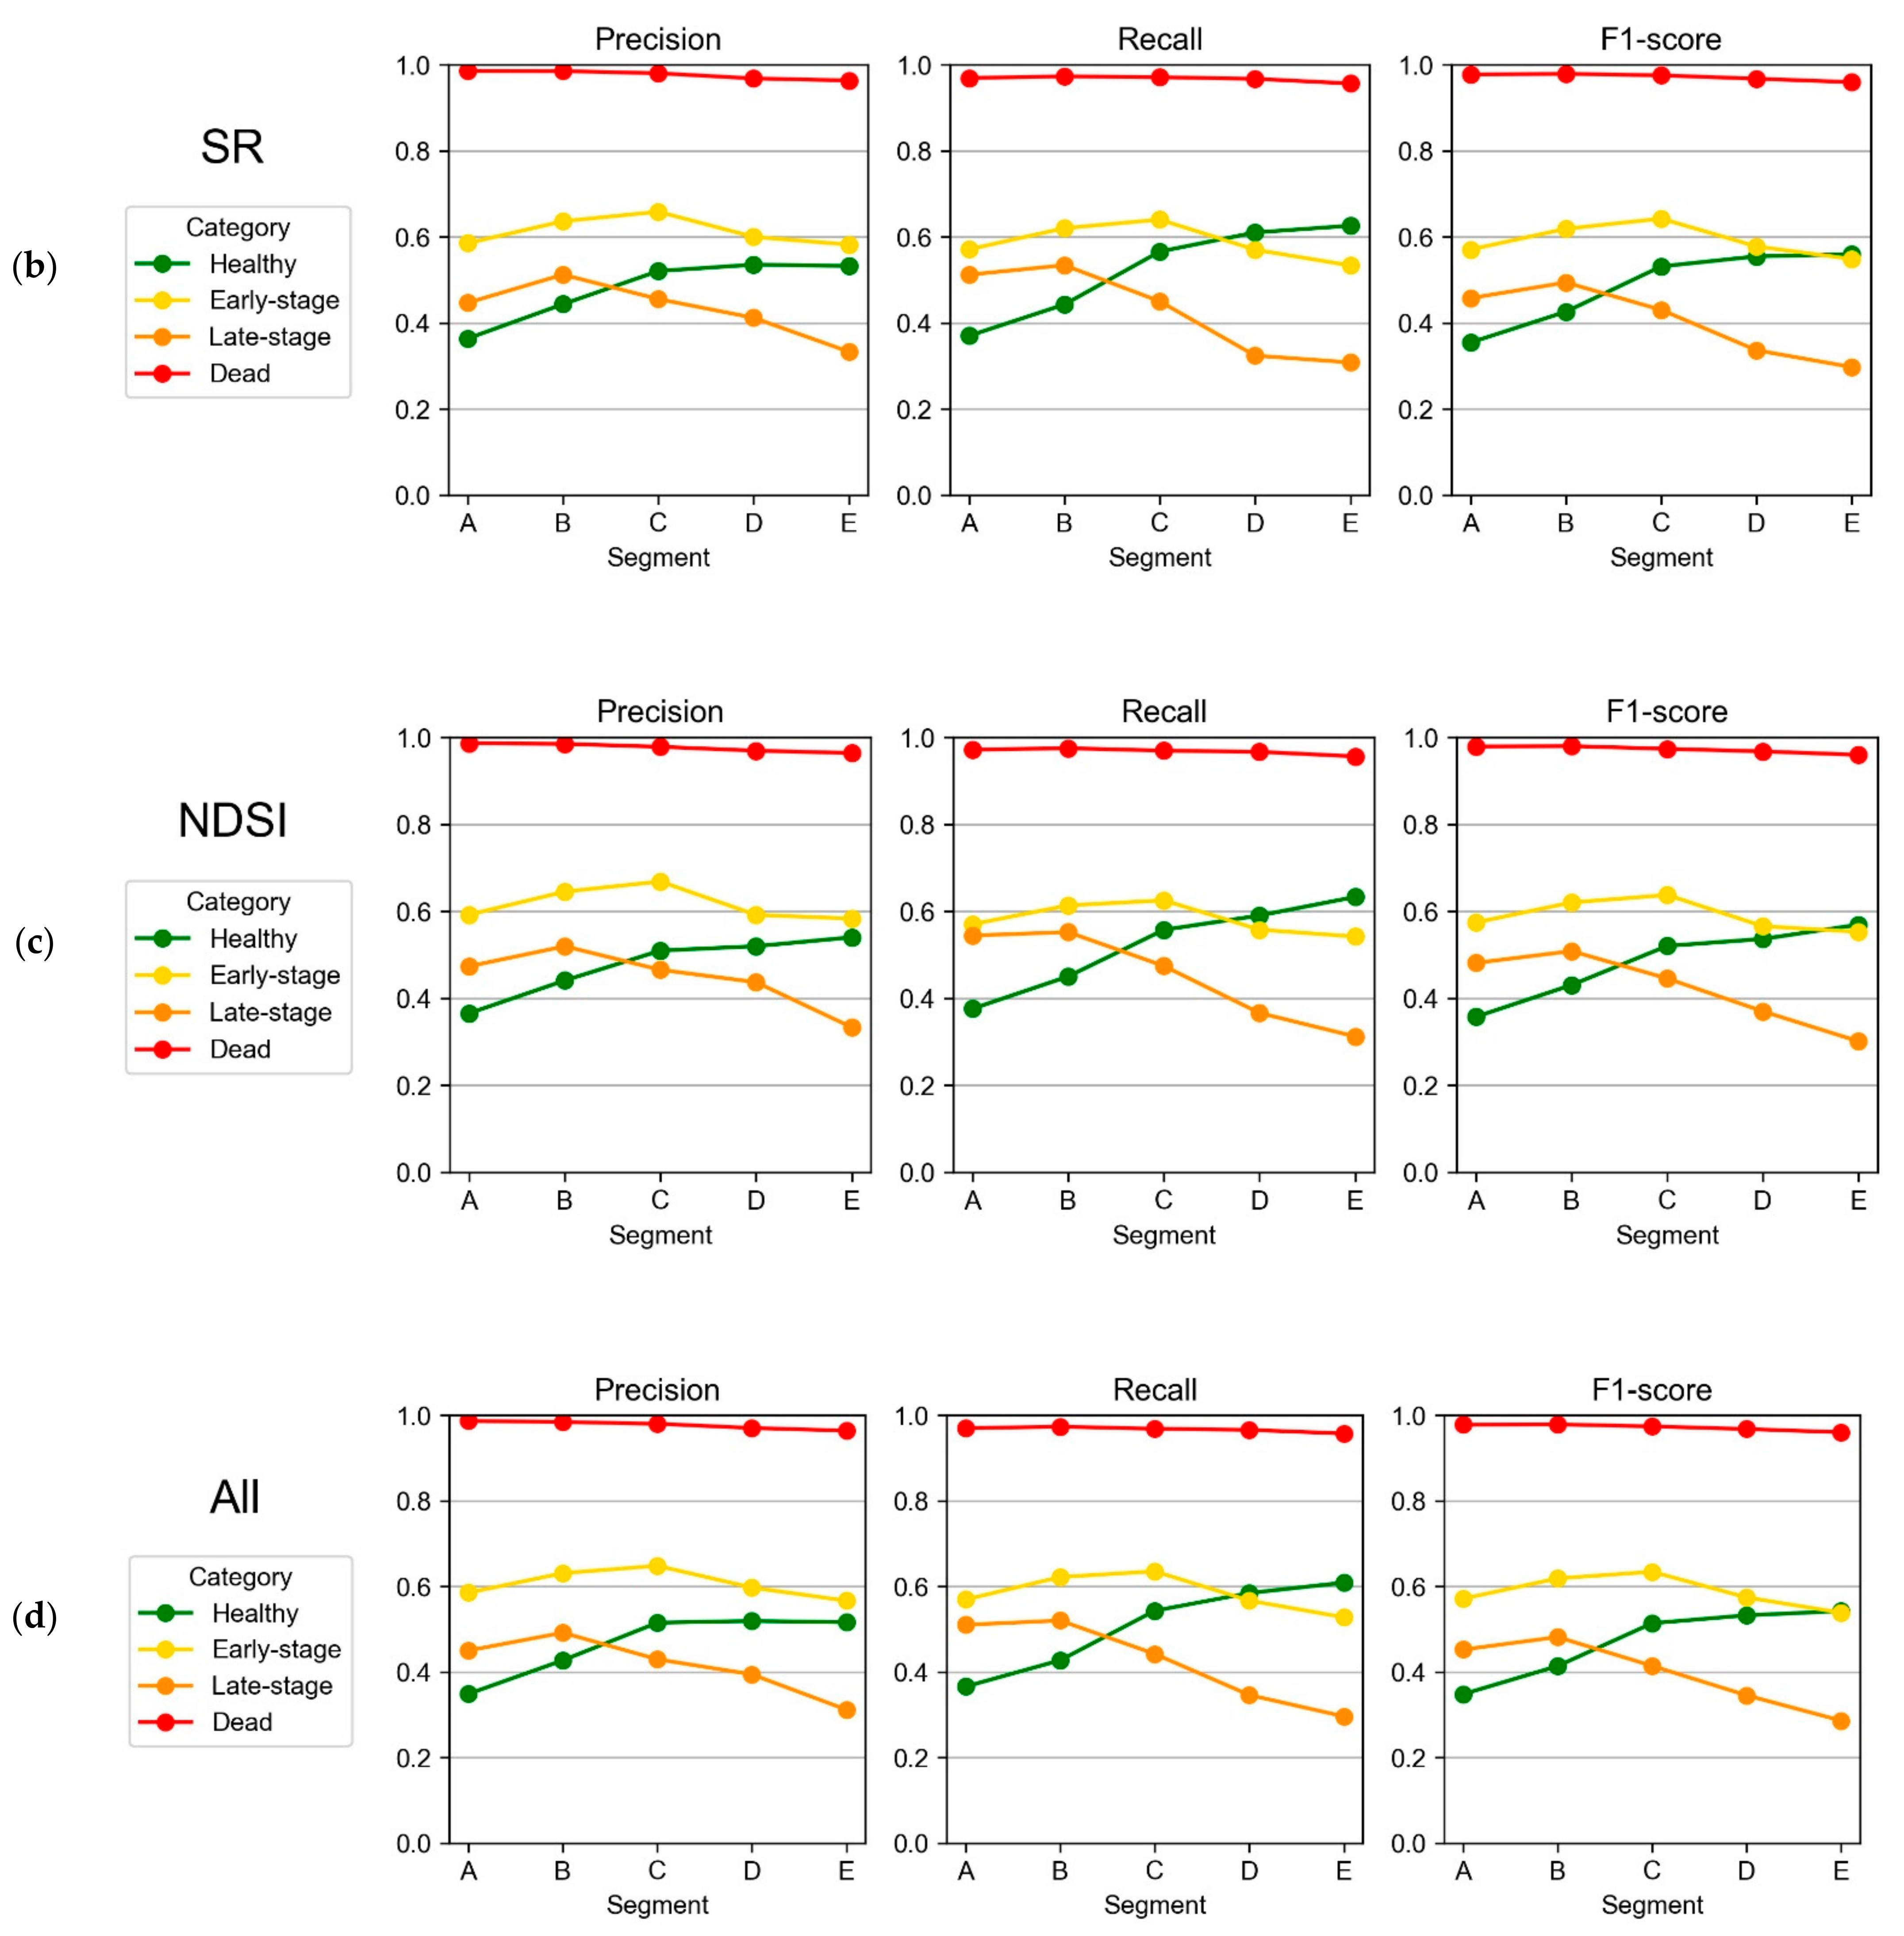
3.2. Classification Performance

Figure 7 shows the mean performance metrics of classification models trained by the three feature vectors of NR, SR, and NDSI, which were defined by Equations (1)–(3), respectively, and all the features of the three feature vectors. Although the three feature vectors had different ranges of values and different numbers of components, their classification models showed similar performance metrics. In any feature vector and performance metric, the infection category of dead trees achieved the highest scores and slightly decreased with an increase in segment size. The other three categories had relatively low scores, and their relationships with segment size differed from one another. The scores of the healthy tree category increased with an increase in segment size, and the scores of the early-stage tree category had a peak at segment C. The scores of the late-stage tree category decreased with increasing segment size, in segments larger than segment B.
The classification results of the infection categories are consistent with the characteristics of their NR spectra in Figure 6. The category of dead trees was highly predictable since its NR spectra was relatively separate from those of the other categories. In the other three categories, the NR spectra overlapped with each other within their standard deviations. The increasing scores of the healthy tree category with segment size were caused by the separation of its NR spectra from that of the early-stage tree category. The NR spectra of the early-stage tree category were most separated from those of both the healthy and late-stage tree categories at segment C, resulting in peak scores at segment C. The decreasing scores of the late-stage tree category in segments C–E can be explained by the decreasing separation of its NR spectra from those of the healthy/early-stage tree categories with an increase in segment size.
Among the performance metrics for each class (precision, recall, and F1-score), recall is more important for the detection of early-stage trees because the classification model with a high recall score can minimize false negatives and prevent the spread of BSR disease. However, in this study there was no significant difference between performance metrics.
Figure 8 shows the overall accuracy and Cohen’s kappa coefficient of classification models trained by the different feature vectors. Although both of the metrics had similar characteristics, the Cohen’s kappa coefficient was lower than the overall accuracy because of the imbalanced test dataset. The feature vectors including the feature vector of all the features displayed small differences, and attained the highest scores at segment B or C.

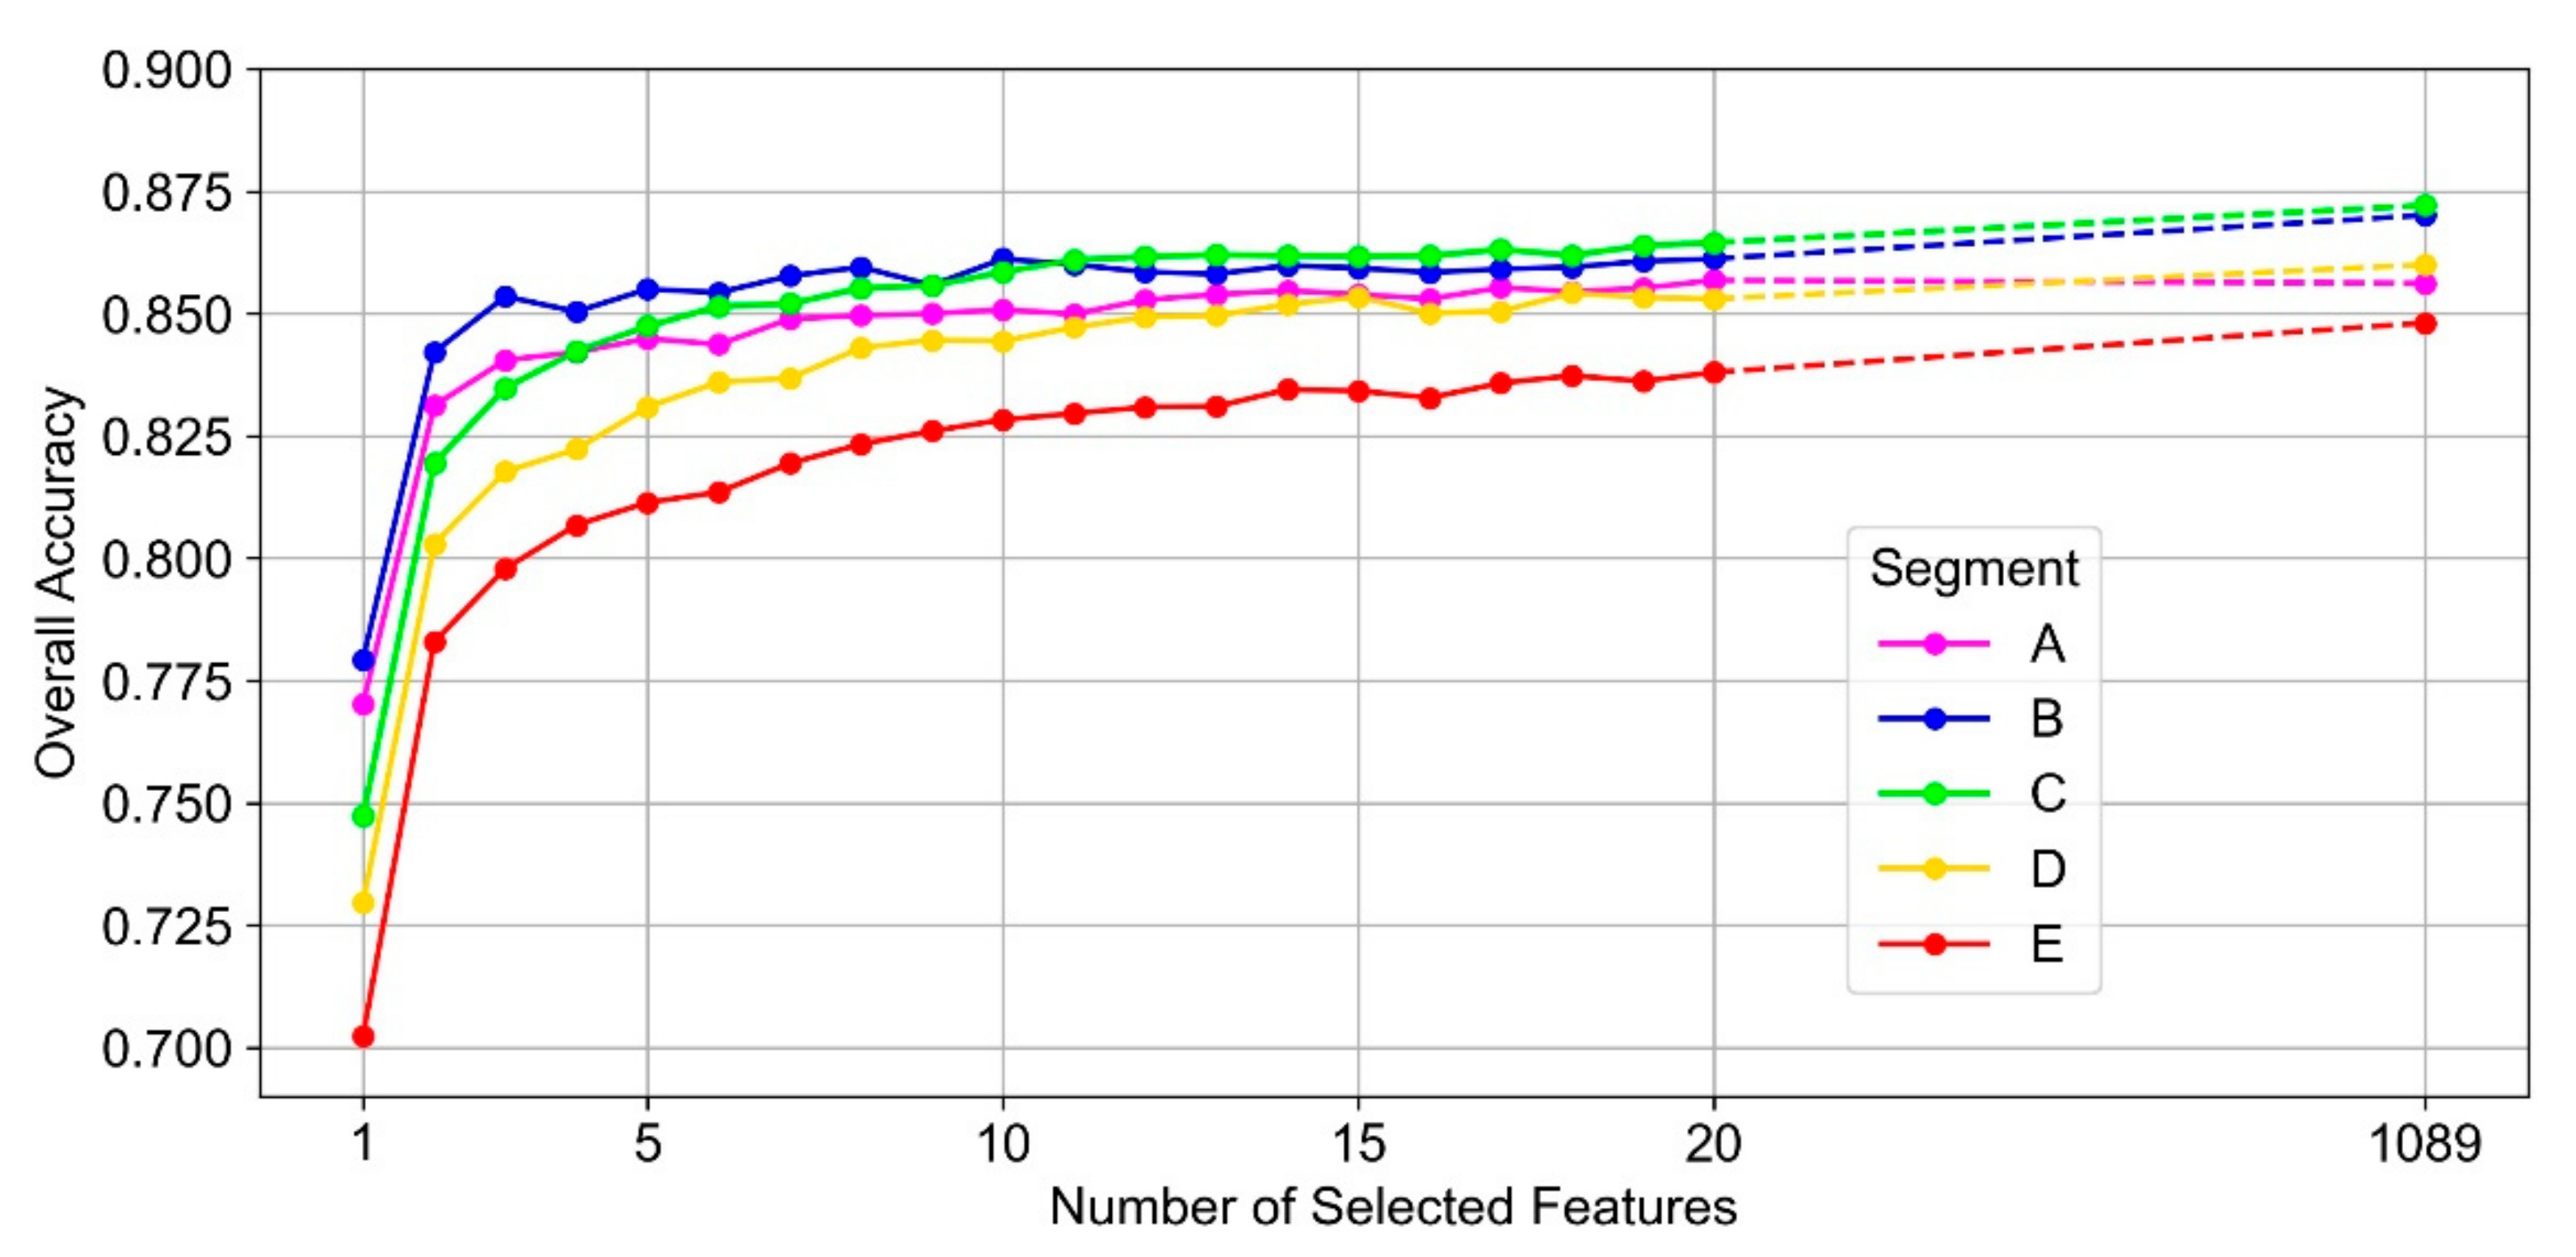
3.3. Selected Features

Figure 9 shows the overall accuracy variations with number of features selected by RFE. Starting the feature selection from all the features of the three feature vectors (1089 features in total), the number of features was reduced to the last feature by the backward feature selection algorithm of RFE. The feature selection procedure was repeated 100 times. The overall accuracy in Figure 9 is the mean for 100 repetitions. In any segments, the overall accuracy decreased gradually with decreased number of selected features, and it decreased steeply from the last two features to the last feature. Segment C displayed the highest scores in overall accuracy for more than 10 selected features. Segment B had the highest scores for the smaller number of selected features.
Table 3 presents the top three and top 10 features selected by the RFE. The ranking is the order of times selected for the top 10 features during 100 repetitions. Although all the top three features were included in the top 10 features, they were not ranked in the top three of the ten features. Among the top 10 features, SR(690, 750) and SR(700, 730) were common in all segments. Regarding the feature vectors in the top 10 features, SR was the most ranked, followed by NDSI and NR. All the top three features were SR, except for NR(690) in segment A. The top 10 features comprised 7–12 bands, which were used multiple times in different combinations for SR and NDSI. In segments A and B, the four top features were composed of a band at 690 nm.

4. Discussion

In this study, to investigate the spectral features of BSR disease infection in oil palm trees, the original spectral reflectance was normalized by the total reflectance. This simple normalization method was proven to be an effective way to cancel the changes in sky conditions, as shown in Figure 5. Although small fluctuations still remain in the normalized spectral reflectance, they can be caused by an instantaneous change in the sky condition during sequential imaging, swaying of oil palm fronds in the wind, and the effects of the bidirectional reflectance distribution function. Recently, several different approaches have been developed for radiometric correction of UAV-based hyperspectral and multispectral imagery [38]. Radiometric block adjustment [39,40] is one of the most robust approaches applicable to variable sky conditions. It can produce a uniform mosaic from overlapping scenes. On the contrary, the normalization method employed in this study aimed at obtaining only tree crown-averaged spectra for object-based analysis, instead of creating a uniform mosaic for pixel-based analysis. As this normalization method has the advantage of directly producing a normalized input dataset for machine learning without using an onboard irradiance sensor, it would be efficient for early detection of the BSR disease if applied to a wide area of oil palm plantations.
As a result of classification by machine learning of the hyperspectral datasets divided into concentric disk segments, the classification performance of the infection categories varied greatly depending on the segments (Figure 7). The categories of dead and late-stage trees displayed better scores for performance metrics in the inner and smaller segments. Classification of these categories in larger segments could be affected by bare soil, understory vegetation, and adjacent trees, which became dominant ground objects in larger segments (Figure 2). In fact, the near-infrared reflectance of dead trees in larger segments was higher than that in smaller segments (Figure 6), suggesting a larger amount of vegetation in larger segments. In contrast, the category of healthy trees had better scores in larger segments, whereas the near-infrared reflectance of healthy trees in larger segments was lower than that in smaller segments. These findings can be attributed to the gap in spectral reflectance between the categories of healthy and early-stage trees, which widened with larger segments. On the other hand, the gap between the categories of early-stage and late-stage trees decreased in the larger segments. These complex relationships between the reflectance spectra of each infection category produced higher performance metrics scores of early-stage trees at segment B and C, which had a diameter of approximately 3.6 m and 5.4 m, respectively.
Feature selection revealed that the classification model with only three features of SR(690, 730), SR(690, 750), and SR(690, 740) in segment B provided an overall accuracy comparable to the score of the model using all the features. The three features consisted of only four bands at 690, 730, 740, and 750 nm, which belong to the red-edge region of 690–750 nm. This finding is consistent with the finding of a previous study based on ground-based hyperspectral measurements that the red-edge region is informative for BSR disease infection [41]. Spectral reflectance and its slope in the red-edge region are closely related to light absorption by chlorophyll in the chloroplasts of plants. Thus, they reflect the amount of chlorophyll, which is usually more abundant in healthy plants than in diseased or stressed plants [42]. As the width of the red-edge region is approximately 60 nm, a spectral resolution sufficiently higher than the width is required to quantify the slight difference in the spectral reflectance and the slope in the red-edge region.
These results account for the results of previous studies that did not provide good performance in the classification of the early-stage infection. The satellite multispectral remote sensing [14] had the adequate spatial resolution (2.4 m) for the extraction of segment B from tree crowns. However, its spectral resolution (60–140 nm) was inadequate for the detailed analysis of the red-edge region to allow for early detection. The aircraft-based hyperspectral remote sensing [15,16] had the adequately high spectral resolution (<10 nm) for the investigation of spectral features in the red-edge region. However, the spatial resolution (~1 m) was too high to conduct pixel-based classification. If object-based classification was performed using the central portion of tree crowns corresponding to segment B, the aircraft-based hyperspectral remote sensing could have a positive result for early detection.
Since this study was conducted on limited samples, it focused on searching for spectral and spatial characteristics effective for classification, instead of creating a model with higher performance than previous studies. One of the limitations of this study is that only mature oil palm trees of the same age were analyzed. Analysis of young oil palm trees with small tree crowns isolated from adjacent trees requires smaller segment sizes. The advantage of the concentric disk segmentation developed in this study is its lower computational cost compared to other image segmentation techniques. However, concentric disk segmentation cannot be applied to other tree species with a centrally asymmetric tree crown structure. It is also difficult for this method to detect other plant diseases that cause symptoms only in certain parts of the tree crown.
As the current operation of UAV-based hyperspectral imaging continues to face many challenges, such as high instrument cost and large amounts of data, UAV-based multispectral imaging becomes advantageous as it covers a wide area in a short period of time. The results obtained in this study will help in selecting the optimum spectral bands in UAV-based multispectral imaging for early detection of BSR disease in oil palm plantations, thus contributing to the sustainable production of palm oil.

5. Conclusions

This study demonstrates the use of UAV-based hyperspectral imaging and machine learning classification for the early detection of BSR disease infection in oil palm trees. The classification performance for the early-stage trees was maximum at specific tree crown segments where its spectral reflectance was separated from those of both the healthy and the late-stage trees. The hypothesis about the thresholds of the spatial and spectral resolutions for early detection was successfully verified by investigating the spectral features at the sub-plant scale. Only a few spectral bands in the red-edge region were sufficient to classify the infection stages. This information can be used for band selection in UAV-based multispectral imaging.

Author Contributions

Methodology, software, formal analysis, data curation, writing—original draft preparation, and visualization, J.K.; mission planning and supervision, V.-C.K.; sensor integration and drone operation, C.W.G.; field experiment and validation, Y.P.L.; ground-truth data collection, H.A. All authors have read and agreed to the published version of the manuscript.

Funding

This study was partially funded by Polar Star Space Co., Ltd. And iRadar Sdn. Bhd. This study was also supported by the Program for Building Regional Innovation Ecosystems of MEXT.

Institutional Review Board Statement

Not applicable.

Informed Consent Statement

Not applicable.

Acknowledgments

Special thanks to FGV R&D Sdn. Bhd. for providing access to the study area to conduct field experiment.

Conflicts of Interest

The authors declare no conflict of interest. The funders had no role in the design of the study; in the collection, analyses, or interpretation of data; in the writing of the manuscript, or in the decision to publish the results.

References

  1. Barcelos, E.; de Rios, S.A.; Cunha, R.N.V.; Lopes, R.; Motoike, S.Y.; Babiychuk, E.; Skirycz, A.; Kushnir, S. Oil Palm Natural Diversity and the Potential for Yield Improvement. Front. Plant Sci. 2015, 6, 190. [Google Scholar] [CrossRef] [PubMed]
  2. Basiron, Y. Palm Oil Production through Sustainable Plantations. Eur. J. Lipid Sci. Technol. 2007, 109, 289–295. [Google Scholar] [CrossRef]
  3. Woittiez, L.S.; van Wijk, M.T.; Slingerland, M.; van Noordwijk, M.; Giller, K.E. Yield gaps in oil palm: A quantitative review of contributing factors. Eur. J. Agron. 2017, 83, 57–77. [Google Scholar] [CrossRef]
  4. Corley, R.H.V. How Much Palm Oil Do We Need? Environ. Sci. Policy 2009, 12, 134–139. [Google Scholar] [CrossRef]
  5. FAOSTAT. Food and Agriculture Organization of the United Nations, Rome. Available online: https://www.fao.org/faostat/ (accessed on 5 November 2021).
  6. USDA. Foreign Agricultural Service, Washington, D.C. Available online: https://apps.fas.usda.gov/psdonline/ (accessed on 5 November 2021).
  7. Pirker, J.; Mosnier, A.; Kraxner, F.; Havlík, P.; Obersteiner, M. What are the limits to oil palm expansion? Glob. Environ. Change 2016, 40, 73–81. [Google Scholar] [CrossRef] [Green Version]
  8. Liaghat, S.; Ehsani, R.; Mansor, S.; Shafri, H.Z.M.; Meon, S.; Sankaran, S.; Azam, S.H.M.N. Early detection of basal stem rot disease (Ganoderma) in oil palms based on hyperspectral reflectance data using pattern recognition algorithms. Int. J. Remote Sens. 2014, 35, 3427–3439. [Google Scholar] [CrossRef]
  9. Paterson, R.R.M. Ganoderma disease of oil palm—A white rot perspective necessary for integrated control. Crop Prot. 2007, 26, 1369–1376. [Google Scholar] [CrossRef] [Green Version]
  10. Rees, R.W.; Flood, J.; Hasan, Y.; Wills, M.A.; Cooper, R.M. Ganoderma boninense basidiospores in oil palm plantations: Evaluation of their possible role in stem rots of Elaeis guineensis. Plant Pathol. 2012, 61, 567–578. [Google Scholar] [CrossRef] [Green Version]
  11. Maluin, F.N.; Hussein, M.Z.; Idris, A.S. An Overview of the Oil Palm Industry: Challenges and Some Emerging Opportunities for Nanotechnology Development. Agronomy 2020, 10, 356. [Google Scholar] [CrossRef] [Green Version]
  12. Mahlein, A.-K. Plant Disease Detection by Imaging Sensors—Parallels and Specific Demands for Precision Agriculture and Plant Phenotyping. Plant Dis. 2015, 100, 241–251. [Google Scholar] [CrossRef] [Green Version]
  13. Chong, K.L.; Kanniah, K.D.; Pohl, C.; Tan, K.P. A review of remote sensing applications for oil palm studies. Geo-Spat. Inf. Sci. 2017, 20, 184–200. [Google Scholar] [CrossRef] [Green Version]
  14. Santoso, H.; Tani, H.; Wang, X. Random Forest classification model of basal stem rot disease caused by Ganoderma boninense in oil palm plantations. Int. J. Remote Sens. 2017, 38, 4683–4699. [Google Scholar] [CrossRef]
  15. Shafri, H.Z.M.; Hamdan, N.; Anuar, M.I. Detection of stressed oil palms from an airborne sensor using optimized spectral indices. Int. J. Remote Sens. 2012, 33, 4293–4311. [Google Scholar] [CrossRef]
  16. Izzuddin, M.A.; Nisfariza, M.N.; Ezzati, B.; Idris, A.S.; Steven, M.D.; Boyd, D. Analysis of airborne hyperspectral image using vegetation indices, red edge position and continuum removal for detection of ganoderma disease in oil palm. J. Oil Palm Res. 2018, 30, 416–428. [Google Scholar]
  17. Lelong, C.C.D.; Roger, J.-M.; Brégand, S.; Dubertret, F.; Lanore, M.; Sitorus, N.A.; Raharjo, D.A.; Caliman, J.-P. Evaluation of Oil-Palm Fungal Disease Infestation with Canopy Hyperspectral Reflectance Data. Sensors 2010, 10, 734–747. [Google Scholar] [CrossRef] [PubMed]
  18. Ahmadi, P.; Muharam, F.M.; Ahmad, K.; Mansor, S.; Abu Seman, I. Early Detection of Ganoderma Basal Stem Rot of Oil Palms Using Artificial Neural Network Spectral Analysis. Plant Dis. 2017, 101, 1009–1016. [Google Scholar] [CrossRef] [PubMed] [Green Version]
  19. Noor Azmi, A.N.; Bejo, S.K.; Jahari, M.; Muharam, F.M.; Yule, I.; Husin, N.A. Early Detection of Ganoderma Boninense in Oil Palm Seedlings Using Support Vector Machines. Remote Sens. 2020, 12, 3920. [Google Scholar] [CrossRef]
  20. Kattenborn, T.; Sperlich, M.; Bataua, K.; Koch, B. Automatic Single Tree Detection in Plantations using UAV-based Photogrammetric Point clouds. In Proceedings of the ISPRS—International Archives of the Photogrammetry, Remote Sensing and Spatial Information Sciences, Copernicus GmbH, Zurich, Switzerland, 5–7 September 2014; Volume XL–3, pp. 139–144. [Google Scholar]
  21. Avtar, R.; Suab, S.A.; Syukur, M.S.; Korom, A.; Umarhadi, D.A.; Yunus, A.P. Assessing the Influence of UAV Altitude on Extracted Biophysical Parameters of Young Oil Palm. Remote Sens. 2020, 12, 3030. [Google Scholar] [CrossRef]
  22. Viera-Torres, M.; Sinde-González, I.; Gil-Docampo, M.; Bravo-Yandún, V.; Toulkeridis, T. Generating the Baseline in the Early Detection of Bud Rot and Red Ring Disease in Oil Palms by Geospatial Technologies. Remote Sens. 2020, 12, 3229. [Google Scholar] [CrossRef]
  23. Gibril, M.B.A.; Shafri, H.Z.M.; Shanableh, A.; Al-Ruzouq, R.; Wayayok, A.; Hashim, S.J. Deep Convolutional Neural Network for Large-Scale Date Palm Tree Mapping from UAV-Based Images. Remote Sens. 2021, 13, 2787. [Google Scholar] [CrossRef]
  24. Zheng, J.; Fu, H.; Li, W.; Wu, W.; Yu, L.; Yuan, S.; Tao, W.Y.W.; Pang, T.K.; Kanniah, K.D. Growing Status Observation for Oil Palm Trees Using Unmanned Aerial Vehicle (UAV) Images. ISPRS J. Photogramm. Remote Sens. 2021, 173, 95–121. [Google Scholar] [CrossRef]
  25. Kurihara, J.; Ishida, T.; Takahashi, Y. Unmanned Aerial Vehicle (UAV)-Based Hyperspectral Imaging System for Precision Agriculture and Forest Management. In Unmanned Aerial Vehicle: Applications in Agriculture and Environment; Avtar, R., Watanabe, T., Eds.; Springer International Publishing: Cham, Switzerland, 2020; pp. 25–38. ISBN 978-3-030-27157-2. [Google Scholar]
  26. OpenCV. Open Source Computer Vision Library. Available online: http://opencv.org/ (accessed on 20 January 2022).
  27. Srestasathiern, P.; Rakwatin, P. Oil Palm Tree Detection with High Resolution Multi-Spectral Satellite Imagery. Remote Sens. 2014, 6, 9749–9774. [Google Scholar] [CrossRef] [Green Version]
  28. Santoso, H.; Tani, H.; Wang, X. A simple method for detection and counting of oil palm trees using high-resolution multispectral satellite imagery. Int. J. Remote Sens. 2016, 37, 5122–5134. [Google Scholar] [CrossRef]
  29. Malek, S.; Bazi, Y.; Alajlan, N.; AlHichri, H.; Melgani, F. Efficient Framework for Palm Tree Detection in UAV Images. IEEE J. Sel. Top. Appl. Earth Obs. Remote Sens. 2014, 7, 4692–4703. [Google Scholar] [CrossRef]
  30. Li, W.; Dong, R.; Fu, H.; Yu, L. Large-Scale Oil Palm Tree Detection from High-Resolution Satellite Images Using Two-Stage Convolutional Neural Networks. Remote Sens. 2019, 11, 11. [Google Scholar] [CrossRef] [Green Version]
  31. Breiman, L. Random Forests. Mach. Learn. 2001, 45, 5–32. [Google Scholar] [CrossRef] [Green Version]
  32. Belgiu, M.; Drăguţ, L. Random Forest in Remote Sensing: A Review of Applications and Future Directions. ISPRS J. Photogramm. Remote Sens. 2016, 114, 24–31. [Google Scholar] [CrossRef]
  33. Pedregosa, F.; Varoquaux, G.; Gramfort, A.; Michel, V.; Thirion, B.; Grisel, O.; Blondel, M.; Prettenhofer, P.; Weiss, R.; Dubourg, V.; et al. Scikit-learn: Machine Learning in Python. J. Mach. Learn. Res. 2011, 12, 2825–2830. [Google Scholar]
  34. Python. Python Software Foundation. Available online: https://www.python.org/ (accessed on 20 January 2022).
  35. Chawla, N.V.; Bowyer, K.W.; Hall, L.O.; Kegelmeyer, W.P. SMOTE: Synthetic Minority Over-Sampling Technique. J. Artif. Intell. Res. 2002, 16, 321–357. [Google Scholar] [CrossRef]
  36. Lemaître, G.; Nogueira, F.; Aridas, C.K. Imbalanced-Learn: A Python Toolbox to Tackle the Curse of Imbalanced Datasets in Machine Learning. J. Mach. Learn. Res. 2017, 18, 559–563. [Google Scholar]
  37. Guyon, I.; Weston, J.; Barnhill, S.; Vapnik, V. Gene Selection for Cancer Classification Using Support Vector Machines. Mach. Learn. 2002, 46, 389–422. [Google Scholar] [CrossRef]
  38. Aasen, H.; Honkavaara, E.; Lucieer, A.; Zarco-Tejada, P.J. Quantitative Remote Sensing at Ultra-High Resolution with UAV Spectroscopy: A Review of Sensor Technology, Measurement Procedures, and Data Correction Workflows. Remote Sens. 2018, 10, 1091. [Google Scholar] [CrossRef] [Green Version]
  39. Honkavaara, E.; Saari, H.; Kaivosoja, J.; Pölönen, I.; Hakala, T.; Litkey, P.; Mäkynen, J.; Pesonen, L. Processing and Assessment of Spectrometric, Stereoscopic Imagery Collected Using a Lightweight UAV Spectral Camera for Precision Agriculture. Remote Sens. 2013, 5, 5006–5039. [Google Scholar] [CrossRef] [Green Version]
  40. Honkavaara, E.; Khoramshahi, E. Radiometric Correction of Close-Range Spectral Image Blocks Captured Using an Unmanned Aerial Vehicle with a Radiometric Block Adjustment. Remote Sens. 2018, 10, 256. [Google Scholar] [CrossRef] [Green Version]
  41. Shafri, H.Z.M.; Anuar, M.I.; Seman, I.A.; Noor, N.M. Spectral Discrimination of Healthy and Ganoderma-Infected Oil Palms from Hyperspectral Data. Int. J. Remote Sens. 2011, 32, 7111–7129. [Google Scholar] [CrossRef]
  42. Horler, D.N.H.; Dockray, M.; Barber, J. The Red Edge of Plant Leaf Reflectance. Int. J. Remote Sens. 1983, 4, 273–288. [Google Scholar] [CrossRef]
Figure 1. Location of the studied oil palm plantation site (upper left) and a high spatial resolution aerial map of the site enclosed by the white dotted line (center). Categories of healthy, early-stage, late-stage, and dead trees classified by field survey and visual inspection are indicated by green, yellow, orange, and red circles, respectively.
Remotesensing 14 00799 g001
Figure 2. Examples of tree crown images extracted from the high spatial resolution aerial map.
Remotesensing 14 00799 g002
Figure 3. Concentric disk segmentation of tree crowns.
Remotesensing 14 00799 g003
Figure 4. A flow chart of the data collection, data preprocessing, and machine learning methods in this study.
Remotesensing 14 00799 g004
Figure 5. Reflectance spectra of segment E in the same oil palm tree crown acquired in different scenes. (a) Original reflectance spectra and (b) normalized reflectance spectra. Labels of the spectra indicate their flight IDs and scene IDs.
Remotesensing 14 00799 g005
Figure 6. Mean normalized reflectance spectra of oil palm tree crowns by infection category in different segments: (a) Segment A; (b) Segment B; (c) Segment C; (d) Segment D; (e) Segment E. Error bars present the standard deviation of the corresponding dataset.
Remotesensing 14 00799 g006
Figure 7. Mean precision, recall, and F1-score of classification models trained by different feature vectors: (a) NR, (b) SR, (c) NDSI, and (d) all the features.
Remotesensing 14 00799 g007aRemotesensing 14 00799 g007b
Figure 8. Overall accuracy and the Cohen’s kappa coefficient of classification models trained by different feature vectors.
Remotesensing 14 00799 g008
Figure 9. Overall accuracy variations with number of features selected by RFE. Data for number of features between 20 and 1089 were omitted.
Remotesensing 14 00799 g009
Table 1. Number of trees in the site and number of samples in the analysis.
CategoryNumber of TreesNumber of Samples
Healthy1030
Early-stage1047
Late-stage819
Dead68303
Table 2. List of the flights for UAV-based hyperspectral imaging.
Flight IDDateLocal TimeFlight Altitude (m)Number of Scenes
F17 November 201814:44–15:1050–6012
F27 November 201815:33–15:5850–6010
F38 November 201811:45–12:1190–10010
F48 November 201812:32–12:5790–10011
F58 November 201817:03–17:1990–1003
F68 November 201817:50–17:5690–1003
F79 November 201813:14–13:4490–10013
F89 November 201813:50–14:1790–10011
Total73
Table 3. Ranking list of the top three (bold) and top 10 features selected by RFE.
RankingSegment ASegment BSegment CSegment DSegment E
1SR(690, 730)SR(690, 730)NDSI(590, 780)SR(590, 780)SR(460, 490)
2NR(690)SR(690, 750)SR(590, 780)NDSI(590, 780)SR(690, 750)
3NDSI(690, 730)NDSI(690, 730)SR(710, 740)SR(700, 730)SR(710, 730)
4SR(690, 750)SR(690, 740)SR(690, 750)SR(690, 730)NDSI(710, 730)
5SR(700, 730)NR(690)SR(540, 750)SR(710, 740)SR(560, 750)
6NDSI(540, 550)NDSI(660, 750)NDSI(710, 730)SR(560, 750)SR(710, 740)
7SR(650, 770)SR(660, 750)SR(710, 730)SR(710, 730)NDSI(560, 750)
8NR(630)SR(710, 740)SR(700, 730)SR(690, 750)SR(700, 730)
9SR(690, 740)NDSI(690, 740)NDSI(710, 740)NDSI(710, 740)SR(550, 750)
10SR(590, 620)SR(700, 730)SR(560, 750)NDSI(710, 730)NR(690)
Number of bands used12711910
Publisher’s Note: MDPI stays neutral with regard to jurisdictional claims in published maps and institutional affiliations.

