1. Introduction
Phoradendron velutinum, also known as
P. velutinum or true mistletoe, is a hemiparasitic shrub plant of aerial parts of trees and shrubs that usually attaches itself to broadleaf and mixed conifer forests. Since
P. velutinum spreads itself by employing a ballistic propulsion method, the detection of new shoots is difficult, causing the decline of around 23.3 million hectares of conifers and broadleaves in Mexico. Hence, efficient identification of plant infestation usually requires manual inspection, becoming a labor-intensive task [
1].
One of the regions affected by this pest is the conservation area located in the San Bartolo Ameyalco Community, south of Mexico City; there, the uncontrollable presence of true mistletoe has caused different social and environmental issues. For example, the abundant presence of mistletoe in combination with other stress factors can reduce the vitality of trees and forest mortality could precede an ecological imbalance caused by the decrease of both carbon sequestration and the recharge of the aquifer that depends on this forest area [
1]. This region is also socially and economically impacted as it is the conservation land that contributes the greatest amount of water and other environmental services to the Valley of Mexico [
2]. In recent years, different methodologies focused on the detection of pests and diseases in plants have been proposed based on aerial images collected by Unmanned Aerial Vehicles (UAVs) and machine learning algorithms [
3,
4,
5]. For example, the authors of [
6] proposed a deep-learning-based method of leaf disease detection in a variety of plans. In the case of forest pests, studies exist on the detection of bark beetle in both mixed forests [
7] and urban forest at individual tree level [
8]. Additionally, the spectral detection of
Dendrolimus tabulaeformis is presented in a work by Zhang, N. et al. [
9].
In relation to mistletoe, a few studies have been carried out regarding its autonomous detection in different environments, some of which are described next. The first proposals aimed at mistletoe identification in fir trees made use of a hyperspectral line scanner and supervised classification techniques [
10,
11]. Later, based on the discovery that mistletoe species show a lower temperature compared to their hosts as they transpire more water, Maes W. et al. in [
12] employed UAV-collected RGB and thermal image sets, then the temperature difference was used to indicate the presence of mistletoe in eucalyptus trees. Recently, authors in [
13] presented preliminary results on the capabilities of multispectral aerial images in conjunction with different types of Convolutional Neural Networks (CNN) for the detection of mistletoe. Additionally, the automatic detection of dwarf mistletoe, also known as
Arceuthobium globesum, present in the Nevado de Toluca volcano (Mexico) was reported in [
14]; for that purpose, UAV-collected RGB images were analyzed by means of the k-nearest neighbors technique and colorimetry algorithms. The authors concluded that a spatial resolution greater than or equal to 10 cm/px is required for the automatic detection of forest pests based on aerial images and supervised learning. Recently, the authors of [
15] employed an UAV to collect series of high-resolution RGB images, from which a canopy height model (CHM) was derived; individual tree crowns were delineated manually and automatically based on the CHM. Then, a set of vegetation indices were computed and a random forest classification scheme was used to delineate individual trees infected by mistletoe (
Viscum album) in mixed broadleaf forests located in Iran. On the other hand, a first approach to the study of
P. velutinum employing evolutionary computation was presented by the authors in [
16], proposing the development of a spectral index to detect the parasitic plant, considering algebraic and neighborhood functions; In this work, the feasibility of using evolutionary methods for the detection of forest patterns in images was analyzed as providing 89% accuracy.
Although the aforementioned research provides partial solutions for automatic mistletoe detection and classification using remote sensing techniques, the following issues require special attention. (1) A thousand varieties of mistletoe exist, all negatively impacting on host tree physiology and health, soil nutrient cycling, and stand dynamics [
1,
13]; (2) some mistletoe species show very similar color and texture features compared with the leaves of the host plant [
13]; (3) in most cases, detection at an early stage is difficult. Therefore, the development of efficient methodologies providing early detection of some mistletoe species for adequate control has become necessary.
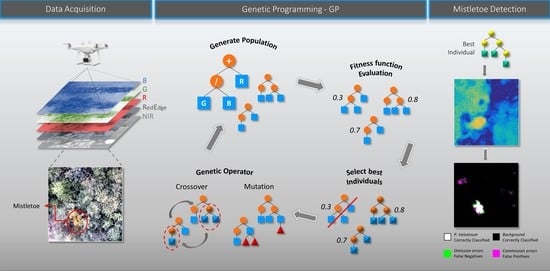
This paper proposes the use of an Evolutionary Computing technique, known as Genetic Programming (GP), in conjunction with UAV multispectral imagery with the aim of determining an algorithm specifically designed for the detection of
P. velutinum. Genetic Programming helps to automate the search for solutions to different user-defined problems, which has been implemented in different areas, such as regression analysis [
17], prediction [
18,
19], classification [
20], symbolic regression [
21], optimization [
22], among others. The diversity of applications is possible since the algorithms of
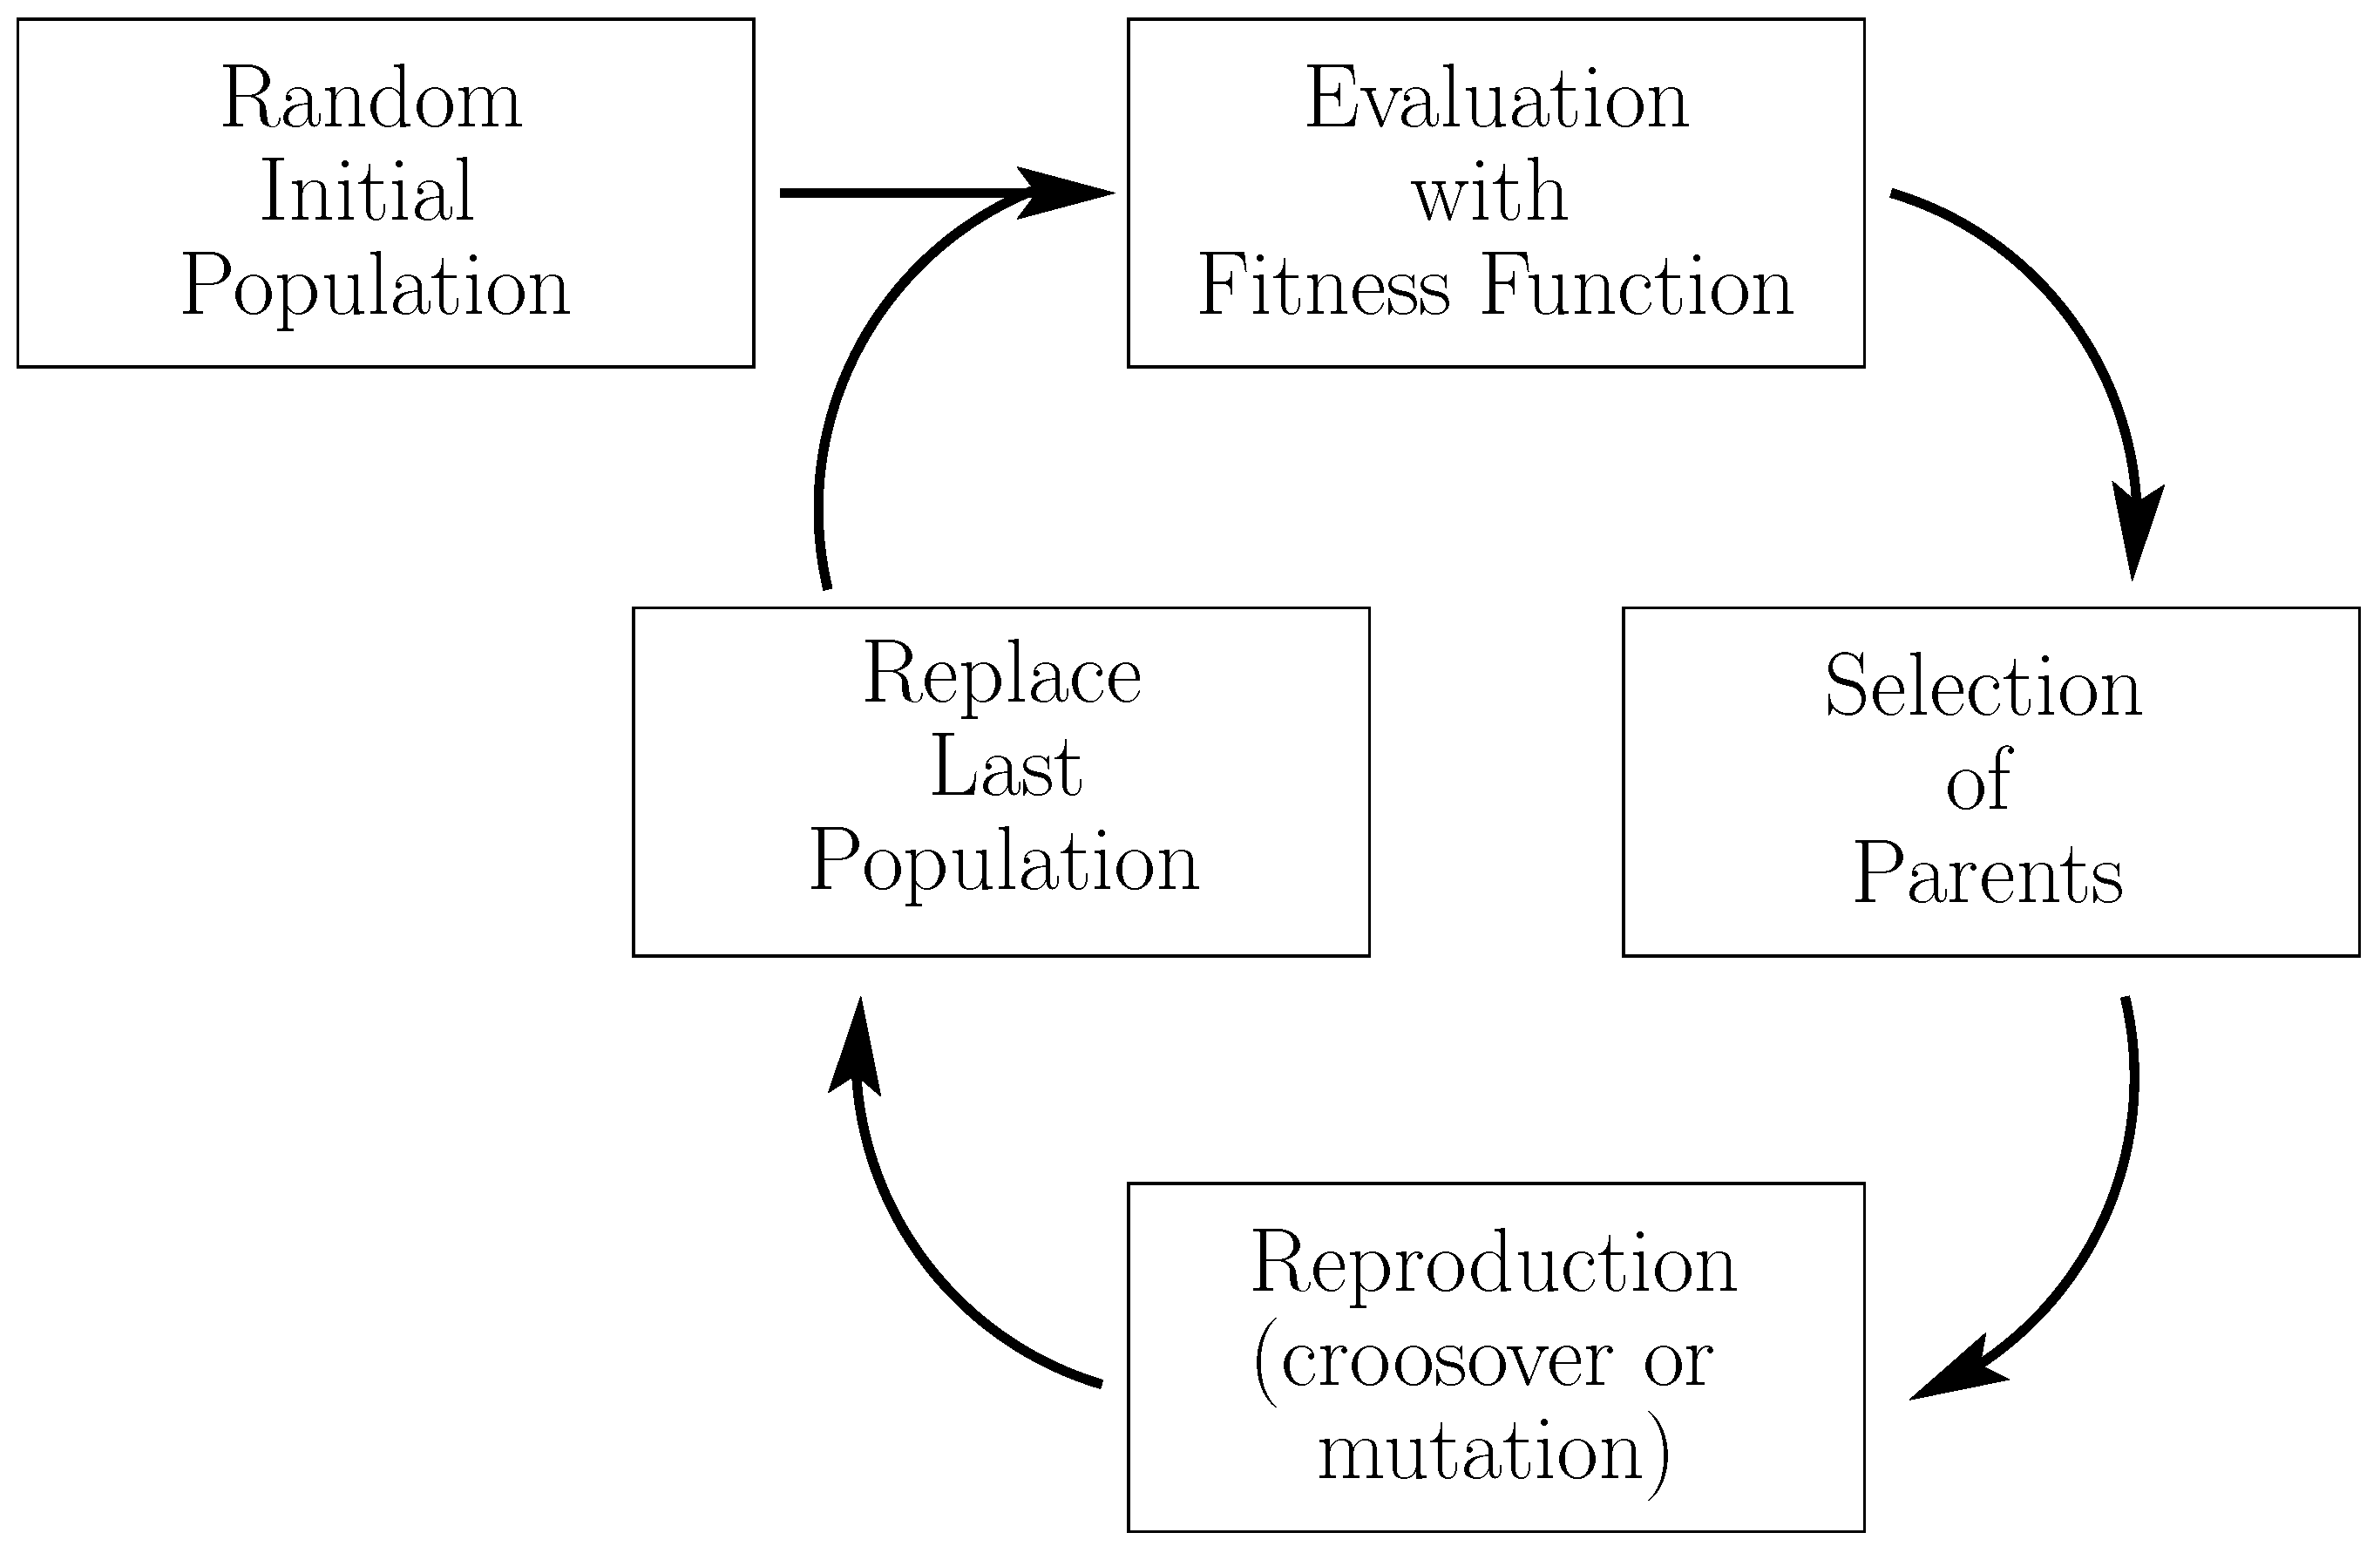
GP perform an abstraction of the knowledge represented in mathematical expressions or systems based on rules, in a probabilistic search space inspired by the Darwinian theory of evolution. The contributions of this research are the following. We propose a Genetic-Programming-based methodology, designed specifically for the detection of
P. velutinum in the flowering stage from forest areas. This algorithm allowed us to derive a detector of this particular mistletoe species, showing a higher accuracy rate (around 96.6%) compared to other classification methods. Since the optimal solution found by GP involves algebraic operations among the input spectral bands, this solution can be easily implemented for mistletoe detection in other forest areas, different to the one reported here.
The organization of the document is as follows. In
Section 2, we describe the main characteristics and location of the study area.
Section 3 presents the materials and methods used in our study, including the UAV characteristics, multispectral image collection, and our developed GP model. In
Section 4, the results achieved with our GP-based algorithm for
P. velutinum identification are compared with two traditional methods.
Section 5 outlines some important remarks concerning the implementation of our GP algorithm for pest detection, while the main conclusions and the direction for future work are stated in
Section 6.
2. Study Area
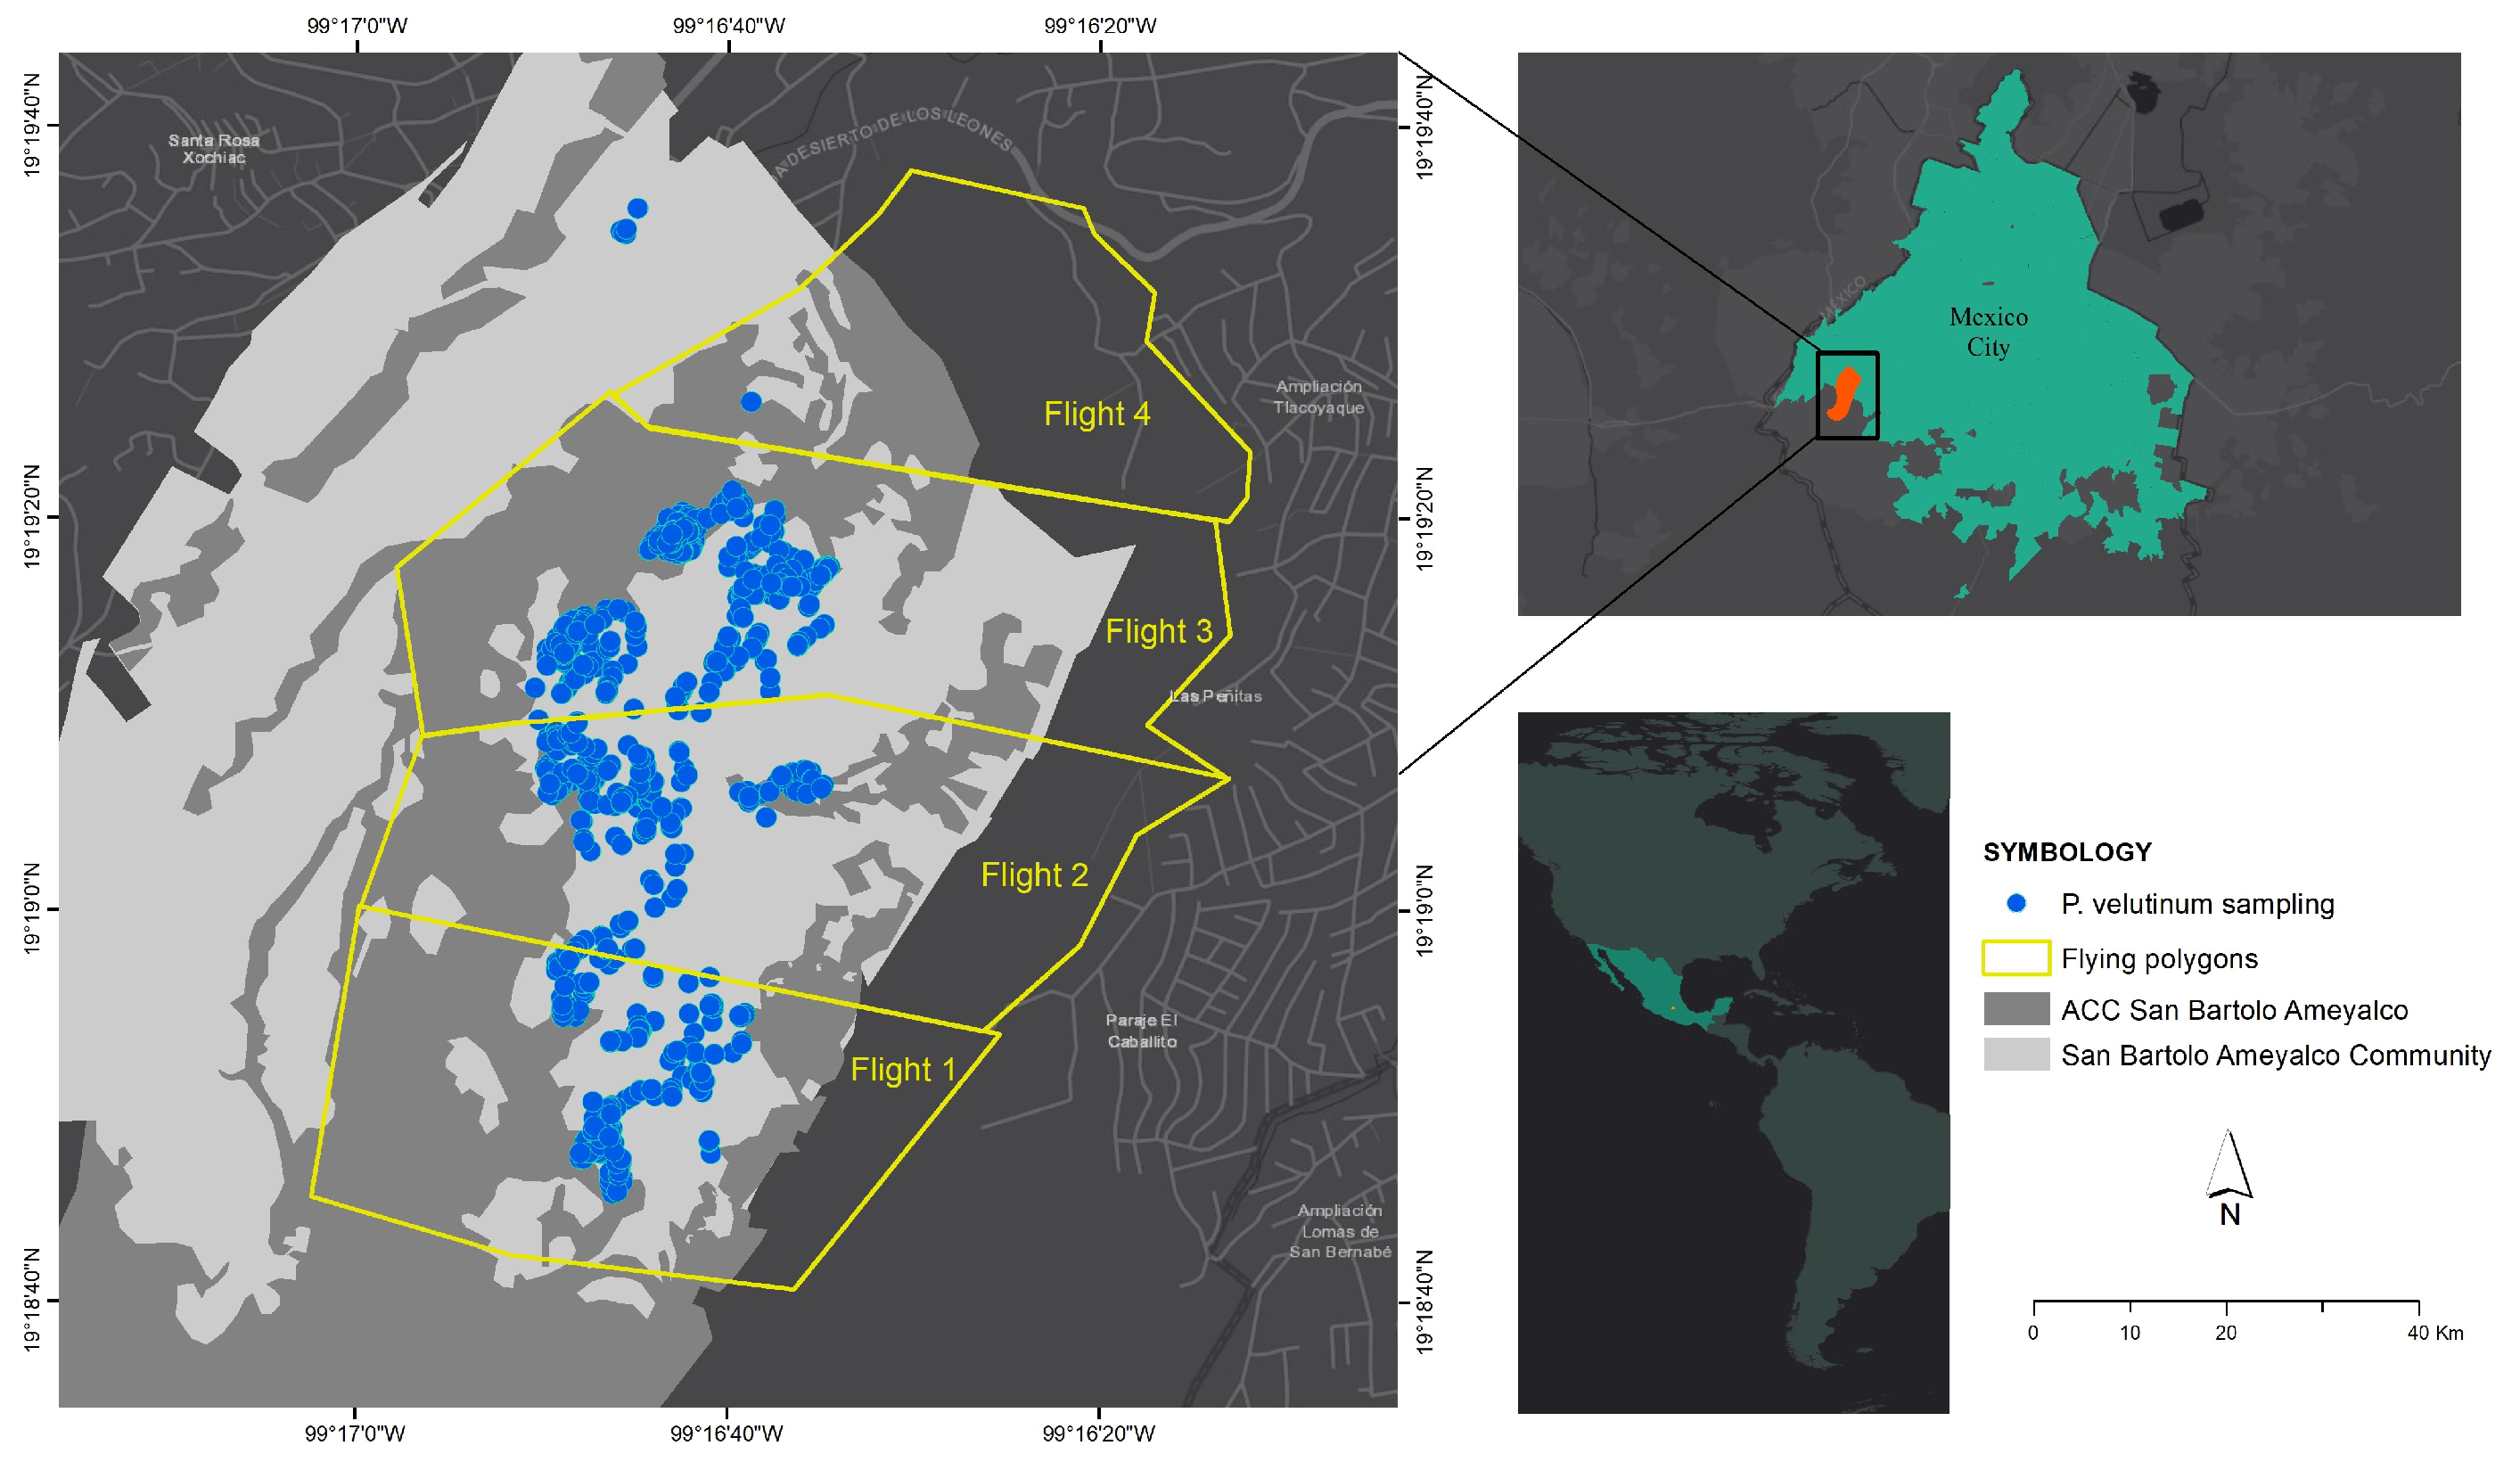
The study area is located in the conservation site, registered as Community Conservation Area of the San Bartolo Ameyalco Community, located at coordinates 19°20N and 99°16W at a height of about 2420 m.a.s.l. in Alvaro Obregón Borough, south of Mexico City. San Bartolo Ameyalco was registered with the Community Areas for Ecological Conservation program in 2017, with the aim of protecting, improving, and conserving the natural resources and environmental services that this area provides to Mexico City.
The conservation area in San Bartolo Ameyalco is made up of 244 hectares, most of which are cataloged as forest land, due to the presence of the following species: oyamel
(Abies religious) forests covering
of the surface, pine (
Pinus spp) covering
; cypress
(Cupressus) and oak (
Quercus spp) forests are also present. In addition,
of the surface is used for rainfed agriculture.
Figure 1 shows the location of the study area.
P. velutinum is a forest pest, also known as barbas, bungu, graft, evil eye, mistletoe or on stick [
23], which is part of the
true mistletoe species; these species are normally found in temperate zones of Mexico City [
24] as in the case of San Bartolo Ameyalco Community.
P. velutinum is a hemiparasitic shrub with branched stems, opposite and decussate leaves, inflorescences in the form of articulated pedunculated spikes. It generally occurs in the aerial parts of trees or shrubs because the location in the higher parts allows it to obtain sufficient illumination for the photosynthesis process. Due to its hemiparasitic condition, it is able to extract compounds from its host and photosynthesizes organic matter [
25]. Physiologically, it is up to 80 cm long, with internodes of 8 cm long, without cataphiles, and with a petiole of 5–20 mm in length, the coloration of this parasite is green or yellowish with a velutine pubescence frequently yellow in the young parts and the mature parts glabrescent. It has male inflorescences of
cm in length, 2 to 5 segments of 6 to 40 flowers each in 6 longitudinal rows, the female inflorescence is 4 cm long with fruit, with 2 to 4 segments of 12 to 30 flowers per segment in 6 rows [
26].
These species have an establishment stage, in which the seed with chlorophyll endosperm produces simple sugars as a source of energy before germination. Afterwards, the incubation stage follows, in which a radicle develops that penetrates the host cortex until it reaches the vascular tissues where it develops cortical haustoria (0.8–12 cm) [
27]. Once established with aerial stems and flowers, a pollination process begins that can take around 4–6 weeks. Finally, the plant disperses the seed through ballistic propulsion, i.e., projecting the mature fruit around 15 m, which allows the seed to adhere to the branches of a new host [
28].
4. Experiments and Results
This section starts with a detailed description of the GP experiments, followed by the analysis of the 50 best solutions obtained, as well as the operation and performance of the best solution. In addition, we compare this solution with other approaches for the detection of mistletoe. At the end, we show an application of the P. velutinum detector.
4.1. Experimental Setup
In our experiments, we used a leave-one-out cross-validation methodology with kfold (
k = 5), dividing the 250 images into 5 folders of 50 images each: 4 folders for training and 1 folder for testing. We executed 50 independent GP runs with five different training sets. At the end of each run, the best individual was evaluated with the corresponding test set to assess the final performance of the best candidates. The implementation of
GP to find an optimal solution to
P. velutinum in aerial images was carried out in the Software
MATLAB R2019a implementing GP-Lab [
29].
4.2. Structural Analysis of Gp Solutions
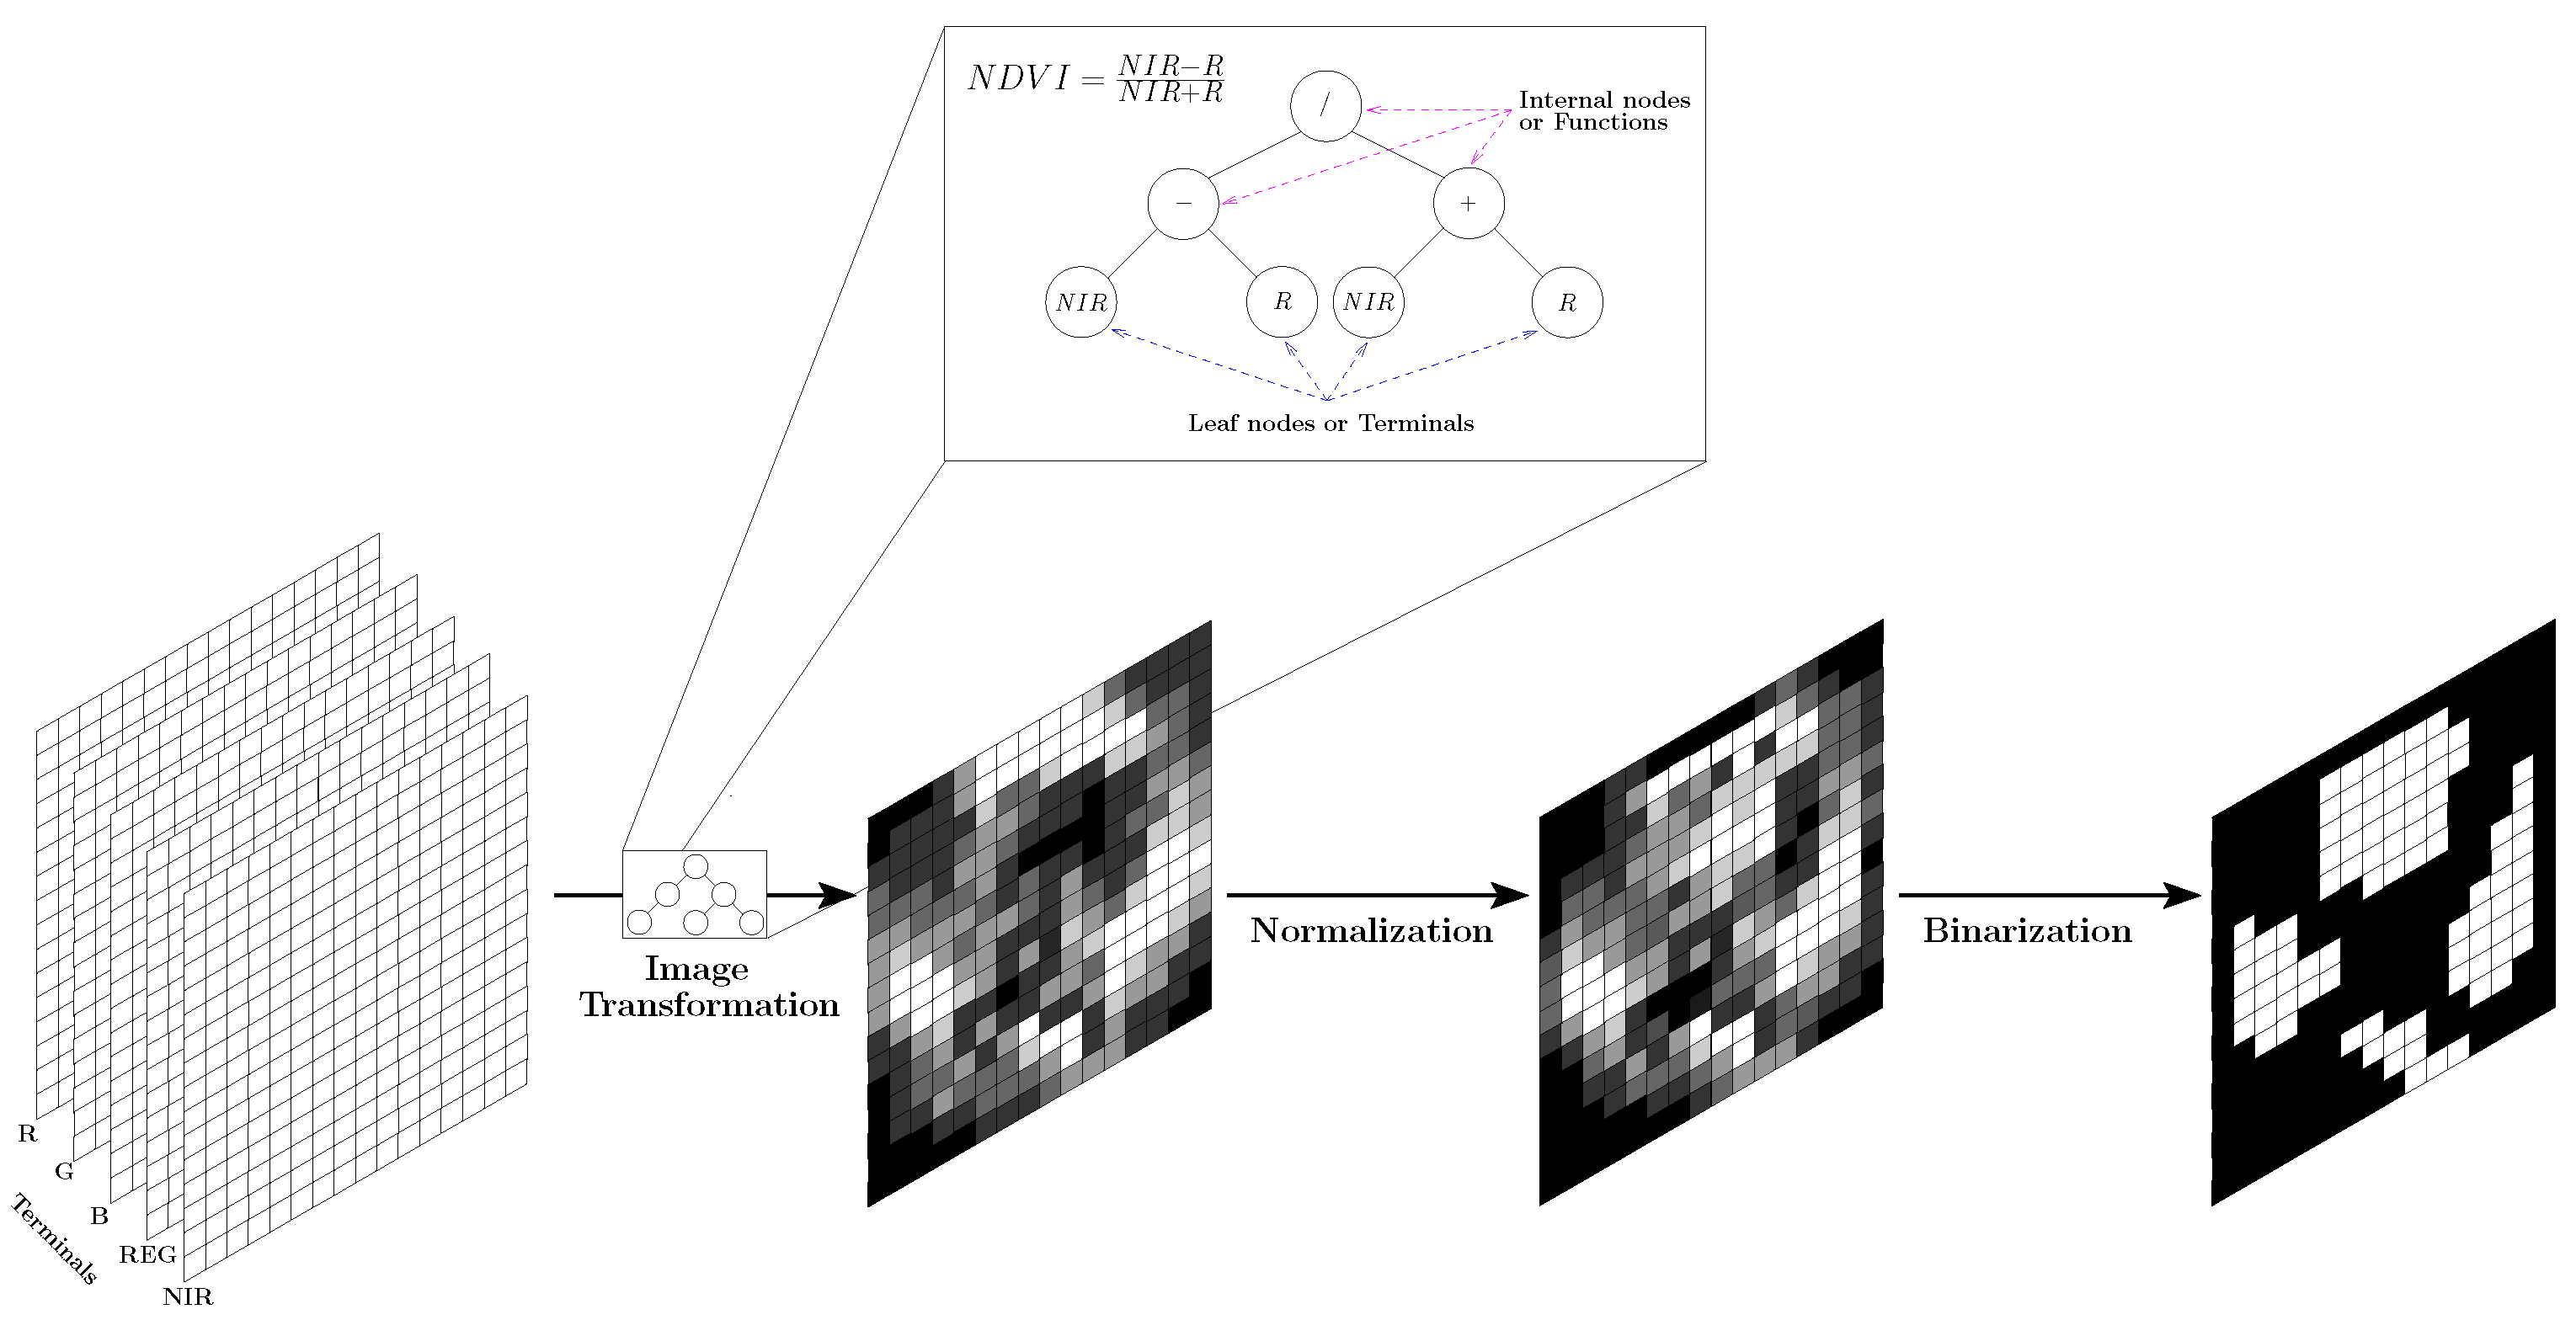
We start with an analysis of the structure of the 50 best solutions, with the aim of determining which are the most used terminals and functions are use the most to generate mistletoe detectors.
Figure 4 and
Figure 5 show the frequencies of the use of terminals and functions employed in the evolutionary process of GP (see
Table 3); the bar diagrams show the number of individuals who used each terminal or function, respectively, while the line graph refers to the number of times each terminal or function is used in the set of the best individuals of each generation. Notice that all the spectral bands were employed in the construction of algorithms for the detection of
P. velutinum, however, both
R and
B bands were used constantly in almost all sets of the best individuals. On the other hand, regarding the use of functions, note that the absolute subtraction and division correspond to the most used arithmetic operators, followed by square and round operations. Considering that the GP algorithm is a stochastic method that directs the search for the best solution to subspaces where it is more likely to find better solutions, we could say that the most common terminals and functions among the 50 best solutions, i.e.,
absolute difference, and division, are useful for the detection of
P. velutinum.
In
Section 3.4.1, we explain the fitness function that we used to guide the evolution of GP and find a solution that not only makes the least number of errors, but also generates the smallest number of false positives, i.e., labels a pixel as mistletoe when it is not. With the aim to assess the effectiveness of our fitness function in this respect, we computed the false positive rate (FPR) and false negative rate (FNR) for the 50 best solutions using their corresponding test image set. As a result, the average FPR was equal to
and the average FNR was equal to
. In addition, the FPR and FNR for the best individual were
and
, respectively. Therefore, the FPR of the 50 best solutions is much lower than their FNR.
4.3. Analysis of the Best Solution
Our GP implementation was able to determine several individuals or solutions for pest identification, however, the best individual, performing with the highest accuracy, has the form:
where
is a constant scalar. The aforementioned expression can be considered as a feature extractor operator designed for mistletoe detection.
To highlight some ideas to help us understand how this solution works, here is a plausible explanation of how the more complicated and informative terms in Equation (
4) work.
First, we were struck by the term
because this results in complex numbers with the form
, where
and
are, respectively, the real and imaginary parts (see the
Appendix A for a demonstration). This is a result of all spectral bands having been normalized to the interval
with the MATLAB function
rescale, and the logarithm function for numbers within this interval producing negative values.
Next, the modulus of the resulting complex numbers is calculated, and is equal to the Euclidean distance between
and
points. Note that the values of
a and
c depend exclusively on the value of
R, and that the distance is directly proportional to the value of
R. As you can see, the modulus term does not yield any more useful information than the
R band alone. There is no other term in Equation (
4) that results in complex numbers.
After rounding the modulus to the nearest integer, which means more information loss, the following term is subtracted:
note that the upper limit of the following term is the
Red–Green Ratio Index, and the lower limit is very close to it too. Hence, in a similar way to the
Red–Green Ratio Index, this term could be an indicator of the content of anthocyanin, which may be a red, purple, blue, or black pigment, and of the chlorophyll concentration in leaves [
40]. The
band is used to accurately estimate the green leaf area index (LAI), as reported in [
41]. However, the values of
to the fourth power are very small, so it has very little effect on the result of this ratio, which tends to its lower limit.
The combination (subtraction) of both terms could yield little or no information about the mistletoe location, as shown in the example in
Figure 6b. However, more tests are needed to determine this accurately.
On the other hand, we will now focus on analyzing two terms that, as shown in
Figure 6a,f, yield a result that facilitates the location of the mistletoe. Considering first the term
, we can say that it represents the distance between the reflectance values of the red and blue bands. The difference
is used to estimate the chlorophyll content of leaves, in a similar way to the spectral index analyzed by authors in [
42]. The second term is
. In the Remote Sensing community, the
ratio is known as Iron Oxide Ratio and tends to highlight red or orange-colored materials, which absorb band
B and reflect band
R [
43]. The logarithmic transformation of the input compresses the range of pixel values, which has the effect of improving the contrast and sharpness of regions with low pixel values, and it is frequently used in digital image processing [
44,
45]. Note that both the distance term and the ratio term between
R and
B increase as the values of
R become larger or those of
B become smaller. Based on this information, it stands to reason that these two terms have high responses to the characteristic pigmentation of mistletoe. Since this assumption does not provide enough evidence, we decided to measure the performance of these two terms when used in isolation for mistletoe detection. The results demonstrate their great contribution to the correct functioning of the solution in Equation (
4). These experiments and results are shown in the next
Section 4.4.
Regarding the second factor of the best solution and based on its response to the image shown in
Figure 7, we can say that it apparently yields information that allows us to distinguish bare dry soil from the rest. This information could be helpful in ruling out regions of bare dry soil as a location for mistletoe.
The multiplication of the two factors in Equation (
4) shows that the greatest values correspond to the location of the mistletoe in the image, although some other smaller peaks can also be observed (see
Figure 8). As we mentioned in
Section 3.4, after applying the mistletoe detector, an iterative nonlinear normalization operator is applied, which after a few iterations strengthens the initial maximum(s), while at the same time suppressing regions with lower activation [
32]. Finally, the map obtained is binarized using a threshold equal to zero.
4.4. Comparison with Other Methods
The characteristics of the GP metaheuristic make it possible to obtain multiple solutions to the same problem. Therefore, the 50 best algorithms or solutions generated by GP were compared with two traditional methods, frequently used in the literature for the same purpose: the SIPI2 index and the SVM classification technique. These solutions were also compared with two additional indices obtained during the analysis of the best solution of GP, which are
and
, as discussed in
Section 4.3.
In the case of SVM, pixel-based classification paradigm [
46] was implemented to increase the sample size and facilitate the definition of the support vectors, using the same train and test folders as in GP. The optimal set of parameters for SVM were set using a cross-validation through the Scikit-learn GridSearchCV package, set a polynomial kernel, with a regularization parameter C = 100 and a
for this classification. Then, a sample of 1 million pixels, balanced by class, was randomly selected, of which 30% was assigned as validation and 70% was for testing, and from the test set, a random sample of 100 thousand pixels, balanced by class, were selected to perform the model testing. The implementation of this method was done in Google Colab with the
scikit-learn package.
On the other hand, with the aim of determining the threshold values that maximize the classification of mistletoe with SIPI2, , and indices, we performed several experiments with a sample of 100 randomly selected images, varying the threshold values from −1 to 1; at the end of the processes, we obtained the corresponding threshold values providing the best classification accuracy score, , which were the following: 0.9, 0.15, and 0.236, for SIPI2, , and , respectively.
It is important to note that both GP and SVM were optimized using data from the same set of 200 images. In addition, the selection process of the SVM parameters as well as the threshold values for SIPI2,
, and
, ensures that the classification results, shown in
Table 5, are the best that can be obtained for the test image set that we used.
The first two rows of
Table 5 show the results of the two best individuals determined by the GP method, while the next two rows present the results of the two worst individuals. Notice that the results of the best individual appear in the first line, which obtained an average value of
at the test stage, an Overall Accuracy (OA) of
, a recall that indicates that 48% of the total pixels of
P. velutinum were detected, and a precision indicating that half of the pixels that were labeled as
P. velutinum were correctly classified.
On the other hand, the SIPI2 method obtained an OA = 54% and 43% of the
P. velutinum pixels were detected, but only 2.8% of the pixels that were labeled as mistletoe were correctly classified; this can be clearly seen in
Table 6 in white and magenta, respectively. The SIPI2 achieved these results by labeling a large number of pixels as mistletoe.
Regarding the SVM method, it achieved an OA of 88%, from which 15% of the mistletoe pixels were detected and 70% of the pixels that SVM classifies as P. velutinum were correctly classified. These results indicate that although SVM detects very little mistletoe, this method is highly reliable for doing this task.
Furthermore,
Table 6 illustrates the performance of the best solution in Equation (
4), obtained for four images. It also presents the performance for SIPI2 and SVM methods. A visual inspection of the corresponding maps confirms what we have stated before.
As we mentioned earlier and supported by the results shown in
Figure 6a,f, the information that allows mistletoe to be detected originates from the
and
terms. In order to demonstrate this assumption, we decided to measure the performance of these terms while they were used in isolation for the detection of mistletoe. The results in
Table 5 show that mistletoe detection using
reached an OA = 91.3%; 32% of the mistletoe was detected and 37% of what was classified as
P. velutinum really was. Regarding the results of using
, this term obtained an OA = 73.2%; 65% of the mistletoe was correctly detected, the highest recall of all solutions, but only with 0.25% of precision.
Table 7 depicts a few examples of response maps of both
and
terms.
4.5. Mistletoe Map Detection
In
Figure 9, the result of the implementation of the GP algorithm for the automated detection of
Phoradendron velutinum in the case study of the Conservation Area of Mexico City is shown in red spots; for comparison purposes, the in situ sampling of
P. velutinum was overlapped and displayed in blue circles in the same figure. A section of the study area mentioned previously was taken as an experiment, to visualize the areas affected by mistletoe. It is worth mentioning that the implementation refers to the final use of the best algorithm generated with GP (see Equation (
4)) directly in the images to be classified, obtaining the location of infestation hot spots by
P. velutinum related to the flowering stage.
5. Discussion
The proposed Genetic Programming methodology for the automatic design of an algorithm for detecting
Phoradendron velutinum in multispectral images of the conservation area yielded a detector that presents better performance and a greater generalization value compared to other methods that have traditionally been used either to detect forestry patterns, such as SIPI2, or to learn the distribution of the data in a defined search space, such as SVM. The SIPI2 was not generated specifically for the detection of this particular mistletoe species, nor for the specific study area, therefore, detection using SIPI2 is very poor, although the threshold that maximizes its accuracy was chosen. Although the SVM is the most accurate detector, it also had the lowest recall, which renders it useless as it misses 85% of the mistletoe. On the other hand, the term
is the most sensitive, it detects 65% of the
P. velutinum pixels. However, as can be seen in
Table 5, the best GP-generated algorithm has the second-best recall and precision, making it the most suitable solution. Furthermore, as indicated by its FPR = 0.007, we obtained a solution that gives very few false alarms, which is what we intended to do by using the disagreement matrix when calculating fitness, see
Section 3.4.1 and
Section 4.2, since it generates high human and financial costs, mobilizing work commissions for mistletoe control, when this parasitic plant is not found in said area. It is also important to mention that the obtained solution has the best OA = 96.6%.
From a visual evaluation of the examples of response maps, see
Table 6 and
Table 7, it is possible to infer that some of the errors by omission near areas correctly classified as
P. velutinum increase in perimeter areas of the mistletoe, due to the crossing that exists between the final branches of the mistletoe and those of the host tree, limiting the differentiation between species because there is not enough spatial resolution to find these differences.
The solutions obtained by GP are mostly based on the visible spectrum bands, as shown in
Figure 4. It is very likely that this is due to the characteristic yellow-orange color of
P. velutinum, in the flowering stage. However, as shown in Equation (
4), the
REG band makes specific contributions in the discrimination of
P. velutinum from other types of vegetation.
The
R and
B bands and the absolute difference and division operations are the most used by the best solutions. During the analysis of the best solution of all, we discovered that the terms
and
could play an important role in its operation, which was confirmed by the results shown in
Table 5. Note that both terms are composed precisely by the most used terminals and functions. All these results are consistent. However, neither of these two terms in isolation performs better than the best solution that combines the result of both. This suggests that the two terms could perhaps be used as building blocks for more robust detectors.
6. Conclusions and Future Work
Automation in the detection of the mistletoe species Phoradendron velutinum with the use of spectral images is a complex task due to the heterogeneity of vegetation cover found in areas such as the Conservation Area of Mexico City, coupled with the few physical and visual characteristics that are known in the detection in images of this parasitic plant. The detection of pests such as P. velutinum is important due to the relevance of host forests in environmental, social, and economic contexts, in addition to the difficult detection of new outbreaks due to the easy spread of the pest.
The algorithm obtained by using a Genetic Programming approach for the detection of P. velutinum presented in this manuscript represents a clear and viable solution for the generalization of this task in the proposed study area. This algorithm allows the detection of the pest with 96.6% Overall Accuracy, considering information from both the visible and red edge intervals of the electromagnetic spectrum.
From the findings found with the implementation of GP in the detection of mistletoe, it is possible to deduce that the physical properties of mistletoe and its relationship with the territory allow the early detection of foci of infestation. Additionally, it is possible to appreciate a great competitive advantage over other detection methods, since in addition to solving this problem efficiently, it is able to generalize the solution to the entire study area in different image acquisition conditions, both lighting and exposition.
It is important to emphasize that the development of the proposed algorithm for the detection of P. velutinum and the training data are limited to the characteristics of the conservation area of Mexico City, therefore, it will be essential to carry out tests and improvements in the methodological characteristics to study new areas where mistletoe is present. Furthermore, this research reveals that the terms and can be used in the future design of better and more robust P. velutinum detectors.
Future research will be oriented towards the application, or even adaptation, of the proposed GP algorithm to other forest areas, including those surrounded by urban environments. In addition, based on the high performance of the best individual determined by GP, it becomes necessary to implement further comparisons with several traditional and novel classification algorithms.


