Article

Quantification of Foraging Areas for the Northern Bald Ibis (Geronticus eremita) in the Northern Alpine Foothills: A Random Forest Model Fitted with Optical and Actively Sensed Earth Observation Data

1
Waldrappteam Conservation & Research, Schulgasse 28, 6162 Mutters, Austria
2
EAGLE, Institute for Geography and Geology, University of Wuerzburg, 97070 Wuerzburg, Germany
3
Department of Cognitive Biology, University of Vienna, Althanstrasse 14, 1090 Vienna, Austria
*
Author to whom correspondence should be addressed.
Remote Sens. 2022, 14(4), 1015; https://doi.org/10.3390/rs14041015
Submission received: 31 December 2021 / Revised: 10 February 2022 / Accepted: 17 February 2022 / Published: 19 February 2022
(This article belongs to the Special Issue Use of Remote Sensing Techniques for Wildlife Habitat Assessment)

Abstract

:
The Northern Bald Ibis (Geronticus eremita, NBI) is an endangered migratory species, which went extinct in Europe in the 17th century. Currently, a translocation project in the frame of the European LIFE program is carried out, to reintroduce a migratory population with breeding colonies in the northern and southern Alpine foothills and a common wintering area in southern Tuscany. The population meanwhile consists of about 200 individuals, with about 90% of them carrying a GPS device on their back. We used biologging data from 2021 to model the habitat suitability for the species in the northern Alpine foothills. To set up a species distribution model, indices describing environmental conditions were calculated from satellite images of Landsat-8, and in addition to the well-proven use of optical remote sensing data, we also included Sentinel-1 actively sensed observation data, as well as climate and urbanization data. A random forest model was fitted on NBI GPS positions, which we used to identify regions with high predicted foraging suitability within the northern Alpine foothills. The model resulted in 84.5% overall accuracy. Elevation and slope had the highest predictive power, followed by grass cover and VV intensity of Sentinel-1 radar data. The map resulting from the model predicts the highest foraging suitability for valley floors, especially of Inn, Rhine, and Salzach-Valley as well as flatlands, like the Swiss Plateau and the agricultural areas surrounding Lake Constance. Areas with a high suitability index largely overlap with known historic breeding sites. This is particularly noteworthy because the model only refers to foraging habitats without considering the availability of suitable breeding cliffs. Detailed analyses identify the transition zone from extensive grassland management to intensive arable farming as the northern range limit. The modeling outcome allows for defining suitable areas for further translocation and management measures in the frame of the European NBI reintroduction program. Although required in the international IUCN translocation guidelines, the use of models in the context of translocation projects is still not common and in the case of the Northern Bald Ibis not considered in the present Single Species Action Plan of the African-Eurasian Migratory Water bird Agreement. Our species distribution model represents a contemporary snapshot, but sustainability is essential for conservation planning, especially in times of climate change. In this regard, a further model could be optimized by investigating sustainable land use, temporal dynamics, and climate change scenarios.

Graphical Abstract

1. Introduction

The Northern Bald Ibis (NBI, Geronticus eremita) used to live as a migratory species in various areas around the Mediterranean. Known wintering sites were located along the west coast of Africa down to Mauritania and Senegal and along the east coast to Eritrea and Ethiopia [1,2,3,4,5,6]. Human influence and climate change caused the extinction of the Egyptian population already at the end of the third millennium BC and of the European population in the early 17th century [7,8]. In almost all further regions, the species went extinct during the 20th century. Only one population on the Moroccan coast remained [1,9]. The species was listed on the IUCN Red List as critically endangered for 24 years before it was downlisted to endangered in 2018, due to successful conservation efforts in Morocco, zoo breeding programs, and ongoing translocation projects in Europe [10,11].
Being a gregarious species, the NBI used to breed in colonies with up to several thousand individuals on cliffs, using niches and caves as nesting sites. Evidence is also given for broods on castles, towers, or ruins [3,7].The long, curved and abundantly innervated bill makes the NBI a highly specialized tactile hunter. In suitable habitats, it mainly feeds on larvae and worms, which it pokes out of the ground from a depth of up to 10 cm [12,13,14]. But the species is also known for its high flexibility regarding its feeding behavior if required. A meanwhile extinct relict population in the Syrian desert was known to feed on tadpoles [15]. A managed population in Birecik, Turkey, feeds on mint crops or in fields covered with manure, in addition to the offered food [16]. The remaining wild population in Morocco, which changed to a sedentary lifestyle, mainly feeds on lizards and beetles, even though the morphology of the bill and the positioning of the eyes make the NBI rather inefficient at catching fast-moving prey [9,14,17].
In the range of the northern Alpine foothills, indications of several historical NBI breeding sites are documented [3,8]. Most of the historical knowledge was documented by the Swiss naturalist Conrad Gesner (1516–1565). In his Historiae animalium [18], he described the gastric section of a European NBI, where he found larvae of cockchafers, mole crickets, and other insects. Historically, meadows, pastures, and gardens are named as main foraging habitats. The use of cultivated land and the resulting proximity to human settlements has probably also contributed significantly to the extinction of the European populations, and elsewhere [7,17,19].
Historical data on habitat use and feeding ecology largely correspond to the feeding ecology of a currently released migratory NBI population in Central Europe, with breeding sites located in the historic NBI range. These birds mainly feed on open meadows and pastures with earthworms and larvae as their primary prey [14,17].The European migratory population currently consists of about 200 individuals. Offspring of zoo breeding colonies were hand-raised by human foster parents. They learned the migration route through human-led migration as the main translocation method before they were released in the wintering area in southern Tuscany [11,12]. Nowadays, there are three breeding colonies north of the Alps. Within the next years, further conservation measures are planned, to ensure a self-sustaining NBI population [20].
For planning conservation measures in the scope of reintroduction projects, precise information on actual and potential species distributions is essential to enhance the chances of success [21,22,23,24,25]. Incorporating remotely sensed data as environmental predictors is a standard technique in species distribution modeling, as they cover large areas with an appropriate resolution [26,27,28,29,30]. Earth observation missions like NASA’s Landsat and the European Sentinel fleet (ESA) cover the entire planet, revisiting each place every 16 days and 5–6 days respectively [31]. Due to their availability and their high spatial and temporal resolution, both are frequently used for species distribution modeling. Although species distribution models alone cannot ensure reintroduction success, they provide a realistic framework for action [21,26].
About 90% of all NBIs of the European migratory population are monitored remotely by the use of conventional GPS devices [32]. GPS tracking of so many individuals allows us to perform a species distribution model with precise information on presence data for the entire population, with the additional benefit that we can register and reduce mortality causes [6,20].The population contains breeders, mainly subadult non-breeders and juveniles. The breeders and juveniles generally stay close to the breeding site during the main part of the breeding season, where their small-scale movements are driven by their foraging activities (Figure 1). Non-breeders, in contrast, are not tied to the breeding sites. They generally move on a large scale along the northern Alpine foothills, where numerous observations clearly indicate that they selectively visit areas with high food abundance and stay there for longer periods [17]. Thus, we expect GPS positions of breeders, non-breeders, and juveniles to aggregate around areas with high foraging suitability. By linking GPS data to environmental variables gathered from earth observation satellites, we created a foraging suitability index based on NBI presences, which we then applied to the entire area of interest [26,27,28,29,30].This area largely included the documented breeding range of the historic European NBI population. Based on our insights, we discuss implications for future translocation and management measures for the conservation of the NBI population.

2. Methods

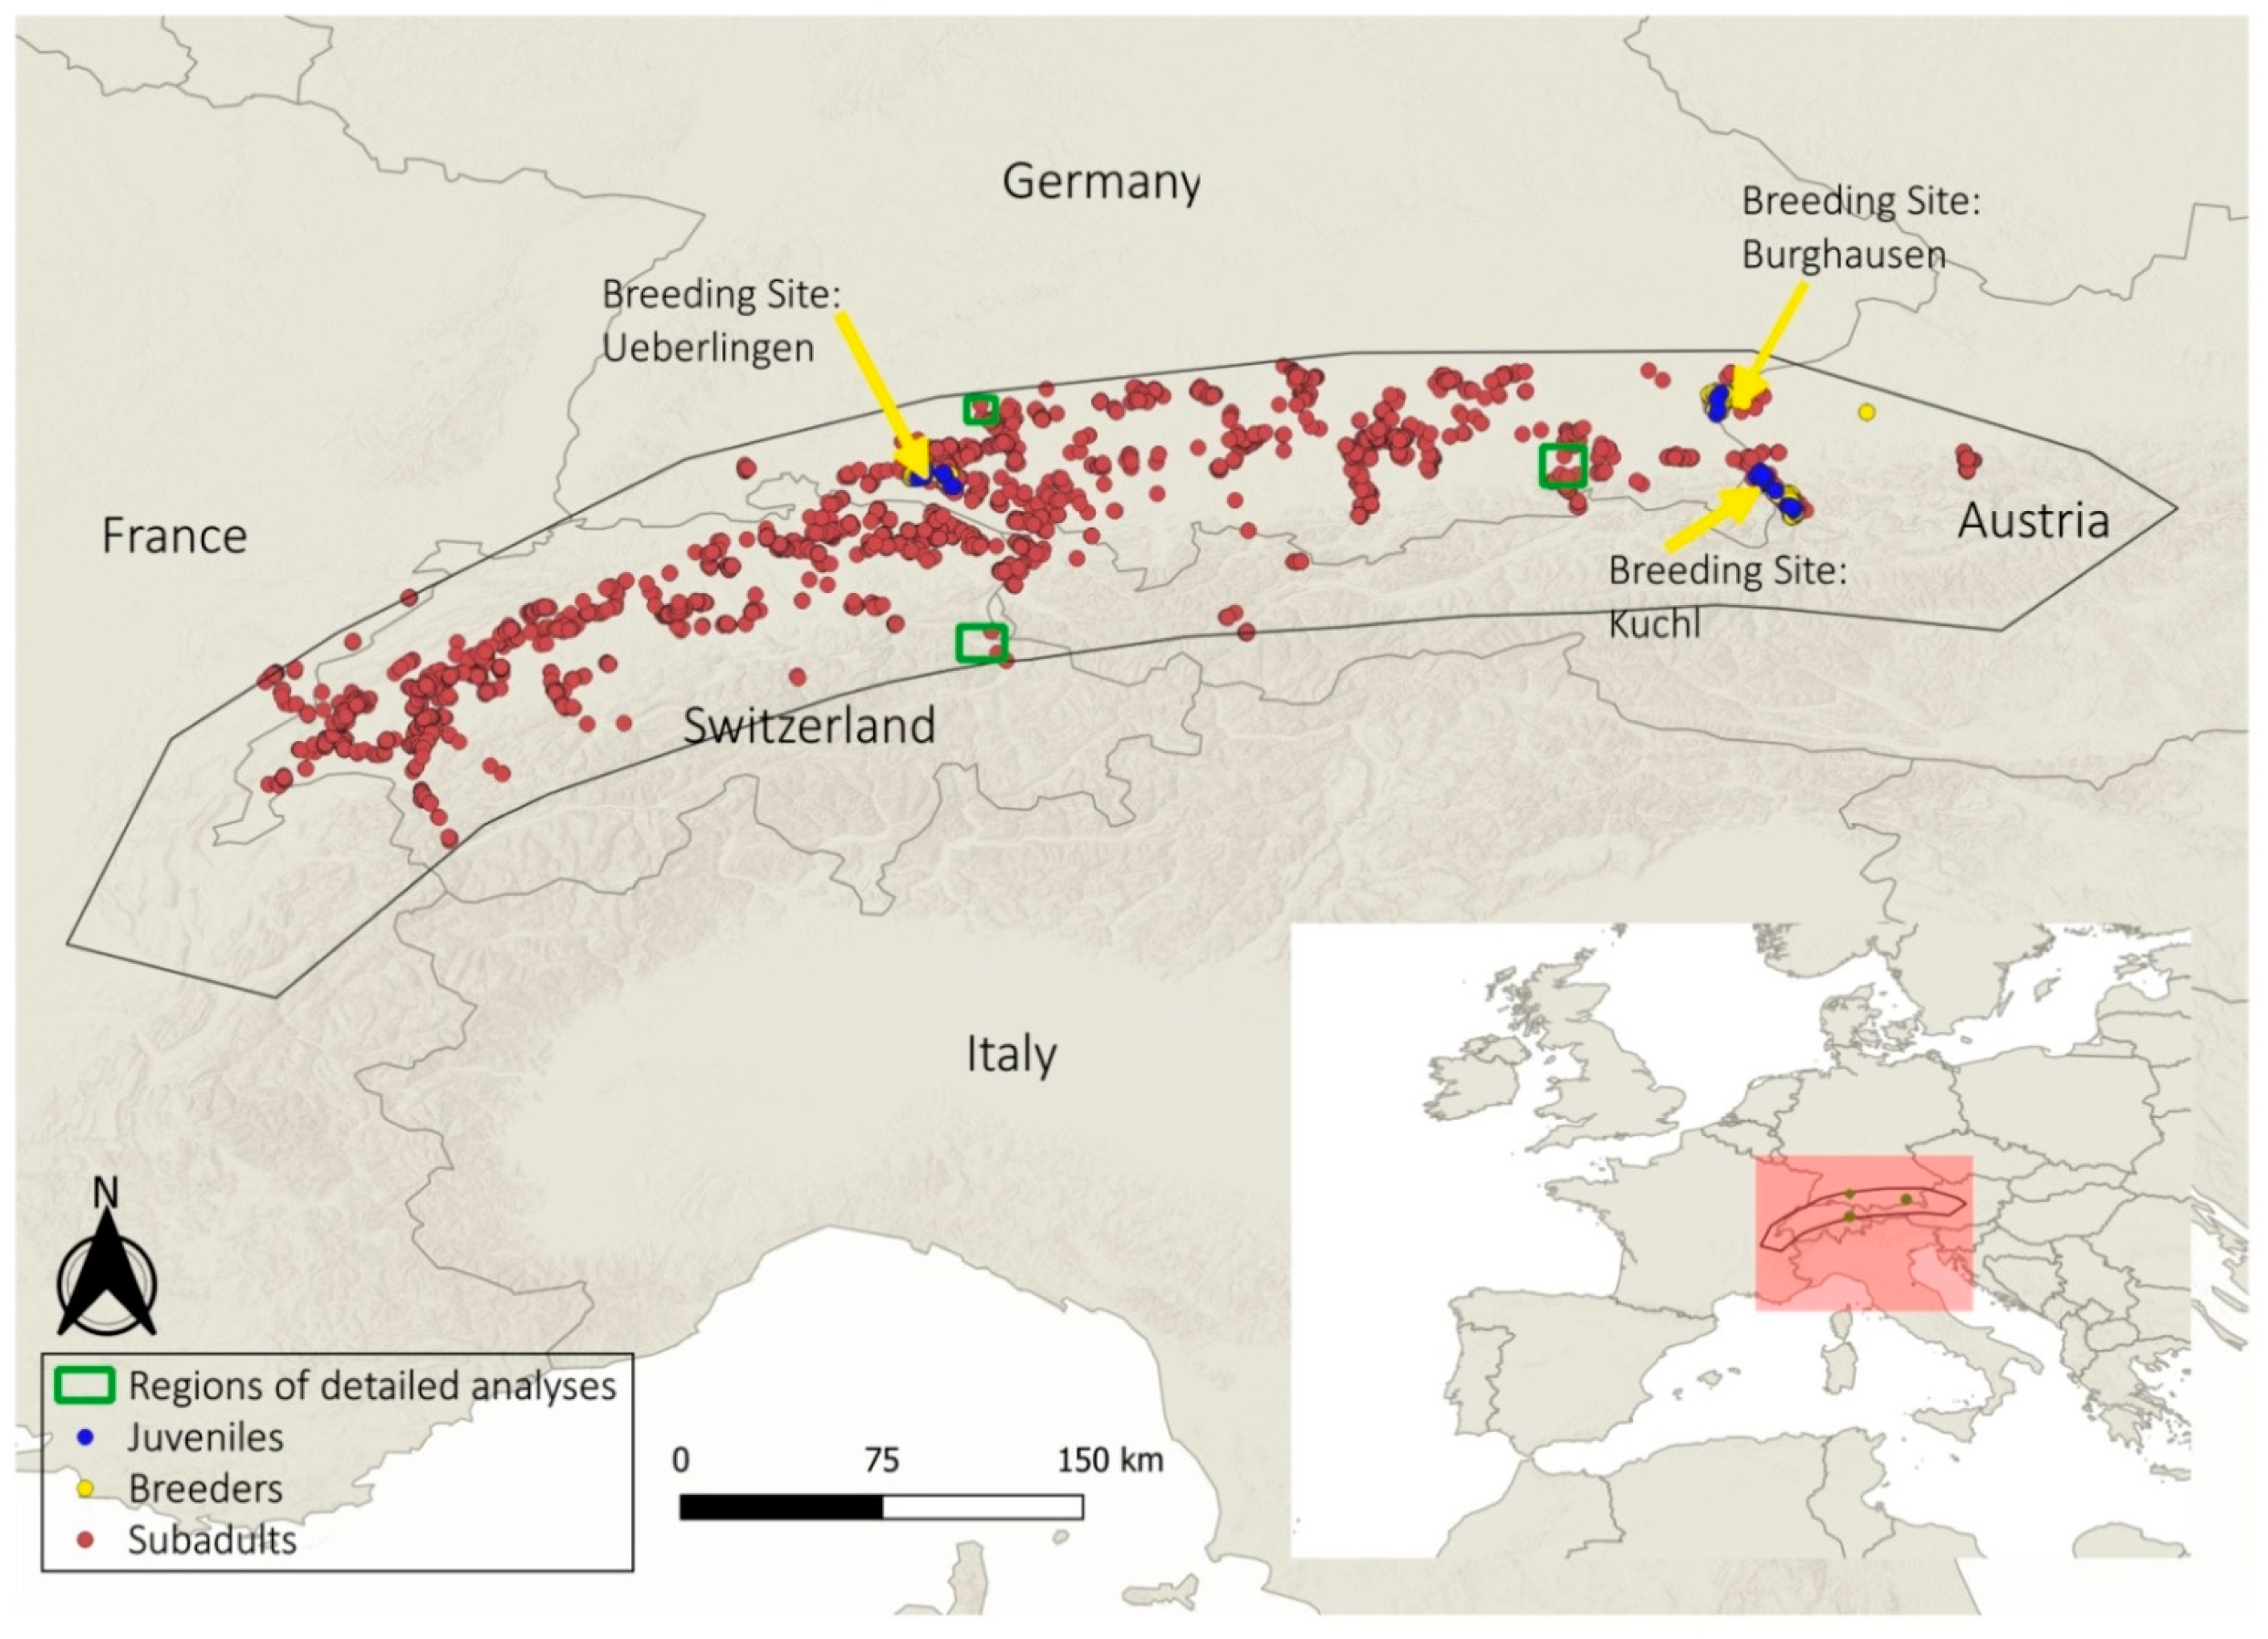
2.1. Study Species and Study Area

The reintroduction of a migratory NBI population started in 2014, in the frame of a European LIFE+ project (LIFE+12-BIO_AT_000143) with seven partners from Austria, Germany, and Italy. A 13-year feasibility study on translocation methodology and bird ecology preceded the LIFE+ project [12]. Nowadays, the population consists of about 200 individuals, which migrate between the common wintering site, a WWF reserve in southern Tuscany, and four established breeding sites in Bavaria, Baden-Wuerttemberg, Salzburg, and Carinthia. Since 2012, the birds reproduce in the wild, with 36 chicks fledged in 2021 [11,20]. In 2022, a second seven-year LIFE project (LIFE20 NAT/AT/000049) is going to start, directed by the Zoo Vienna and nine partners from Austria, Germany, Italy, and Switzerland. This second LIFE project aims at leading the existing population to self-sustainability by exceeding the calculated threshold population size of about 350 individuals [11,20].
Several historic NBI breeding sites were located along the northern Alpine foothills [3,8,33]. Therefore, an approximately 130 km wide area of 98,768 km2 along the northern edge of the Alps was analyzed (Figure 1). Additionally, three regional examples were chosen for an in-depth observation: (I) Bad Ragaz/Pfäfers (CH, 160 km2, 47.001481°, 9.502749°), as a documented historic breeding site in an Alpine environment (Schen-ker, 1977); (II) a rural area north of Lake Constance (DE, 160 km2, 47.831484°, 9.055227°), located in the transition zone between grassland farming in the south and predominantly arable farming to the north; (III) Rosenheim (DE, 490 km2, 47.856210°, 12.123908°), as an example of a highly urbanized area.

2.2. Biologging

Since 2016, about 90% of the release population and their wild-hatched offspring are equipped with GPS devices [32]. During the study period, most of the devices were solar-powered commercial tags. All tags are positioned on the lower back of the birds and fixed via a leg-loop harness made of Teflon tube. The data is automatically transferred to the open-source animal movement platform Movebank (https://www.movebank.org/cms/movebank-main; accessed on: 12 November 2021) as well as to the internal database owned by the enterprise Waldrappteam Conservation & Research. All analyses were done using data from the internal database.
For our habitat suitability analysis, we used biologging data of 78 wild roaming birds (27 breeders with 14 females and 13 males; 25 non-breeders with 12 females and 13 males; 26 juveniles with 13 females and 13 males) within the defined study area during the spring migration and breeding season (May to August 2021). To exclude positions recorded during flight, only positions with a speed of less than 5 m/s were used. GPS positions within a 100 m radius around the three breeding sites were excluded. Furthermore, only daytime GPS positions (between 07:00 AM and 06:00 PM) were used, to exclude overnight roosting. Ultimately, the selected GPS positions were recorded primarily during foraging and daytime roosting. NBIs normally roost at a close distance to their foraging grounds (trees or electric power poles), which cannot be disentangled from the foraging grounds themselves on the scale of our analysis. Processing and preparation of the NBI movement data were performed in QGIS [34]. Overall, a total of 204,074 NBI biologging positions were used to set up the model.

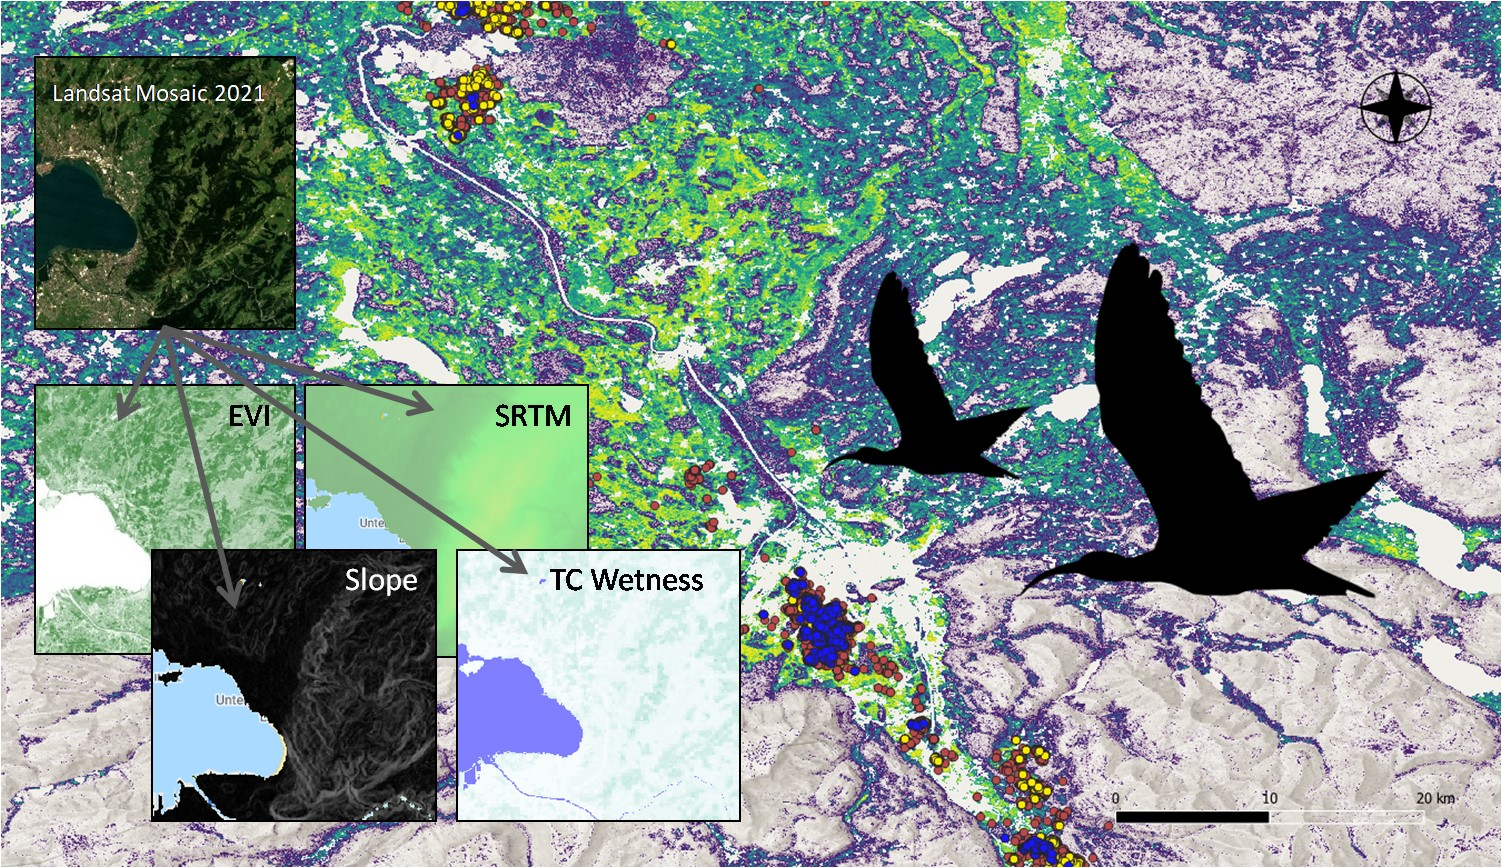
2.3. Environmental Indices

We used 11 environmental indices from 7 different data sources (Table 1). Landsat-8 data provides several useful indices which we incorporated into our model, describing the characteristics of vegetation intensity (enhanced vegetation index, EVI), ground tasseled cap brightness (TC brightness), moisture (TC wetness), and water content (normalized difference water index, NDWI). We added the synthetic-aperture radar intensity of Sentinel-1 as an index calculated from the intensity of vertically sent and vertically received radar data (VV polarization), which reflects the ground structure and surface wetness [35,36,37]. Additionally, we applied the fractional grass cover processed by the Copernicus Land Monitoring Service from 2019 [38]. We also included the elevation and steepness of slopes, obtained from NASA’s Shuttle Radar Topography Mission in 2000 [39]. We added the surface temperature as a climatic variable [40]. Ultimately, a water mask [41] from 2013 as well as a world settlement footprint [42] made in 2015 from the German aerospace center (DLR) were used.
Data download and all pre-processing steps were done using the cloud computing platform Google Earth Engine [31]. Landsat-8 and Sentinel-1 images from the study period (Mai to August 2021) were processed into a single image mosaic. All indices were calculated from the resulting median composites. The water mask was used to exclude water surfaces from all data sources. We then computed a 100 m resolution raster covering the entire study area and assigned the environmental indices by calculating mean values from the original resolutions. This step, as well as model building, fitting and spatial prediction, were executed with R [43].
When testing the indices for collinearity, the highest correlation (0.75) was found between slope and surface temperature, since temperature decreases with elevation. Although surface temperature probably has a higher ecological relevance for NBIs, elevation data had a higher resolution, so we excluded surface temperature and used elevation as a comprehensive proxy. All other indices showed only minor correlations below 0.7 (correlation matrix can be found in the Supplementary Materials).

2.4. Species Distribution Modeling

We classified 11,000 cells as presence points because they contained one or more GPS positions. From the remaining study area, 11,000 cells were randomly chosen to apply a 1:1 relationship between presence and randomly generated background points [44,45]. Selecting background points is necessary for training models on the range of the environmental indices apart from the presence points. Finally, the value of each environmental index was extracted for each presence and background point [29,46,47].
A random forest model fitted the presence and background points with the environmental indices. The model was then used to generate a foraging suitability index, which was applied to the entire study area based on the composition of environmental indices of every single grid cell [48,49]. As post-modeling analysis revealed that the resulting model was insensitive to urbanization, we applied the world settlement footprint data to weigh down the foraging suitability in urban areas.
An additional in-depth analysis was done for the three regions outlined above, using the same methods but a higher resolution with 30 m raster cells.

2.5. Variable Importance

We estimated the variable importance for each environmental index separately to quantify its effect on the model output. We compared the prediction made from the full model to the prediction of a model where the respective variable was entirely randomized. If the randomized model prediction was highly correlated with the prediction of the full model, the index was interchangeable and did not play an important role. If the correlation was low, the index had a strong influence on the model and its prediction [49].

2.6. Ethical Standards

Bird care, keeping, training, and release followed well-established standards in accordance with the legal framework and under the supervision of Waldrappteam Conservation & Research experts. The weight of the GPS devices was about 22 grams, which is well below the recommended maximum value of 3% of the bird’s body weight of about 1300 grams [32]. The loggers were fixed on the lower back of the birds via a leg-loop harness made from Teflon tubes. This position is known to cause the least drag and minimize additional disadvantages and risks for the carrier [32]. All translocation and management measures have been implemented in the frame of the European LIFE+ project LIFE+12-BIO_AT_000143. National approvals were provided by the respective institutions of Salzburg (21302-02/239/352-2012), Carinthia (11-JAG-s/75-2004), Baden-Württemberg (I1-7.3.3_Waldrapp), Bavaria (55.1-8646.NAT_03-10-1) and Italy (0027720-09/04/2013).

3. Results

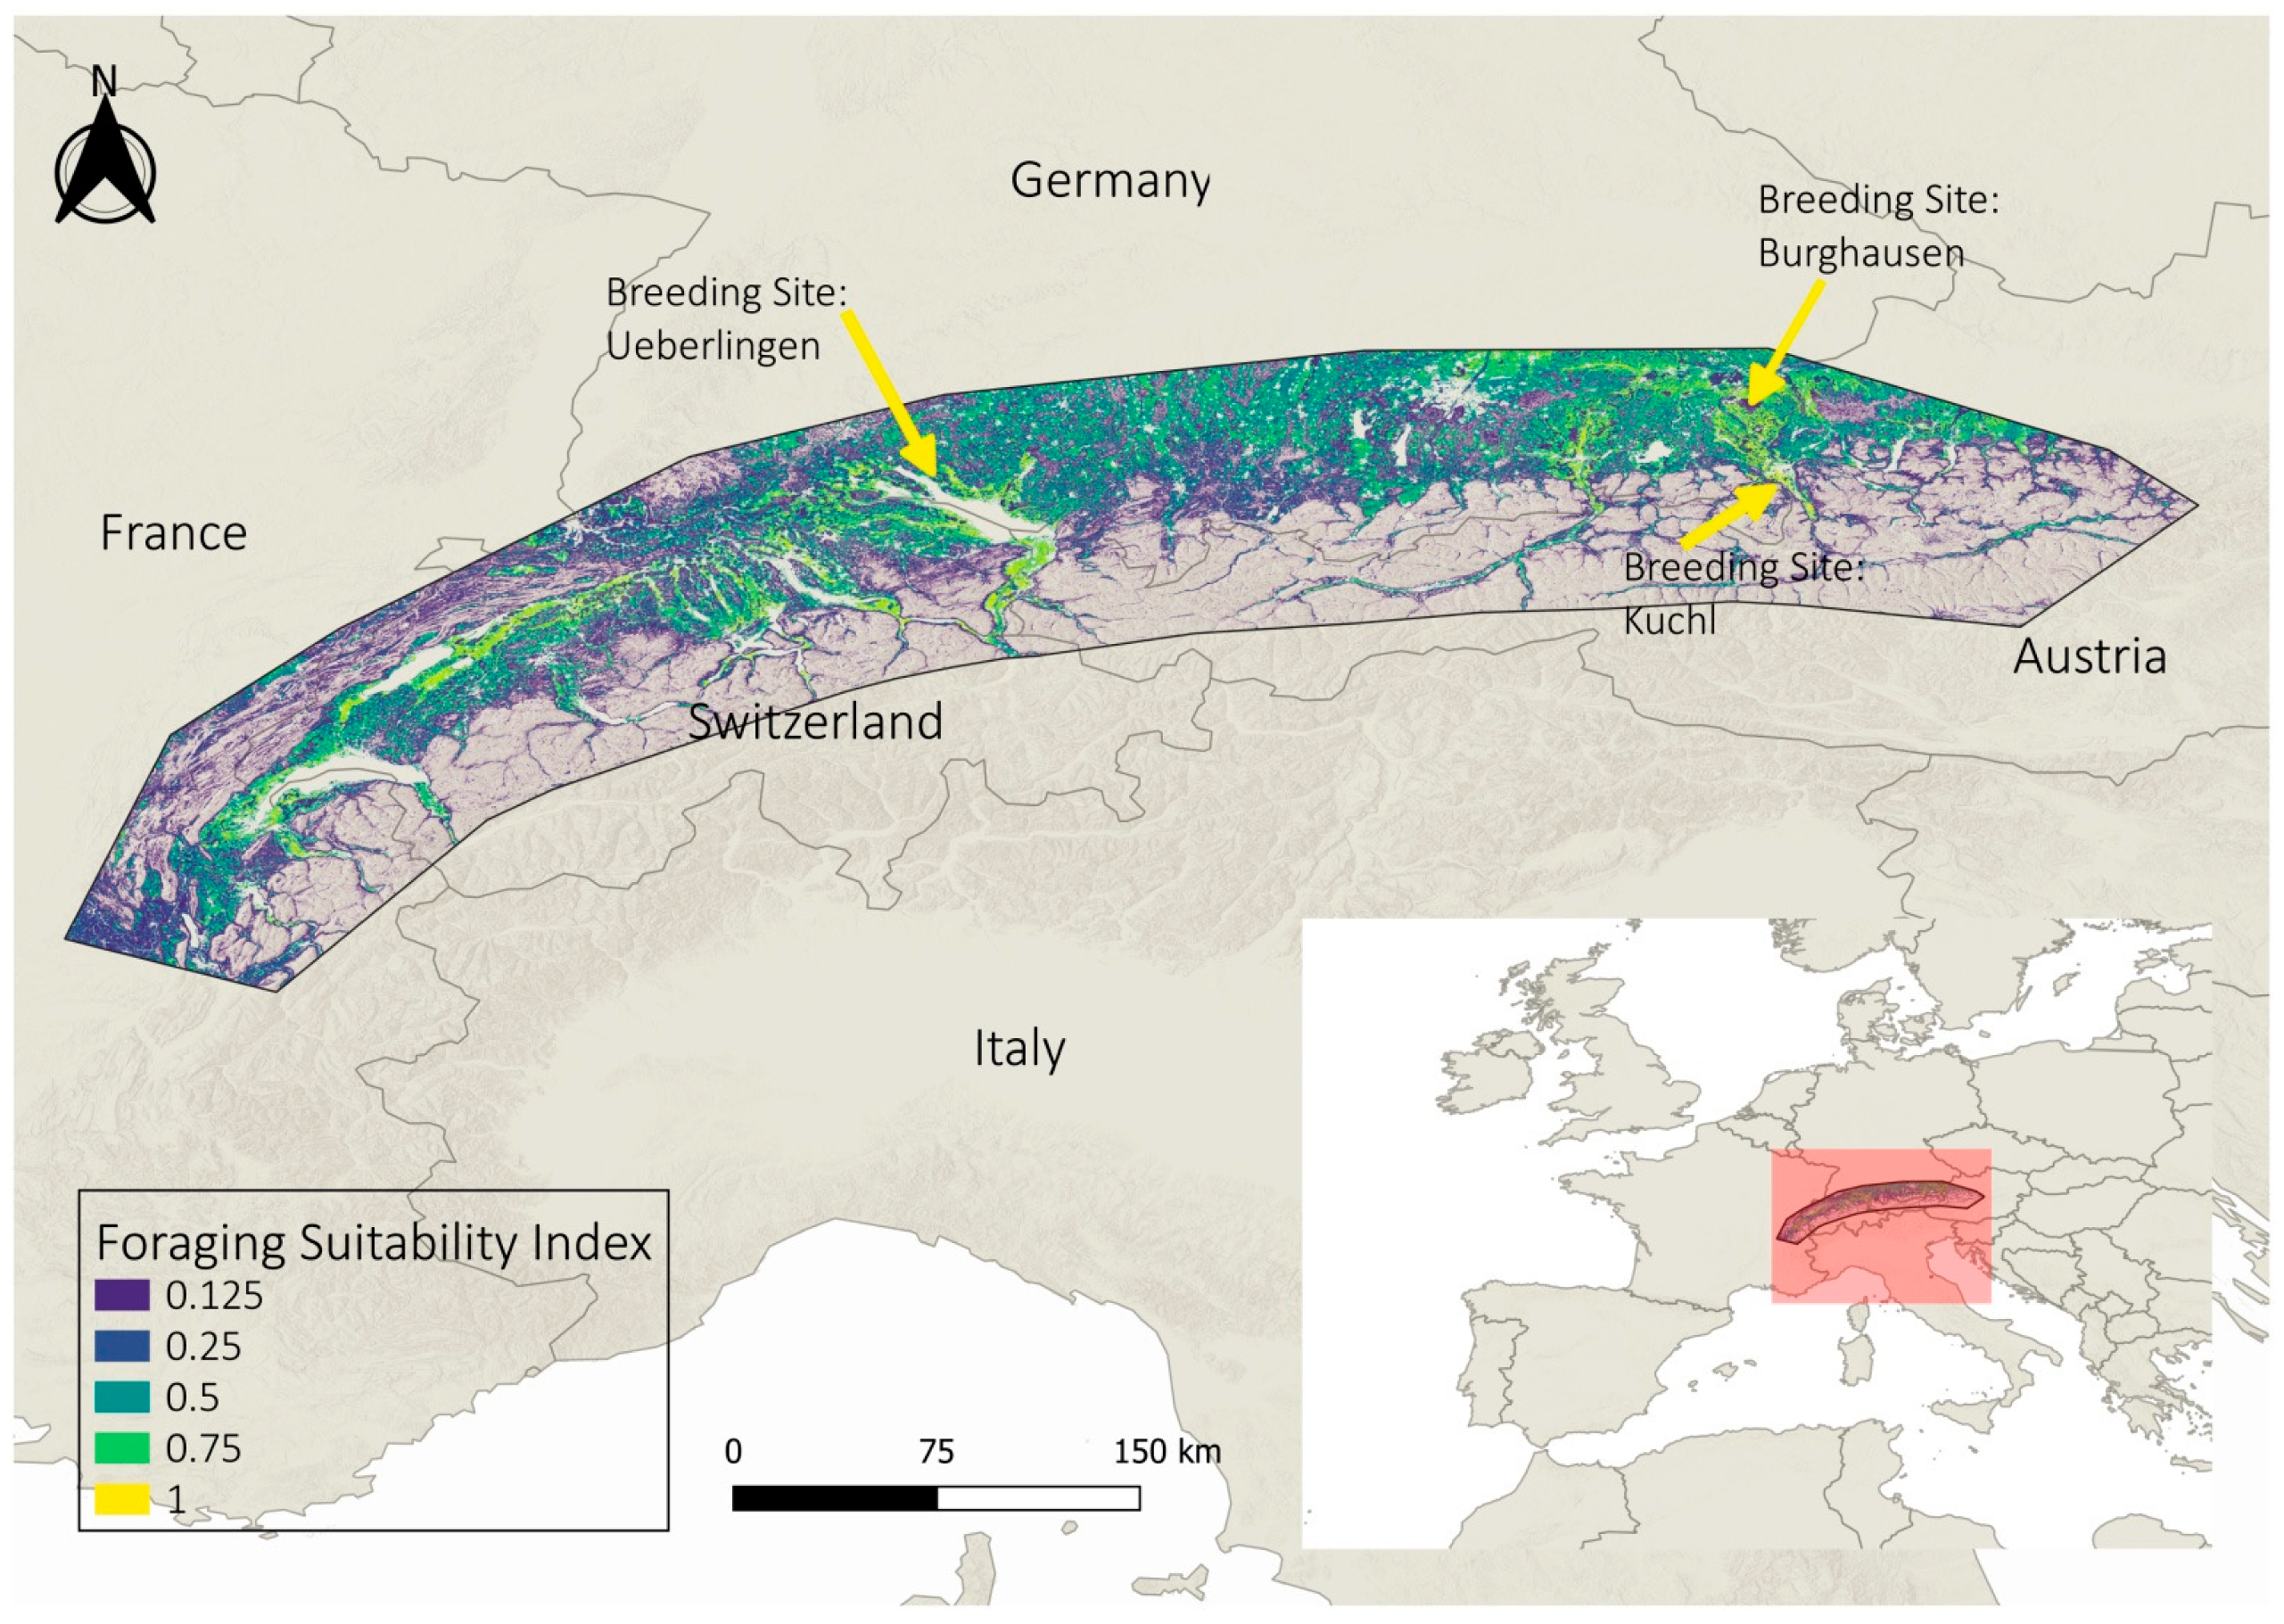
3.1. Overall Study Area

The final random forest model was used to predict a foraging suitability index, which was then applied to generate a map of the foraging suitability in the northern Alpine foothills (Figure 2; detailed model statistics can be found in the supplementary material). The overall accuracy of the random forest model was 84.5%. The variable importance ranged between 0.5 and 1. The highest importance (i.e., the lowest correlation between the standard prediction and the prediction based on randomly generated index values) was found for elevation (0.56) and slope (0.69), followed by grass cover fraction (0.76),VV intensity (0.85) and TC brightness (0.87). The lowest importance had TC wetness (0.93), EVI (0.95), and NDWI (0.96). Consequently, elevation contributed with 30.3% to the prediction, followed by slope (21.8%), grass cover (17.1%), VV intensity (10.2%) and TC brightness (9.4%). The three remaining variables contributed less than 5% each to the prediction.

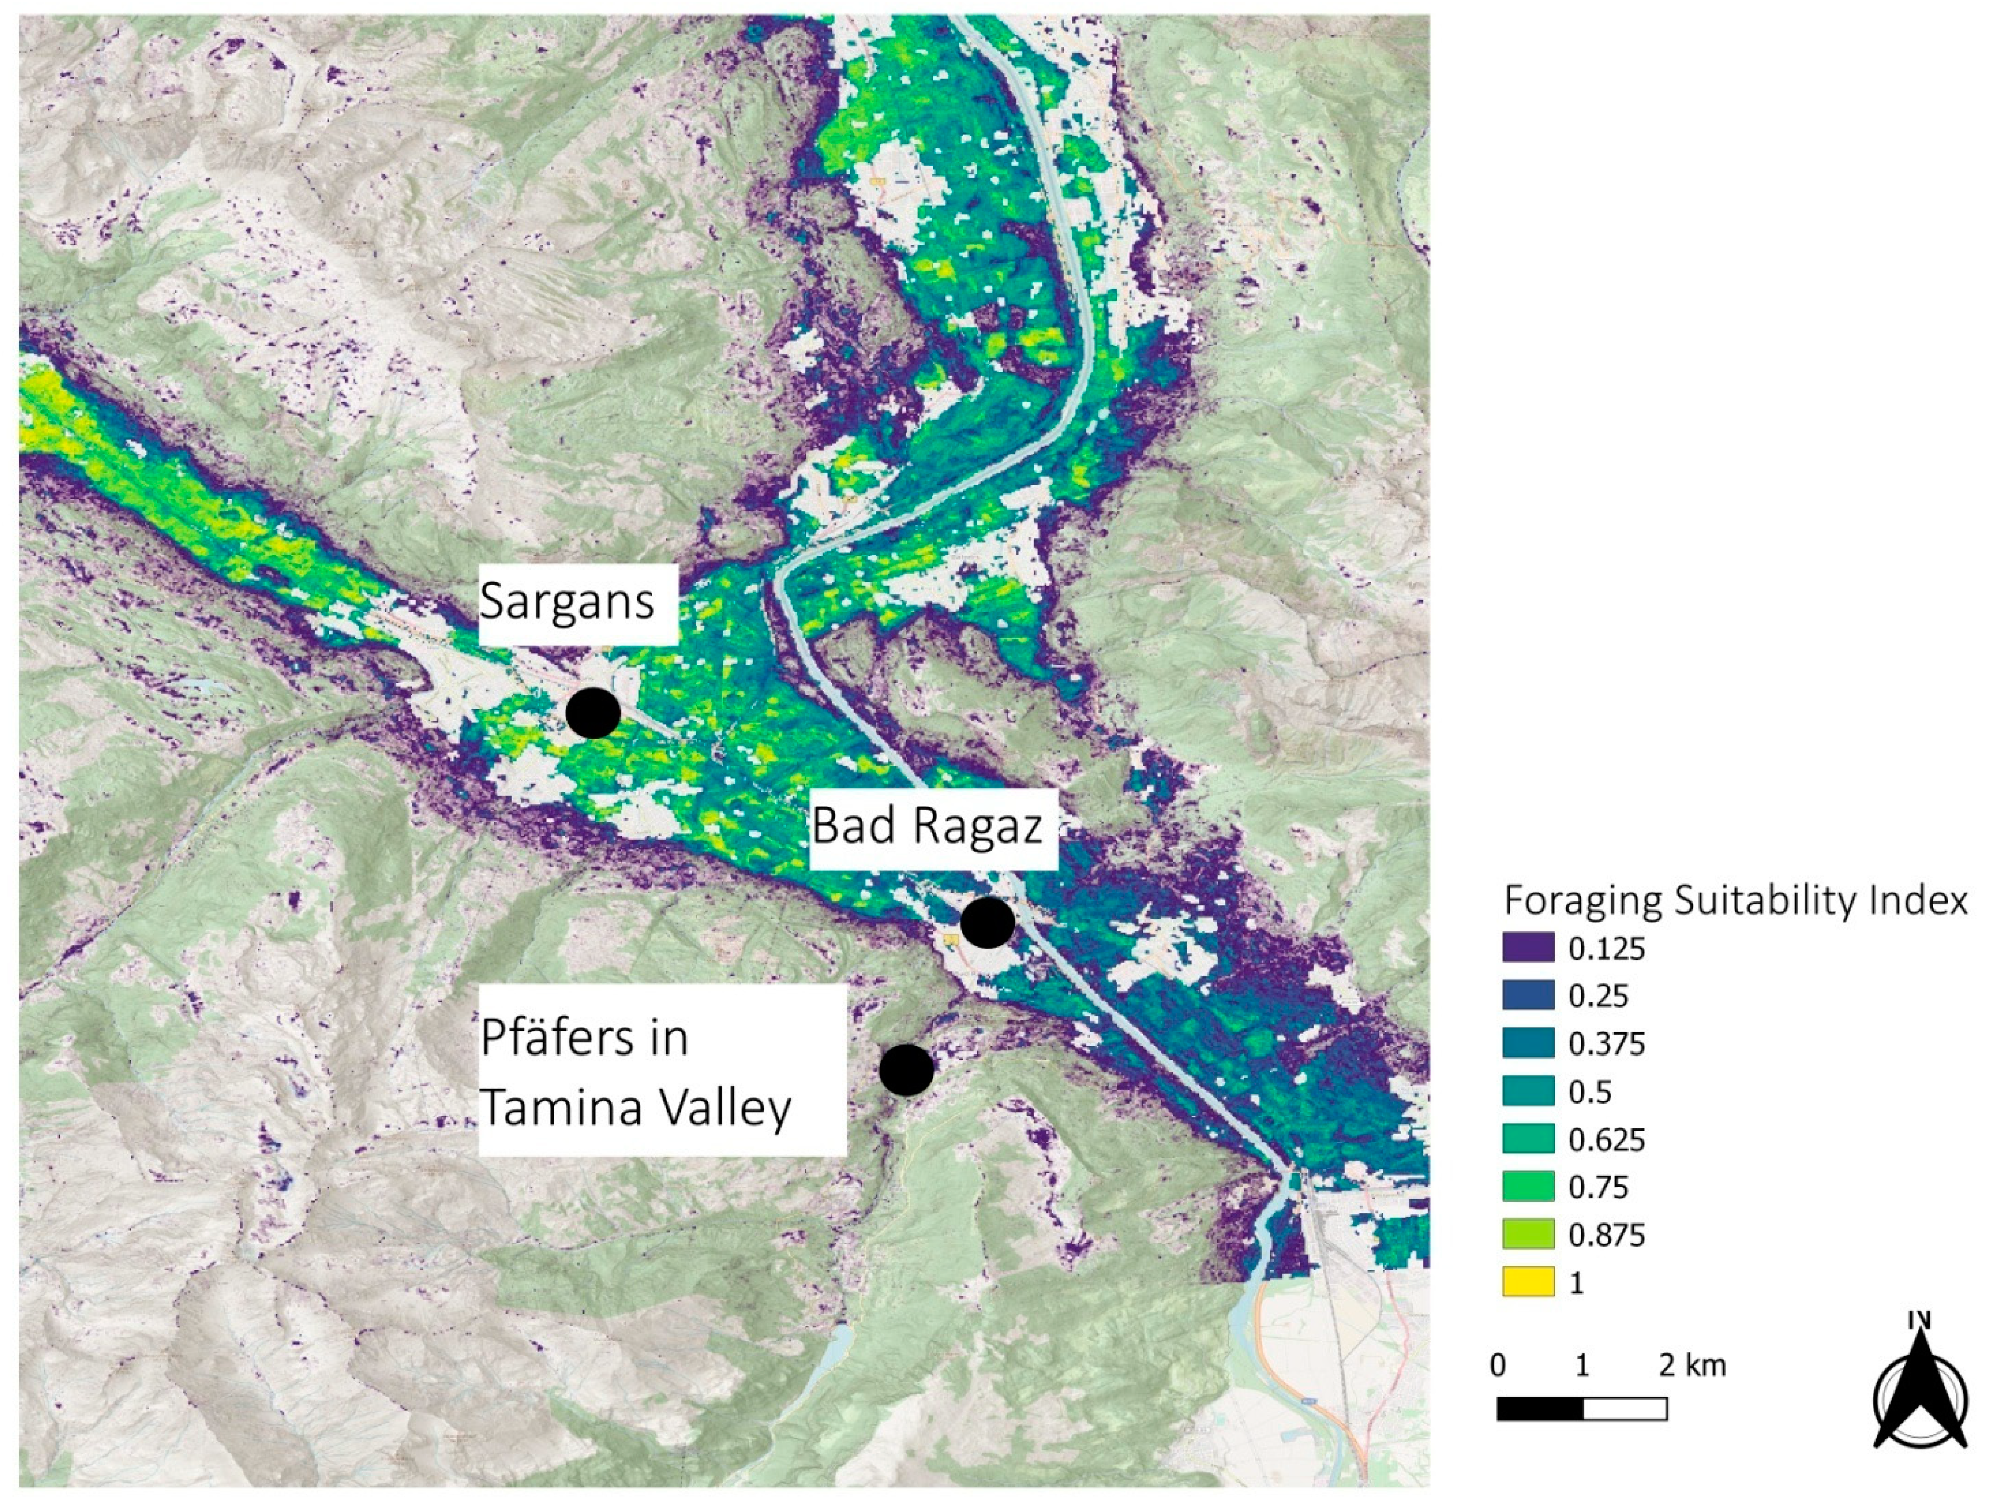
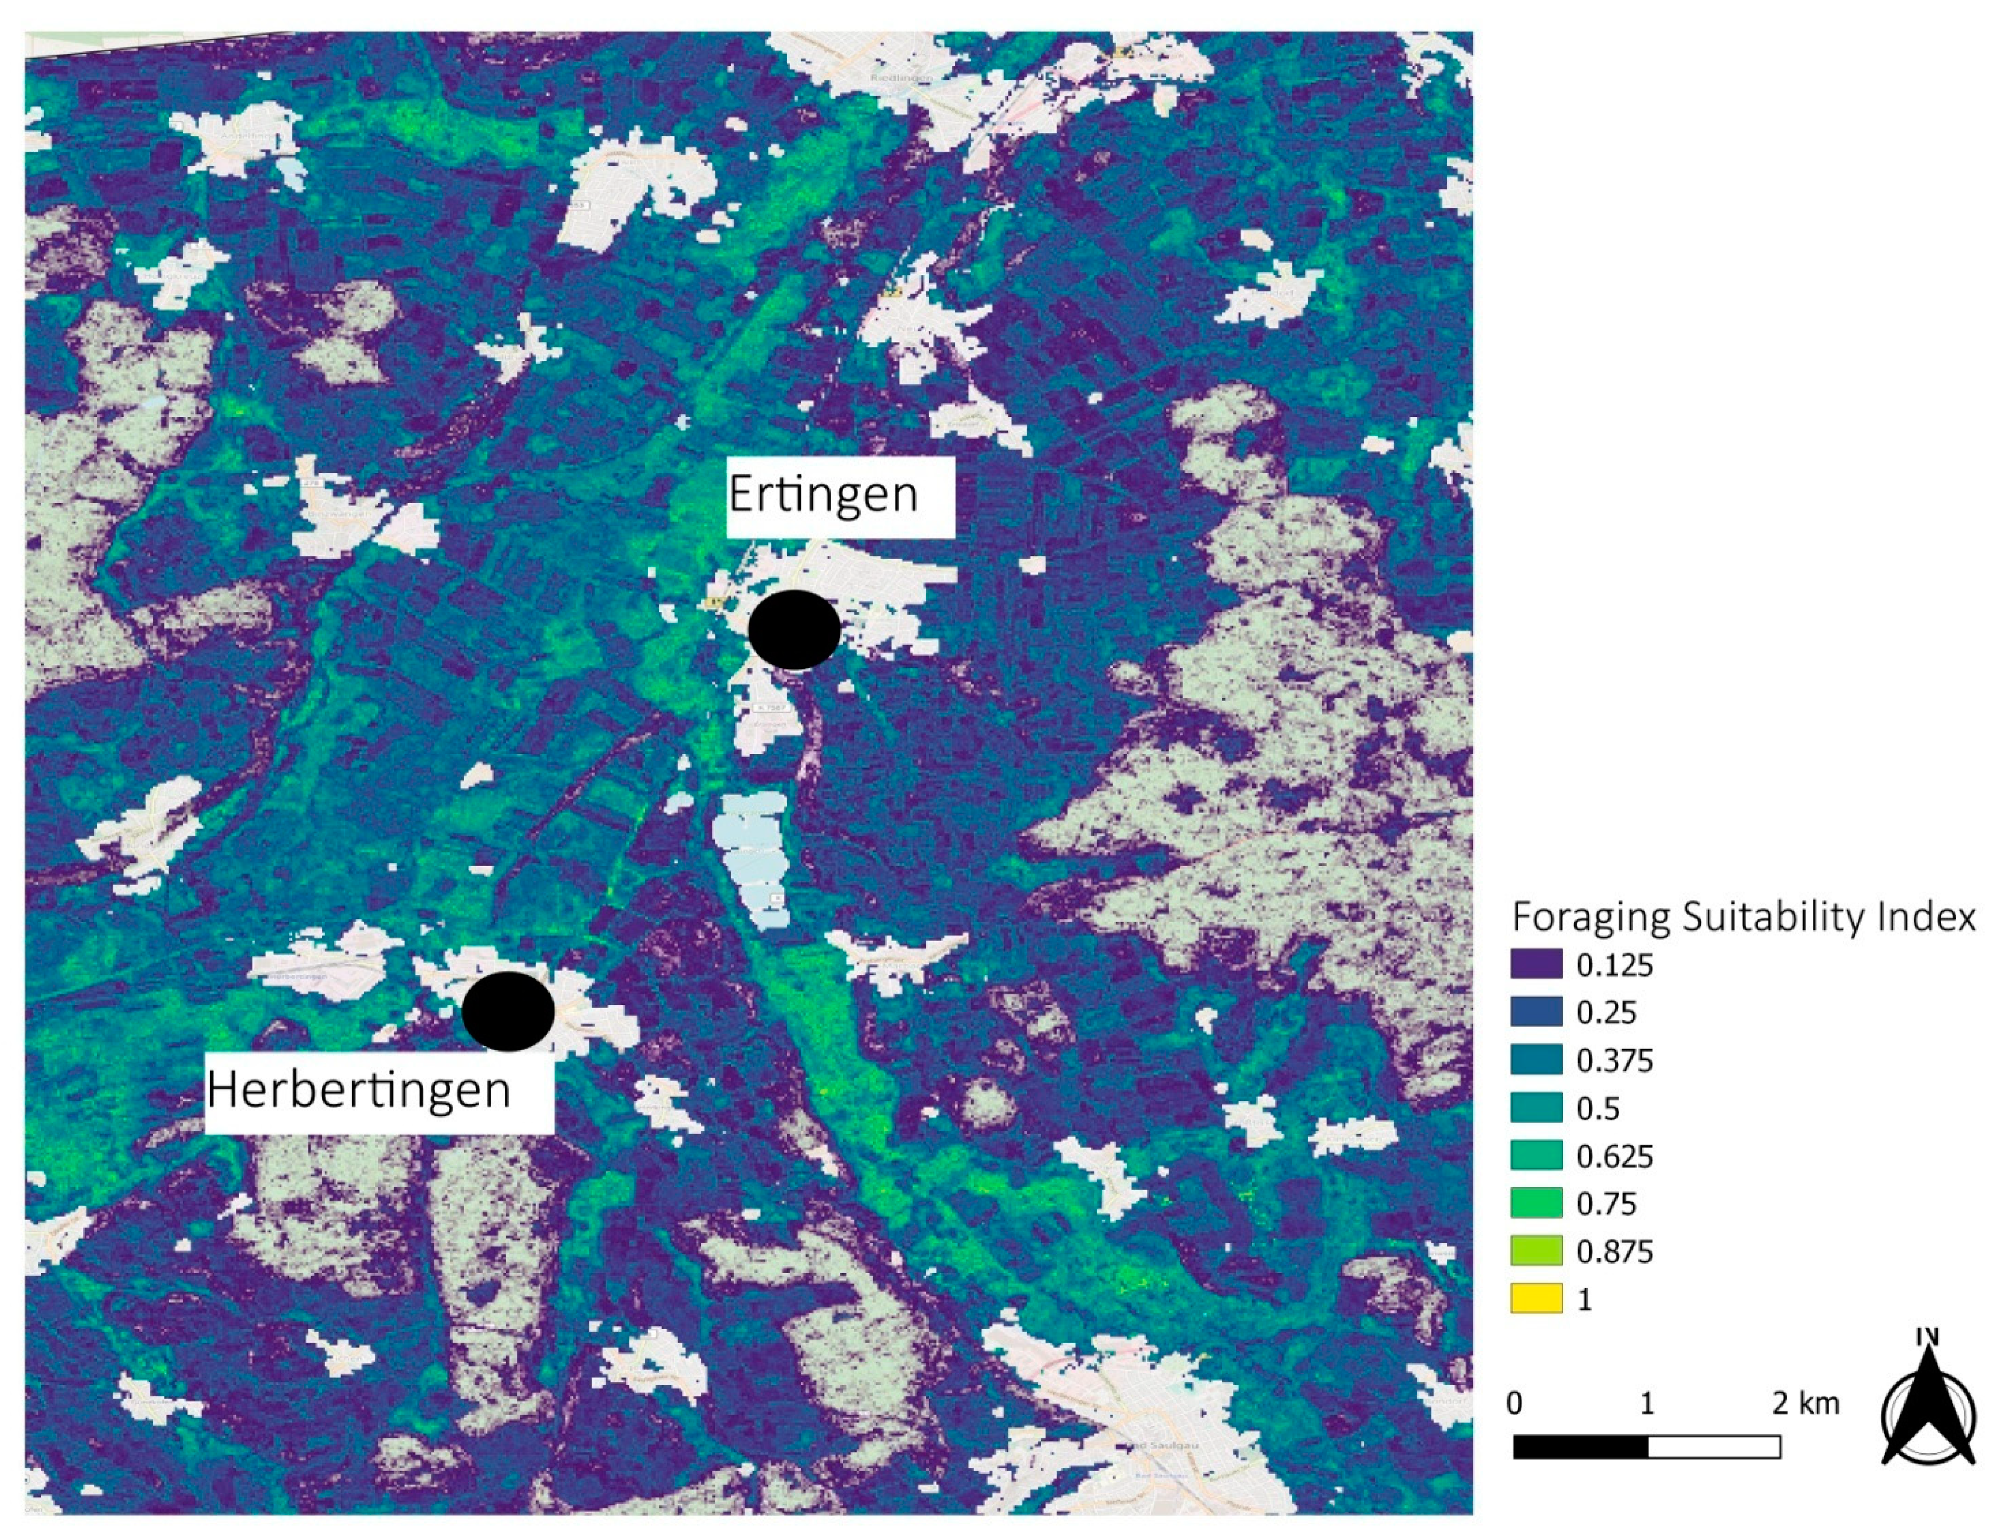
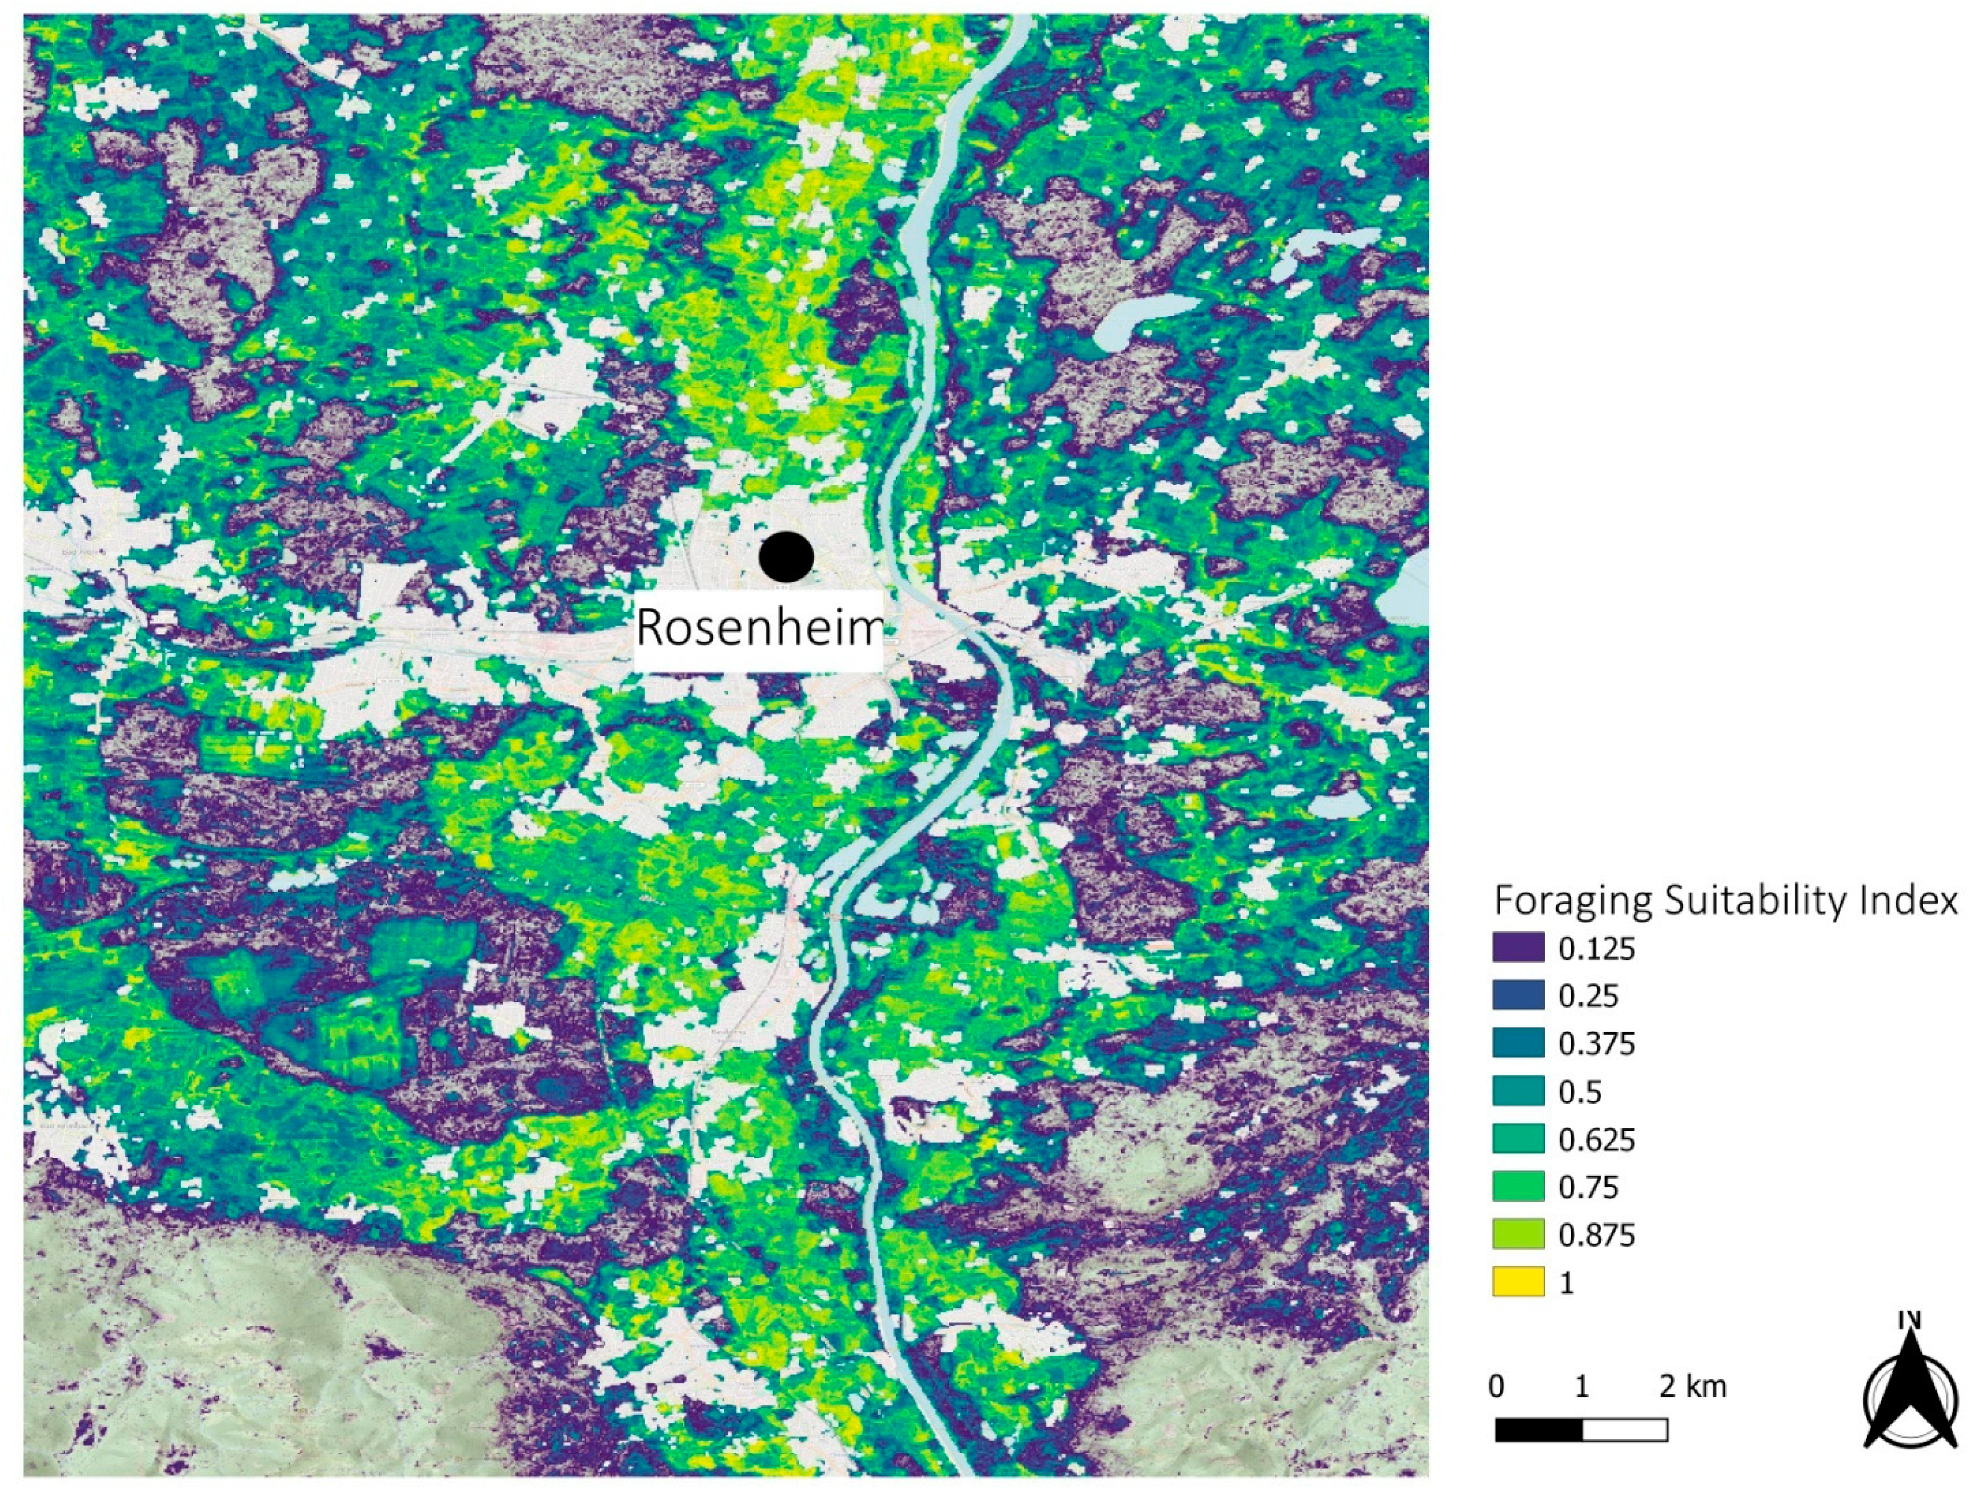
3.2. Regional Examples

Within the Bad Ragaz region (Figure 3), which is a historic breeding site, the suitability index for the broad, agriculturally used valley grounds is high. This indicates abundant and strongly aggregated foraging areas of high suitability, buffered by areas of intermediate suitability. The more elevated Alpine areas featured a foraging suitability index between 0.0 and 0.3. They are, thus, unsuitable for foraging, but they may include potentially suitable nesting sites around the foraging areas.
The rural area north of Lake Constance (Figure 4) is a predominantly agrarian region with a mixture between grassland farming and arable land use. It represents the northern limit of the historic breeding area. Most areas within this region have intermediate foraging suitability. The areas of high suitability are vaguely aggregated, but in contrast to Bad Ragaz, they do not form a single, connected area with high foraging suitability. The forested areas feature low foraging suitability.
The Bavarian city Rosenheim (Figure 5) represents urbanized areas. The impervious surfaces are excluded from the model via the world settlement footprint [42]. Interestingly, the rather small city is surrounded by high foraging suitability values.

4. Discussion

In our study, we applied a random forest model using remote sensing data as a suitable tool for the large-scale assessment of habitats in the context of a species conservation project. This is of significant relevance, not only for the NBI as the bird species concerned, but also from a general conservation perspective. Meta-studies indicate a rather low success of translocation projects, although they are mostly implemented with considerable effort and expense [22,24,50]. However, various authors point out that the use of models, in particular for demography and habitat availability, significantly improve planning and management, and thus the chance of success of translocation projects [22,23]. The use of models is also suggested in the IUCN translocation guidelines [25]. In the context of the NBI reintroduction project, a population viability analysis based on an extensive demographic dataset forms the basis for further translocation measures [20]. The current analysis significantly supports a fact-based definition of locations for the establishment of further breeding colonies.
The increasingly frequent and diverse use of GPS devices for remote monitoring in the frame of conservation and translocation projects [51,52,53,54] is an important basis for modeling the potential species distribution and habitat availability. However, it is increasingly evident that the attachment of devices affects the behavior of the carrier animals and thus the spatiotemporal data obtained [32,53,55,56,57]. This also became evident in the NBI reintroduction project [32] and therefore, special attention was paid to the adequate positioning and attachment of the GPS devices, to minimize the impairment of the birds and the effect on the obtained data.
In the course of the NBI reintroduction project, three breeding colonies have been established in the area of the northern Alpine foothills so far, all in the vicinity of historic breeding sites [11,17]. The species distribution model showed high suitability index values for all these areas, also outside the radius of about six kilometers in which breeders and juveniles mostly reside [12] and from which a large part of the GPS data originates (Figure 1). This indicates the potential for regional expansion of the breeding areas through the establishment of satellite colonies.
On a larger scale, the model showed a high density of grid cells with the highest suitability indices along wide Alpine valleys with agriculturally used valley floors. This particularly affects the Salzach Valley, Inn Valley, and Rhine Valley, where the areas with high suitability index reach far out into the foothills of the Alps and expand in form of deltas along the course of the rivers. In Switzerland, characterized by the Western Alps with their typical geology and topography, the areas with a high suitability index cover large parts of the Alpine foothills, although here, too, they mostly follow the course of the river and often extend far south into the large Alpine valleys. At Lake Constance, the model marked high suitability areas all around the lake.
The known historic breeding sites are located within those areas which, according to the model, are still suitable habitats for the NBI today. This is remarkable, as the model assessed the availability of feeding habitats, without considering the availability of suitable rock formations as breeding opportunities. Seemingly, the availability of suitable foraging areas along rivers and in broad Alpine valleys overlaps geographically with the presence of rock faces with niches, ledges, and caves that allow breeding. A correspondence between historical breeding areas [3,33] and the currently suitable foraging habitats identified by the model is particularly evident along the valleys Salzach and Inn, in the area of Überlingen at Lake Constance, with extensive sandstone cliffs at the lakeshore, and along the Rhine Valley in the region of Bad Ragaz in Switzerland.
Bad Ragaz was one of the three regional examples with higher resolution (Figure 3), representative of large Alpine valleys with wide agriculturally used valley floors. Historical evidence indicates a breeding colony in the side valley Tamina near the village Pfäfers [3]. In general, the model did not identify the Alpine areas as suitable foraging habitats. However, within the usual activity radius of six kilometers around the breeding site, the model indicated plenty of highly suitable foraging areas. Thus, this region is a potentially suitable candidate for establishing a new breeding colony, even more since the course of the Rhine valley lies along the migration corridor of the Überlingen breeding colony.
The second regional example (Figure 4) was an area north of Lake Constance. The model showed intermediate suitability for this agriculturally dominated area which is made up of a mixture of grassland farming and arable land, is increasingly dominated by maize cultivation. Areas with high suitability index were rather scattered and small. This transition zone between intensive arable farming to the north and more extensive grassland farming towards the Alps represent the most northern edge of the Alpine foothills [58,59] and also marks the northern end of the known historic breeding range [3,8,33] and the currently ongoing reintroduction measures. For the established breeding colony in Überlingen at Lake Constance, only 40 km SW of this example area, the model indicated plenty of highly suitable foraging areas.
The third regional example (Figure 5) was located around the city of Rosenheim (about 60,000 inhabitants). It is an example of a highly urbanized landscape. The developed and impervious surfaces were excluded from the model, as they are considered unsuitable foraging habitats. However, the model indicated plenty of suitable foraging areas in the vicinity of the city. This is also the case for other communities and small towns. This is in line with historical reports that the NBI often foraged in the vicinity of settlements and even bred in castles and palaces in more populated areas [3,12]. Furthermore, breeding colonies were successfully established on the outskirts of the two towns Burghausen in Bavaria (about 20,000 inhabitants) and Überlingen on Lake Constance (about 23,000 inhabitants). Thus, attention should be paid to conservation planning to differentiate between highly urbanized and therefore unsuitable areas and smaller communities and towns. These developed areas may even provide suitable secondary nesting sites, as in the case of Burghausen, where the birds breed at a defensive wall of a historic castle.
Sustainability is an important criterion for evaluating suitable areas in the context of reintroduction and translocation projects [25], but the model represented only a contemporary snapshot. However, the extensive overlap between the historical range and the current quality of the areas identified by the model indicates the sustainable suitability of the concerned areas. In addition, the areas of high foraging suitability for the NBI indicated by the model are largely located in regions that are characterized by a high and increasing proportion of ecological grassland farming, which is considered one of the most sustainable and, in relation to climate change, most persistent forms of agricultural management [60,61]. A more concrete inclusion of sustainability could improve the model, particularly in light of ongoing climate change. In an agricultural context, a potential approach is to include the sustainability of land management or the proportion of ecological land management as indices. Another potential approach is to model different climate change scenarios.
The study highlights the possibilities of species distribution and habitat assessment models for conservation and translocation planning. Furthermore, the use of models for planning and monitoring translocation projects is also required in international guidelines, in particular in the IUCN translocation guidelines [25]. However, even with the increasing use of biologging, the application of species distribution modeling in conservation and translocation projects is still in its early stages. In the case of the NBI, the Single Species Action Plan of the African-Eurasian Migratory Water bird Agreement (AEWA) for the NBI [62] does not include the necessity of scientific models, the term modeling does not even appear once in the text.

5. Conclusions

Various environmental indices were calculated from earth observation data and used to fit a random forest model to investigate areas with potentially high foraging suitability for the NBI in the northern Alpine foothills. A combination of optical remote sensing data and actively sensed radar data led to an overall accuracy of 84.5% of the model, which can be labeled as good compared to the state-of-art of spatial prediction modeling [47]. Areas of good foraging quality were mainly found in Alpine valley floors and agricultural areas north of the Alps. Swiss flatlands as well as Inn, Rhine, SalzachValley, and regions surrounding Lake Constance were classified as the most suitable foraging areas.
In summary, the indicated high availability of suitable foraging areas in the northern Alpine foothills is remarkable in the light of agricultural intensification while the NBI was absent in Europe for several centuries. Additional foraging areas besides the ones surrounding already established breeding sites promise excellent possibilities for the NBI to spread in the northern Alpine foothills, especially at historic breeding sites like in Bad Ragaz/Pfäfers.

Supplementary Materials

The following supporting information can be downloaded at: https://www.mdpi.com/article/10.3390/rs14041015/s1, Figure S1: Adult Northern Bald Ibis, Figure S2: Foraging Suitability Map NBI, Figure S3: Model Performance, Figure S4: Variable Importance, Figure S5: ModelAccuracy; Table S1:Correlation Matrix of Variables.

Author Contributions

Conceptualization, H.W., K.H. and J.F.; methodology: H.W.; software: H.W.; validation: H.W.; formal analysis: H.W.; data curation: H.W.; writing—original draft preparation: H.W. and J.F.; writing—review and editing: H.W., K.H. and J.F.; visualization: H.W.; supervision: J.F. All authors have read and agreed to the published version of the manuscript.

Funding

This research received no external funding.

Data Availability Statement

Data used for this article, GPS positions as well remote sensing indices, can be requested by H.W. ([email protected]).

Acknowledgments

The Northern bald ibis reintroduction project was co-financed with a 50% contribution from the LIFE financial instrument of the European Union (LIFE+12-BIO_AT_000143, LIFE Northern Bald Ibis). Further co-financing came from a range of partners and sponsors whom we are very grateful for. A second LIFE project (LIFE20 NAT/AT/000049), directed by Zoo Vienna, starts in 2022. We also thank Martin Wegmann from the Institute of Geography and Geology at the University of Wuerzburg for teaching spatial modeling knowledge in the context of the EAGLE-Applied Earth Observation and Geoanalysis for the living Environment study program.

Conflicts of Interest

The authors declare no conflict of interest. The funders had no role in the design of the study; in the collection, analyses, or interpretation of data; in the writing of the manuscript; or in the decision to publish the results.

References

  1. Böhm, C.; Bowden, C.G.R.; Seddon, P.J.; Hatipoǧlu, T.; Oubrou, W.; El Bekkay, M.; Quevedo, M.A.; Fritz, J.; Yeniyurt, C.; Lopez, J.M.; et al. The northern bald ibis Geronticus eremita: History, current status and future perspectives. Oryx 2020, 55, 934–946. [Google Scholar] [CrossRef]
  2. Lindsell, J.A.; Serra, G.; Peške, L.; Abdullah, M.S.; Al Qaim, G.; Kanani, A.; Wondafrash, M. Satellite tracking reveals the migration route and wintering area of the Middle East population of Critically Endangered northern bald ibis Geronticus eremita. Oryx 2009, 43, 329–335. [Google Scholar] [CrossRef] [Green Version]
  3. Schenker, A. Das ehemalige Verbreitunsgebiet des Waldrapps Geronticus eremita in Europa. Ornithol. Beob. 1977, 74, 13–30. [Google Scholar]
  4. Schenker, A.; Cahenzli, F.; Gutbrod, K.G.; Thevenot, M.; Erhardt, A. The Northern Bald Ibis Geronticus eremita in Morocco since 1900: Analysis of ecological requirements. Bird Conserv. Int. 2019, 30, 117–138. [Google Scholar] [CrossRef]
  5. Schenker, A.N.D.R.E.; Serra, G. Review of historical breeding sites of the Northern Bald Ibis Geronticus eremita in Syria and south-eastern Turkey. Bird Conserv. Int. 2021, 1, 1–10. [Google Scholar] [CrossRef]
  6. Serra, G.; Lindsell, J.A.; Peske, L.; Fritz, J.; Bowden, C.G.R.; Bruschini, C.; Welch, G.; Tavares, J.; Wondafrash, M. Accounting for the low survival of the Critically Endangered northern bald ibis Geronticus eremita on a major migratory flyway. Oryx 2015, 49, 312–320. [Google Scholar] [CrossRef] [Green Version]
  7. Fritz, J.; Janák, J. How human intervention and climate change shaped the fate of the Northern Bald Ibis from ancient Egypt to the presence: An interdisciplinary approach to extinction and recovery of an iconic bird species. bioRxiv, 2020; preprint. [Google Scholar] [CrossRef]
  8. Unsöld, M.; Fritz, J. Der Waldrapp-ein Vogel zwischen Ausrottung und Wiederkehr. Wildbiologie 2011, 2, 1–16. [Google Scholar]
  9. Bowden, C.G.R.; Smith, K.W.; ElBekkay, M.; Oubrou, W.; Aghnaj, A.; Jimenez-Armesto, M. Contribution of research to conservation action for the Northern Bald Ibis Geronticus eremita in Morocco. Bird Conserv. Int. 2008, 18, S74–S90. [Google Scholar] [CrossRef] [Green Version]
  10. Böhm, C.; Fritz, J.; Asmus, J. Koordination Und Kooperation Von Zoo-Und Freilandarbeit Bis Zur Wiederansiedlung: Vier Fallbeispiele. In Wildvogelhaltung; Lantermann, W., Asmus, J., Eds.; Springer Spektrum: Berlin/Heidelberg, Germany. [CrossRef]
  11. Fritz, J. The European LIFE+ northern bald ibis reintroduction project. Oryx 2021, 55, 809–810. [Google Scholar] [CrossRef]
  12. Fritz, J.; Kramer, R.; Hoffmann, W.; Trobe, D.; Unsöld, M. Back into the wild: Establishing a migratory Northern bald ibis Geronticus eremita population in Europe. Int. Zoo Yearb. 2017, 51, 107–123. [Google Scholar] [CrossRef]
  13. Serra, G.; Bruschini, C.; Peske, L.; Kubsa, A.; Wondafrash, M.; Lindsell, J.A. An assessment of ecological conditions and threats at the Ethiopian wintering site of the last known eastern colony of Critically Endangered Northern Bald Ibis Geronticus eremita. Undefined 2013, 23, 399–413. [Google Scholar] [CrossRef] [Green Version]
  14. Zoufal, K.; Fritz, J.; Bichler, M.; Kirbauer, M.; Markut, T.; Meran, I.; Wolf, A.; Kotrschal, K. Feeding Ecology of the Northern Bald Ibis in Different Habitat Types: An Experiment Field Study with Handraised Individuals. J. Ornithol. 2006, 147, 1–279. [Google Scholar]
  15. Serra, G.; Abdallah, M.S.; Quaim, G. Feeding ecology and behaviour of the last known surviving Northern Bald Ibises, Geronticus eremita, at their breeding quarter in Syria. Zool. Middle East 2008, 43, 55–68. [Google Scholar] [CrossRef]
  16. Yeniyurt, C.; Oppel, S.; Isfendiyaroglu, S.; Ozkinaci, G.; Erkol, I.L.; Bowden, C.G.R. Influence of feeding ecology on breeding success of a semi-wild population of the critically endangered northern bald ibis geronticus eremita in southern Turkey. Bird Conserv. Int. 2017, 27, 537–549. [Google Scholar] [CrossRef]
  17. Fritz, J.; Wirtz, S.; Unsöld, M. Aspects of the biology and genetic of the Northern Bald Ibis: Reply to Bauer et al. (2016) Bird Neozoa in Germany–Revision of the national status rating. Vogelwarte 2017, 55, 141–145. [Google Scholar]
  18. Gesner, C. Historiae Animalium liber III, Qui Est De Avium Natura; zurich: Zürich, Switzerland, 1557. [Google Scholar]
  19. Schenker, A. Der Waldrapp-ein histroisches Wildbret. Wildbiologie 1981, 4, 1–12. [Google Scholar]
  20. Drenske, S.; Radchuk, V.; Scherer, C.; Esterer, C.; Kowarik, I.; Fritz, J.; Kramer-Schadt, S. Halfway to self-sustainability: Reintroduced migratory European Northern Bald Ibises (Geronticus eremita) still need management interventions for population viability. bioRxiv 2021. [Google Scholar] [CrossRef]
  21. Osborne, P.E.; Seddon, P.J. Selecting suitable habitats for reintroductions: Variation, change and the role of species distribution modelling. Reintroduct. Biol. Integr. Sci. Manag. 2012, 1, 73–104. [Google Scholar]
  22. Armstrong, D.P.; Seddon, P.J. Directions in reintroduction biology. Trends Ecol. Evol. 2008, 23, 20–25. [Google Scholar] [CrossRef]
  23. Parker, K.A.; Ewen, J.G.; Seddon, P.J.; Armstrong, D.P. Post-release monitoring of bird translocations: Why is it important and how we do it? Notornis 2013, 60, 85–92. [Google Scholar]
  24. Hunter-Ayad, J.; Ohlemüller, R.; Recio, M.R.; Seddon, P.J. Reintroduction modelling: A guide to choosing and combining models for species reintroductions. J. Appl. Ecol. 2020, 57, 1233–1243. [Google Scholar] [CrossRef]
  25. Soorae, P.S. (Ed.) Global Re-introduction Perspectives, 2013: Further Case Studies from Around the Globe; IUCN/SSC Re-Introduction Specialist Group & Environment Agency-Abu Dhabi: Gland, Switzerland, 2013. [Google Scholar]
  26. He, K.S.; Bradley, B.A.; Cord, A.F.; Rocchini, D.; Tuanmu, M.N.; Schmidtlein, S.; Turner, W.; Wegmann, M.; Pettorelli, N. Will remote sensing shape the next generation of species distribution models? Remote Sens. Ecol. Conserv. 2015, 1, 4–18. [Google Scholar] [CrossRef] [Green Version]
  27. Pettorelli, N.; Schulte to Bühne, H.; Tulloch, A.; Dubois, G.; Macinnis-Ng, C.; Queirós, A.M.; Keith, D.A.; Wegmann, M.; Schrodt, F.; Stellmes, M.; et al. Satellite remote sensing of ecosystem functions: Opportunities, challenges and way forward. Remote Sens. Ecol. Conserv. 2018, 4, 71–93. [Google Scholar] [CrossRef]
  28. Pettorelli, N.; Safi, K.; Turner, W. Satellite remote sensing, biodiversity research and conservation of the future. Philos. Trans. R. Soc. B Biol. Sci. 2014, 369, 20130190. [Google Scholar] [CrossRef]
  29. Remelgado, R.; Leutner, B.; Safi, K.; Sonnenschein, R.; Kuebert, C.; Wegmann, M. Linking animal movement and remote sensing–mapping resource suitability from a remote sensing perspective. Remote Sens. Ecol. Conserv. 2018, 4, 211–224. [Google Scholar] [CrossRef] [Green Version]
  30. Rocchini, D.; Boyd, D.S.; Féret, J.B.; Foody, G.M.; He, K.S.; Lausch, A.; Nagendra, H.; Wegmann, M.; Pettorelli, N. Satellite remote sensing to monitor species diversity: Potential and pitfalls. Remote Sens. Ecol. Conserv. 2016, 2, 25–36. [Google Scholar] [CrossRef]
  31. Gorelick, N.; Hancher, M.; Dixon, M.; Ilyushchenko, S.; Thau, D.; Moore, R. Google Earth Engine: Planetary-scale geospatial analysis for everyone. Remote Sens. Environ. 2017, 202, 18–27. [Google Scholar] [CrossRef]
  32. Fritz, J.; Eberhard, B.; Esterer, C.; Goenner, B.; Trobe, D.; Unsoeld, M.; Voelkl, B.; Wehner, H.; Scope, A. Biologging is suspect to cause corneal opacity in two populations of wild living Northern Bald Ibises (Geronticus eremita). Avian Res. 2020, 11, 38. [Google Scholar] [CrossRef]
  33. Schenker, A. Replik zum Beitrag von Armin Landmann betreffend den Waldrapp Geronticus eremita. Vogelwarte 2017, 55, 129–138. [Google Scholar]
  34. QGIS Development Team QGIS Geographic Information System. 2020. Available online: https://qgis.org/de/site/ (accessed on 7 August 2020).
  35. Bauer-Marschallinger, B.; Cao, S.; Navacchi, C.; Freeman, V.; Reuß, F.; Geudtner, D.; Rommen, B.; Vega, F.C.; Snoeij, P.; Attema, E.; et al. The normalised Sentinel-1 Global Backscatter Model, mapping Earth’s land surface with C-band microwaves. Sci. Data 2021, 8, 277. [Google Scholar] [CrossRef] [PubMed]
  36. Bousbih, S.; Zribi, M.; Lili Chabaane, Z.; Baghdadi, N.; El Hajj, M.; Gao, Q.; Mougenot, B.; Lili-Chabaane, Z.; Baghdadi, N. Potential of Sentinel-1 radar datA for the assessment of soil and cereal cover parameters. Sensors 2015, 17, 2617. [Google Scholar] [CrossRef] [Green Version]
  37. Vreugdenhil, M.; Wagner, W.; Bauer-Marschallinger, B.; Pfeil, I.; Teubner, I.; Rüdiger, C.; Strauss, P. Sensitivity of Sentinel-1 backscatter to vegetation dynamics: An Austrian case study. Remote Sens. 2018, 10, 1396. [Google Scholar] [CrossRef] [Green Version]
  38. Buchhorn, M.; Lesiv, M.; Tsendbazar, N.E.; Herold, M.; Bertels, L.; Smets, B. Copernicus global land cover layers-collection 2. Remote Sens. 2020, 12, 1044. [Google Scholar] [CrossRef] [Green Version]
  39. Farr, T.G.; Rosen, P.A.; Caro, E.; Crippen, R.; Duren, R.; Hensley, S.; Kobrick, M.; Paller, M.; Rodriguez, E.; Roth, L.; et al. The Shuttle Radar Topography Mission. Rev. Geophys. 2007, 45, 2004. [Google Scholar] [CrossRef] [Green Version]
  40. Muñoz Sabater, J. ERA5-Land Monthly Averaged Data from 1981 to Present. Copernic. Clim. Chang. Serv. (C3S) Clim. Data Store (CDS) 2019, 146, 1999–2049. [Google Scholar] [CrossRef]
  41. Hansen, M.C.; Potapov, P.V.; Moore, R.; Hancher, M.; Turubanova, S.A.; Tyukavina, A.; Thau, D.; Stehman, S.V.; Goetz, S.J.; Loveland, T.R.; et al. High-resolution global maps of 21st-century forest cover change. Science 2013, 342, 850–853. [Google Scholar] [CrossRef] [PubMed] [Green Version]
  42. Marconcini, M.; Metz-Marconcini, A.; Üreyen, S.; Palacios-Lopez, D.; Hanke, W.; Bachofer, F.; Zeidler, J.; Esch, T.; Gorelick, N.; Kakarla, A.; et al. Outlining where humans live, the World Settlement Footprint 2015. Sci. Data 2020, 7, 242. [Google Scholar] [CrossRef] [PubMed]
  43. R Core Team. R: A Language and Environment for Statistical Computing; R Foundation for Statistical Computing: Vienna, Austria, 2020; Available online: https://www.rstudio.com/products/rstudio/download/ (accessed on 25 July 2020).
  44. Barbet-Massin, M.; Jiguet, F.; Albert, C.H.; Thuiller, W. Selecting pseudo-absences for species distribution models: How, where and how many? Methods Ecol. Evol. 2012, 3, 327–338. [Google Scholar] [CrossRef]
  45. Cerasoli, F.; Iannella, M.; D’Alessandro, P.; Biondi, M. Comparing pseudo-absences generation techniques in Boosted Regression Trees models for conservation purposes: A case study on amphibians in a protected area. PLoS ONE 2017, 12, e0187589. [Google Scholar] [CrossRef] [PubMed] [Green Version]
  46. Hijams, R.J.; Phillips, S.; Elith, J.L. Dismo: Species Distribution Modeling. 2021. Available online: https://cran.r-project.org/web/packages/dismo/dismo.pdf (accessed on 24 October 2021).
  47. Zlonis, E.J.; Deo, R.; Berdeen, J.B. LiDAR and multispectral imagery predict the occurrence of tree cavities suitable for a cavity-nesting duck. Remote Sens. Ecol. Conserv. 2021. [Google Scholar] [CrossRef]
  48. Breiman, L. Random Forests. Mach. Learn. 2001, 45, 5–32. [Google Scholar] [CrossRef] [Green Version]
  49. Thuiller, W.; Georges, D.; Engler, R.; Lafourcade, B. BIOMOD: Tutorial. Available online: http://www.ecochange-project.eu (accessed on 14 November 2021).
  50. Wolf, M.; Griffith, B.; Reed, C.S.A.T. Avian and mamalian translocations: Update and reanalysis of 1987 survey data. Conserv. Biol. 1996, 10, 1142–1154. [Google Scholar] [CrossRef]
  51. Rutz, C.; Hays, G.C. New frontiers in biologging science. Biol. Lett. 2009, 5, 289–292. [Google Scholar] [CrossRef] [Green Version]
  52. Wikelski, M.; Tertitski, G. Living sentinels for climate change effects. Science 2016, 352, 775–776. [Google Scholar] [CrossRef] [Green Version]
  53. Portugal, S.J.; White, C.R. Miniaturization of biologgers is not alleviating the 5% rule. Methods Ecol. Evol. 2018, 9, 1662–1666. [Google Scholar] [CrossRef]
  54. Flack, A.; Nagy, M.; Fiedler, W.; Couzin, I.D.; Wikelski, M. From local collective behavior to global migratory patterns in white storks. Science 2018, 360, 911–914. [Google Scholar] [CrossRef] [Green Version]
  55. Thaxter, C.B.; Ross-Smith, V.H.; Clark, J.A.; Clark, N.A.; Conway, G.J.; Masden, E.A.; Wade, H.M.; Leat, E.H.K.; Gear, S.C.; Marsh, M.; et al. Contrasting effects of GPS device and harness attachment on adult survival of Lesser Black-backed Gulls Larus fuscus and Great Skuas Stercorarius skua. Ibis 2016, 158, 279–290. [Google Scholar] [CrossRef]
  56. Bodey, T.W.; Cleasby, I.R.; Bell, F.; Parr, N.; Schultz, A.; Votier, S.C.; Bearhop, S. A phylogenetically controlled metaanalysis of biologging device effects on birds: Deleterious effects and a call for more standardized reporting of study data. Methods Ecol. Evol. 2018, 9, 946–955. [Google Scholar] [CrossRef] [Green Version]
  57. Geen, G.R.; Robinson, R.A.; Baillie, S.R. Effects of tracking devices on individual birds–A review of the evidence. J. Avian Biol. 2019, 50, 2. [Google Scholar] [CrossRef]
  58. Hötker, H.; Bernady, P.; Cimiotti, D.; Dziewiaty, K.; Joest, R.; Rasran, L. Maisanbau für Biogasanlagen—CO2-Bilanz und Wirkung auf die Vogelwelt. Ber. Zum Vogelschutz 2009, 46, 107–125. [Google Scholar]
  59. Plenk, A. Landwirtschaft, Lebensmittel und Veterinärmedizin—Zukunft der Forschung in Österreich. In Proceedings of the ALVA–Jahrestagung 2011, Graz, Austria, 23–24 May 2011. [Google Scholar]
  60. Muller, A.; Schader, C.; El-Hage Scialabba, N.; Brüggemann, J.; Isensee, A.; Erb, K.H.; Smith, P.; Klocke, P.; Leiber, F.; Stolze, M.; et al. Strategies for feeding the world more sustainably with organic agriculture. Nat. Commun. 2017, 8, 1290. [Google Scholar] [CrossRef] [PubMed] [Green Version]
  61. Meemken, E.M.; Qaim, M. Organic Agriculture, Food Security, and the Environment. Annu. Rev. Resour. Econ. 2018, 10, 39–63. [Google Scholar] [CrossRef] [Green Version]
  62. Bowden, C.G.R. International Single Species Action Plan for the Conservation of the Northern Bald Ibis (Geronticus eremita); The Royal Society for the Protection of Birds (RSPB), United Kingdom BirdLife International: Sandy, UK, 2015; Volume 55. [Google Scholar]
Figure 1. Overview map of the study area; NBI GPS positions, breeding sites north of the Alps, and regions of detailed analyses.
Remotesensing 14 01015 g001
Figure 2. Foraging suitability for the NBI in the study area (northern Alpine foothills). Suitability index is shown in colors ranging from purple (not suitable/0.125) to yellow (high suitable/1.0). Areas of suitability = 0 are masked out due to e.g., urban areas. Regions for detailed analyses are marked in Figure 1.
Remotesensing 14 01015 g002
Figure 3. Foraging suitability for the NBI in an Alpine valley and close to a historic breeding site. Suitability index is displayed in colors ranging from purple (not suitable/0.125) to yellow (high suitable/1.0). Areas of suitability = 0 are masked out due to e.g., urban areas.
Remotesensing 14 01015 g003
Figure 4. Foraging suitability for the NBI in a rural area north of Lake Constance with a mixture of grassland and arable farming. Suitability index is displayed in colors ranging from purple (not suitable/0.125) to yellow (high suitable/1.0). Areas of suitability = 0 are masked out due to e.g., urban areas.
Remotesensing 14 01015 g004
Figure 5. Foraging suitability for the NBI in the small Bavarian city Rosenheim. Suitability index is displayed in colors ranging from purple (not suitable/0.125) to yellow (high suitable/1.0). Areas of suitability = 0 are masked out due to e.g., urban areas. The developed and impervious surfaces are excluded from the model via the World Settlement Footprint.
Remotesensing 14 01015 g005
Table 1. Overview of environmental indices and their remote sensing sources.
IndexFull NameSatellite/Source MissionResolution (Meters)Year of Data Collection
EVIEnhanced vegetation indexLandsat-830 m2021
TC BrightnessTasseled cap brightnessLandsat-830 m2021
TC WetnessTasseled cap wetnessLandsat-830 m2021
NDWINormalized difference water indexLandsat-830 m2021
Grass coverGrass cover fractionCORINE Landcover Inventory100 m2018
ElevationElevationShuttle Radar Topography Mission30 m2000
SlopeSlopeShuttle Radar Topography Mission30 m2000
VV intensityIntensity of vertical send and vertical received radar data Sentinel-110 m2021
Surface TemperatureSurface Temperature[40]1000 m2021
Water Water Mask[41]30 m2015
World Settlement FootprintImpervious/urban areasDLR10 m2015
Publisher’s Note: MDPI stays neutral with regard to jurisdictional claims in published maps and institutional affiliations.

