Technical Note

Characterization of Tropical Cyclone Intensity Using the HY-2B Scatterometer Wind Data

1
School of Marine Sciences, Nanjing University of Information Science and Technology, Nanjing 210044, China
2
Key Laboratory of Space Ocean Remote Sensing and Application, Ministry of Natural Resources, Beijing 100081, China
3
Barcelona Expert Centre (BEC), Institute of Marine Sciences (ICM-CSIC), 08003 Barcelona, Spain
*
Author to whom correspondence should be addressed.
Remote Sens. 2022, 14(4), 1035; https://doi.org/10.3390/rs14041035
Submission received: 21 December 2021 / Revised: 30 January 2022 / Accepted: 18 February 2022 / Published: 21 February 2022
(This article belongs to the Special Issue Remote Sensing of Ocean Surface Winds)

Abstract

:
The estimation of tropical cyclone (TC) intensity using Ku-band scatterometer data is challenging due to rain perturbation and signal saturation in the radar backscatter measurements. In this paper, an alternative approach to directly taking the maximum scatterometer-derived wind speed is proposed to assess the TC intensity. First, the TC center location is identified based on the unique characteristics of wind stress divergence/curl near the TC core. Then the radial extent of 17-m/s winds (i.e., R17) is calculated using the wind field data from the Haiyang-2B (HY-2B) scatterometer (HSCAT). The feasibility of HSCAT wind radii in determining TC intensity is evaluated using the maximum sustained wind speed (MSW) in the China Meteorological Administration best-track database. It shows that the HSCAT R17 value generally better correlates with the best-track MSW than the HSCAT maximum wind speed, therefore indicating the potential of using the HSCAT data to improve the TC nowcasting capabilities.

1. Introduction

Tropical cyclones (TCs) may cause severe damages, notably in coastal areas, through strong winds, heavy rain, and potential storm surges. The TC influence mainly depends on its location and intensity, as well as on the vulnerability of the affected areas. Hence the primary concern in operational TC monitoring and forecasting is to obtain an accurate TC location and intensity information. A variety of observational systems and techniques, including in-situ buoys [1], airborne radiometers [2], and satellite remote sensors [3,4,5,6], have been developed to monitor tropical cyclones, among which the Global Navigation Satellite System Reflectometry (GNSS-R) techniques, as well as spaceborne radiometers and scatterometers are particularly useful. For instance, the L-band GNSS-R instruments onboard low-orbit satellites, such as the Cyclone Global Navigation Satellite System (CYGNSS), are able to measure sea surface wind speed under all precipitating conditions [3]. With a constellation of eight micro-satellites, CYGNSS provides relatively large spatial coverage and high temporal resolution. However, due to the low sensitivity of the reflected GNSS signal to high winds, the high winds from GNSS-R measurements are usually of large retrieval errors [7]. The low frequency radiometers, especially the L-band instruments onboard the Soil Moisture and Ocean Salinity (SMOS) and the Soil Moisture Active Passive (SMAP) missions, are sensitive to high and extreme sea surface wind speeds, while little sensitive to rain. This gives SMOS and SMAP distinct advantages over satellite scatterometers carrying co-polarized beams, in terms of retrieving extreme TC winds (>35 m/s). Moreover, recent works show that the C- and X-band radiometer channels, although more sensitive to rain than L-band radiometers, are also useful in determining the maximum TC wind speed with relatively low bias and root-mean-square errors [8,9]. Nonetheless, the shortcoming of radiometers in TC monitoring is that they have relatively poor spatial resolution to resolve the steep gradient structure in the vicinity of hurricane eyewalls, notably for those high category storms with relatively small eyewall radii [5].
Satellite scatterometers generally provide high-quality vector winds over the global ocean surface, such that they have been widely used in the study of TC structure and location [10,11,12,13]. Notably the Ku-band pencil-beam scatterometers, such as SeaWinds onboard QuikSCAT [14], OSCAT onboard the Indian Oceansat-2 [15] and SCATSat-1 satellites [16], and HSCAT on the Chinese HY-2 satellite series [17], are with wide observation swaths of ~1800 km, making them more likely to acquire the entire TC structure in a single overpass than the C-band fixed fan-beam scatterometers, e.g., Advanced Scatterometers (ASCAT) onboard the MetOp satellite series [18]. However, due to signal saturation in the (co-polarized) radar backscatter measurements, both C- and Ku-band scatterometer extreme wind speeds show large errors. Moreover, the rain contamination on the Ku-band backscatter leads to an underestimation of the TC intensity estimates [7,19]. As such, it is difficult to characterize the TC intensity directly using the maximum wind speed from scatterometer-derived wind fields. Particularly, it is difficult to distinguish true high winds from the rain-contaminated Ku-band retrievals [20], making the estimation of TC intensity with the Ku-band scatterometer wind speed unreliable. In addition, scatterometers are generally calibrated against in situ buoy measurements [7], leading to a large underestimation of high and extreme winds when using dropsonde wind data as a reference (i.e., the gold standard for the extreme winds community). A recent study by Polverari et al. [6] shows, though, that the ASCAT high and extreme winds can be made consistent with the extreme winds from the airborne Stepped-Frequency Microwave Radiometer (SFMR), which is calibrated with dropsonde data, by applying an appropriate high-wind rescaling, which may be useful in estimating the TC intensity following the tropical cyclone community standards.
Regarding the rapid increase of satellite scatterometer missions in China [21,22], it becomes more realistic to monitor the TC evolution (notably the TC center locations) based on the joint wind observations from the virtual scatterometer constellation. In particular, the recent HY-2C and -2D satellites are operated in inclined orbits [22], which can provide nearly six-hourly regional wind observations together with the sun-synchronous HY-2B satellite. Since all the HSCATs are operated in a Ku-band microwave frequency with conically scanning pencil beams, this paper intends to estimate the TC intensity using an alternative parameter to the maximum HSCAT-derived wind speed. Chan and Chan [23] constructed a comprehensive statistical climatology of the TC size (e.g., the azimuthally averaged radius of 17-m/s winds, R17) and strength (i.e., the average wind speed in the cyclonic circulation), and found that the correlation between TC size and strength is strong. Guo and Tan [24] proposed a new concept, namely TC fullness, to quantitatively measure the storm wind structure and to evaluate the TC intensity. Though both studies indicated that the direct correlation between R17 and the maximum sustained wind speed (MSW) of the best-track data is relatively low (~0.3), the wind radii information (R17) can be used to derive new parameters (e.g., TC fullness) that are more correlated with MSW, hence R17 is essential in the estimation of TC intensity. As such, this paper aims at improving estimates of the TC center location and R17 using scatterometer data, using best-track information on storm intensity and evolution as the reference.
Section 2 describes the datasets used in this study. Section 3 presents the methods of data preparation and derivation of essential parameters, e.g., the TC center location and the TC wind radii (R17). The relation between wind radii and TC intensity is examined in Section 4. Finally, the main conclusions are summarized and discussed in Section 5.

2. Data

The HSCATs level 2B (L2B) data from the National Satellite Ocean Application Service (NSOAS) are used in this study. These data are produced by NSOAS with the adapted pencil-beam scatterometer wind processor (PenWP) developed by the Royal Netherlands Meteorological Institute (KNMI) scatterometer team for the EUMETSAT Numerical Weather Prediction Satellite Application Facility (NWP-SAF), and disseminated through the NSOAS website https://osdds.nsoas.org.cn (last accessed on 30 January 2022). The wind quality of the different HSCATs has been assessed by Wang et al. [22,25], and found to be within the mission requirements. Moreover, the wind retrievals are found to be consistent among the different HSCATs. This paper mainly uses the HSCAT (HY-2B) observations of western Pacific TCs in 2019. Since the main objective of this study is to explore the feasibility of wind radii in estimating TC intensity, rather than to develop an automated TC identification algorithm, we only use the HSCAT observations that capture the entire TC structure. As such, nine TCs with 32 HSCAT acquisitions are collected, as shown in Figure 1.
Both the L2B wind products of HSCAT and ASCAT have already included the European Center for Medium Range Weather Forecasts (ECMWF) background winds, which are acquired by interpolating three ECMWF 3 hourly forecast winds, both spatially and temporally, to the scatterometer data acquisition. In order to verify the general applicability of the developed methods, the collocated European Center for Medium Range Weather Forecasts (ECMWF) winds, as well as the ASCAT and the HSCAT-C data, are used to assess the validity of TC center identification and wind radii estimation algorithms. The above HY-2 data are in 25-km grid resolution and the ASCAT data are in 12.5-km grid resolution. The collocated ECMWF winds are already provided in the scatterometer L2B data. With the ASCAT swath being 40% smaller than that of HSCAT, only three TCs (Lingling, Faxai, Bualoi) with 9 ASCAT entire acquisitions were collected in 2019, as shown in Figure 1 too.
The 6-hourly best-track data, including TC center position, MSW and minimum sea level pressure (MSLP) of TCs with at least tropical storm intensity (MSW > 25 m/s), are extracted and evaluated from the China Meteorological Administration (CMA) TC database [26,27]. Both MSW and MSLP are common indicators of the TC intensity, e.g., TC intensification refers to an increase in MSW or a decrease in MSLP [28]. Note that the used MSW represents the maximum two-minute sustained wind speed at 10-m sea surface height. Moreover, both MSW and MSLP are interpolated spatially and temporally to the scatterometer acquisitions for comparison purposes.

3. Method

3.1. TC Center Location

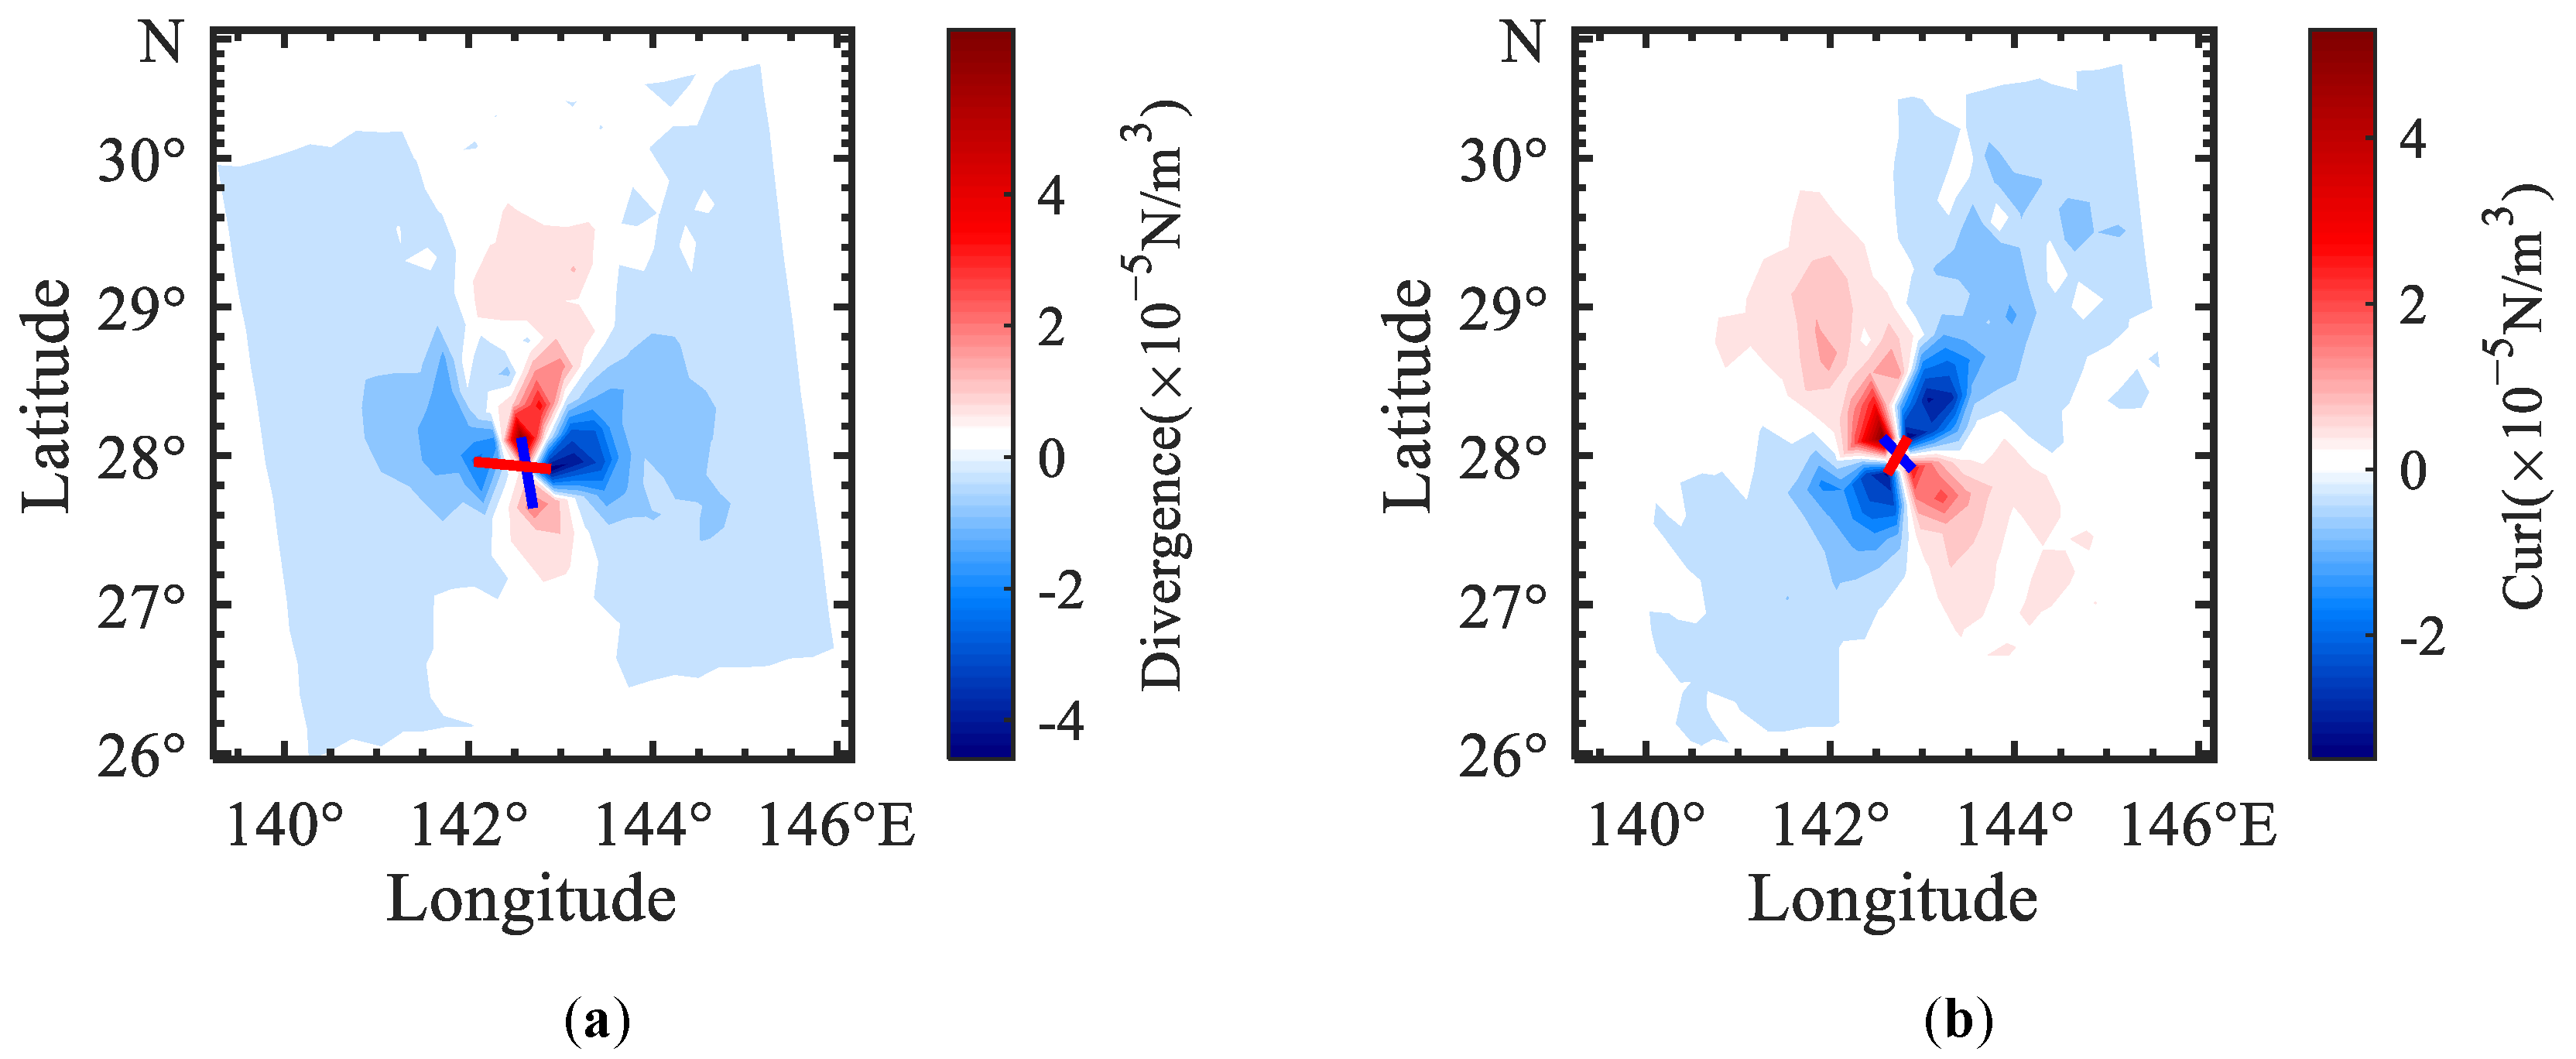
Liu et al. [29] noted that the divergence and/or the curl of scatterometer wind stress near the TC core show distinct signatures which are useful for identifying TC center location. That is, two (positive) local maxima and two (negative) local minima appear symmetrically near the TC core, as shown in Figure 2. Consequently, one can take the intersection of the two lines constructed separately by the local maxima (blue line) and the local minima (red line) as the TC center. In practice, the TC center locations derived from both divergence and curl are of similar accuracy compared to the collocated best-track data [29]. As such, the wind stress curl of HSCAT wind data is hereafter used to identify the TC center location.
Although the conditions for the presence of such distinct signatures in Figure 2 have not been examined thoroughly, we found that these signatures are rather prominent after checking the divergence and curl patterns for dozens of TC acquisitions. Consequently, the above technique is applied to the 32 HSCAT and 9 ASCAT acquisitions of TCs in Figure 1, as well as the collocated ECMWF forecast winds. The mean and standard deviation (SD) values of the difference between the identified HSCAT TC center and the interpolated best-track positions are about 28.8 km (approximately one pixel of the HSCAT grid data) and 16.1 km, respectively, which are generally smaller than those described by Hu et al. [13]. The latter shows a mean difference between the HSCAT TC center and the best-track position larger than three HSCAT 25-km pixels (~75 km). On the other hand, the mean and SD values of the difference between the best-track position and the TC center depicted by ECMWF winds are about 34.9 km and 19.2 km, respectively, demonstrating that HSCAT winds result in closer TC center location to the best-track than ECMWF forecast winds. For the 9 ASCAT acquisitions, the mean difference between the best-track position and the ASCAT-derived (ECMWF-derived) TC center is about 24.9 km (37.9 km), which is consistent with the above results.

3.2. TC Wind Radii

Taking the identified HSCAT TC center as the origin of Polar coordinates, one may estimate the TC wind radius as follows [29]. The wind speed profiles along a set of equally spaced azimuth angles (e.g., Δϕ = 15°, 24 intervals in total) are calculated using spatial bilinear interpolation. Practically, the radial profile is calculated at a set of discrete grid points (Δd ≈ 5 km) starting from TC center. At the ith azimuth angle, the radial extent of 17-m/s wind is recorded as di. As such, the azimuthally averaged radius (R17) is given by,
R 17 = 1 24 i = 1 24 d i
The azimuthal average removes most of the asymmetry associated with TC motion [30], and makes the analysis in Section 4 rather straightforward. However, due to rain contamination and radar measurement noise, the wind speed profile may have spurious oscillations, leading to multiple peaks, and, therefore, multiple 17-m/s intersections. For example, in Figure 3a,b, one may get an inaccurate result if the 17 m/s intersection closest to the TC center (the origin of the used coordinate) is used to estimate R17. In this case, the 17-m/s intersection whose distance (the blue marker in Figure 3b) to the TC center is closer to the 17-m/s radial extent at neighboring azimuth angles is selected, as shown in Figure 3c. Although such adjustment only happens about 2.7% of the times within the 32 × 24 HSCAT wind profiles, it proves to be generally efficient.
Note that the rainfall associated with TCs has remarkable impact on the Ku-band pencil beam scatterometer winds, generally resulting in overestimated low winds and underestimated high winds when heavy rain is present [19]. The operational quality control (flag) of PenWP shows difficulty in discriminating true high winds (w > 17 m/s) from the rain contaminated retrievals using [20], and generally removes too many high winds around the TC core. Consequently, the QC flag is ignored in the calculation of wind radii.

4. Results

The best-track MSW is used to represent TC intensity in this section. As such, the goal of this study is to find the scatterometer-derived parameter that is the highest correlated with MSW in order to characterize the TC intensity. Both the maximum wind speed and the wind radii of HSCAT wind retrievals are examined.

4.1. HSCAT Maximum Wind Speed versus Best-Track MSW

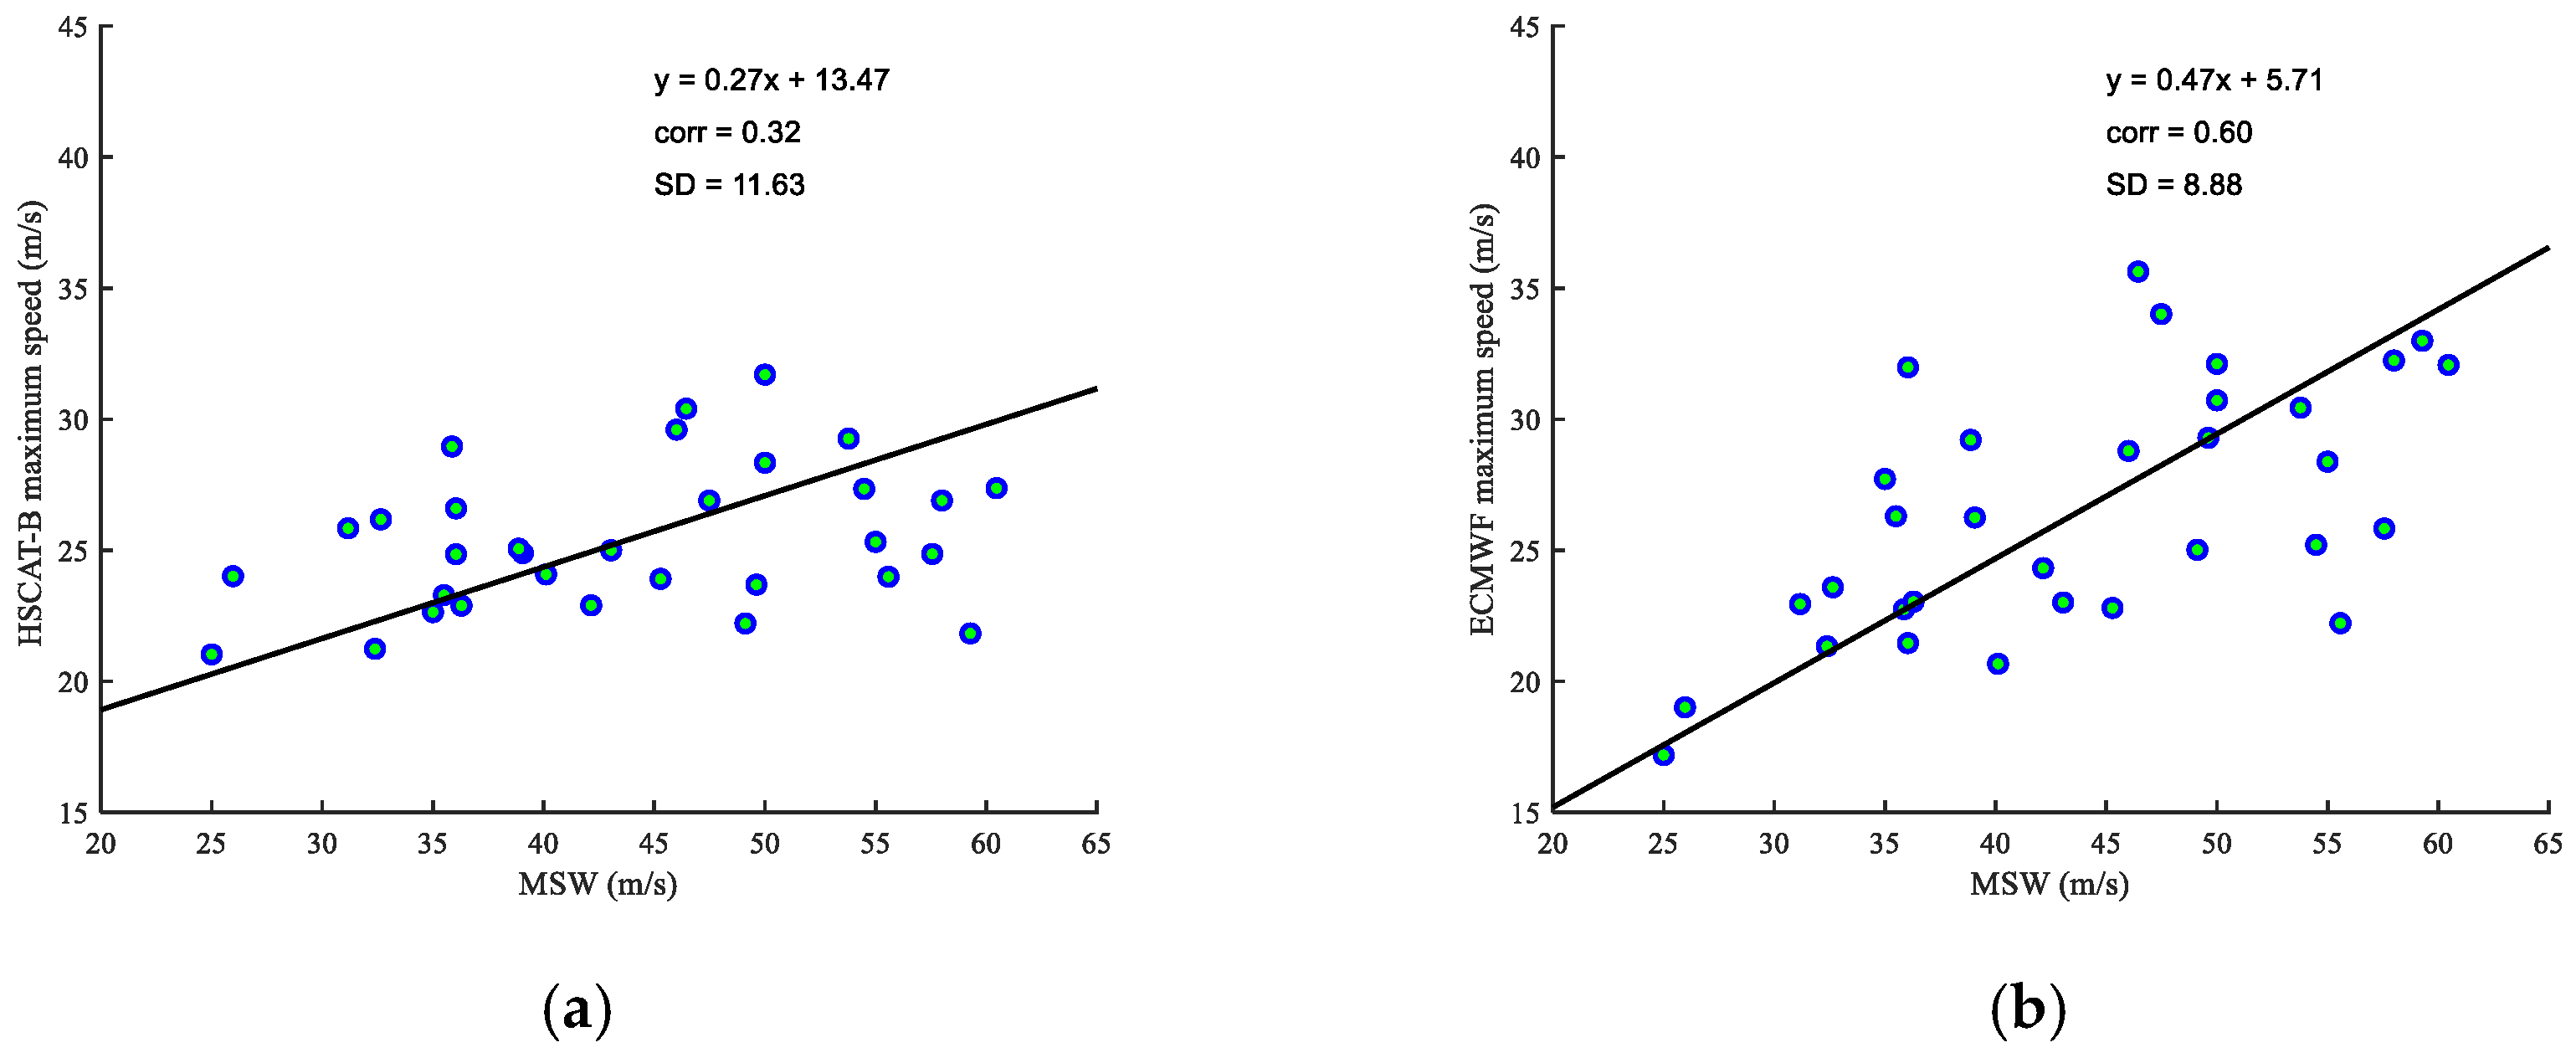
Figure 4 shows the best-track MSW versus the maximum wind speed of HSCAT retrievals (a) and ECMWF forecasts (b). Since the best track, scatterometer and ECMWF winds are with different spatial scales, they show a different high wind scaling, similar to the results in [6]. Note that the objective of this paper is to seek for a parameter well representing TC intensity, rather than to quantify the high wind scaling factor. Consequently, a linear regression model (i.e., y = b + ax) is simply used to assess the correspondence between the MSW and HSCAT/ECMWF maximum wind speed. The bias factor b and the scaling coefficient a are estimated using the linear least square method. Moreover, the Pearson’s correlation coefficients between the MSW and HSCAT/ECMWF maximum wind speed are calculated and shown in the lower-right corner of each panel. With the linear regression model, the SD error of TC intensity predicted by the HSCAT and ECMWF maximum wind speed are also calculated, respectively. As expected, the relationship between the HSCAT maximum wind speed and best-track MSW is weak: the Pearson’s correlation is 0.32 and the SD error is 11.6 m/s, so it may be useless in quantifying the TC intensity. In contrast, the maximum wind speed forecasted by ECMWF shows a remarkable correlation with the best-track MSW (r = 0.6), and the SD error (SD = 8.88 m/s) is better than HSCAT.

4.2. HSCAT Wind Radii versus Best-Track MSW

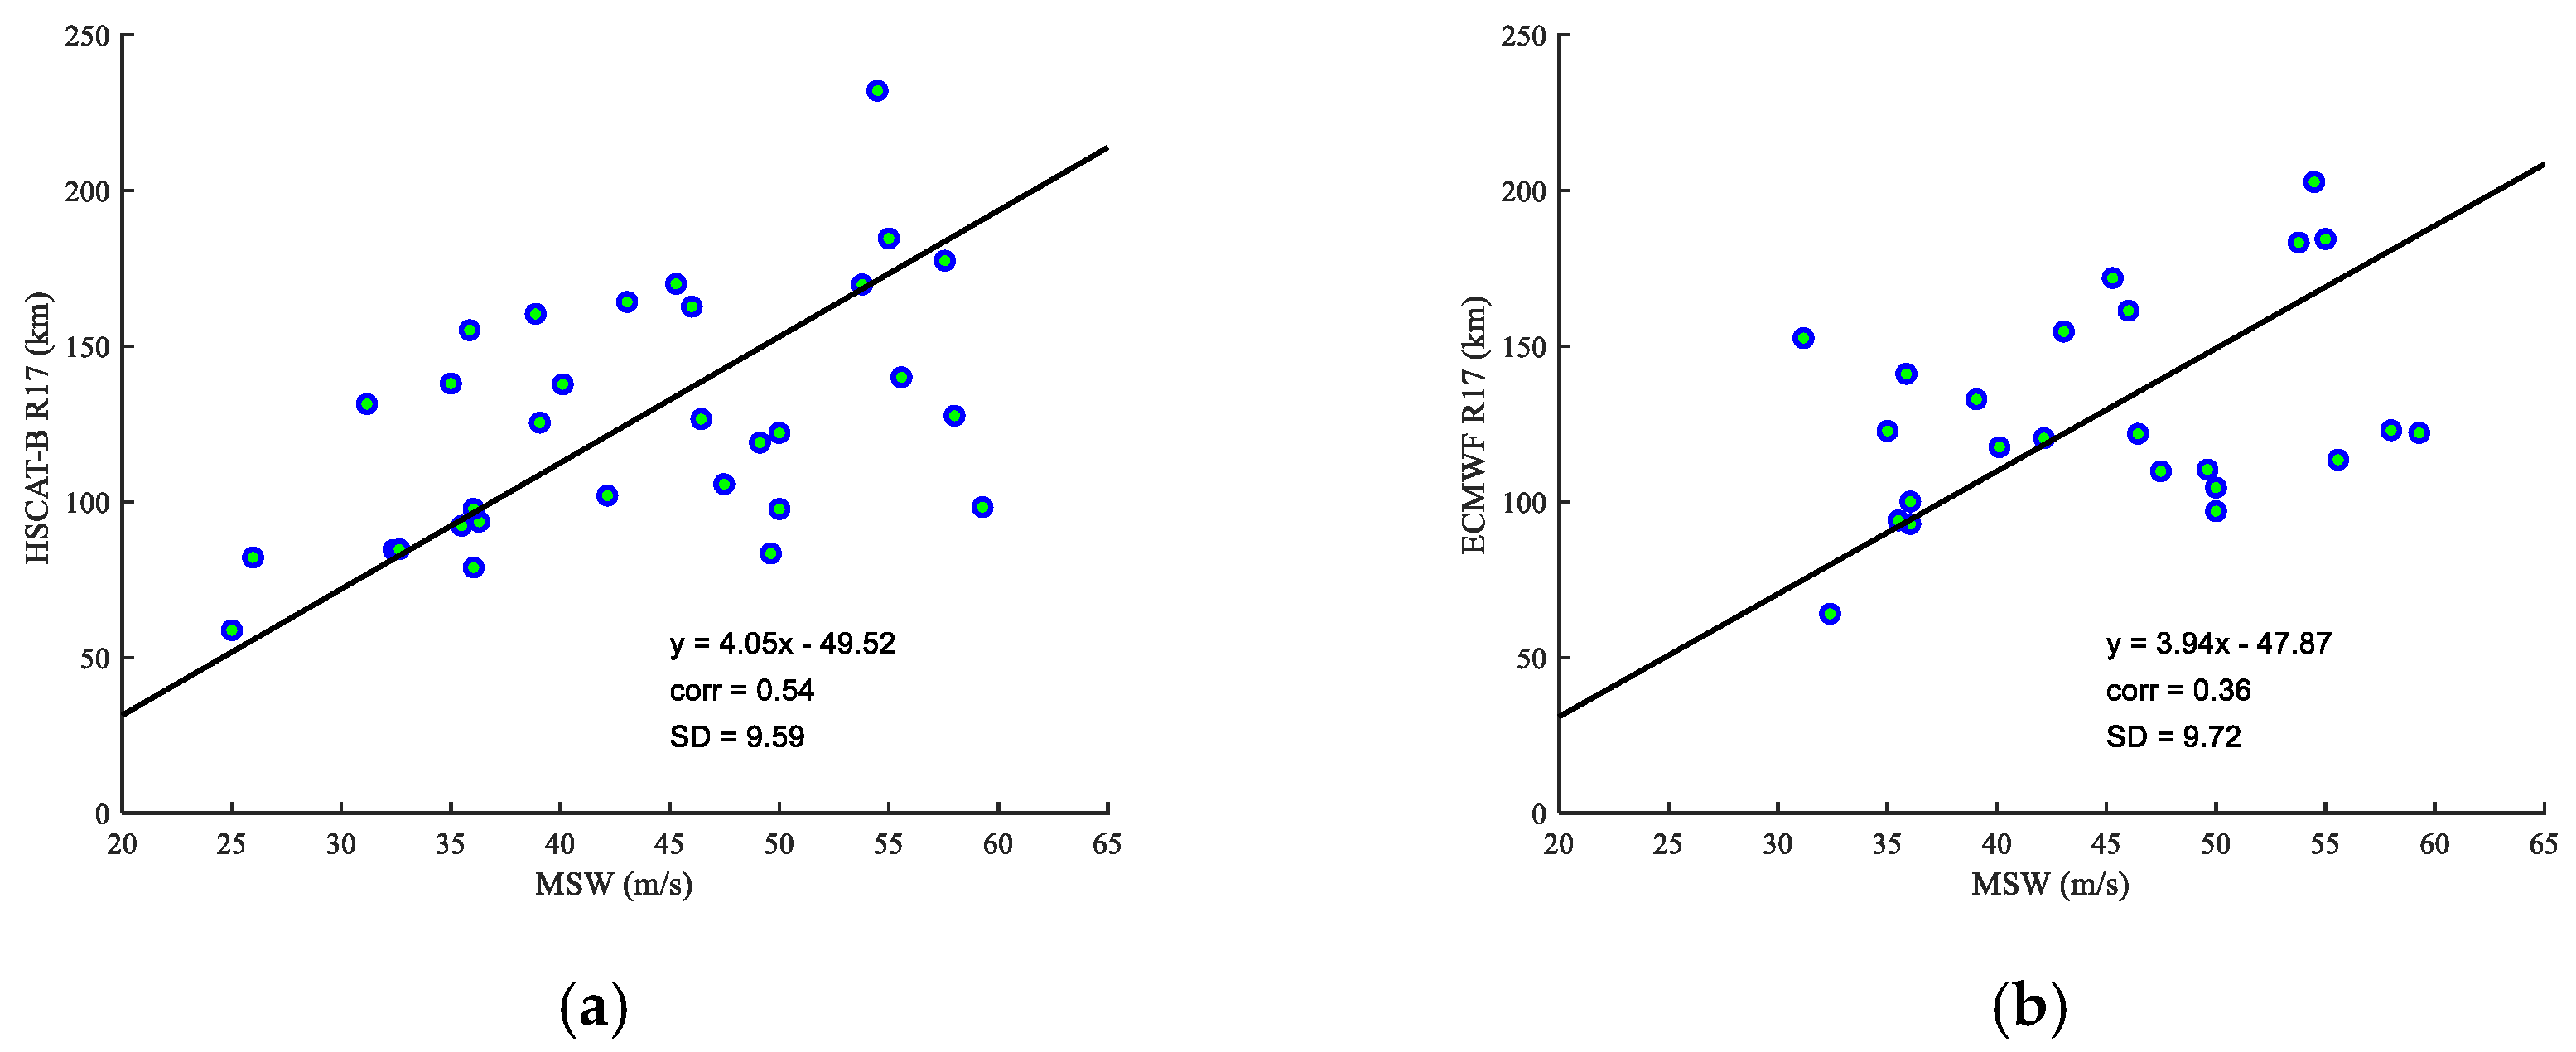
Similar to Figure 4, the correlation between the best-track MSW and the estimated HSCAT/ECMWF wind radii is shown in Figure 5. Compared to the maximum wind speed, the HSCAT wind radii show a significantly better correlation with best-track MSW (r = 0.54), of which the value is also larger than that found by Chan and Chan [23], Guo, and Tan [24]. The main reason could be that the area, as well as the temporal duration, of this study is much smaller than that of the above mentioned literatures. Despite that the number of different cases was evaluated in those papers, the proposed algorithm of wind radii estimation is more efficient in identifying TC intensity than the maximum wind speed of HSCAT retrievals. However, the R17 value estimated from the ECMWF wind field is less effective than the ECMWF maximum wind speed in terms of representing TC intensity. Probably, that is because ECMWF has a much coarser spatial resolution than scatterometers, and in turn, it cannot resolve well the short-scale wind variance and the true TC wind structure, notably under TC conditions [6]. Nevertheless, with the linear regression model in Figure 5, the SD error of TC intensity predicted by the HSCAT and ECMWF wind radii is about 9.59 m/s and 9.72 m/s, respectively.
Actually, previous studies [28,31] already noted that the TC size varies with season and geographic location, so a large R17 value does not always imply an intense TC, or vice versa. Consequently, it is not realistic to develop a universal TC intensity prediction model only based on the wind-radii information. On the other hand, one may be interested in the relative changes of R17 with respect to MSW for a TC event or set of events within a short period and small region, e.g., for a few satellite overpasses of a particular TC event.
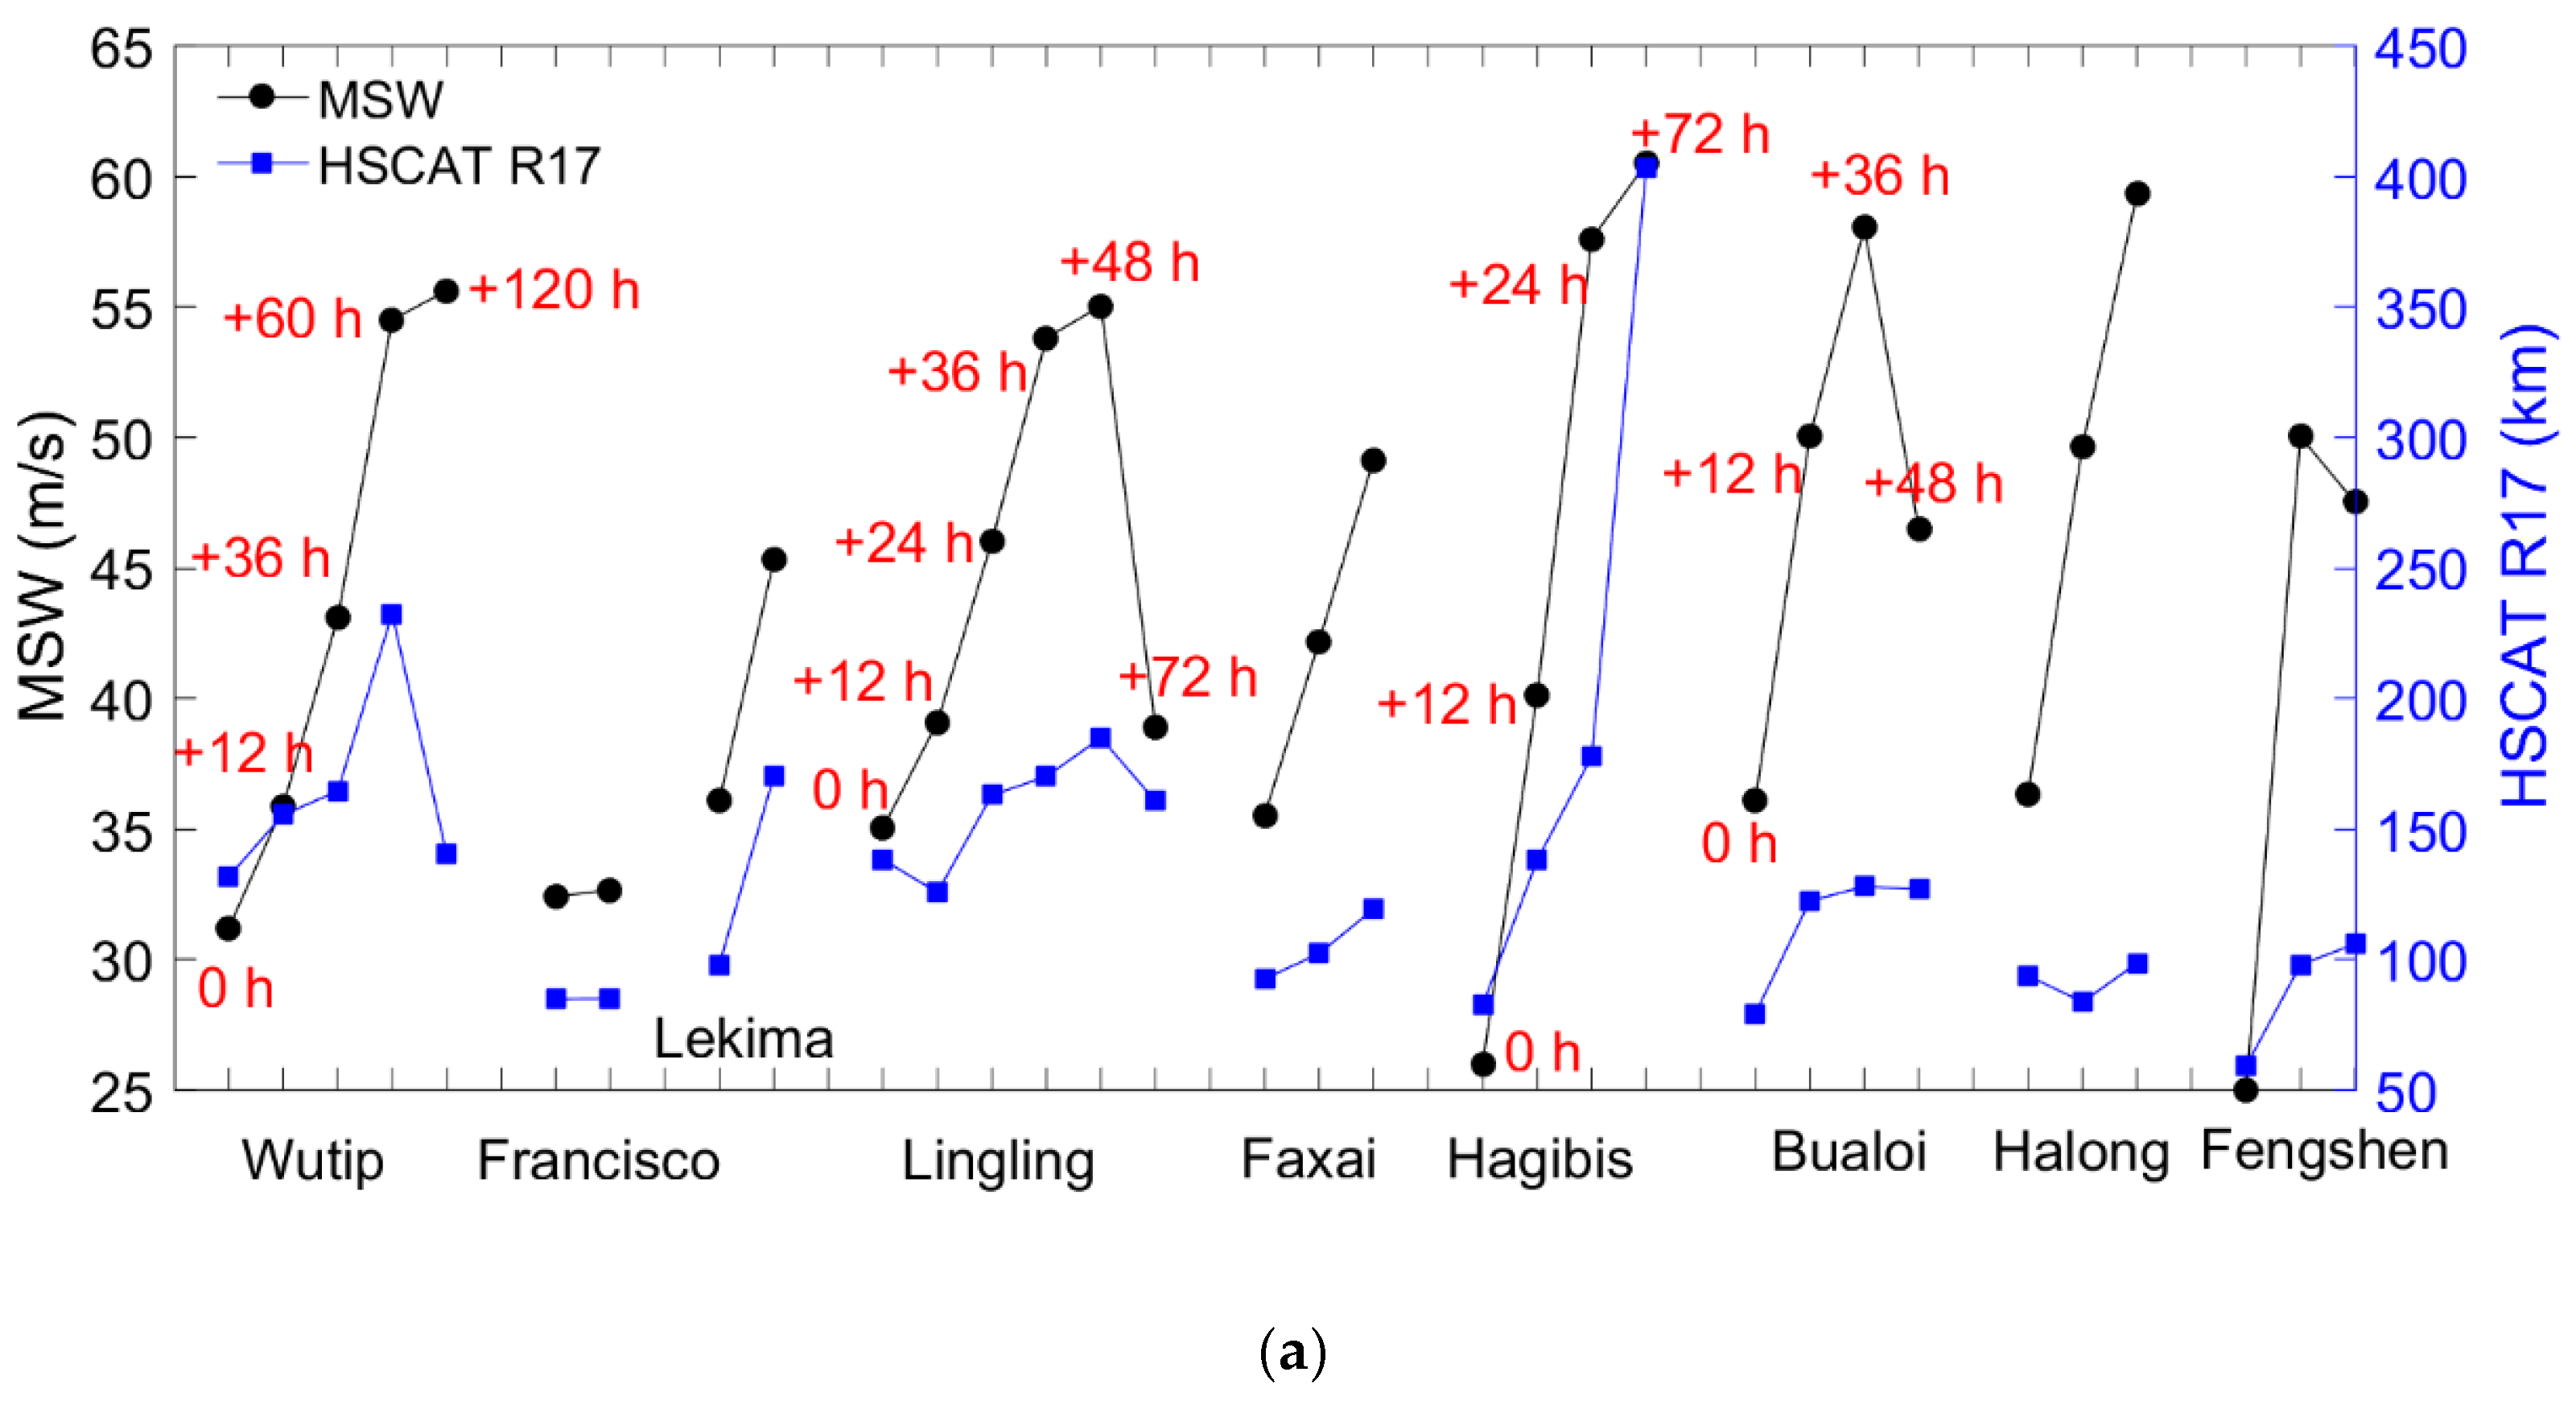
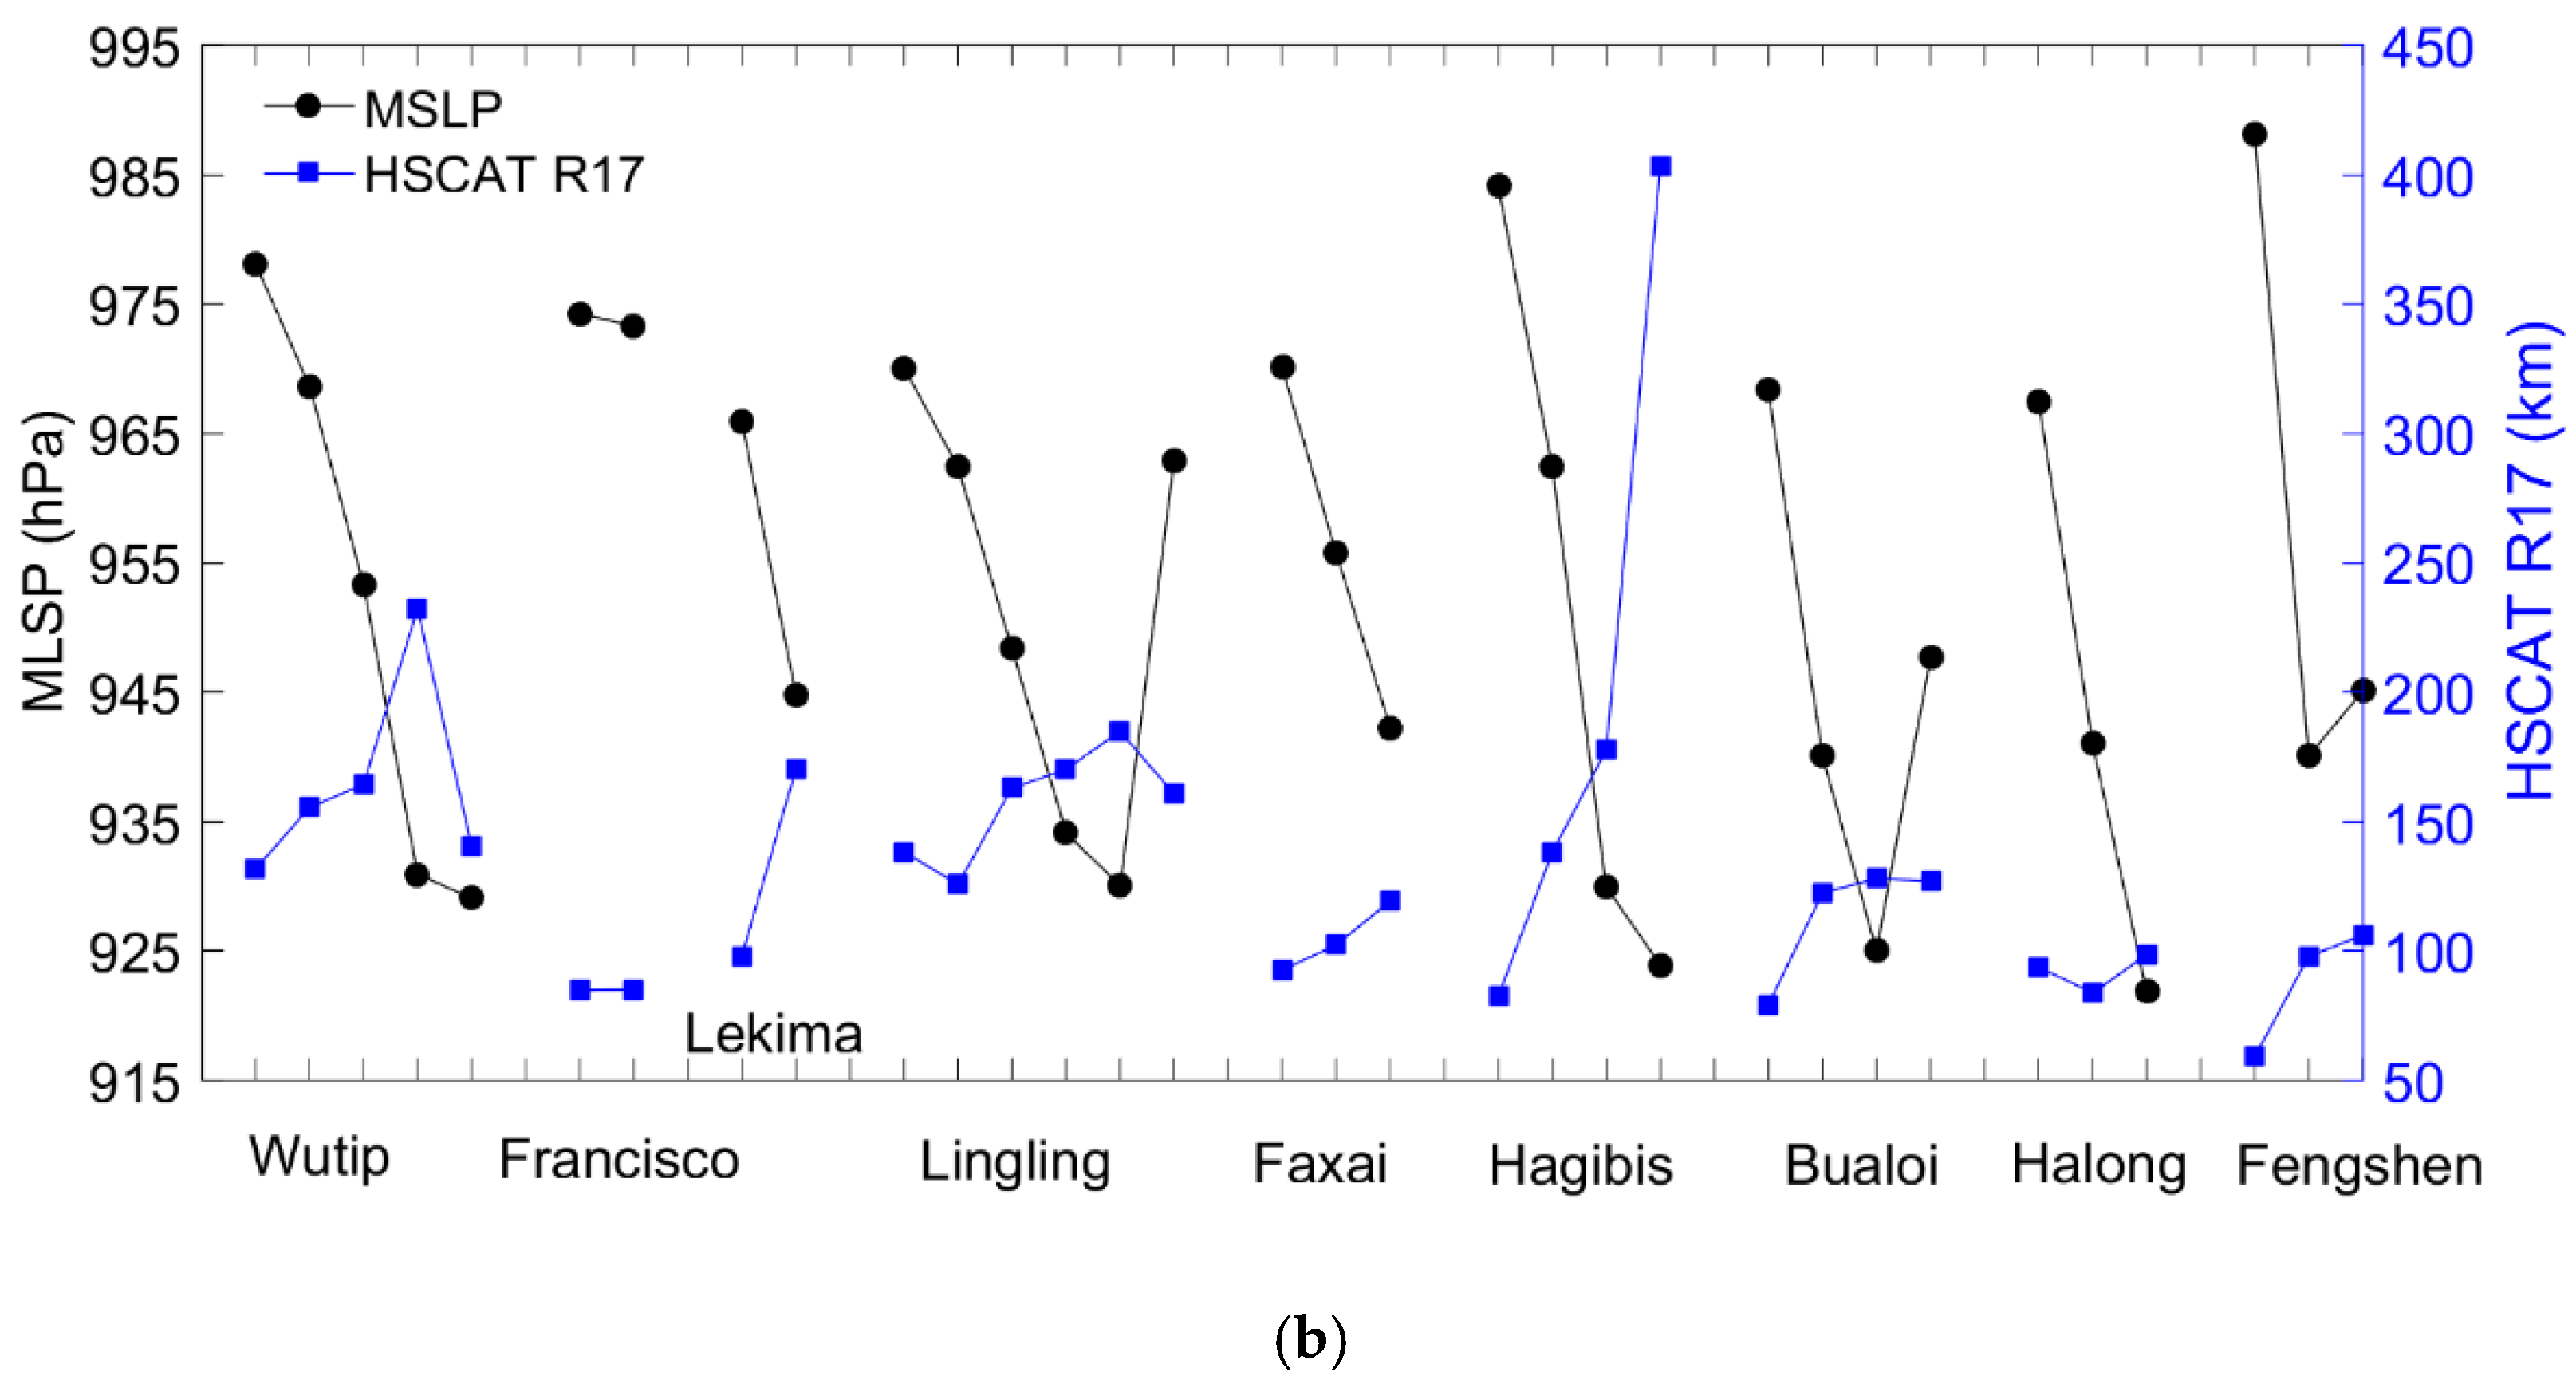
Figure 6 illustrates the case by case correspondence between the HSCAT R17 and best-track MSW/MSLP. Note that the HSCAT acquisitions for each TC event are within 48–72 h (see Figure 1). It is obvious that the HSCAT wind radii generally correlate (anticorrelate) well with the best-track MSW (MSLP), except for the TC Halong, whose intensity rapidly increased by 23 m/s in 24 h, while the R17 value remained roughly the same, around 90 km. The correlation coefficient is calculated for the TC events with more than three HSCAT overpasses, and the results are summarized in Table 1. The correlation between the HSCAT R17 and best-track MSW/MSLP is generally larger than 0.8, better than the maximum wind speed of both HSCAT and ECMWF forecasts.

4.3. ASCAT Wind Radii versus Best-Track MSW

The proposed technique in Section 3 is applied to the nine ASCAT TC acquisitions in Figure 1, and the correspondence between the ASCAT R17 and best-track MSW/MSLP is shown in Figure 7. Note also, that the ASCAT acquisitions for each TC event are within 36 h. Similarly, it is not feasible to create a common TC intensity prediction model only based on the ASCAT R17 value, as the same R17 value of ~120 km corresponds to a very different best-track MSW for TC Lingling (33.2 m/s), Faxai (44.6 m/s), and Bualoi (50.0 m/s), respectively. Nevertheless, the ASCAT R17 shows a very promising correlation with the best-track MSW and MSLP for each individual TC event, with a correlation coefficient (>0.9) similar to that between the ASCAT maximum wind speed and best-track MSW (not shown). In short, the wind radii information derived from the C-band ASCAT is as useful as its maximum wind speed for the analysis of TC intensity in terms of a nowcasting or short-range forecasting purpose.

5. Discussion and Conclusions

Satellite scatterometers are able to obtain accurate stream line features [32] in the presence of TCs, such that they have been widely used in TC monitoring, notably for the monitoring of the TC center location. However, the scatterometer-derived extreme winds usually present larger uncertainties due to signal saturation and rain contamination effects (the latter is mostly for Ku-band systems), limiting the application of its data in determining the TC intensity. Following the unique pattern of wind stress divergence and curl near the TC core, a new method is developed to determine the TC center location, and to estimate the azimuthally averaged radius of 17 m/s scatterometer winds. Although this article ignored the QC flag when calculating the R17, Xu and Stoffelen [33] mentioned a new indicator for the Ku-band QC which can improve the QC of rain in the Ku-band wind scatterometer, and we may apply multiple QC indicators to improve the R17 calculation in the near future.
The best-track database was used as another metric to verify the TC center location and R17. The correlation between the estimated wind radii and the best-track MSW/MSLP is analyzed, and it proves that the estimated R17 value is a better proxy for TC intensity than the maximum wind speed of the Ku-band HSCAT. However, the correlation between R17 and MSW is still rather low (r = 0.54) to develop a universal TC intensity prediction model. Through a case by case study, we find that the R17 value is highly correlated with the best-track MSW for each single TC event and their correlation coefficient is up to 0.86. This finding implies that the scatterometer wind radii are useful for estimating TC intensity when limiting the spatial and temporal context in which the analysis is performed. Moreover, this method can be also applied to the other scatterometers onboard the HY-2 satellite series (e.g., HSCAT-C and -D), hence it is useful to improve the monitor of TC intensity using the HY-2 satellites observations.
Note that the illustrated TCs are generally at the growing phases. The correspondence between R17 and MSW becomes more complicated when a TC is at the weakening stage. That is, the 17-m/s wind radius may keep growing before it approaches a saturated value, even though the TC intensity has gradually decreased. Nonetheless, for nowcasting or short-range forecasting purposes, the scatterometer R17 value is still quite useful in assessing the evolution of TC intensity, particularly with the joint observations from the HSCAT constellation.

Author Contributions

Conceptualization, W.L. and M.P.; methodology, S.L. and W.L.; software and validation, S.L. and Z.W.; formal analysis, W.L., M.P. and S.L.; writing—review and editing, S.L., W.L. and M.P. All authors have read and agreed to the published version of the manuscript.

Funding

This research was funded by the National Natural Science Foundation of China, grant number 42027805.

Institutional Review Board Statement

Not applicable.

Informed Consent Statement

Not applicable.

Data Availability Statement

The NSOAS HSCAT L2B data are available at https://osdds.nsoas.org.cn/ (last accessed on 30 January 2022). The ASCAT L2B data are provided by EUMETSAT OSI SAF. The CMA best-track data are available at http://tcdata.typhoon.org.cn/ (last accessed on 30 January 2022).

Acknowledgments

The authors would like to acknowledge NSOAS for straightforward and rapid access to the HY-2B data. We would also like to acknowledge the EUMETSAT NWP SAF for EUMETSAT OSI SAF for providing the ASCAT data.

Conflicts of Interest

The authors declare no conflict of interest.

References

  1. Hayes, S.P.; Mangum, L.J.; Picaut, J.; Sumi, A.; Takeuchi, K. TOGA-TAO: A Moored Array for Real-time Measurements in the Tropical Pacific Ocean. Bull. Am. Meteorol. Soc. 1991, 72, 339–347. [Google Scholar] [CrossRef] [Green Version]
  2. Sapp, J.; Alsweiss, S.; Jelenak, Z.; Chang, P.; Carswell, J. Stepped Frequency Microwave Radiometer Wind-Speed Retrieval Improvements. Remote Sens. 2019, 11, 214. [Google Scholar] [CrossRef] [Green Version]
  3. Morris, M.; Ruf, C.S. Determining Tropical Cyclone Surface Wind Speed Structure and Intensity with the CYGNSS Satellite Constellation. J. Appl. Meteorol. Clim. 2017, 56, 1847–1865. [Google Scholar] [CrossRef]
  4. Reul, N.; Tenerelli, J.; Chapron, B.; Vandemark, D.; Quilfen, Y.; Kerr, Y. SMOS satellite L-band radiometer: A new capability for ocean surface remote sensing in hurricanes. J. Geophys. Res. 2012, 117, C02006. [Google Scholar] [CrossRef] [Green Version]
  5. Meissner, T.; Ricciardulli, L.; Wentz, F.J. Capability of the SMAP Mission to Measure Ocean Surface Winds in Storms. Bull. Am. Meteorol. Soc. 2017, 98, 1660–1677. [Google Scholar] [CrossRef]
  6. Polverari, F.; Portabella, M.; Lin, W.; Sapp, J.W.; Stoffelen, A.; Jelenak, Z.; Chang, P.S. On High and Extreme Wind Calibration Using ASCAT. IEEE Trans. Geosci. Electron. 2021, 60, 1–10. [Google Scholar] [CrossRef]
  7. Ricciardulli, L.; Mears, C.; Manaster, A.; Meissner, T. Assessment of CYGNSS Wind Speed Retrievals in Tropical Cyclones. Remote Sens. 2021, 13, 5110. [Google Scholar] [CrossRef]
  8. Zhang, L.; Yin, X.; Shi, H.; Wang, Z.; Xu, Q. Estimation of wind speeds inside Super Typhoon Nepartak from AMSR2 low-frequency brightness temperatures. Front. Earth Sci. 2019, 13, 124–131. [Google Scholar] [CrossRef]
  9. Manaster, A.; Ricciardulli, L.; Meissner, T. Tropical Cyclone Winds from WindSat, AMSR2, and SMAP: Comparison with the HWRF Model. Remote Sens. 2021, 13, 2347. [Google Scholar] [CrossRef]
  10. Lecomte, P.; Crapolicchio, R.; Saavedra de Miguel, L. Cyclone Tracking with ERS-2 Scatterometer: Algorithm Performances and Post-processed Data Examples. In Proceedings of the ERS-ENVISAT Symposium Gothenburg (S), Gothenburg, Sweden, 16–20 October 2000. [Google Scholar]
  11. Brennan, M.J.; Hennon, C.C.; Knabb, R.D. The Operational Use of QuikSCAT Ocean Surface Vector Winds at the National Hurricane Center. Wea. Forecasting. 2009, 24, 621–645. [Google Scholar] [CrossRef] [Green Version]
  12. Seubson, S.; Suntana, O. Characterization of the Tropical Cyclones Wind Radii in the North Western Pacific Basin Using the ASCAT Winds Data Products. In Proceedings of the 2018 Progress in Electromagnetics Research Symposium (PIERS-Toyama), Toyama, Japan, 1–4 August 2018; pp. 1428–1433. [Google Scholar]
  13. Hu, T.; Wu, Y.; Zheng, G.; Zhang, D.; Zhang, Y.; Li, Y. Tropical Cyclone Center Automatic Determination Model Based on HY-2 and QuikSCAT Wind Vector Products. IEEE Trans. Geosci. Remote Sens. 2019, 57, 709–721. [Google Scholar] [CrossRef]
  14. Spencer, M.W. A Methodology for the Design of Spaceborne Pencil-Beam Scatterometer Systems. Ph.D. Thesis, Brigham Young University, Provo, UT, USA, 2001. [Google Scholar]
  15. Pramanik, S.; Sil, S. Assessment of SCATSat-1 Scatterometer Winds on the Upper Ocean Simulations in the North Indian Ocean. J. Geophys. Res. Oceans. 2021, 126, 6. [Google Scholar] [CrossRef]
  16. Bhowmick, S.A.; Kumar, R.; Kiran Kumar, A.S. Cross Calibration of the OceanSAT -2 Scatterometer With QuikSCAT Scatterometer Using Natural Terrestrial Targets. IEEE Trans. Geosci. Remote Sens. 2014, 52, 3393–3398. [Google Scholar] [CrossRef]
  17. Wang, Z.; Zhao, C.; Zou, J.; Xie, X.; Zhang, Y.; Lin, M. An improved wind retrieval algorithm for the HY-2A scatterometer. Chin. J. Oceanol. Limnol. 2015, 33, 1201–1209. [Google Scholar] [CrossRef]
  18. Figa-saldaña, J.; Wilson, J.; Attema, E.; Gelsthorpe, R.; Drinkwater, M.; Stoffelen, A.D. The Advanced Scatterometer (ASCAT) on the Meteorological Operational (MetOp) platform: A follow on for European wind scatterometers. Can. J. Remote Sens. 2002, 28, 404–412. [Google Scholar] [CrossRef]
  19. Stiles, B.W.; Yueh, S.H. Impact of rain on spaceborne ku-band wind scatterometer data. IEEE Trans. Geosci. Remote Sens. 2002, 40, 1973–1983. [Google Scholar] [CrossRef]
  20. Lin, W.; Portabella, M. Toward an Improved Wind Quality Control for RapidScat. IEEE Trans. Geosci. Remote Sens. 2017, 55, 3922–3930. [Google Scholar] [CrossRef] [Green Version]
  21. Liu, J.; Lin, W.; Dong, X.; Lang, S.; Yun, R.; Zhu, D.; Zhang, K.; Sun, C.; Mu, B.; Ma, J.; et al. First Results From the Rotating Fan Beam Scatterometer Onboard CFOSAT. IEEE Trans. Geosci. Remote Sens. 2020, 58, 8793–8806. [Google Scholar] [CrossRef]
  22. Wang, Z.; Zou, J.; Stoffelen, A.; Lin, W.; Verhoef, A.; Li, X.; He, Y.; Zhang, Y.; Lin, M. Scatterometer Sea Surface Wind Product Validation for HY-2C. IEEE J-STARS 2021, 14, 6156–6164. [Google Scholar] [CrossRef]
  23. Chan, K.T.F.; Chan, J.C.L. Size and Strength of Tropical Cyclones as Inferred from QuikSCAT Data. Mon. Weather Rev. 2012, 140, 811–824. [Google Scholar] [CrossRef]
  24. Guo, X.; Tan, Z. Tropical cyclone fullness: A new concept for interpreting storm intensity. Geophys. Res. Lett. 2017, 44, 4324–4331. [Google Scholar] [CrossRef]
  25. Wang, Z.; Stoffelen, A.; Zou, J.; Lin, W.; Verhoef, A.; Zhang, Y.; He, Y.; Lin, M. Validation of New Sea Surface Wind Products From Scatterometers Onboard the HY-2B and MetOp-C Satellites. IEEE Trans. Geosci. Remote Sens. 2020, 58, 4387–4394. [Google Scholar] [CrossRef]
  26. Ying, M.; Zhang, W.; Yu, H.; Lu, X.; Feng, J.; Fan, Y.; Zhu, Y.; Chen, D. An overview of the China Meteorological Administration tropical cyclone database. J. Atmos. Oceanic Technol. 2014, 31, 287–301. [Google Scholar] [CrossRef] [Green Version]
  27. Lu, X.; Yu, H.; Ying, M.; Zhao, B.; Zhang, S.; Lin, L.; Bai, L.; Wan, R. Western North Pacific Tropical Cyclone Database Created by the China Meteorological Administration. Adv. Atmos. Sci. 2021, 38, 690–699. [Google Scholar] [CrossRef]
  28. Merrill, R.T. A Comparison of Large and Small Tropical Cyclones. Mon. Weather Rev. 1984, 112, 1408–1418. [Google Scholar] [CrossRef] [Green Version]
  29. Liu, S.; Lin, W.; Wang, Z.; Lang, S. Determination of Tropical Cyclone Location and Intensity using HY-2B Scatterometer Data. Acta Oceanol. Sin. (Chin. Ed.) 2021, 43, 1–12. [Google Scholar]
  30. Shea, D.J.; Gray, W.M. The Hurricane’s Inner Core Region. I. Symmetric and Asymmetric Structure. J. Atmos. Sci. 1973, 30, 1544–1564. [Google Scholar] [CrossRef] [Green Version]
  31. Kimball, S.K.; Mulekar, M.S. A 15-Year Climatology of North Atlantic Tropical Cyclones. Part I: Size Parameters. J. Clim. 2004, 17, 3555–3575. [Google Scholar] [CrossRef]
  32. Lin, W.; Portabella, M.; Stoffelen, A.; Vogelzang, J.; Verhoef, A. On mesoscale analysis and ASCAT ambiguity removal. Q. J. R. Meteorol. Soc. 2016, 142, 1745–1756. [Google Scholar] [CrossRef] [Green Version]
  33. Xu, X.; Stoffelen, A. Improved Rain Screening for Ku-Band Wind Scatterometry. IEEE Trans. Geosci. Remote Sens. 2020, 58, 2494–2503. [Google Scholar] [CrossRef]
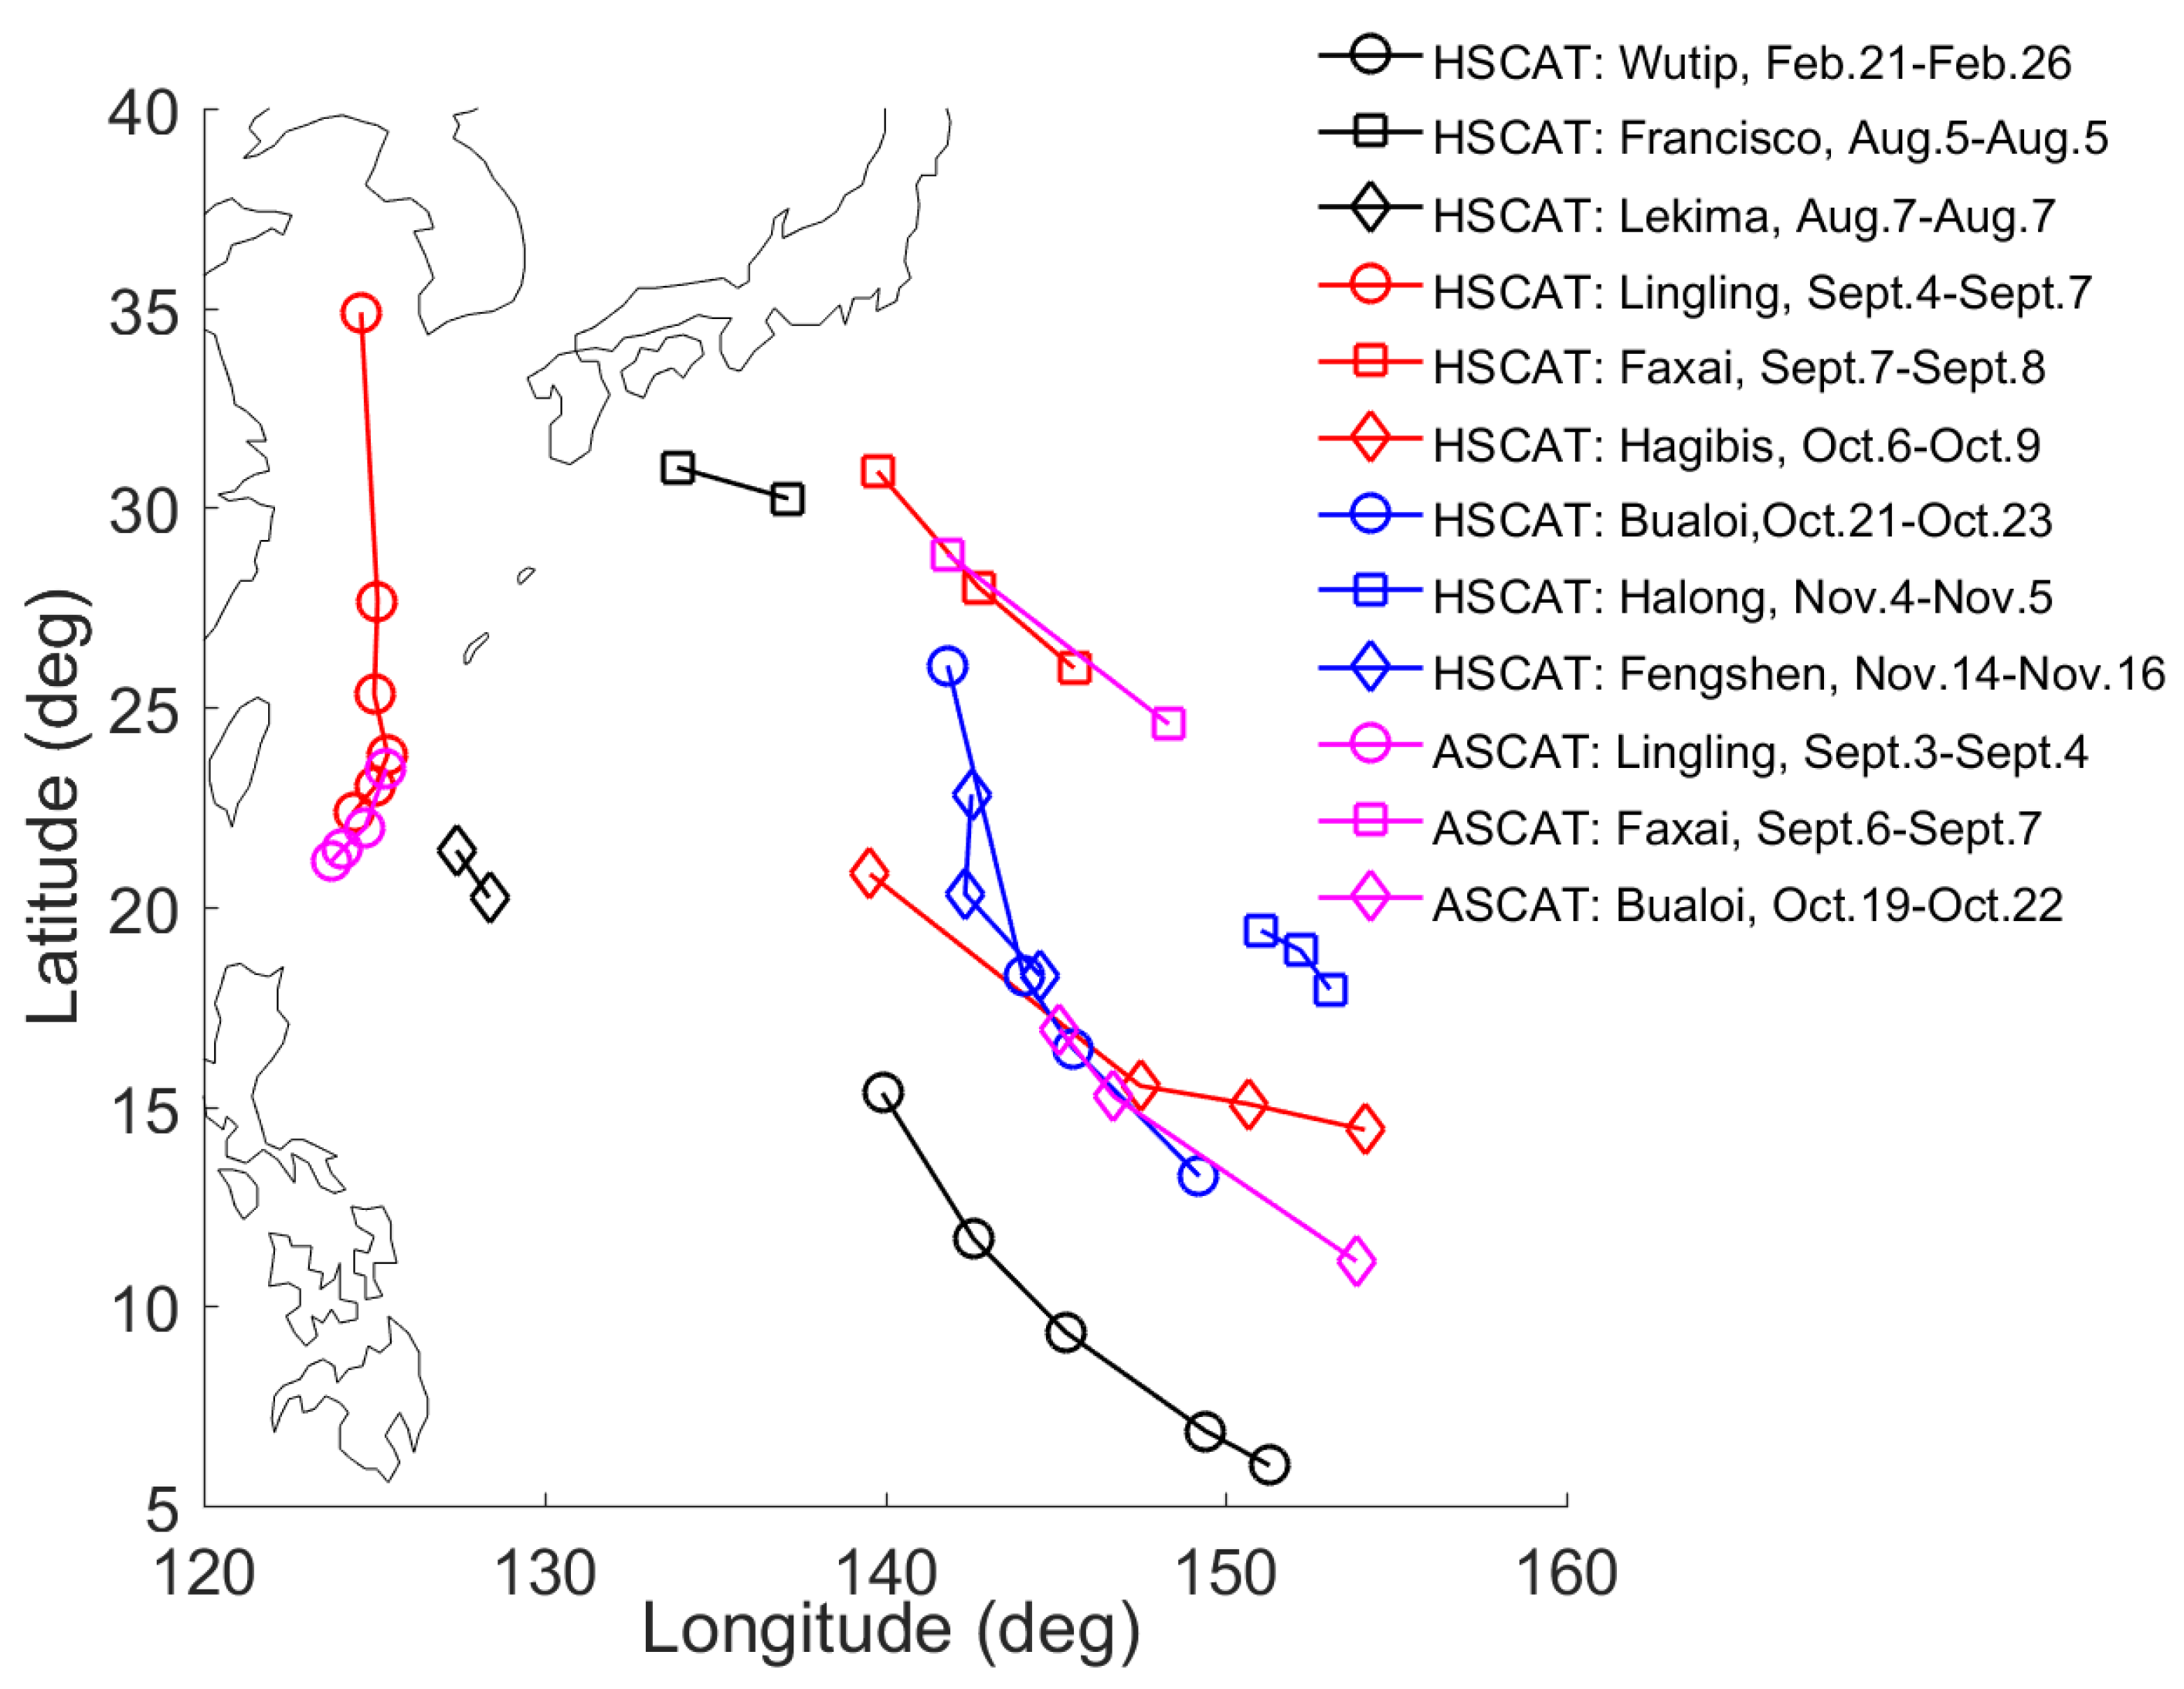
Figure 1. The observation data used in this study. The legend indicates the observing sensors, the TC names, and the TC durations in year 2019. The markers indicate the TC center location identified with the method in Section 3.
Remotesensing 14 01035 g001
Figure 2. Illustration of the divergence (a) and the curl (b) of HSCAT wind stress (TC Faxai) acquired on 7 September 2019 at UTC 16:34.
Remotesensing 14 01035 g002
Figure 3. Illustration of exception handing in the estimation of R17: (a) more than one 17-m/s intersection in a wind profile; (b) isogram of 17-m/s wind speed constructed from the radial extent of 17 m/s winds closest to TC center; (c) corrected isogram of 17-m/s wind speed.
Remotesensing 14 01035 g003
Figure 4. The best-track MSW versus HSCAT maximum wind speed (a) and ECMWF maximum forecast wind speed (b). Black line indicates the linear regression result.
Remotesensing 14 01035 g004
Figure 5. The best-track MSW versus HSCAT-B R17 (a) and ECMWF R17 (b). Black line indicates the linear regression result.
Remotesensing 14 01035 g005
Figure 6. The correspondence between HSCAT R17 and best-track MSW (a) and MSLP (b), respectively. The red text in (a) shows the temporal evolution of the TC events with more than three HSCAT acquisitions.
Remotesensing 14 01035 g006aRemotesensing 14 01035 g006b
Figure 7. The correspondence between ASCAT R17 and best-track MSW (a) and MSLP (b), respectively.
Remotesensing 14 01035 g007
Table 1. Correlation between different HSCAT parameters and best-track MSW/MSLP.
TC NameCorrelation Coefficient
R17 vs. MSWHSCAT Wmax vs. MSWECMWF Wmax vs. MSWR17 vs. MSLPHSCAT Wmax vs. MSLPECMWF Wmax vs. MSLP
Wutip0.53−0.360.33−0.540.36−0.34
Wutip (<72 h)0.970.040.89−0.97−0.02−0.88
Lingling0.830.630.56−0.84−0.61−0.54
Hagibis0.790.760.91−0.81−0.78−0.92
Bualoi0.860.16−0.08−0.87−0.170.09
Publisher’s Note: MDPI stays neutral with regard to jurisdictional claims in published maps and institutional affiliations.