Article

Evaluating Street Lighting Quality in Residential Areas by Combining Remote Sensing Tools and a Survey on Pedestrians’ Perceptions of Safety and Visual Comfort

1
School of Architecture and Fine Art, Dalian University of Technology, Dalian 116024, China
2
Laboratory of Building Environment and New Energy Resources, Faculty of Infrastructure Engineering, Dalian University of Technology, Dalian 116024, China
3
Department of Natural Resources and Environmental Management, University of Haifa, Mt. Carmel, Haifa 3498838, Israel
4
Aerospace Information Research Institute, Chinese Academy of Sciences (CAS), Beijing 100094, China
5
Key Laboratory of Earth Observation Hainan Province, Chinese Academy of Sciences, Sanya 572029, China
*
Author to whom correspondence should be addressed.
Remote Sens. 2022, 14(4), 826; https://doi.org/10.3390/rs14040826
Submission received: 24 December 2021 / Revised: 31 January 2022 / Accepted: 4 February 2022 / Published: 10 February 2022
(This article belongs to the Special Issue Applications of AI and Remote Sensing in Urban Systems)

Abstract

:
The perceived quality of street lighting influences pedestrians’ perceptions of safety and visual comfort, as well as outdoors activities at night. This study explores the association between street lighting attributes, such as illuminance and wavelength, and pedestrians’ feeling of safety (FoS) and perceived lighting quality (PLQ) in eight residential districts in Dalian, China. To achieve this goal, we combine remote sensing technology with ground investigation. The ground research includes physical measurements of lighting attributes, such as intensity, color temperature, and glare, as well as survey evaluations of pedestrians’ perceptions of safety and visual comfort. We also analyze the influence of several environmental factors, such as traffic volumes and vegetation, while accounting for personal characteristics of the observers, such as gender and age. Findings from the remote sensing reveal that Dalian’s residential districts differ substantially by their nighttime light emissions, with high concentration of strong red band (i.e., long wavelength) emissions occurring in Zhongshan and Jinzhou, and strong blue band (i.e., short wavelength) emissions found in central Zhongshan. Results from the ground surveys further indicate that a satisfactory level of FoS reaches at the illumination levels of 5–17 lx, and that people feel safer if nighttime light is warm and uniform. From a multiple regression analysis, it is also found that illuminance and uniformity are the main factors affecting PLQ under conditions of low or high illuminance, while glare and color temperature play a more significant role under high illuminance. In addition, a satisfactory level of PLQ is found at illuminance levels of 25–35 lx and light color temperature of 4000 K–5500 K.

Graphical Abstract

1. Introduction

Each city and region has its own unique nighttime light environment. As neighborhood morphologies and local cultures differ, the sense of security and visual comfort experienced by the residents of such diverse environments may also differ. Many studies of night light in urban environments were based on remote sensing data provided by space- borne instruments [1]. The main advantages of this approach include a large observation range, a stable observation platform, and high measurement efficiency [2]. It also has unique advantages in the study of large-scale urban environments. However, remote sensing data represent a macro-urban night image, which does not accurately reflect street level lighting attributes. Furthermore, even most of the studies which used remote sensing and/or instrumental ground measurement [3], did not integrate people’s perceptions and feelings towards the measured lighting. In this paper, remote sensing, measurement, and human perceptions of the nocturnal urban environment are combined for quantitative and qualitative analysis. As nighttime illumination is not a goal in itself, but is needed to support human activities, public perception is an indispensable part of an effective environmental nighttime light evaluation.
Public space lighting (PSL) is an important part of the urban environment that contributes to the overall feelings of safety (FoS) and visual comfort of pedestrians after natural dark [4,5].
Previous studies have found that risk perception is an important factor in people’s nighttime activities and has a significant impact on human behavior [6]. Safety perception (or a fear of crime) is a different phenomenon than actual crime. This is because the lack of Feeling of Safety (FoS) might trigger people’s stress response and restrict their nighttime activities [7]. According to several studies, people’s concerns about personal safety increase sharply after dark [8]. Studies have also shown that improvement in street lighting can increase the level of community safety and reduce the fear of crime [9].
The factors influencing FoS after dark include not only illuminance, but also other lighting attributes, such as uniformity, light color rendering, and light color temperature [10]. Studies by Portnov et al. [11], Saad et al. [12], and Svechkina el al. [13] were based on a modern mobile phone survey technology for data collection, and indicated that illumination levels, either perceived or instrumentally measured, can affect the feeling of safety (FoS) of pedestrians after dark. In particular, Svechkina et al. [13] established an evaluation model between road lighting attributes and the feeling of safety (FoS), and found that lighting has a certain positive impact on FoS. In addition, Portnov et al. [11] established a model linking different PSL attributes with FoS. The research shows that higher illumination level and uniformity have a positive impact on FoS, and rich blue light has a negative impact on FoS This conclusion is supported by another recent study by Saad et al. [12], who found that using warmer lights and increasing light uniformity can help to save energy while maintaining a reasonable FoS level.
Visual comfort, also known as perceived lighting quality (PLQ), refers to the realization of residents’ physiological and psychological satisfaction based on people’s subjective feelings. In a study of this phenomenon, Johnson et al. [14] explored the perceived outdoor lighting quality (POLQ) index. Through the factor analysis, the researchers identified two main components of POLQ, one of which is perceived intensity quality (PSQ), related to the intensity and direction of the light source, and the other is perceived comfort quality (PCQ) that to light color temperature and glare. However, this field research was not based on a sufficient number of assessments, so its applicability on a global scale is limited. Fotios and Cheal [15] studied how the spectral power distribution of a lamp affects the perception of illumination quality by pedestrians at night. In a separate study, Vera and colleagues [16] explored the effect of discomfort glare on pedestrians under static and dynamic conditions. The results show that the effect of discomfort glare on pedestrians in the dynamic state is lower than in the static state. The study also revealed that the vertical illuminance has the greatest correlation with discomfort glare, and a discomfort glare model based on vertical illuminance performed better in comparison to other models [17,18].
Outdoor lighting is an important part of total global lighting, and exhibits an annual growth of 3–6% [19]. A good outdoor lighting system for residential areas not only improves the aesthetic quality of the environment, but also minimizes energy consumption and reduces operating costs. Otherwise, the excessive illumination may become light pollution [20]. This research attempts to address this challenge by studying the nighttime lighting environment in typical residential areas in Dalian, China, by combining remote sensing with on-ground measurements of lighting attributes and assessing residents’ FoS and PLQ under lighting conditions measured using a field survey. After cointegrating the data, we analyzed the factors influencing the perceived levels of safety and comfort, using multiple regression techniques.

2. Research Methods

2.1. Research Process

The study selects the research objects by using remote sensing images and population data, conducts field lighting measurement and subjective evaluation research in 8 typical residential areas in Dalian, compares the lighting values and subjective scores of 8 residential areas, and analyzes the reasons for the observed differences. The regression model of lighting parameters and evaluation values is established, and the safety model and comfort model are obtained. Study phases are featured in Figure 1.
At the first step, we downloaded the Dalian satellite cloud-free map from the ISS luminous image archive (Figure 2). The downloaded image was for the year 2010, the latest image available for the study area, with the spatial resolution of ~40 m per pixel. The image was cropped and geo-referenced, to match the study area. Next, we extracted the red, green, and blue band images of the target image (Figure 3) [21]. The blue (i.e., the short wavelength) light minimizes energy waste while maintaining visual performance where low illumination levels are required [22]. However, blue light illumination is known to adversely affect circadian rhythms and melatonin secretion in animals and humans [23,24], while red (i.e., long wavelength) light has less impact on human health and ecology [25,26]. Therefore, different light band images were used for the study neighborhoods’ identification and analysis.
In the ArcGIS10.x software, the parameters of illumination flax were next extracted, separately for the red and blue illuminance bands, and all the neighborhoods in Dalian were sorted in terms of light emissions, from low to high, as shown in Figure 4 and Figure 5, respectively.
The distribution of red and blue light values in each urban area of Dalian is shown in Figure 6 and Figure 7, respectively. In these two images, the high value areas of the red band are concentrated in Zhongshan and Jinzhou, while the high-value areas of the blue band are concentrated in Zhongshan. The low-value regions of the two bands are distributed in the area near the center of the city.
To cross-reference nighttime light emissions with population density patterns, we used population data from China’s 2010 Census [27]. According to Figure 8, the most densely populated areas of Dalian are mainly concentrated in the central mountainous area, the Shahekou District, and the Jinzhou District.
Based on the co-distribution of population density and nighttime light brightness, further screening was carried out to identify neighborhoods, combining different types of light emissions with high-density areas of multistory buildings, typical for the city’s contemporary development. The preference was given to predominantly residential neighborhoods with modern community facilities, learning from which could help to improve future neighborhood lighting design.
After the screening process was performed using the above criteria, eight typical residential areas were identified, with four residential areas representing high brightness value areas and four neighborhoods representing low brightness value areas. The selected residential area covers multi-story, multi-family buildings, with local commercial areas. Local community facilities, such as gyms and neighborhood parks are also present in each neighborhood. The land area of each community ranges from 12,000 m2 to 96,000 m2. The residential areas’ information is shown in Table 1, and the locations of the selected neighborhoods are shown in Figure 9 and Figure 10.

2.2. Research Stages

(1) Research period and weather
The measurements began on 15 October 2020 and ended on 23 November 2020. In order to ensure comparability, all measurements were carried out at night when the weather is clear and cloudless, and the air quality index was similar. The measurement time was 20:00–23:00. During this time, all the existing luminaries in the neighborhoods were lit.
(2) Instrumental measurement method
We chose a walking route of 800 to 1000 m in each residential area, to ensure that the survey route covered the main and secondary streets, as well as open spaces, such as squares and parks (if any). On the sidewalk of each route, measurement points were arranged at the intervals of 20–30 m, and about 20–30 measuring points were selected in each residential area.
Following the International Commission on Illumination (CIE) night lighting measurement guidelines, we used a CL-70F illuminance meter and a CL-500A illuminance meter to measure the horizontal and vertical illuminance, color temperature, dominant wavelength, etc., to perform spot measurements in each location. In addition, we used a handheld LS-100 luminance meter to measure road brightness. We used the brightness data to calculate the degree of discomfort glare at the measurement point. A laser range finder was used to measure the road size, the lamp pole size, distance between the lamp poles, etc.
For lighting attributes such as illuminance, color temperature, and dominant wavelength, three different types of measurement were used, namely the horizontal measurement (less than 30 cm from the ground and 1.5 m above the ground), the vertical measurement (1.5 m above the ground), and the observer’s eye-level vertical panoramic measurement (an interval of about 30° vertically, covering about 180° of the horizontal angle).
(3) Subjective evaluation survey
The observer group included residents and non-residents of the neighborhoods of all ages and educational backgrounds. Nonresidents mainly included student volunteers recruited from the Dalian University of Technology, and resident group included residents of the survey site. The gender and age of the respondents are shown in Table 2. Participants needed to follow the established route and record their perceptions of nighttime illumination at each assessment point. The assessment points were marked on the Baidu map in order to help participants accurately find the positioning point during the survey, and to ensure that the instrument measurement points’ locations were consistent with the location of the survey points assessed by the observers, so that the map markers could be synchronized on the web and mobile phones.
Prior to the survey, the survey participants were asked to fill in questionnaires on their personal information, including age, gender, and education level. In order to avoid interference, observers were instructed to evaluate each measurement point on a specific survey route alone. Each time, the participants had to verify the current location, so as to ensure that it was consistent with the measurement point location by the instrument, and then answer question about the lighting environment.
The questionnaire was distributed using the Questionnaire Star app. The questionnaire used a four-point scale to evaluate four lighting attributes (light intensity, color temperature, uniformity, and glare), safety, and perceived lighting quality (overall comfort). The specific scales used to evaluate different parameters were as follows:
(A) Illumination: 0—very weak; 1—slightly weak; 2—strong; 3—too strong;
(B) Light temperature: 0—too cold; 1—slightly cold; 2—slightly warm; 3—too warm;
(C) Light uniformity: 0—uneven; 1—slightly uneven; 2—quite even; 3—very even;
(D) Glare: 0—not dazzling; 1—slightly dazzling; 2—dazzling; 3—very dazzling;
(E) Feeling of safety: 0—feel very unsafe; 1—feel a little unsafe; 2—feel reasonably safe; 3—feel very safe;
(F) Perceived lighting quality: 0—uncomfortable; 1—a little discomfort; 2—quite comfortable; 3—very comfortable.

2.3. Data Processing

(1) Instrument measurement data
As shown in Figure 11, in four, out of the eight residential communities in which the field survey was conducted, the average illuminance of the sidewalk was greater than the average illuminance of the road surface by 10 lx. In these areas, the lighting fixtures were on one side of the road. The average illuminance of the sidewalk near the streetlights mostly meets or exceeds the requirements of the standard average illuminance value of the sidewalk surface, while the average illuminance of the sidewalk far away from the streetlight is significantly different from the standard value. The average illuminance value of the Lido Garden was the highest reaching 21.77 lx, mainly due to illumination form arterial high pole lighting and roadside shops. The Chunguangyuan Community had the lowest average illuminance of 0.52 lx on the sidewalk, because there is no commercial activity in the community and the streetlight power is low.
A comparison of the minimum illuminance of the pavement is shown in Figure 12. Only the minimum illuminance of the sidewalk surface of the Taoxian Community met the value of 2 lx required by the standard. The lowest value of the road surface minimum illuminance was recorded in the New New Community and Chunguangyuan Community (~0.1 lx), which indicates a significant gap between the actual illumination and the standard’s requirements.
In the field measurement of sidewalk lighting, the minimum vertical illuminance at the height of 1.5 m in all the communities was below the 3 lx level, regulated by the standard. However, the space lighting in Lido Garden, New Hope Garden, and Xiuyue Garden was slightly better than that in the other residential areas (Figure 13). Panoramic illumination can be regarded as an approximately semi-cylindrical illumination. According to the actual measurements, the minimum panoramic illuminance of the sidewalk in the eight residential areas did not meet the value of 2 lx stipulated by the standard (Figure 14).
Figure 15 shows the comparison of the glare level across the study areas. In the box chart, the solid part represents the interquartile range (2–75%) of the measured value, the thick horizontal line represents the median, and the red dot represents the mean value. Black dots represent outliers [28]. It can be seen in the figure, the overall discomfort glare level (GR) is between 30 and 40 GR, which is slightly uncomfortable. The level of discomfort glare in the Chunguangyuan Community is the smallest, and the glare levels in other residential areas are essentially similar.
The measured color temperatures of the eight communities are mainly distributed between 2500 K and 5000 K, as seen in Figure 16. Among these communities, the Pearl Beer Garden and Chunguangyuan Community use metal halide lamps, and the average color temperature is relatively high, with more blue light emissions in the spectrum, which produces a cold light. The Lido Garden, Xiuyue Garden, Taoxian Community, Blue Sky and Starry Sea, and New New Community mostly use high-pressure sodium lamps, and the average color temperature is low, with less blue in the spectrum and a mostly warm light. The color temperature gap between different sections of New Hope Garden is relatively large, as high color temperatures and low color temperatures are distributed throughout the area.
(2) Subjective evaluation data
Figure 17 and Figure 18 are drawn based on the statistical values of safety and comfort evaluation, respectively, in all study areas. From the figures, we can see that the levels of security and comfort in different residential areas differ greatly. The Taoxian Community has the highest safety rating, and the Chunguangyuan Community has the lowest rating. The highest comfort rating was found for the Taoxian Community (0–3 points), and the lowest was found for the Chunguangyuan Community.

3. Research Results

3.1. Analysis of FoS

PSL features comprise several attributes: illumination, color temperature, uniformity, and glare [29], each of which might affect FoS, energy consumption, and human health. However, there is a lack of empirical models associating lighting attributes with FoS that consider various contextual factors.
This study attempts to fill this knowledge gap and develop multiple PSL–FoS models, which connect lighting, color temperature, uniformity, and glare values with FoS, and control for personal, location, and environmental factors. Using such models might help to improve the satisfaction and well-being of urban residents while reducing health and ecological risks and improving energy efficiency.
(1)
Factors affecting FoS.
Table 3 shows the main research variables and their coding. The Akaike information criterion (AIC for short) shows whether adding a particular parameter improves the fitting degree of the model, but also introduces a penalty term to minimize the model parameters, which helps to reduce the possibility of over-fitting [30]. In this study, the AIC increment test was used to determine the influence weight of each research variable on FoS, while regression analysis, performed in the SPSS software, was used to identify the impact of each factor on FoS. In Figure 19, we estimate the relative contribution of each factor to FoS. The AIC and AIC increment can be obtained according to the sum of squares of the residuals. The larger the AIC increment, the greater the relative contribution of this factor to FoS.
(2)
Comparison of security evaluation results among different groups of people
① Age
The two independent group difference test includes independent sample t-test and Mann–Whitney U-test. Independent sample t-test is used to compare whether there is a difference in the mean value of a variable between two independent groups. It is a kind of t-test (also known as Student’s t-test). An independent samples t-test was used to compare the mean values of the variables between two independent age groups. The average FoS of participants aged 18–40 yo was 1.95 (SD = 0.904), and that of participants aged 41–61 was 1.61 (SD = 0.908). Independent t-tests (Table 4) showed that there was a significant difference between younger respondents and older respondents (p < 0.005, t = 6.099).
② Gender
In an independent sample t-test (Table 5), the average perceived safety of men was 2.09 (SD = 0.827) and that of women was 1.64 (SD = 0.955). The homogeneity test of variance showed that the variance of the two groups was not homogeneous (F = 54.011, p = 0.000 < 0.05) and that the variance corrected t-test should be used. The adjusted t-test result was t(DF) = −11.230 (1778.285), p = 0.000 (<0.05), which indicates that the FoS score of males’ safety perception evaluations was 2.09 ± 0.82 and the females’ FoS score was 1.64 ± 0.95. The difference was statistically significant at a 0.01 level, and the score of males was significantly higher than that of females, thus indicating that, on average, men feel safer than women in the same urban settings.
(3)
Correlation between illuminance values and safety evaluation values
① Mann–Whitney U-test
The Mann–Whitney U-test is a kind of nonparametric test which does not require the overall normal distribution [31]. Therefore, it is generally used when the data do not meet the normality requirements of a t-test. In order to evaluate whether there was a correlation between the value of perceived safety and illumination, a nonparametric Mann–Whitney U-test was conducted. The average and median of illumination levels were decomposed into low illumination and high illumination, and the safety evaluations of different illumination conditions were compared. The results showed that there was a significant difference in the level of perceived safety (p < 0.01), and the safety evaluation scores of the places with sufficient light were much higher than those of the places with insufficient light.
② Bivariate OLS regression
Ordinary least squares (OLS) method is the most fundamental form of regression analysis. It requires the least model conditions, that is, to minimize the square sum of the distance between all observations on the scatter diagram and the regression line. Binary regression analysis was conducted on the original value and the log-transformed values of the illuminance data. The results are shown in Table 1. Models 1a, 1b, and 1c represent the regression models of the original value of illuminance in the horizontal, vertical, and vertical panoramic directions, respectively, while Models 1d, 1e, and 1f represent the regression models of the log-transformed values of illuminance in horizontal, vertical, and vertical panoramic directions, respectively.
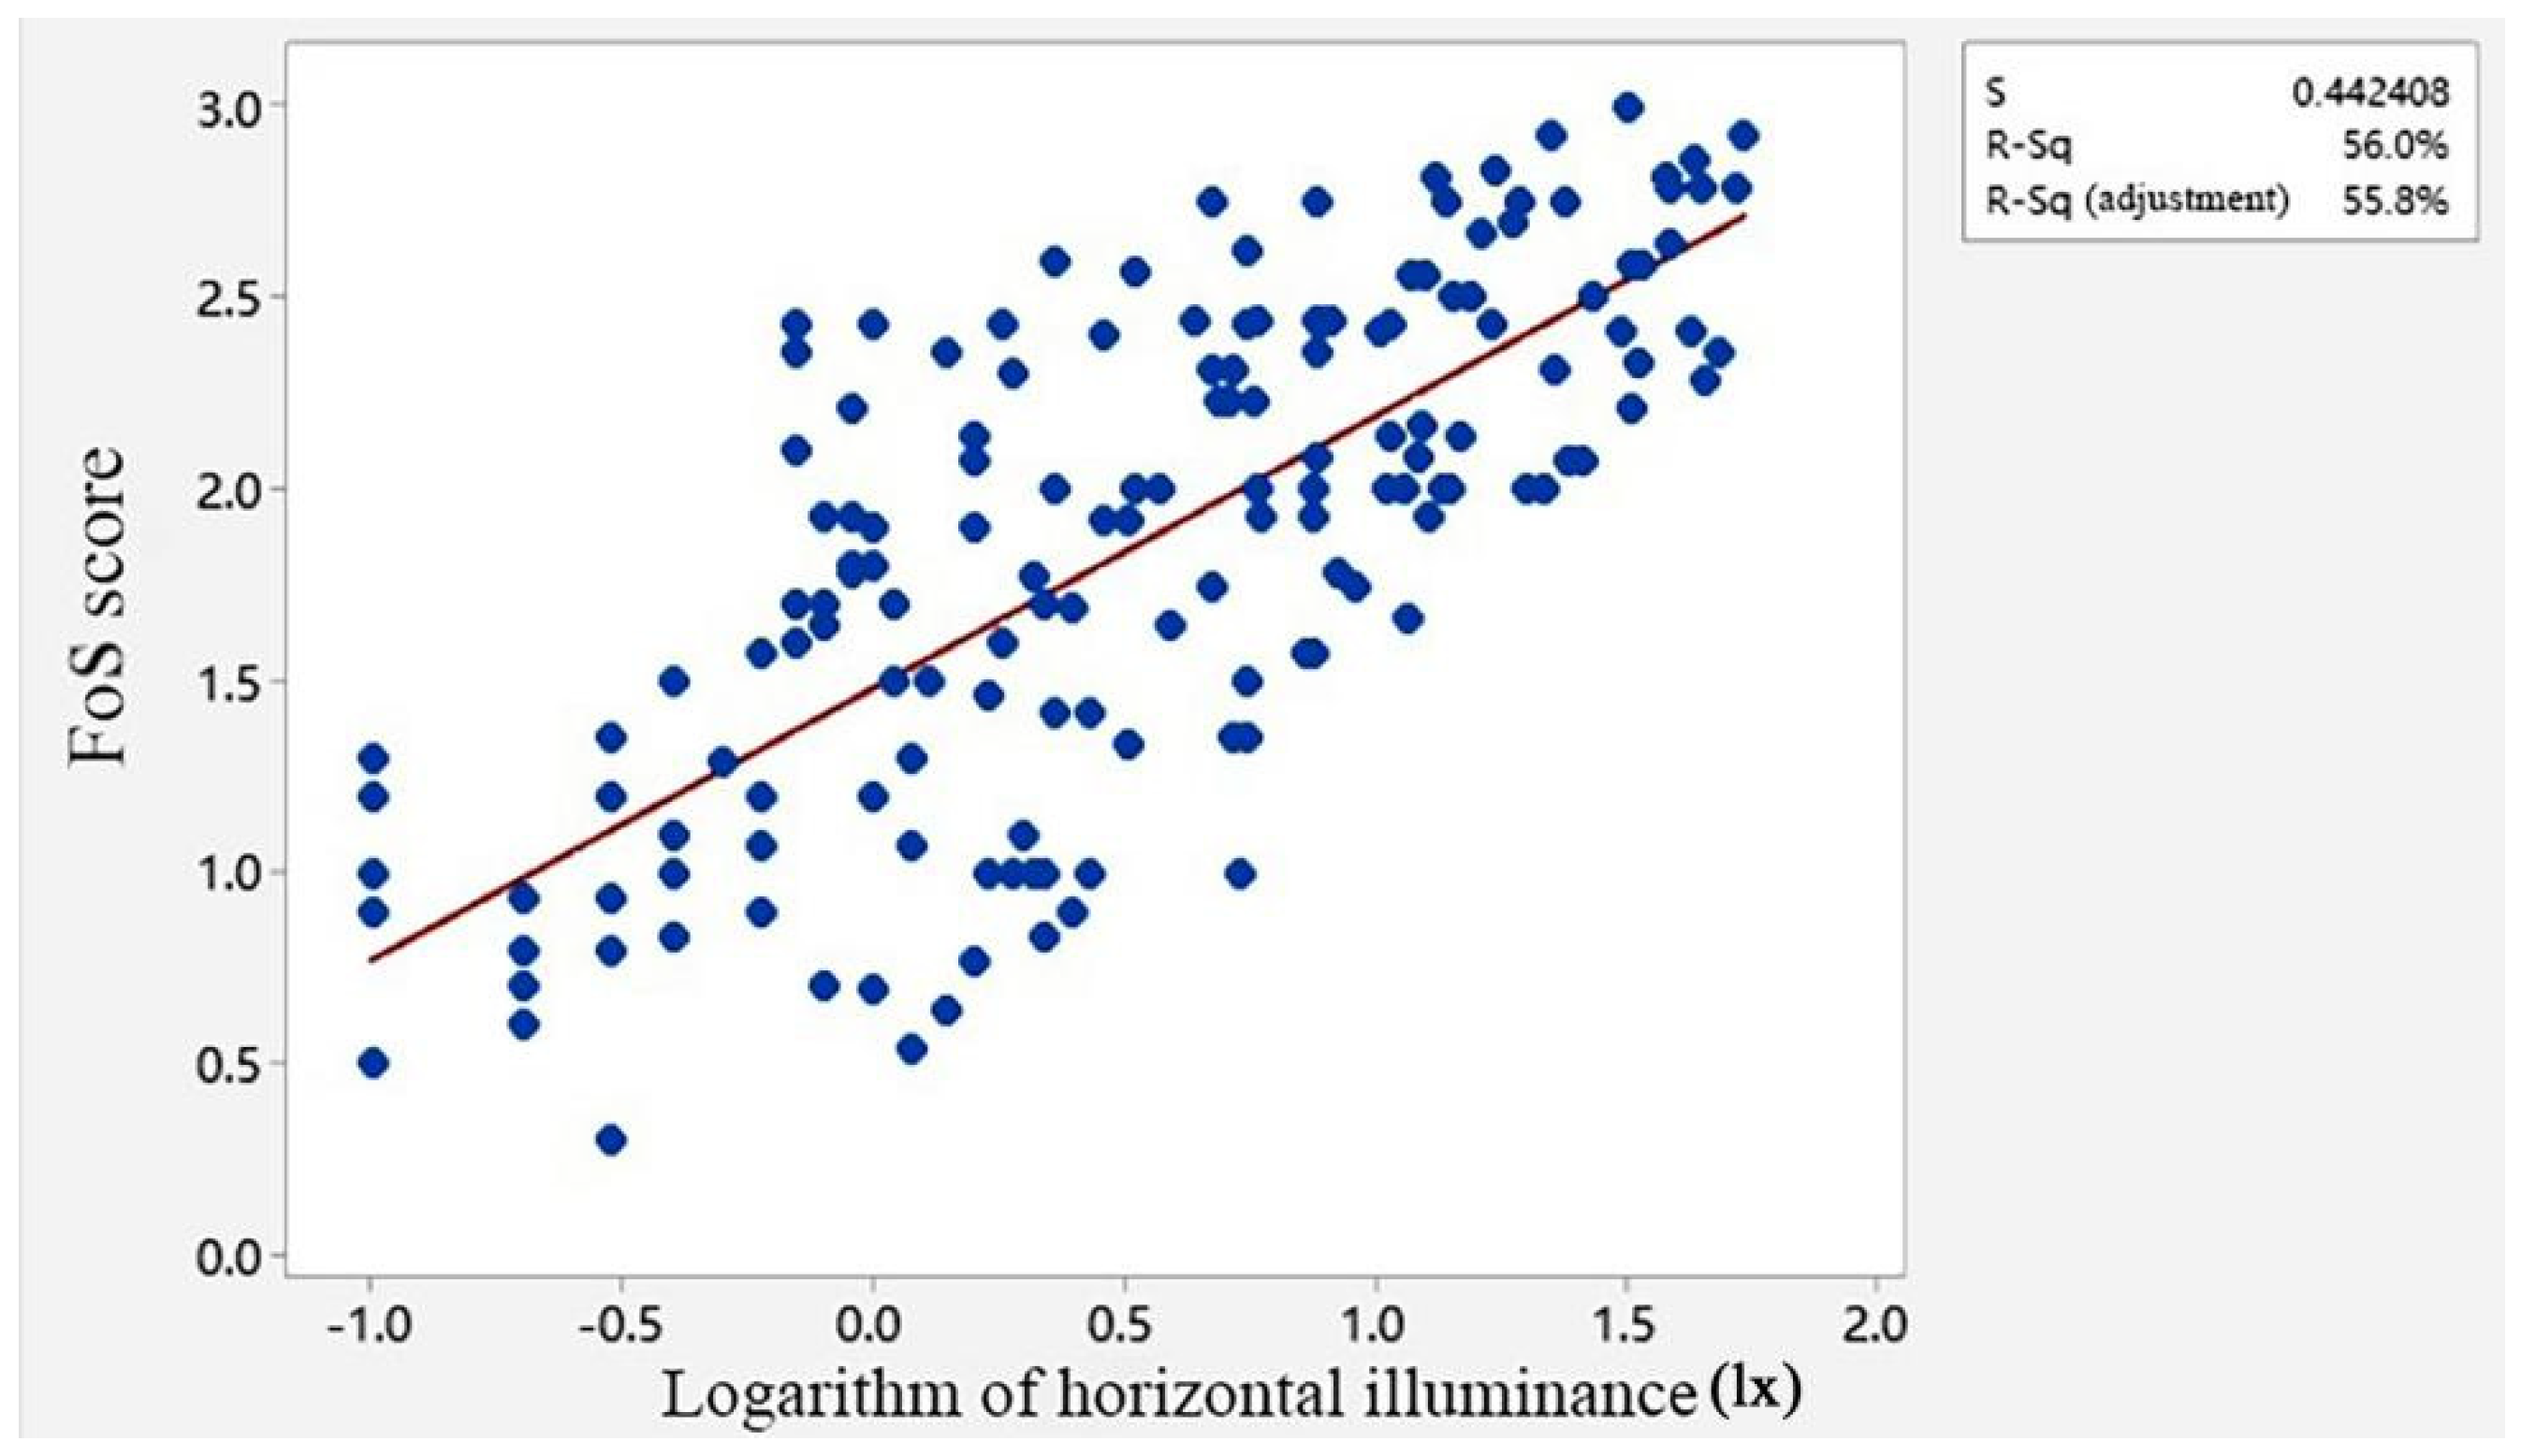
It can be seen from Table 6 that, among the three lighting measurement models based on the horizontal, vertical, and vertical panoramic directions, the model that used the horizontal measurements provided the best result (R2 = 0.362). Logarithmic transformation of the original lighting values further improved the model fit as indicated by R2 increase from 0.362 to 0.562. The improvement in this model shows that the association between FoS and illumination levels is actually nonlinear.
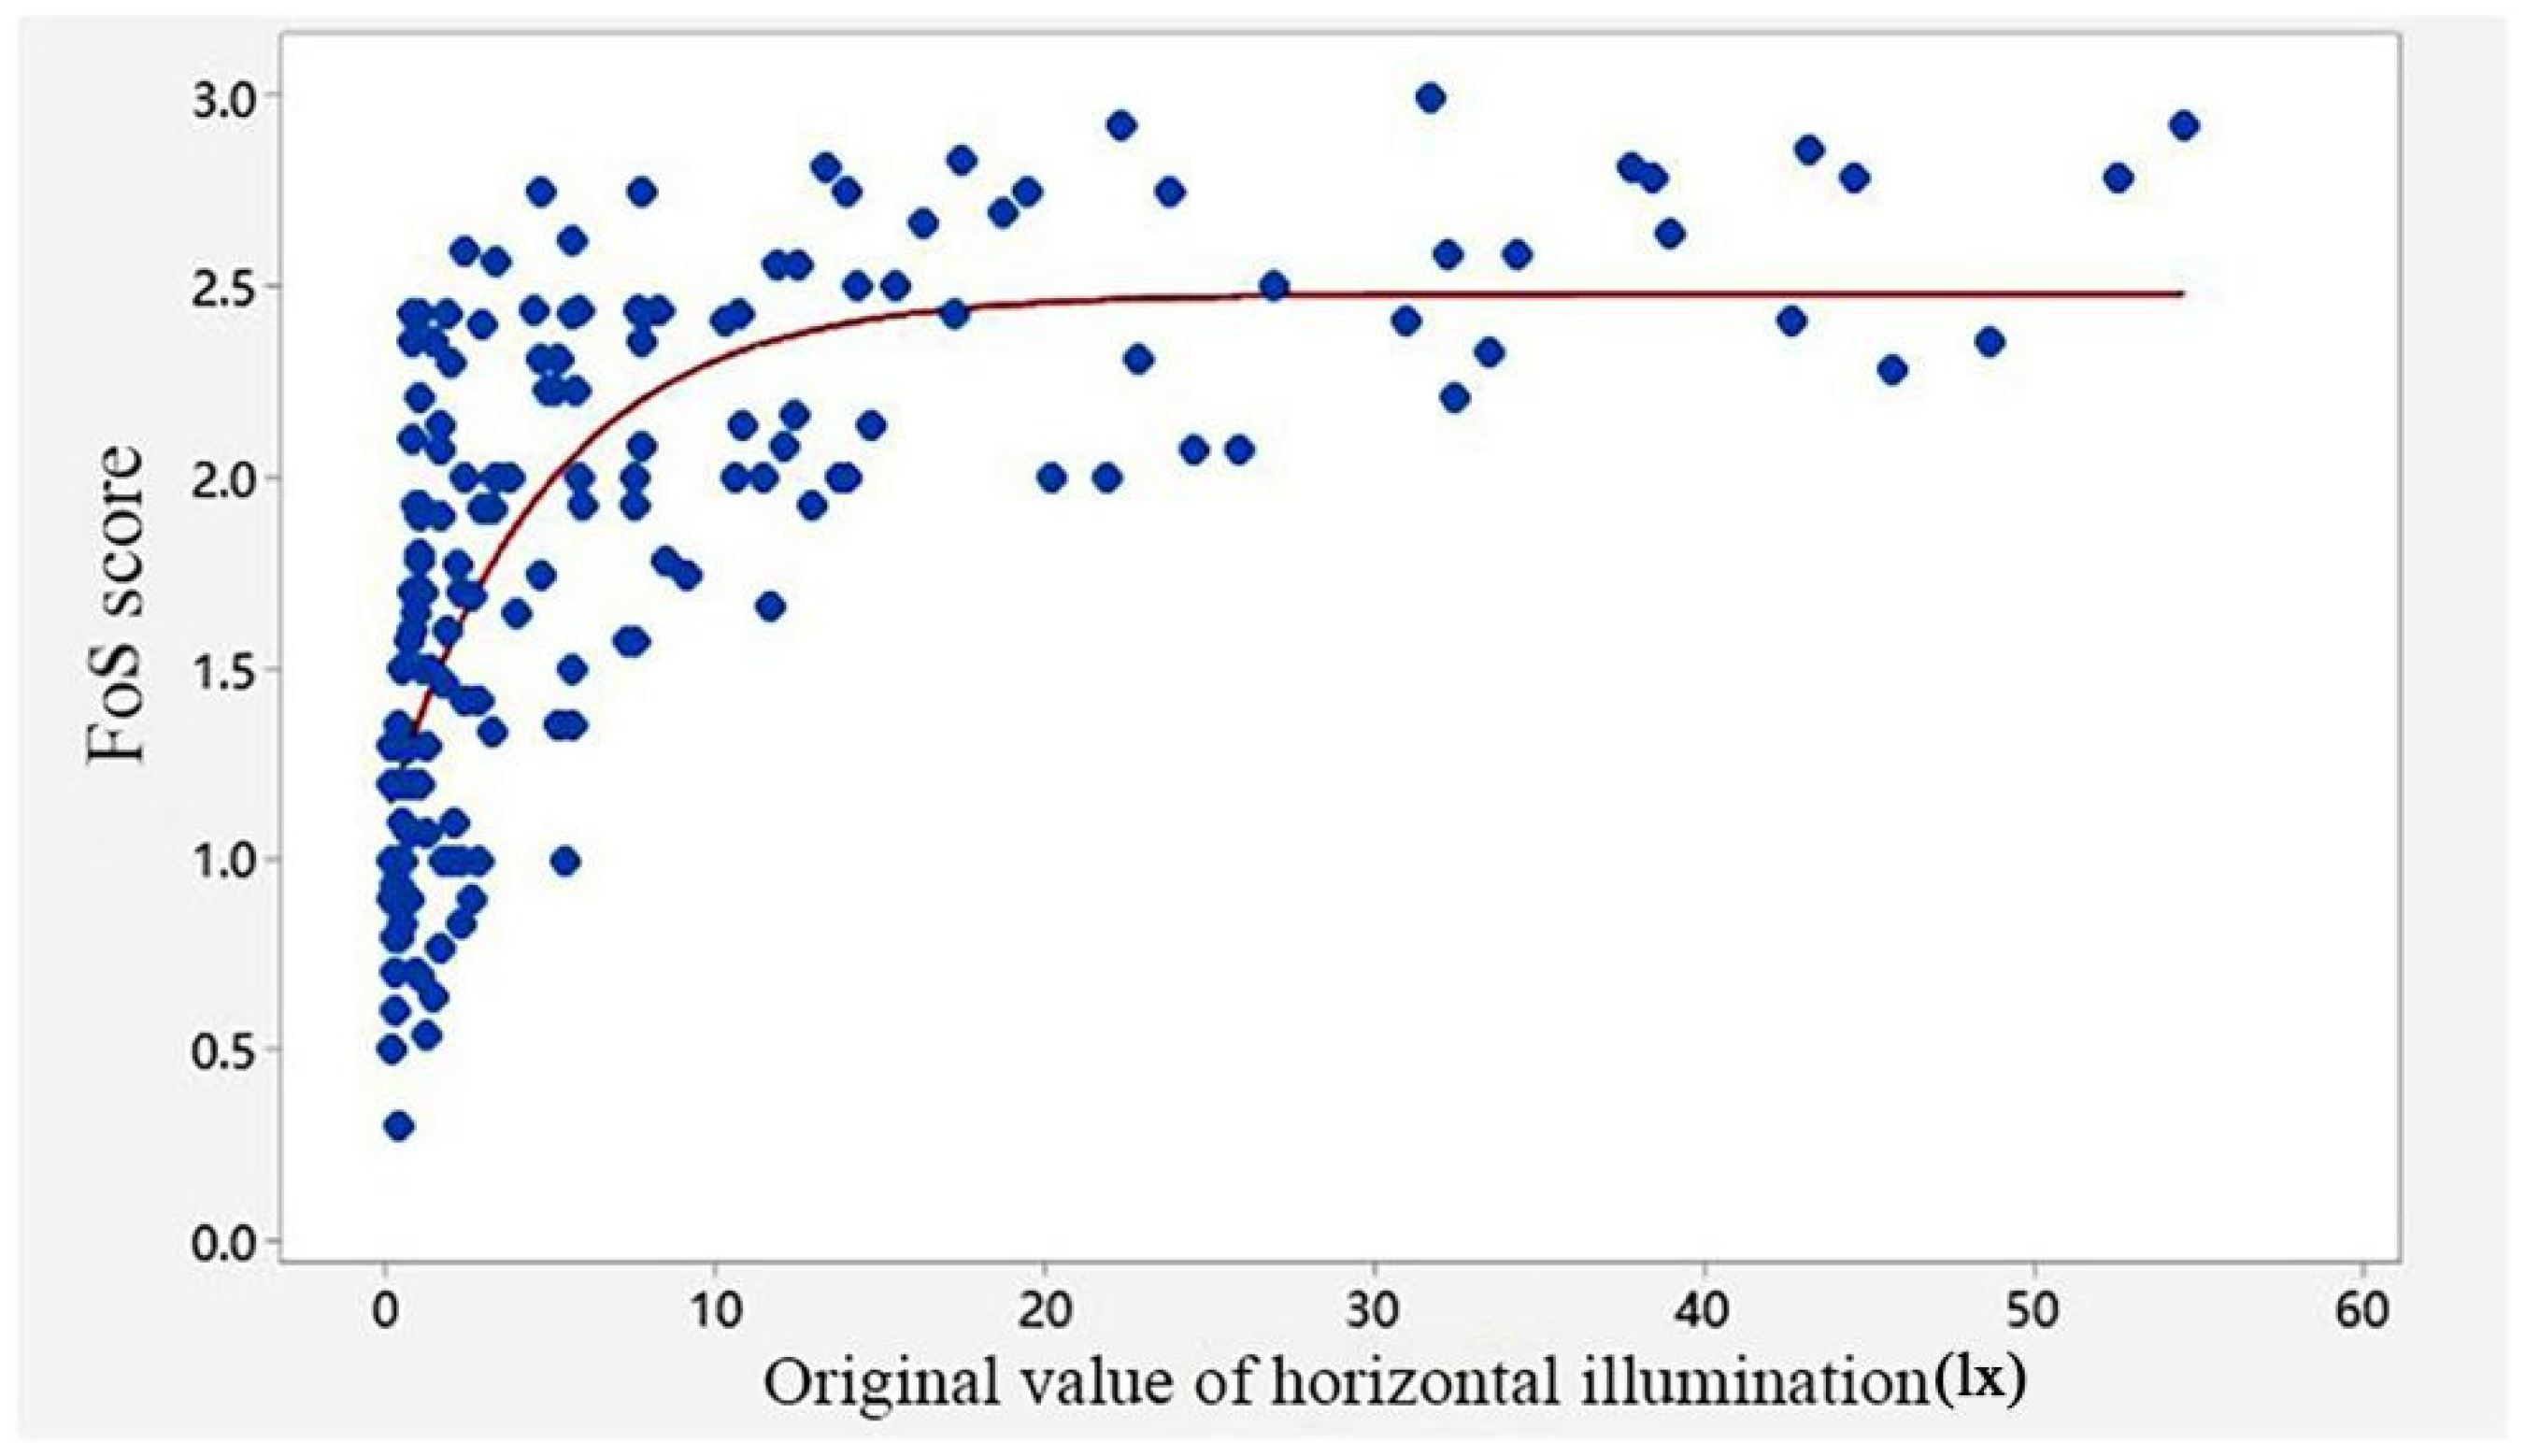
Figure 20 and Figure 21 show the relationship between FoS and the logarithm of illuminance and the original value of illuminance, respectively. It can be seen from Figure 21 that with an increase in horizontal illuminance, the overall feeling of safety also increases, but after reaching the value of 10 lx, the rate of FoS response becomes slower.
(4)
Correlations of the comprehensive effects of environmental factors and illuminance values with FoS evaluations
Illuminance values are often affected by environmental factors, especially vegetation density and traffic density [32,33,34]. Vegetation can obscure streetlights, resulting in a reduction in the lighting level and uneven distribution of illumination, while more vehicles improve the overall brightness of the residential road lighting. In addition, due to their different environmental and lighting conditions, each residential area under study can be regarded as an exogenous environmental variable. Therefore, in order to reveal the true relationship between the safety level (dependent variable) and the light level measured by the instruments, potential confounding by environmental factors (vegetation density and traffic density), needs to be accounted for using a multiple regression analysis method. The results of such analysis are shown in Table 7. Model 2 only takes the horizontal ground lighting as the explanatory variable, and Model 3 adds the vegetation density and traffic intensity. Model 4 adds the residential community into the model. The variables of residential areas are classified variables and needed to be transformed into dummy variables. By building a regression model, each dummy variable obtained an estimated regression coefficient, which makes the regression results easier to explain.
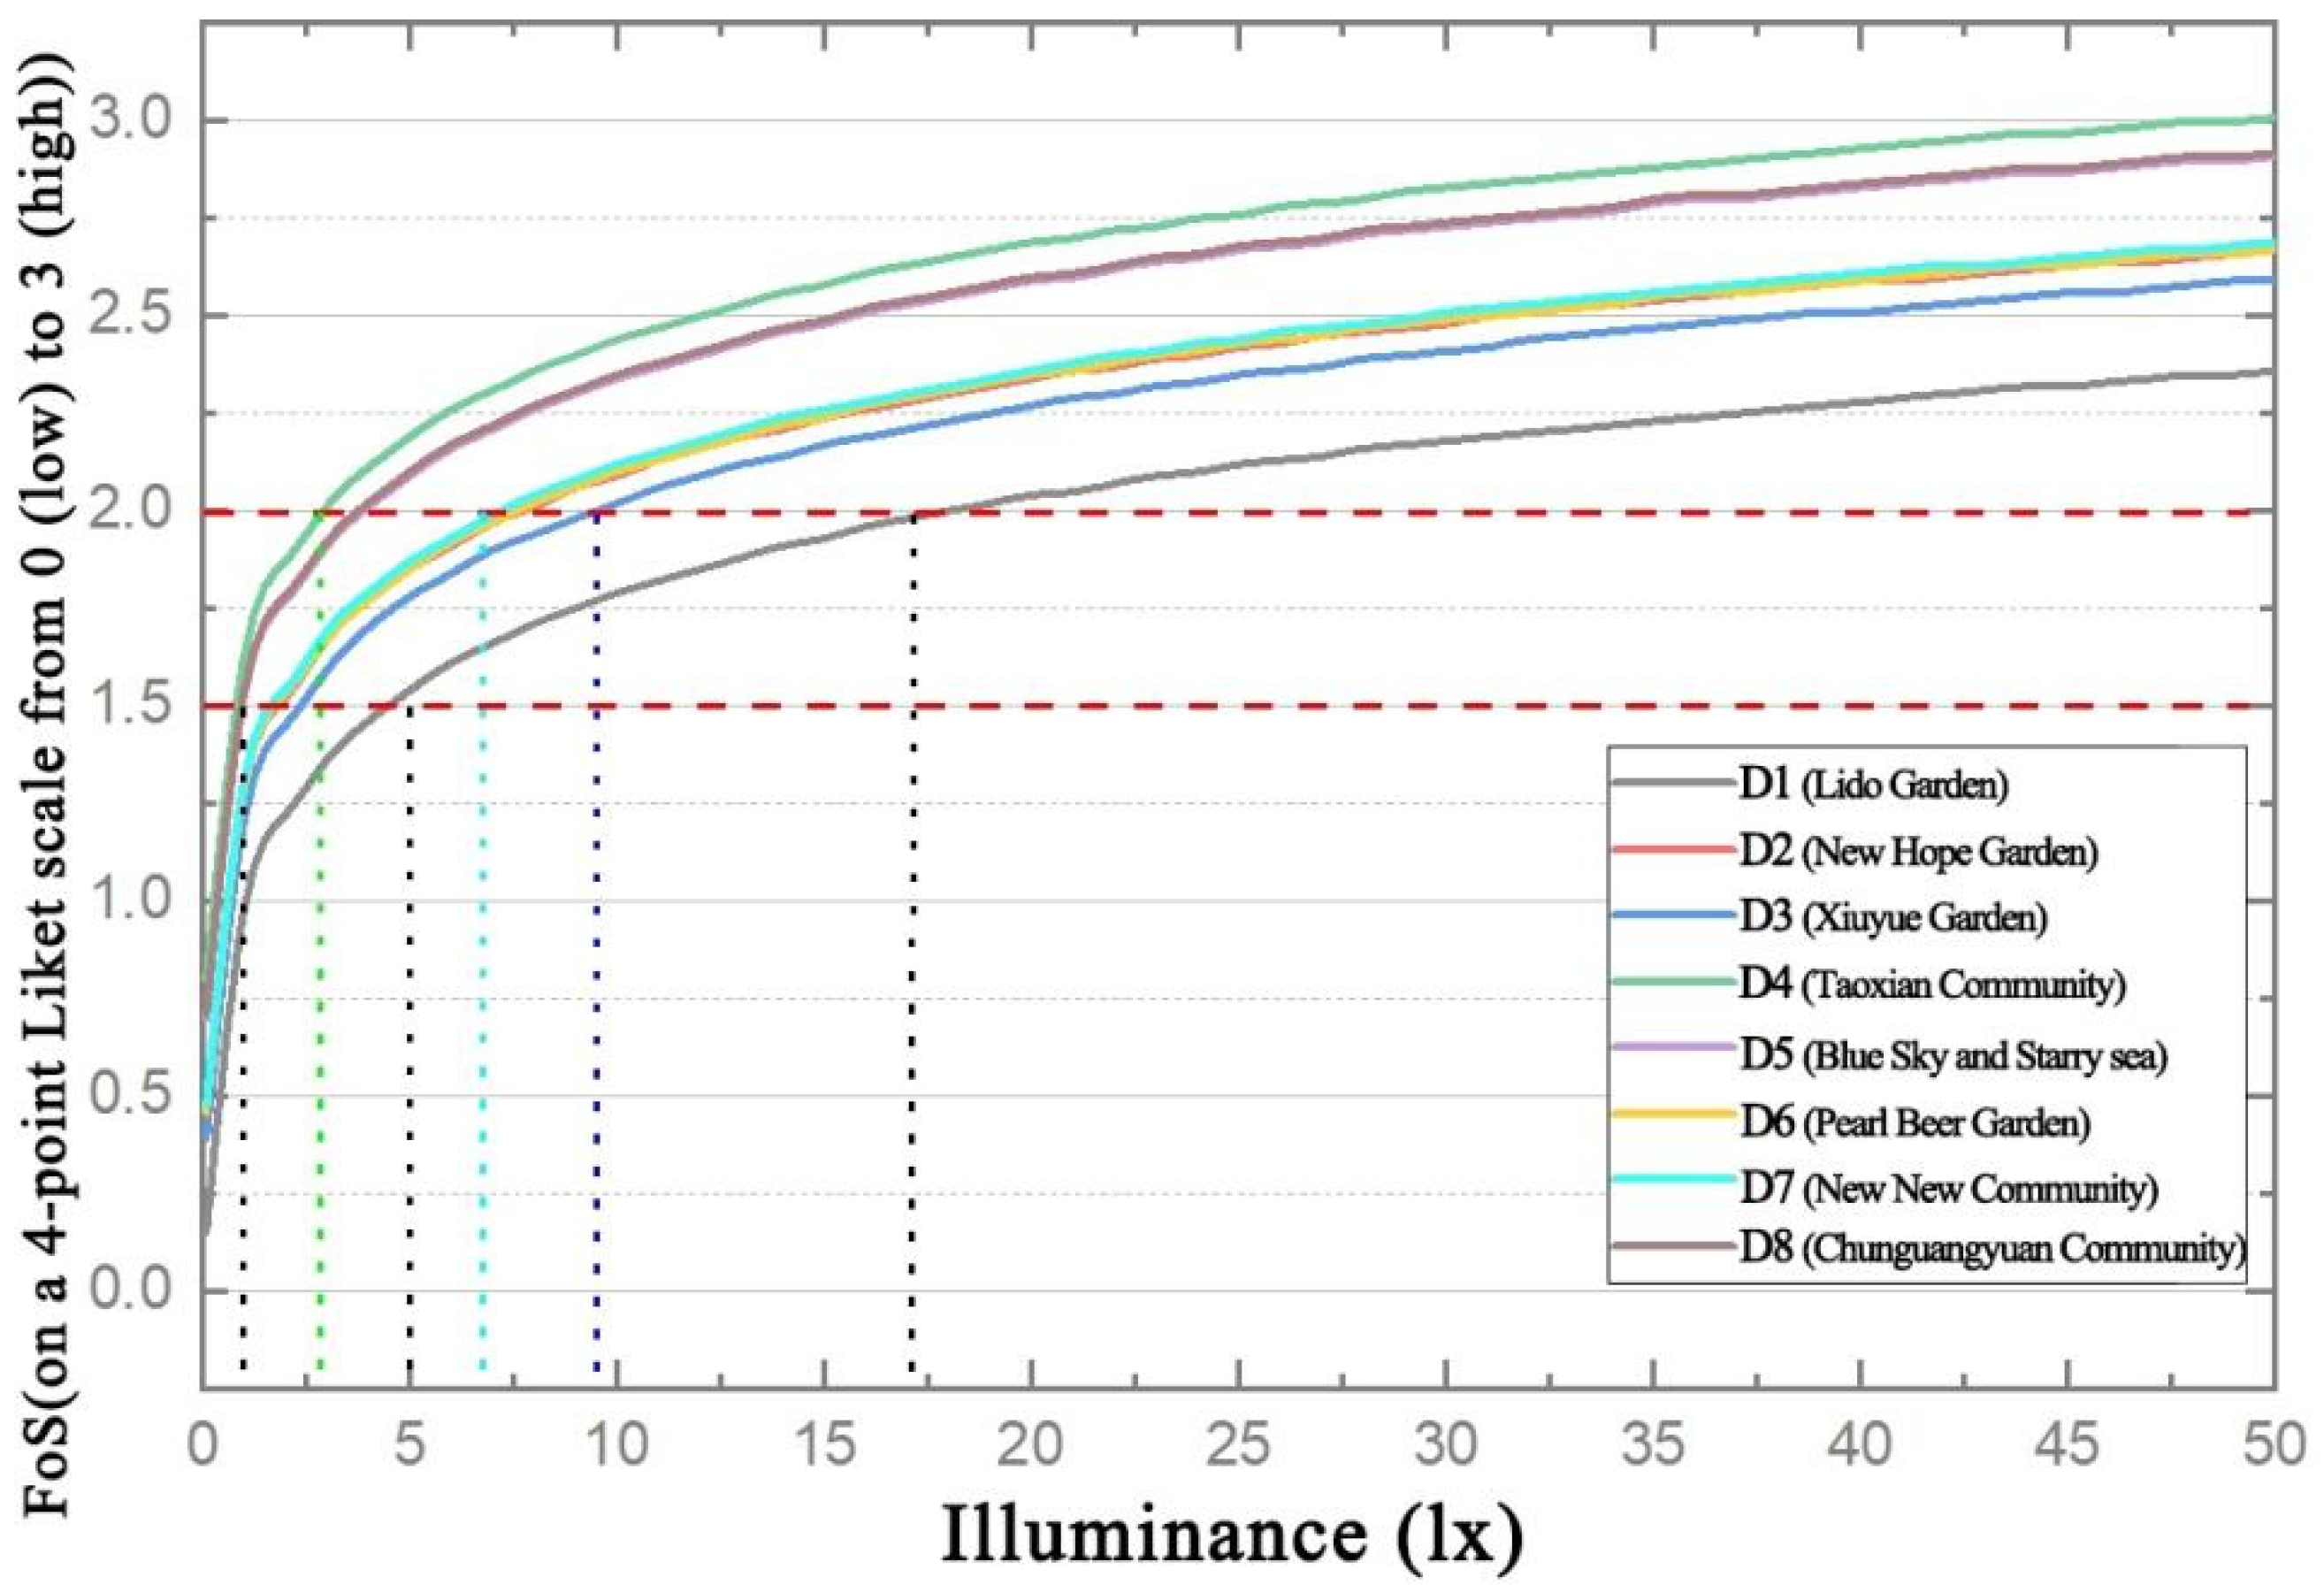
According to the regression results reported in Table 7, graphs of confounder-adjusted associations between FoS and illuminance were drawn. To generate these graphs, the values of all variables (except for illumination) were set to their average levels, and the lighting levels were allowed to vary from 0 to 50 lx (Figure 22).
The graphs show that higher illuminance levels do not necessarily mean the same increase in perceived security levels. The perceived safety score range is 0–3 and the median value is 1.5; safety is acceptable if the evaluated value is higher than 1.5 and safety is better if the evaluated value is higher than 2.0. As it is also shown in Figure 22, to achieve the safety level of 1.5, the corresponding illumination value needs to reach 1.0–5.0 lx, depending on the neighborhood. Concurrently, for the safety level to reach 2.0 (on a 3-point scale), the corresponding illuminance value needs to be in the 2.7–17 lx range. As Figure 22 further shows, after the illuminance reaches about 17 lx, the rate of change in FoS becomes slower and slower in line with a further increase in illuminance. In other words, after the illumination level of 5–17 lx, the perceived safety increases only marginally.
(5)
Correlations between illumination uniformity and FoS
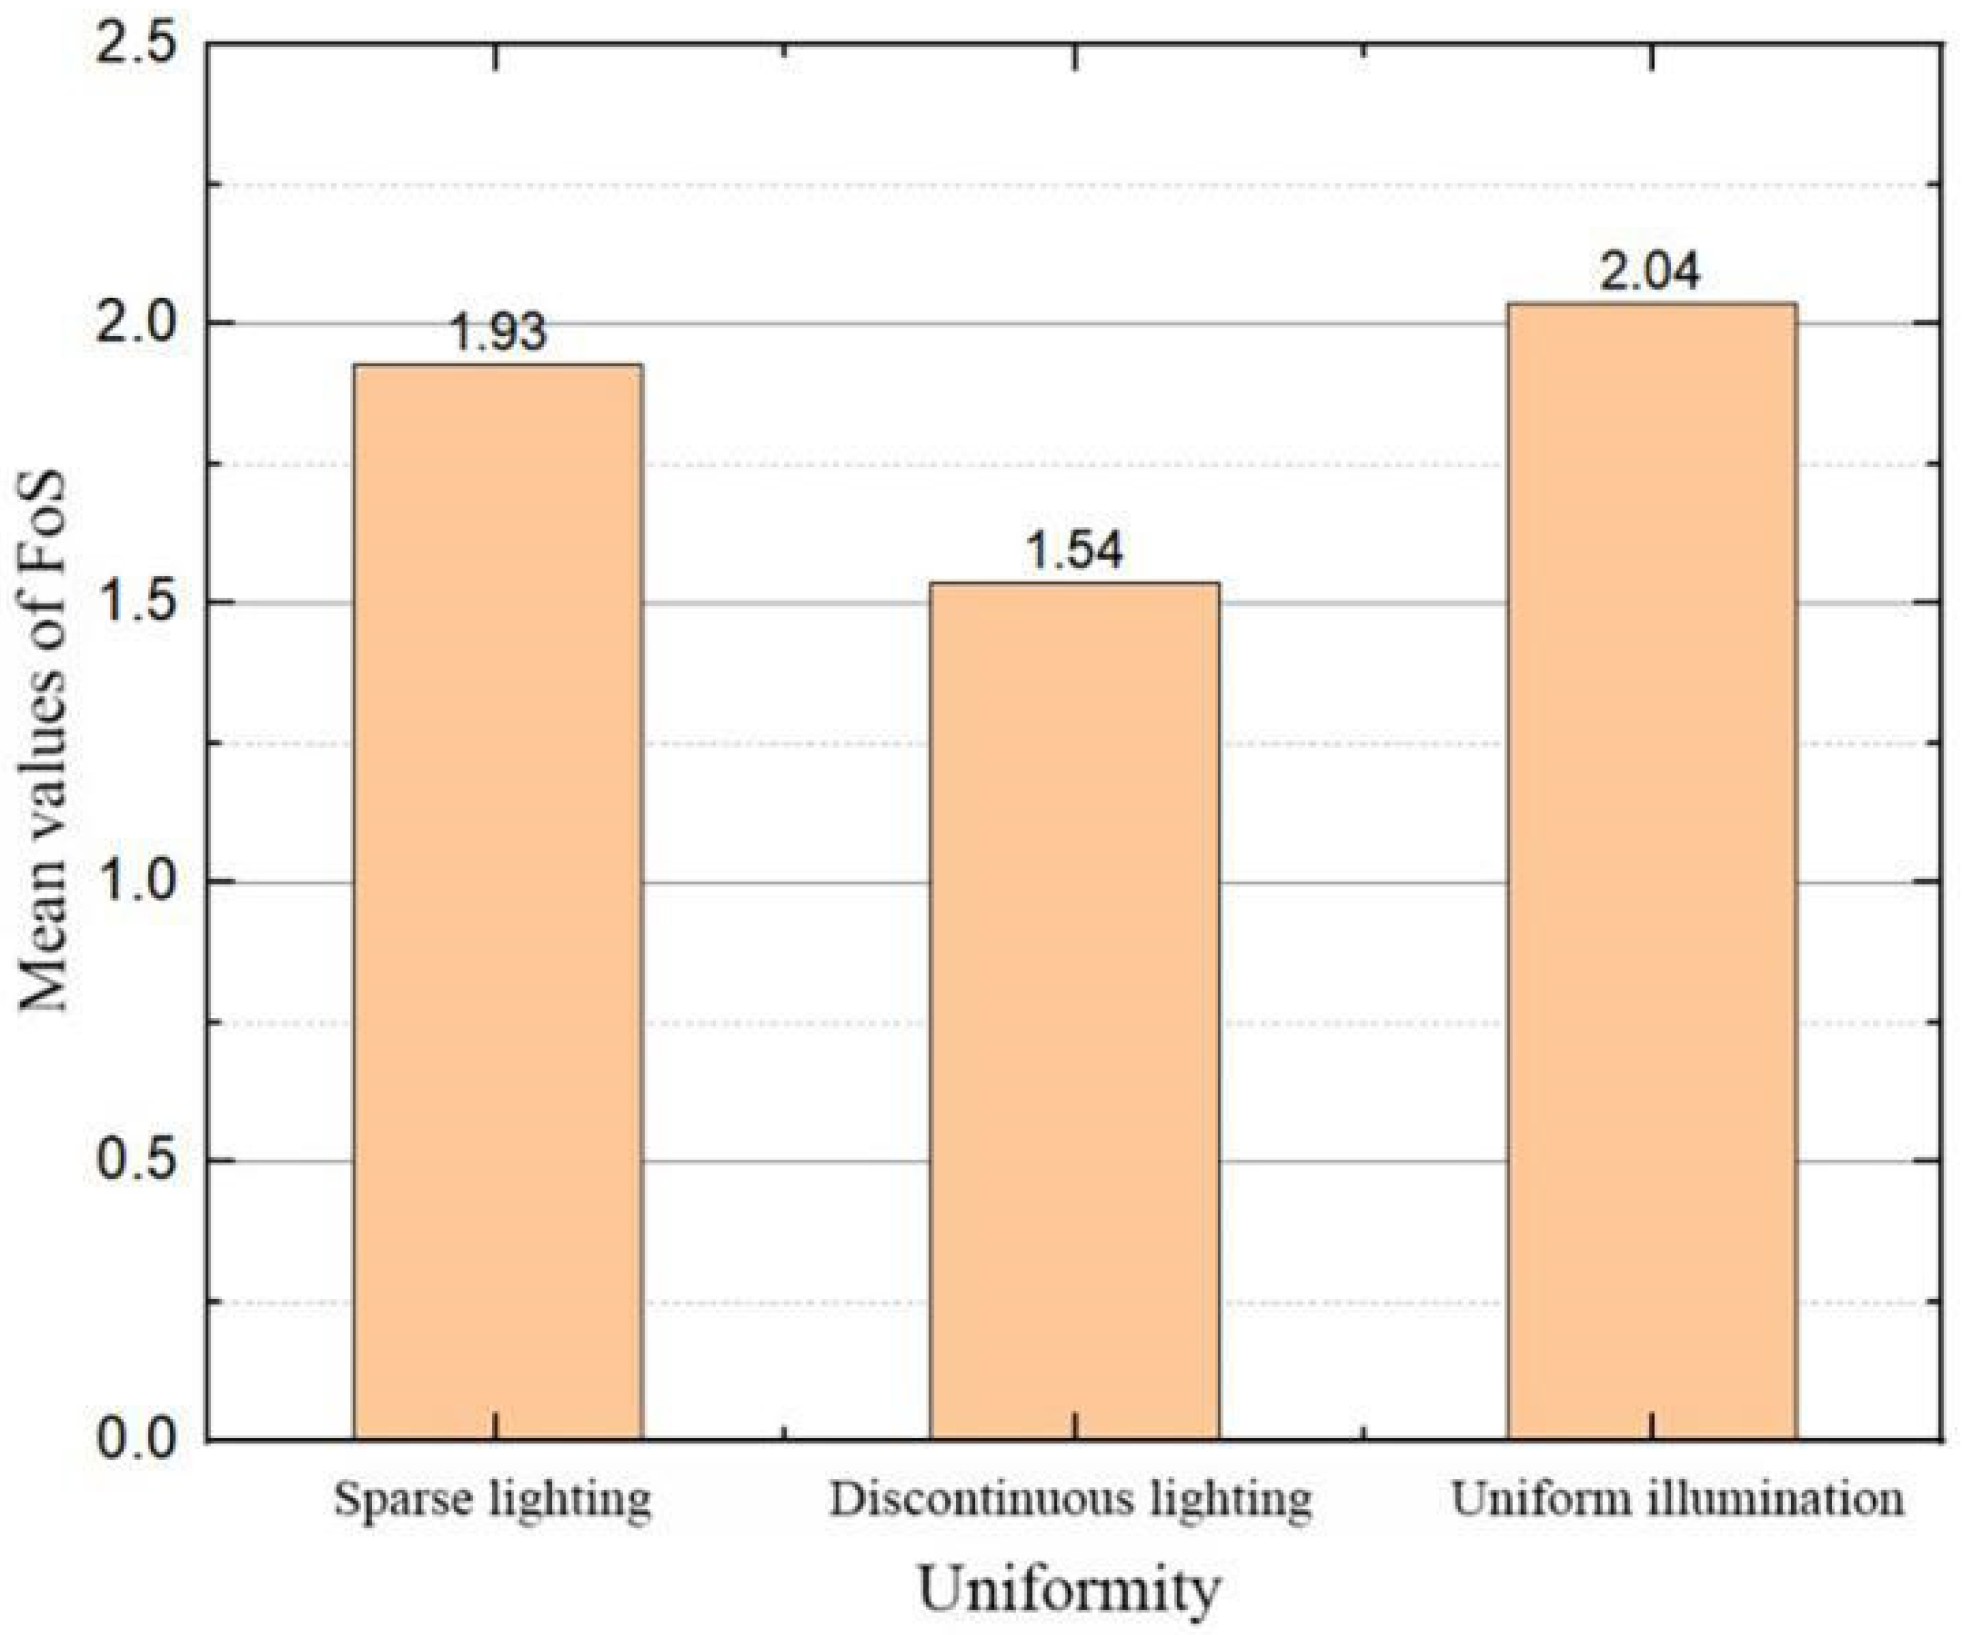
The uniformity of lighting can be divided into three levels: ununiform lighting, slightly discontinuous lighting, and uniform lighting. The uniformity values were scored and collected by the research team during the field investigation, in which ununiform lighting was given the value of 0, discontinuous lighting was given the value of 1, and uniform lighting was set to 2.
Independent sample t-test is suitable for analyzing the score difference between two independent groups on a variable. For multiple independent groups, only pairwise t-test can be carried out, but this would increase the error. One way analysis of variance (one way ANOVA) assumes that there is no difference in the mean of multiple groups, and analyzes multiple groups at the same time, which avoids the dilemma of t-test and is an extension of the t-test. One-way ANOVA was used to analyze the FoS scores. The results of the ANOVA (F = 9.091, p = 0.000 < 0.05) showed that there was homogeneity of variance among the different groups, which indicated that there were considerable differences in the FoS levels between the different uniformity groups.
Moreover, according to the post hoc analysis, there was no significant difference between sparse illumination and uniform illumination, but there were significant differences among discontinuous illumination, sparse illumination, and uniform illumination. The differences in the sense of security are shown in Figure 23. As Figure 23 shows, observers evaluate scenes with uniform illumination as more safe than scenes with discontinuous illumination.
(6)
Correlation between spectral characteristics and FoS
In the first step, Kendall’s test was used to determine whether there was a significant correlation between light color temperature and FoS. According to this test, there is a direct and significant relationship between the two variables.
In order to explore the differences in people’s perceptions of yellow light and white light, a t-test was conducted. The average perceived security of white light was 1.54 (SD = 0.707) and that of yellow light was 1.96 (SD = 0.617). The homogeneity of variance test showed that the variance of the two groups was inhomogeneous (F = 2.620, p = 0.108 > 0.05), indicating that the variance of the white light group was not equal to that of the yellow light group. After the variance adjusted test was run, the results indicated that the FoS score of white light was 1.54 ± 0.71 and yellow light’s FoS score was 1.96 0 ± 0.62 The difference (−0.42) was statistically significant (t = −3.654 (n = 158), p < 0.05). In other words, the FoS score of yellow light was significantly higher than that of white light, implying that people feel significantly safer under yellow light than under white light.
Previous studies have shown that the use of white light is more beneficial for enhancing color rendering, which can have a positive impact on crime and perceived safety. As this study was carried out in winter, the warm light may make people feel warmer, safer, and more comfortable. In future research, we could further verify whether different seasons and temperatures affect pedestrians’ safety perceptions of color temperature.

3.2. Analysis of PLQ

(1) Influence of lighting attributes on PLQ
The analysis method for PLQ is different from that of FoS [35]. In this section, the analysis of PLQ association with illumination attributes was run separately for low illumination (0–10 lx) and high illumination (>10 lx). The comfort levels of two measurement points with different illuminance levels were analyzed.
Spearman correlation analysis is a common correlation analysis method, which uses monotone equation to evaluate the correlation of two variables. Spearman correlation was used to examine the significant relationships between the PLQ and lighting attributes. It can be seen in Table 8 that when illuminance is ≤10 lx, the correlation coefficient between PLQ and illuminance is r = 0.343 (p < 0.01), indicating that there is a strong positive correlation between PLQ and illuminance. Concurrently, the correlation coefficient between PLQ and glare is r = −0.091 (p > 0.05), indicating that there is no significant correlation between perceived visual comfort and glare. The correlation coefficient between PLQ and color temperature is r = −0.095 (p > 0.05), also indicating no significant association. The correlation coefficient between PLQ and uniformity is r = 0.285 (p < 0.01), indicating that there is a significant positive association. Therefore, when illuminance is ≤10 lx, the main lighting factors affecting PLQ are illuminance and uniformity.
It can be seen from Table 8 that when illuminance is greater than 10 lx, the correlation coefficient between PLQ and illuminance is r = 0.326 (p < 0.05), indicating that there is a strong positive correlation between visual comfort and illuminance. The correlation coefficient between PLQ and glare is r = −0.294 (p > 0.05), indicating that there is a significant negative correlation between comfort and glare. The correlation coefficient between PLQ and color temperature is r = −0.178 (p < 0.01), indicating that there is a significant negative correlation between comfort and color temperature. The correlation coefficient between PLQ and uniformity is r = 0.198 (p < 0.05), indicating that there is a significant positive correlation between comfort and uniformity. Therefore, when illuminance is >10 lx, the main lighting factors affecting PLQ are illuminance, glare, color temperature, and uniformity.
(2) PLQ in low illumination levels
Spearman’s correlation test showed that the perceived brightness and uniformity of the street environment were the main determinants of PLQ is the lighting level was less than 10 lx. In this analysis, PLQ score was the dependent variable, illumination was the independent variable, and uniformity was the classification variable. Due to the positive correlation between PLQ and illuminance and uniformity, when the illumination is less than or equal to 10 lx, the PLQ score increases with an increase in illumination and the level of uniformity.
(3) PLQ in high illuminance levels
When the illumination level is lower than 10 lx, the light spectrum and illuminance of the light source have little impact on the PLQ. When the lighting level is higher than 10 lx, the spectrum and illuminance of the light source have a more important impact on the PLQ. The reason is that the sense of security is satisfied after the illuminance is improved, and the residents’ concerns will be biased towards the psychological feelings created by the color temperature and illuminance of lighting. The regression analysis between PLQ and horizontal lighting and other related factors is carried out to obtain the following regression equation:
PLQ = b0 + b1ILjib2GRi + b3CTi + εi
where ILji—Vector value of illuminance measurement (point horizontal, point vertical and vertical panorama) at point i; GRi—Glare value of point i; CTi—Color temperature of point i; and εi—Random error term.
Spearman correlation test shows that when the illumination level is lower than 10 lx, the perceived brightness and uniformity of street environment become the main determinants of PLQ. The PLQ score is the dependent variable, the illumination value is the independent variable, and the uniformity grade is the classification variable. Multiple regression analysis was performed in SPSS, and the results are shown in Table 9.
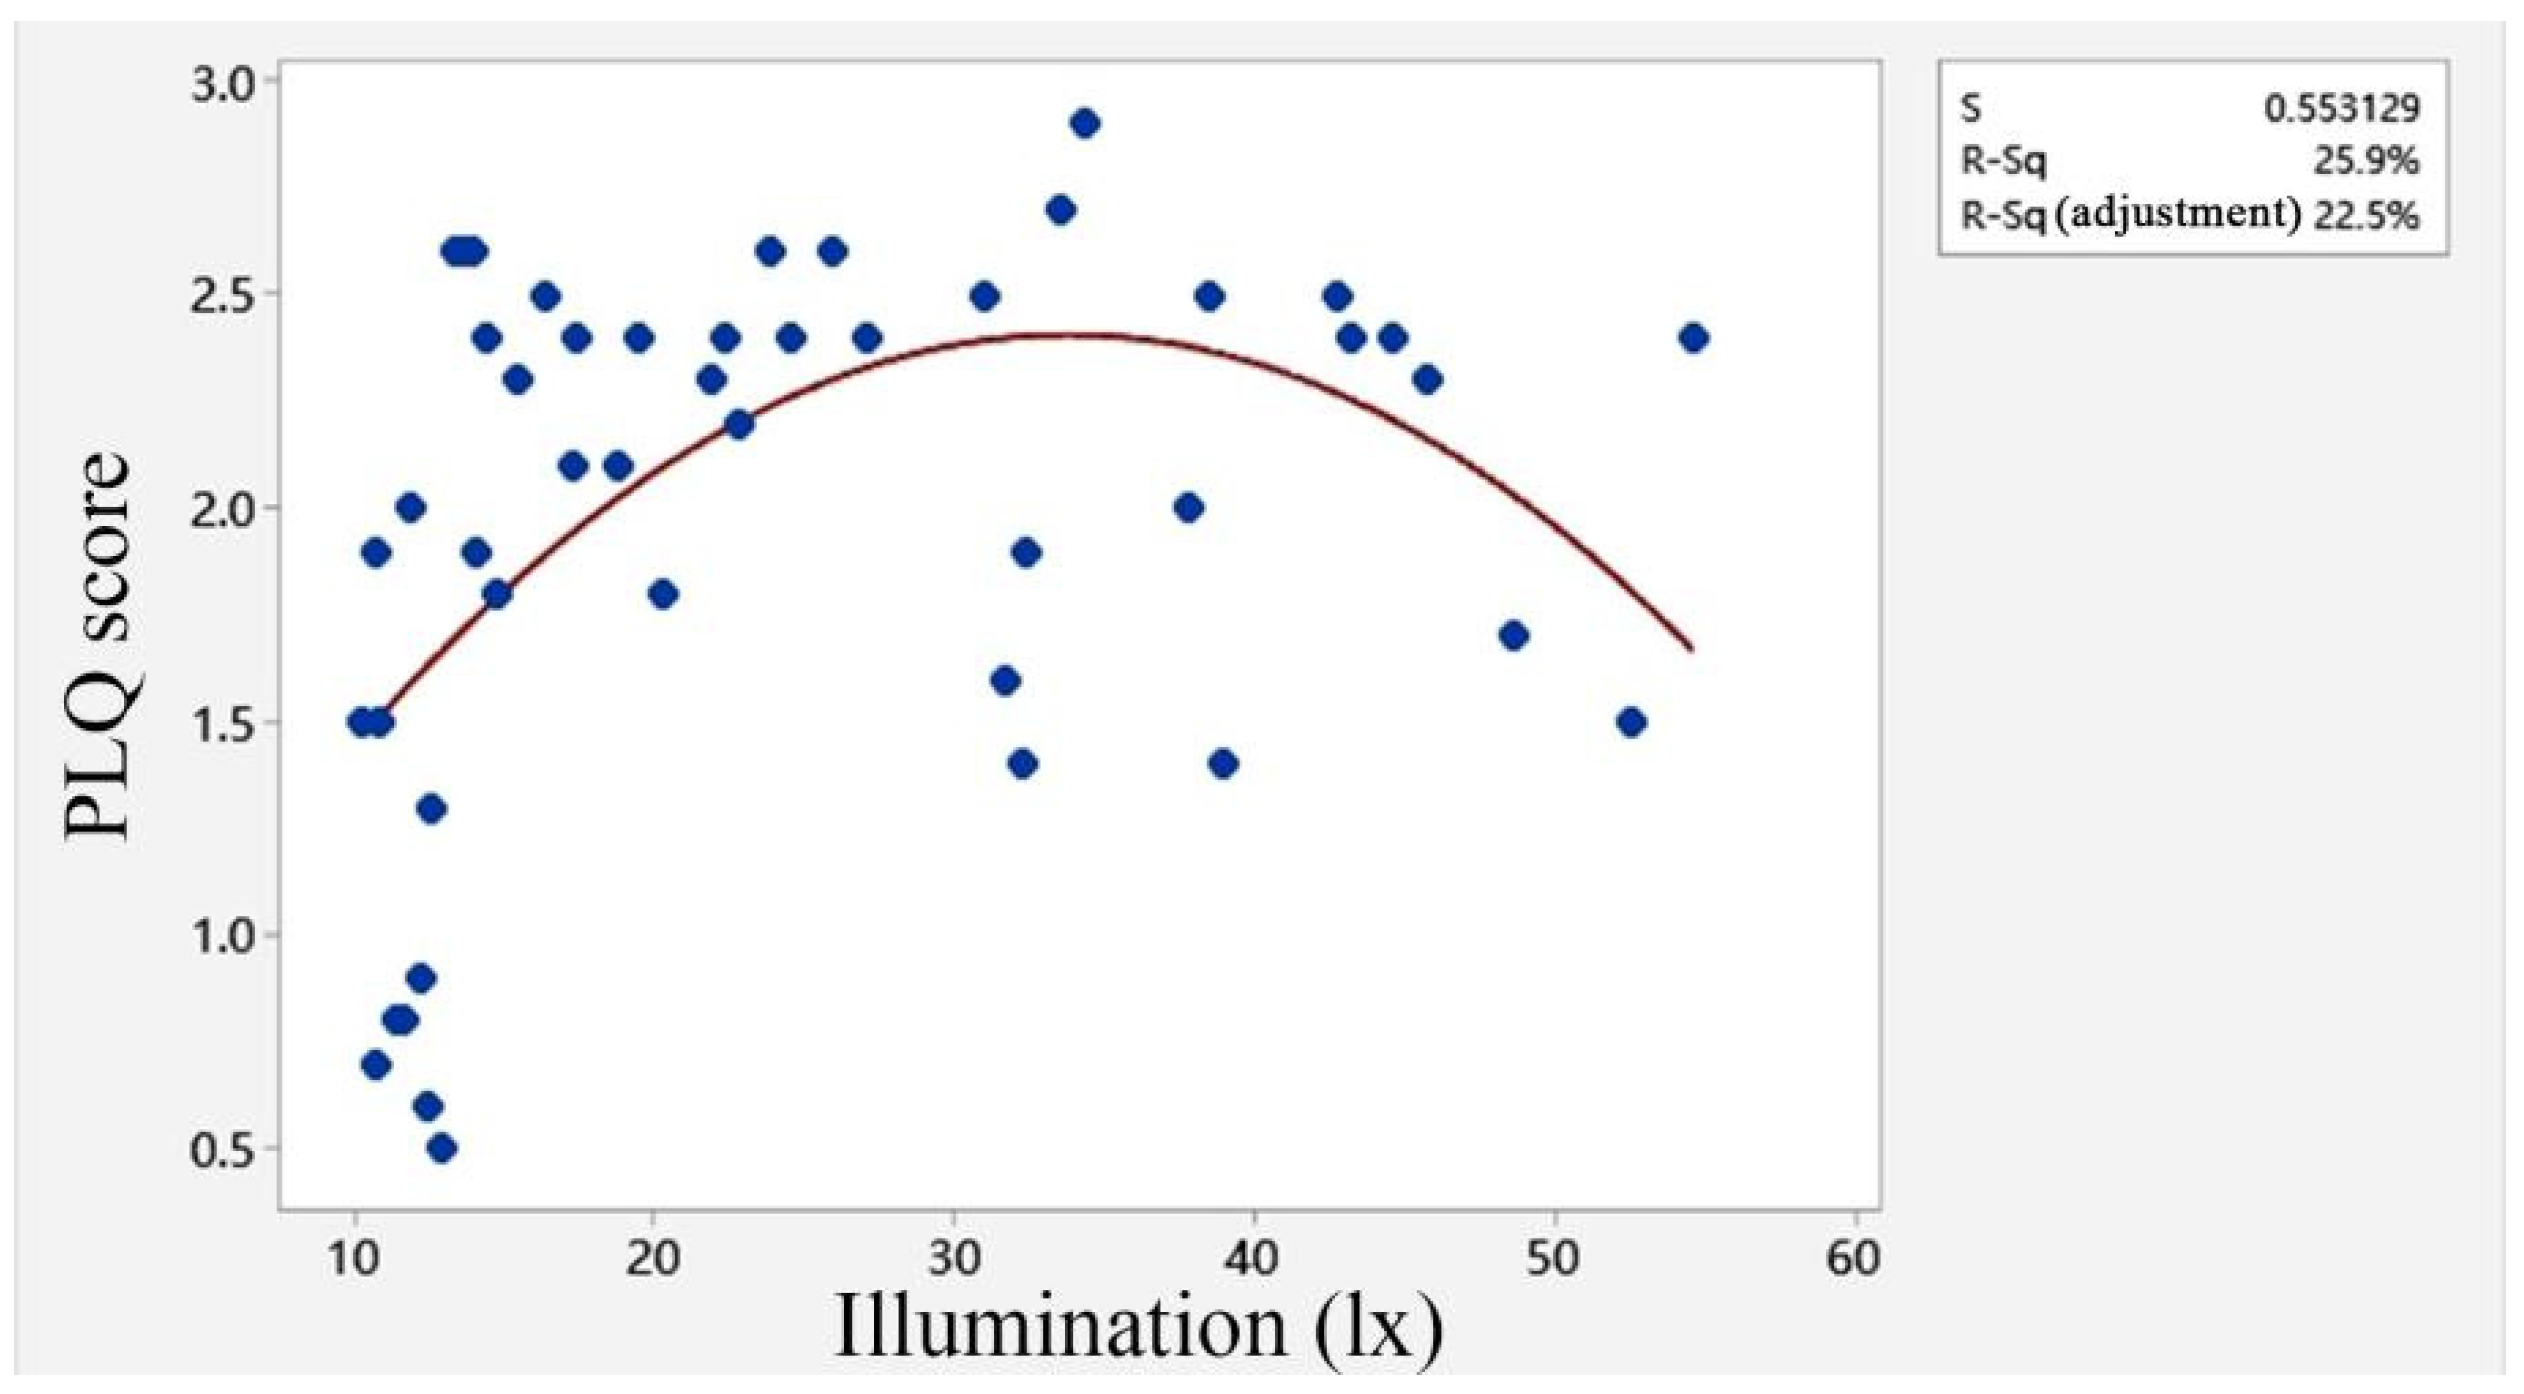
Multiple regression analysis in SPSS showed that if the illuminance value is lower than 35 lx, PLQ would increase with an increase in illuminance (Figure 24). However, when the illuminance value exceeds 35 lx, PLQ decreases, which indicates that, for visual comfort, higher illuminance does not always mean better. Excessive illuminance of streetlights may cause discomfort, glare, and even affect visual function. Satisfactory levels of PLQ were higher at illuminance levels of 25–35 lx.
As a reminder, in the analysis of the factors influencing safety perceptions, it was found that there is no significant relationship between glare and perceived safety. The research results show that intense glare would have a strong impact on perceived safety, however, slight glare can produce unpleasant feelings.
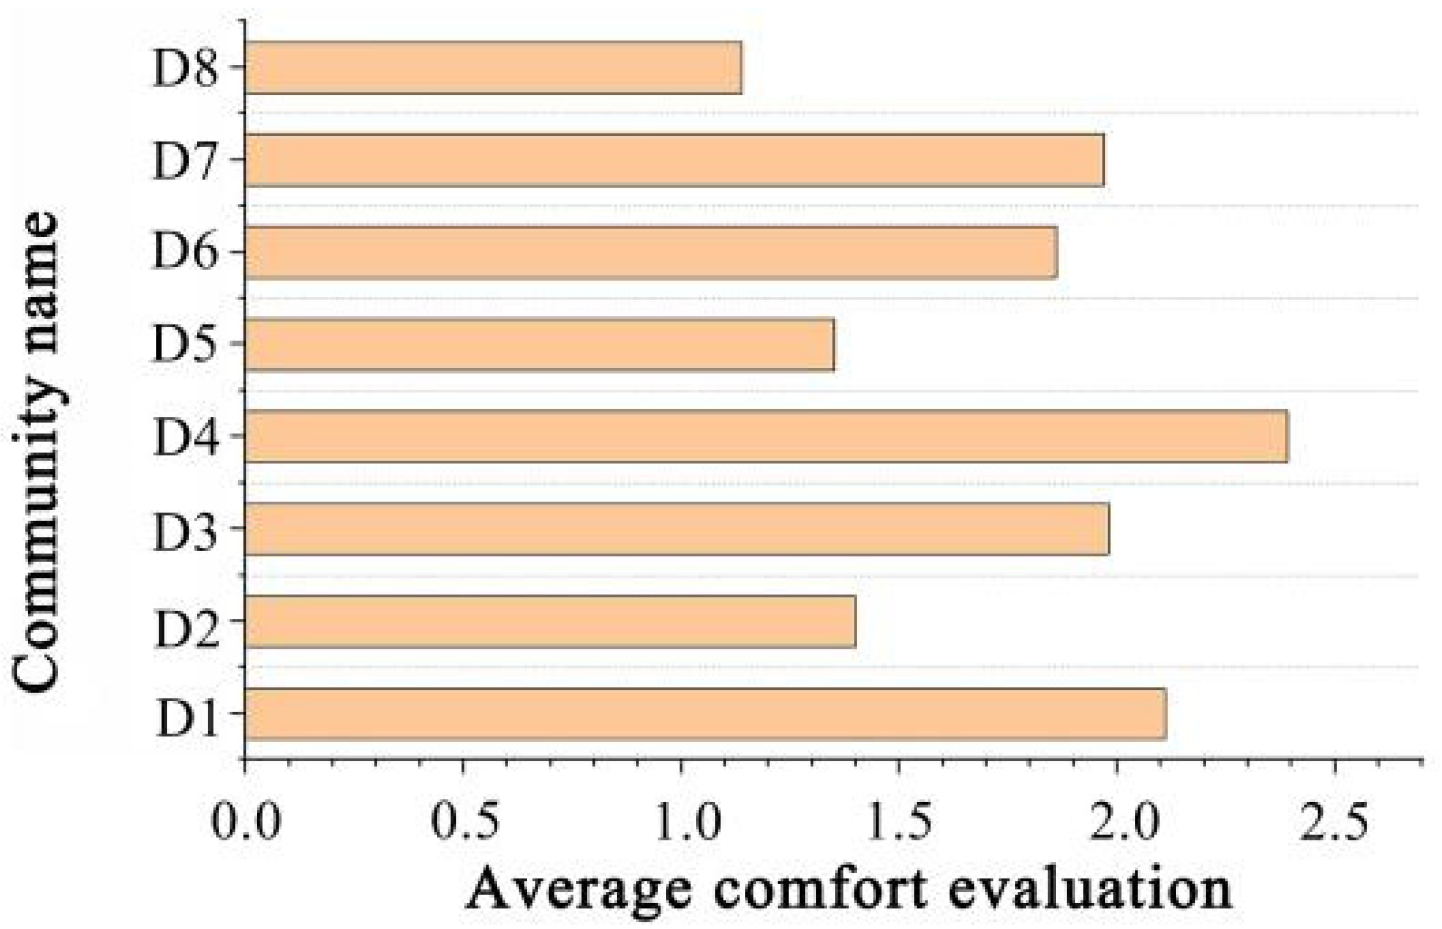
It can be seen from Figure 25 that when the color temperature is in the range of 4000–5500 K, the PLQ score is higher, indicating that people prefer cold white light, which probably because this color temperature range is closer to the natural light.

4. Discussion

Previous studies have shown that efficient and reasonably designed PSL can reduce energy waste and make people feel safer [36,37,38,39]. In this study, we analyze factors affecting FoS and PLQ in urban areas, knowledge about which helps to ensure that nighttime illumination in residential areas make people feel both comfortable and safe after natural dark. The paper combines remote sensing, and actual measurement of people’s subjective feelings obtained by ground surveys. This multi-level approach is novel and innovative in comparison to other studies.
In this study, we discuss the advantage of remote sensing in urban environmental assessment at night, and the combination of ground measurement and public perception in outdoor settings. The remote sensing data cannot directly reflect public perceptions of safety and visual comfort. Moreover, our public evaluation is performed in the outdoor real environment, which is different from the laboratory method of human perceptions [40,41]. The evaluation results are thus more viable and effective. The estimated models and results can be used by urban planners and lighting designers to quickly and accurately assess the light environment of residential areas.
Recent studies found that most studies using remote sensing and instrument ground measurement do not integrate people’s perception of outdoor lighting and feeling of safety associated herewith. In 2015, Katz used the vehicle mounted sky mass meter (SQM) to collect ground light environment data to support the correspondence between field and spatial measurements of artificial light [42]. In 2018, Hao Qingli also used the sky mass meter (SQM) to measure the square area of Dalian, and explored the data correlation between the measured data and luojia-01 luminous remote sensing data in the study of a small-scale light environment [28]. The research on the processing methods of remote sensing data are worthy of reference, but human perceptions in these studies were not considered.
In the research on road lighting, some scholars have combined the ground measurement with human perception. Thus, Peña-García et al. used a five-point Likert scale to investigate the impact of street lighting on the well-being and security perception of urban residents in Spain [36]. Portnov et al. used the subjective evaluation method of a four-point Likert scale to explore the impact of lighting parameters in Israel on people’s perception [43]. Unlike previous studies, our analysis method for PLQ is different from that of FoS. In this study, the analysis of PLQ association with illumination attributes was run separately for low illumination and high illumination. The comfort levels of two measurement points with different illuminance levels were analyzed.
Based on the previous experience, this paper puts forward the sky–ground–public synergy concept. However, some limitations of this study need to be mentioned.
First and foremost, our on-ground lighting measurements may be imperfect due to limitations of the existing measurement technology. Further research is thus needed to determine a more accurate method of measuring light, which would help to ensure the accuracy of lighting attribute parameters.
Second, the scope of the study can further be expanded in the follow-up research. As the urban environment is a complex phenomenon, it is thus necessary to conduct further research in other cities, to verify the generality of our findings. As most of the evaluators were obtained from local residents of the community, there might be an assessment bias because the psychological vigilance of local residents, who are familiar with the environment, might be relatively low in compare to outsiders. Adding questions to the survey, such as “Are you a resident of the community?”, “Are you familiar with the neighborhood?” and “Do you have regular activities in the community every day?” would help to perform a more in-depth analysis, and to investigate perceptions and attitudes of residents and non-residents separately.
Third, the follow-up research should focus on the establishing of relevant regression models for PLQ and FoS in different illumination intervals. As the City of Dalian has a hilly topography and rich vegetation. As a result, some lamps in residential areas might be blocked by vegetation or affected by the positioning of light poles on elevations different from pedestrian pathways. These factors might affect the evaluations of visual comfort. Although these areas might be relatively safe for residents, they might not be perceived as comfortable. In other words, the evaluation conditions for comfort perception need to more stringent. In particular, it might be necessary to analyze PLQ separately for low and high illumination areas. Such separate analysis might show that factors affecting PLQ might differ across differently illuminated areas.

5. Conclusions

In this research, we combine remote sensing tools, with ground measurements and subjective evaluations. The results of the study show that higher illumination levels do not necessarily mean the same increase in perceived safety levels. In particular, under the illumination level of 5–17 lx, the perceived safety is already at a high level, and a further increase in illumination beyond this threshold leads only to a slight increase in perceived safety. It was also found that areas with sparse illumination and uniform illumination are perceived to be safer than areas with discontinuous illumination and vegetation obscuring lights. Through an analysis of the spectral characteristics, it is also found that yellow lights make people feel more secure than white lights. A possible reason for this is that the investigation was carried out in winter when the temperature is low. Therefore, warm light may make people feel warmer, safer, and more comfortable. Compared with illumination, the color rendering of the light source is found to have less influence on the ability to detect and identify approaching people; in the case that both cannot be considered at the same time, the results suggest using higher illumination rather than better color rendering.
The perceived visual comfort of nighttime lighting was also analyzed. It was found that when the illumination was lower than 10 lx, there was a strong positive correlation between comfort and both illumination and uniformity, but there was no significant correlation with glare and color temperature. When the illumination level was higher than 10 lx, color temperature, illumination, uniformity, and discomfort glare of the light source had significant influence on the perceived comfort. When the lighting color temperature was 4000–5500 K, public comfort was better, and the level of comfort tended to improve until the illumination value reached 35 lx. After reaching this threshold 35 lx, the level of visual comfort started to decline.
As many factors are mixed in the perceived environment, the increase in samples will also be conducive to the evaluation of multiple scenes. In future research, more studies need to be carried out outdoors and under controlled conditions to verify these findings. It is hoped that through continuously expanding the database, it can be used to evaluate the use and energy saving of lamps in the future.

Author Contributions

Conceptualization, M.L., B.A.P. and Y.L. (Yue Liu); methodology, M.L., B.A.P. and T.T.; software, B.Z. and Y.L. (Yue Liu); validation, T.L. and Y.L. (Yue Liu); formal analysis, Y.L. (Yue Liu); investigation, T.L., Y.L. (Yiwei Li) and Y.L. (Yue Liu); resources, Q.L.; data curation, Q.L.; writing—original draft preparation, M.L. and Y.L. (Yue Liu); writing—review and editing, M.L., B.A.P., W.J., Y.L. (Yue Liu) and T.T.; visualization, M.L. and Y.L. (Yue Liu); supervision, M.L. and H.L.; and funding acquisition, M.L. All authors have read and agreed to the published version of the manuscript.

Funding

This research was funded by National Key Research and Development Program of China, grant number 2017YFE0125900 and The National Natural Science Foundation of China, grant number 52178067.

Acknowledgments

The authors would like to thank editors and the anonymous reviewers for their valuable and constructive comments to improve our manuscript. The ISS nighttime light images were downloaded from the website: https://eol.jsc.nasa.gov (accessed on 1 May 2020).

Conflicts of Interest

The authors declare no conflict of interest.

References

  1. Elvidge, C.D.; Erwin, E.H.; Baugh, K.E.; Ziskin, D.; Tuttle, B.T.; Ghosh, T.; Sutton, P.C. Overview of DMSP nightime lights and future possibilities. In Proceedings of the 2009 Urban Remote Sensing Event, Shanghai, China, 20–22 May 2009. [Google Scholar]
  2. Han, P.; Huang, J.; Li, R.; Wang, L.; Hu, Y.; Wang, J.; Huang, W. Monitoring Trends in Light Pollution in China Based on Nighttime Satellite Imagery. Remote Sens. 2014, 6, 5541–5558. [Google Scholar] [CrossRef] [Green Version]
  3. Duriscoe, D.M.; Luginbuhl, C.B.; Moore, C.A. Measuring night-sky brightness with a wide-field CCD camera. Publ. Astron. Soc. Pac. 2007, 119, 192–213. [Google Scholar] [CrossRef]
  4. Wu, S. Lighting Environment and Perceived Safety. Master’s Thesis, Virginia Polytechnic Institute and State University, Blacksburg, WV, USA, 2014. [Google Scholar]
  5. Johansson, M.; Rosen, M.; Kuller, R. Individual factors influencing the assessment of the outdoor lighting of an urban footpath. Lighting Res. Technol. 2011, 42, 31–43. [Google Scholar] [CrossRef]
  6. Li, Y.; Chen, A.; Zhou, Y.; Zou, N.; He, X.; Wang, J. Research on the assessment indicators for crime prevention lighting in residential areas based on AHP and Entropy Weight. MATEC Web Conf. 2016, 61, 4009. [Google Scholar] [CrossRef] [Green Version]
  7. Osch, V. Intelligent Dynamic Road Lighting and Perceived Personal Safety of Pedestrians. Master’s Thesis, University of Technology, Eindhoven, The Netherlands, 2010. [Google Scholar]
  8. Painter, K. The influence of street lighting improvements on crime, fear and pedestrian street use, after dark. Landsc. Urban Plan. 1996, 35, 193–201. [Google Scholar] [CrossRef]
  9. Herbert, D.; Davidson, N. Modifying the built environment: The impact of improved street lighting. Geoforum 1994, 25, 339–350. [Google Scholar] [CrossRef]
  10. Blobaum, A. Perceived Danger in Urban Public Space: The Impacts of Physical Features and Personal Factors. Environ. Behav. 2005, 37, 465–486. [Google Scholar] [CrossRef]
  11. Portnov, B.A.; Saad, R.; Trop, T.; Kliger, D.; Svechkina, A. Linking nighttime outdoor lighting attributes to pedestrians’ feeling of safety: An interactive survey approach. PLoS ONE 2020, 15, e0242172. [Google Scholar] [CrossRef]
  12. Saad, R.; Portnov, B.A.; Trop, T. Saving energy while maintaining the feeling of safety associated with urban street lighting. Clean Technol. Environ. Policy 2020, 23, 251–269. [Google Scholar] [CrossRef]
  13. Svechkina, A.; Trop, T.; Portnov, B.A. How much lighting is required to feel safe when walking through the streets at night? Sustainability 2020, 12, 3133. [Google Scholar] [CrossRef] [Green Version]
  14. Johansson, M.; Pedersen, E.; Maleetipwan-Mattsson, P.; Kuhn, L.; Laike, T. Perceived outdoor lighting quality (POLQ): A lighting assessment tool. J. Environ. Psychol. 2014, 39, 14–21. [Google Scholar] [CrossRef]
  15. Fotios, S.; Cheal, C. Road lighting for pedestrians in residential areas: Choosing the optimum lamp colour characteristics. Light Eng. 2010, 18, 91–100. [Google Scholar]
  16. Villa, C.; Bremond, R.; Saint-Jacques, E. Assessment of pedestrian discomfort glare from urban LED lighting. Lighting Res. Technol. 2017, 49, 147–172. [Google Scholar] [CrossRef]
  17. Bullough, J.D.; Brons, J.A.; Qi, R.; Rea, M.S. Predicting discomfort glare from outdoor lighting installations. Lighting Res. Technol. 2008, 40, 225–242. [Google Scholar] [CrossRef]
  18. Lin, Y.; Fotios, S.; Wei, M.; Liu, Y.; Guo, W.; Sun, Y. Eye movement and pupil size constriction under discomfort glare. Investig. Ophthalmol. Vis. Sci. 2015, 56, 1649–1656. [Google Scholar] [CrossRef] [Green Version]
  19. Hölker, F.; Moss, T.; Griefahn, B.; Kloas, W.; Voigt, C.C.; Henckel, D.; Hänel, A.; Kappeler, P.M.; Völker, S.; Schwope, A.; et al. The Dark Side of Light: A Transdisciplinary Research Agenda for Light Pollution Policy. Ecol. Soc. 2010, 15, 13. [Google Scholar] [CrossRef]
  20. He, B. Generation, influence and treatment of light pollution. China Illum. Eng. J. 2013, 24 (Suppl. S1), 66–71. [Google Scholar]
  21. International Space Station’s (ISS) Database. Available online: https://www.nasa.gov/multimedia/imagegallery/index.html (accessed on 1 May 2020).
  22. Peña-García, A.; Sędziwy, A. Optimizing Lighting of Rural Roads and Protected Areas with White Light: A Compromise among Light Pollution, Energy Savings, and Visibility. LEUKOS 2020, 16, 147–156. [Google Scholar] [CrossRef]
  23. Haim, A.; Portnov, B.A. Light Pollution as a New Risk Factor for Human Breast and Prostate Cancers; Springer: Dordrecht, The Netherlands, 2013. [Google Scholar]
  24. Garcia-Saenz, A.; De Miguel, A.S.; Espinosa, A.; Valentin, A.; Aragonés, N.; Llorca, J.; Amiano, P.; Sánchez, V.M.; Guevara, M.; Capelo, R. Evaluating the association between artificial light-at-night exposure and breast and prostate cancer risk in Spain (Mcc-spain study). Environ. Health Perspect. 2018, 126, 1–9. [Google Scholar] [CrossRef] [PubMed]
  25. Brüning, A.; Hölker, F.; Franke, S.; Kleiner, W.; Kloas, W. Impact of different colours of artificial light at night on melatonin rhythm and gene expression of gonadotropins in European perch. Sci. Total Environ. 2016, 543, 214–222. [Google Scholar] [CrossRef]
  26. Langevelde, F.V.; Grunsven, R.V.; Veenendaal, E.M.; Fijen, T.P. Artificial night lighting inhibits feeding in moths. Biol. Lett. 2017, 13, 20160874. [Google Scholar] [CrossRef] [PubMed] [Green Version]
  27. Census Office of the State Council of the People’s Republic of China. Data of China’s 2010 Census by Township, Town and Street; China Statistics Press: Beijing, China, 2012.
  28. Hao, Q. Research on Digital Observation and Spatial Model Construction of Multi-Dimensional Urban Nighttime Light Environment. Master’s Thesis, Dalian University of Technology, Dalian, China, 2020. (In Chinese). [Google Scholar]
  29. Raynham, P. Book review: Wout van Bommel (2015), Road Lighting: Fundamentals, Technology and Application. Lighting Res. Technol. 2016, 48, 654. [Google Scholar] [CrossRef]
  30. Akaike, H. A new look at the statistical model identification. IEEE Trans. Autom. Control 1974, 19, 716–723. [Google Scholar] [CrossRef]
  31. Questionnaire Survey and SPSS Application. Available online: https://doi.org/10.13140/RG.2.2.32848.53760 (accessed on 11 November 2020).
  32. Jorgensen, A.; Hitchmough, J.; Calvert, T. Woodland spaces and edges: Their impact on perception of safety and preference. Landsc. Urban Plan. 2002, 60, 135–150. [Google Scholar] [CrossRef]
  33. Krenichyn, K.L. Women, Physical Activity, and the Urban Outdoor Environment: A Study of Prospect Park, Brooklyn, New York. Ph.D. Thesis, City University of New York, New York, NY, USA, 2004. [Google Scholar]
  34. Hashim, N.; Thani, S.; Jamaludin, M.A.; Yatim, N.M. A Perceptual Study on the Influence of Vegetation Design Towards Women’s Safety in Public Park. Procedia-Soc. Behav. Sci. 2016, 234, 280–288. [Google Scholar] [CrossRef] [Green Version]
  35. Yang, W.; Moon, H.J. Combined effects of acoustic, thermal, and illumination conditions on the comfort of discrete senses and overall indoor environment. Build. Environ. 2019, 148, 623–633. [Google Scholar] [CrossRef]
  36. Peña-García, A.; Hurtado, A.; Aguilar-Luzon, M.C. Impact of public lighting on pedestrians’ perception of safety and well-being. Saf. Sci. 2015, 78, 142–148. [Google Scholar] [CrossRef]
  37. Nasar, J.; Bokharaei, S. Lighting modes and their effects on impressions of public squares. J. Environ. Psychol. 2017, 49, 96–105. [Google Scholar] [CrossRef]
  38. Nasar, J.; Bokharaei, S. Impressions of lighting in public squares after dark. Environ. Behav. 2017, 49, 227–254. [Google Scholar] [CrossRef]
  39. Rijswijk, L.; Haans, A. Illuminating for safety: Investigating the role of lighting appraisals on the perception of safety in the urban environment. Environ. Behav. 2018, 50, 889–912. [Google Scholar] [CrossRef]
  40. Rahm, J.; Johansson, M. Assessing the pedestrian response to urban outdoor lighting: A full-scale laboratory study. PLoS ONE 2018, 13, e0204638. [Google Scholar] [CrossRef] [PubMed] [Green Version]
  41. Duff, J.; Kelly, K.; Cuttle, C. Spatial brightness, horizontal illuminance and mean room surface exitance in a lighting booth. Light. Res. Technol. 2017, 49, 5–15. [Google Scholar] [CrossRef] [Green Version]
  42. Katz, Y.; Levin, N. Quantifying urban light pollution—A comparison between field measurements and EROS-B imagery. Remote Sens. Environ. 2016, 177, 65–77. [Google Scholar] [CrossRef]
  43. Portnov, B.A.; Saad, R.; Trop, T. Interactive Scenario-Based Assessment Approach of Urban Street Lighting and Its Application to Estimating Energy Saving Benefits. Energies 2021, 14, 378. [Google Scholar] [CrossRef]
Figure 1. Technical route of the study.
Remotesensing 14 00826 g001
Figure 2. Daytime satellite map of Dalian (reference map).
Remotesensing 14 00826 g002
Figure 3. The ISS nighttime light band images of Dalian.
Remotesensing 14 00826 g003
Figure 4. City neighborhoods ranked according to the red band light emissions.
Remotesensing 14 00826 g004
Figure 5. City neighborhoods ranked according to the blue band light emissions.
Remotesensing 14 00826 g005
Figure 6. Red band light values—neighborhood averages.
Remotesensing 14 00826 g006
Figure 7. Blue band light values—neighborhood averages.
Remotesensing 14 00826 g007
Figure 8. Population density distribution in the city of Dalian (people per km2).
Remotesensing 14 00826 g008
Figure 9. Residential areas selected for the further analysis.
Remotesensing 14 00826 g009
Figure 10. Nighttime images of the residential areas selected for the analysis. (There are 8 residential areas covered by the study: D1 (Lido Garden), D2 (New Hope Garden), D3 (Xiuyue Garden), D4 (Taoxian Community), D5 (Blue Sky and Starry Sea), D6 (Pearl Beer Garden), D7 (New New Community), D8 (Chunguangyuan Community).
Remotesensing 14 00826 g010
Figure 11. Comparison of the average horizontal illuminance in the study areas.
Remotesensing 14 00826 g011
Figure 12. Comparison of the minimum horizontal illuminance in the study areas.
Remotesensing 14 00826 g012
Figure 13. Comparison of the minimum vertical illuminance of in the study areas.
Remotesensing 14 00826 g013
Figure 14. Comparison of the minimum illuminance of the of the observer’s face (panoramic illumination) in in the study areas.
Remotesensing 14 00826 g014
Figure 15. Comparison of glare levels in the study areas.
Remotesensing 14 00826 g015
Figure 16. Comparison of the color temperature values in the study areas.
Remotesensing 14 00826 g016
Figure 17. Mean values of FoS in the neighborhoods surveyed, on a 4-point Likert scale, from 0 (Low) to 3 (High).
Remotesensing 14 00826 g017
Figure 18. Average evaluations of the visual comfort in the communities surveyed.
Remotesensing 14 00826 g018
Figure 19. The relative contribution of different factors to FoS (the AIC increment test).
Remotesensing 14 00826 g019
Figure 20. The observed association between FoS and the logarithmically transformed value of illuminance.
Remotesensing 14 00826 g020
Figure 21. The observed association between FoS and the original value of illuminance.
Remotesensing 14 00826 g021
Figure 22. Change in the safety evaluation in line with illumination level.
Remotesensing 14 00826 g022
Figure 23. Differences in perceived safety for different levels of uniformity.
Remotesensing 14 00826 g023
Figure 24. Fit line for PLQ vs. illuminance for illuminance levels equal or greater than 10 lx.
Remotesensing 14 00826 g024
Figure 25. Fit line for PLQ vs. light color temperature for illuminance levels equal or greater than 10 lx.
Remotesensing 14 00826 g025
Table 1. Residential areas with high and low values of red and blue light emissions.
Area Where the Community Is LocatedCommunity NameNumberConstruction DateBuilding FeaturesLand Area (m2)Is It Open?
Upper Middle Mountain District Lido GardenD12003High-rise43,000Yes
Upper Shahekou District New Hope GardenD22002High-rise35,000No
Upper Middle Mountain District Xiuyue GardenD32003High-rise43,000Yes
Taoxian CommunityD42000Multistory45,000Yes
Lower Shahekou District Blue Sky and Starry SeaD52006Multistory96,000No
Pearl Beer GardenD61991Multistory13,000Yes
Lower Shahekou DistrictNew New CommunityD72000Multistory45,000Yes
Chunguangyuan CommunityD82000Multistory12,000No
Table 2. Basic statistics of the survey participants.
Sample IndexNumber of PeoplePercentage
GenderMale5856.31%
Female4543.69%
Age (years)18–251312.62%
26–304846.61%
31–402726.21%
41–501211.65%
51–6021.94%
Over 6010.97%
Education levelJunior98.74%
Senior1413.60%
Undergraduate4038.83%
Masters degree or above4038.83%
Table 3. Research variables affecting safety evaluations.
Research VariablesCoding Variable CategoryReference Category
Feelings of safety (FoS)0 = feel very unsafe; 1 = feel a little unsafe; 2 = feel quite safe; 3 = feel very safe0
Perceived lighting quality (PLQ)0 = very uncomfortable; 1 = a little uncomfortable; 2 = quite comfortable; 3 = very comfortable0
Subjective evaluation variables
Illumination (IL)0 = very weak; 1 = reasonable; 2 = good; 3 = too strong0
Color temperature (LCT)0 = too cool; 1 = very cool; 2 = a little warm; 3 = very warm0
Uniformity (LU)0 = uneven; 1 = slightly uneven; 2 = quite even; 3 = very even0
Glare (LG)0 = not dazzling; 1 = slightly dazzling; 2 = quite dazzling; 3 = very dazzling0
Variables recorded by the research team
Education level0 = junior high school and below; 1 = high school; 2 = university; 3 = master degree or above0
Age group0 = 18–40 yo; 1 = 41–61 yo0
Gender issues0 = female; 1 = male0
Uniformity of light distribution0 = discontinuous lighting; 1 = sparse lighting; 2 = uniform illumination0
Vegetation density0 = no vegetation (trees and shrubs do not block streetlights); 1 = sparse vegetation (trees and shrubs partially block streetlights); 2 = dense vegetation (trees and shrubs significantly block streetlights)0
Traffic intensity0 = sparse traffic (less than 5 vehicles per 15 min); 1 = medium traffic (5–10 vehicles per 15 min); 2 = dense traffic (more than 10 vehicles per 15 min)0
Residential area dummies1 = Lido Garden; 2 = New Hope Garden; 3 = Xiuyue Garden; 4 = Taoxian Community; 5 = Blue Sky and Starry Sea; 6 = Pearl Beer Garden; 7 = New New Community; 8 = Chunguangyuan Community1
Table 4. Data basic statistical scale for the difference in safety perception between two age groups.
AgeNumber of CasesAverage ValueStandard DeviationMean Value of Standard Error
FoS18–40 years old17541.94580.90380.0216
41–61 years old3121.60580.90820.0514
Table 5. Basic Statistics Table of the Differences in Perception of Safety between Men and Women.
AgeNumber of CasesAverage ValueStandard DeviationMean Value of Standard Error
FoSFemale8991.64070.95500.0319
Male11672.09000.82710.0242
Table 6. Regression estimates of the impact of different illuminance metrics on FoS.
Lighting Level/MeasurementBBetat-StatBBetat-StatBBetat-Stat
A. Explanatory variables measured on the original continuous scale (lx)
Model 1AModel 1BModel 1C
Horizontal direction0.3520.81617.766 ***------
Vertical panorama---0.0260.0064.496 ***---
Vertical direction------0.0380.0066.102 ***
R20.3620.1130.191
F89.462 ***20.216 ***37.230 ***
B. Log-transformed variables
Model 1DModel 1EModel 1F
Horizontal0.7110.74314.244 ***------
Vertical---0.5200.7137.853 ***---
Vertical panorama------0.5840.5949.270 ***
R20.5620.2810.352
F202.878 ***61.677 ***85.936 ***
Note: B is the non-standardized regression coefficient, beta is the standardized regression coefficient, T-stat is the statistic and its significance value, and *** is the 0.001 significance level.
Table 7. Factors affecting perceived safety.
BBetat-StatR2R2 (after Adjustment)FR2 VariationF Variation
Model 2(Constant)1.347-34.132 ***0.6660.664315.62 ***0.666-
Ground-level illumination (ln)0.3520.81617.766 ***
Model 3(Constant)1.402-28.31 ***0.6910.685116.06 ***0.0246.095 **
Ground-level illumination (ln)0.3180.73713.014 ***
Vegetation−0.127−0.132−2.908 **
Traffic0.0890.0911.603 *
Model 4
Residential model (reference = D1(Lido Garden))
(Constant)0.961-7.875 ***0.7610.74447.32 ***0.0706.217 ***
Ground-level illumination (ln)0.3590.83411.513 ***
Vegetation−0.116−0.121−2.851 **
Traffic0.1170.122.087 **
D2(New Hope Garden)0.3090.1472.342 **
D3(Xiuyue Garden)0.2370.1152.051 **
D4(Taoxian Community)0.6580.3135.756 ***
D5(Blue Sky and Starry Sea)0.560.2553.986 ***
D6(Pearl Beer Garden)0.320.1462.215 **
D7(New New Community)0.3330.1682.972
D8(Chunguangyuan Community)0.5750.2743.717
Note: B is the non-standardized regression coefficient, beta is the standardized regression coefficient, T-stat is the statistic and its significance value, * is the 0.1 significance level, ** is the 0.01 significance level, *** is the 0.001 significance level, and Vif is the variance expansion factor (multiple collinearity test).
Table 8. The relationships between lighting attributes and visual comfort obtained by Spearman’s correlation test.
Perceived Lighting Quality (PLQ)IlluminationGlareColor TemperatureUniformity
Illumination ≤ 10 lx (Spearman’s Rho)Perceived lighting quality (PLQ)Correlation coefficient1.000−0.343 **0.0910.0950.285 **
Significance (two-tailed).0.0000.3380.3150.002
IlluminationCorrelation coefficient0.343 **1.000−0.249 **0.291 **0.052
Significance (two-tailed)0.000.0.0080.0020.587
GlareCorrelation coefficient−0.091−0.249 **1.000−0.444 **−0.198 *
Significance (two-tailed)0.3380.008.0.0000.035
Color temperatureCorrelation coefficient−0.0950.291 **−0.444 **1.0000.200 *
Significance (two-tailed)0.3150.0020.000.0.034
UniformityCorrelation coefficient0.285 **0.052−0.198 *0.200 *1.000
Significance (two-tailed)0.0020.5870.0350.034.
Illumination > 10 lx (Spearman’s Rho)Perceived lighting quality (PLQ)Correlation coefficient1.000−0.326 *0.294 *0.378 **0.198
Significance (two-tailed).0.0260.0450.0090.182
IlluminationCorrelation coefficient0.326 *1.0000.340 *−0.1590.015
Significance (two-tailed)0.026.0.0190.2850.919
GlareCorrelation coefficient−0.294 *0.340 *1.000−0.152−0.033
Significance (two-tailed)0.0450.019.0.3070.824
Color temperatureCorrelation coefficient−0.178 **−0.159−0.1521.000−0.196
Significance (two-tailed)0.0090.2850.307.0.187
UniformityCorrelation coefficient0.198 *0.015−0.033−0.1961.000
Significance (two-tailed)0.1820.9190.8240.187.
Significance levels: * p < 0.05, ** p < 0.01.
Table 9. Results of multiple regression analysis of the factors affecting comfort at the level of illuminance of above 10 lx.
TermCoefficientCoefficient Standard Error95% Confidence IntervalT Valuep ValueVariance Expansion Factor
Constant2.181.03(0.09, 4.27)2.110.041-
Illumination0.020540.00668(0.00705, 0.03402)3.080.0041.09
Glare−0.04670.0282(−0.1036, 0.0102)−1.660.1051.27
Color temperature0.0002070.000089(0.000026, 0.000388)2.320.0261.19
Uniformity (reference = 0)
10.2870.331(−0.382, 0.955)0.870.3921.56
20.4100.208(−0.010, 0.829)1.970.0551.40
Publisher’s Note: MDPI stays neutral with regard to jurisdictional claims in published maps and institutional affiliations.

