1. Introduction
Sea ice refers to saltwater ice that is directly frozen from seawater, and also includes continental glaciers (icebergs and Iceland), river ice, and lake ice that enter the ocean. Sea ice greatly inhibits the heat and steam exchange between the ocean and atmosphere and alters the radiation budget and energy balance of the ocean’s surface. These changes have an important impact on oceanic hydrological conditions, atmospheric circulation, and ocean climate [
1]. In addition, the production and disappearance of sea ice greatly affects human marine activities. For example, sea ice significantly affects the development of marine resources and marine transportation [
2]. Moreover, sea ice presents a potential freshwater resource [
3]. Therefore, accurate real-time monitoring of sea ice bears an important application value and theoretical significance.
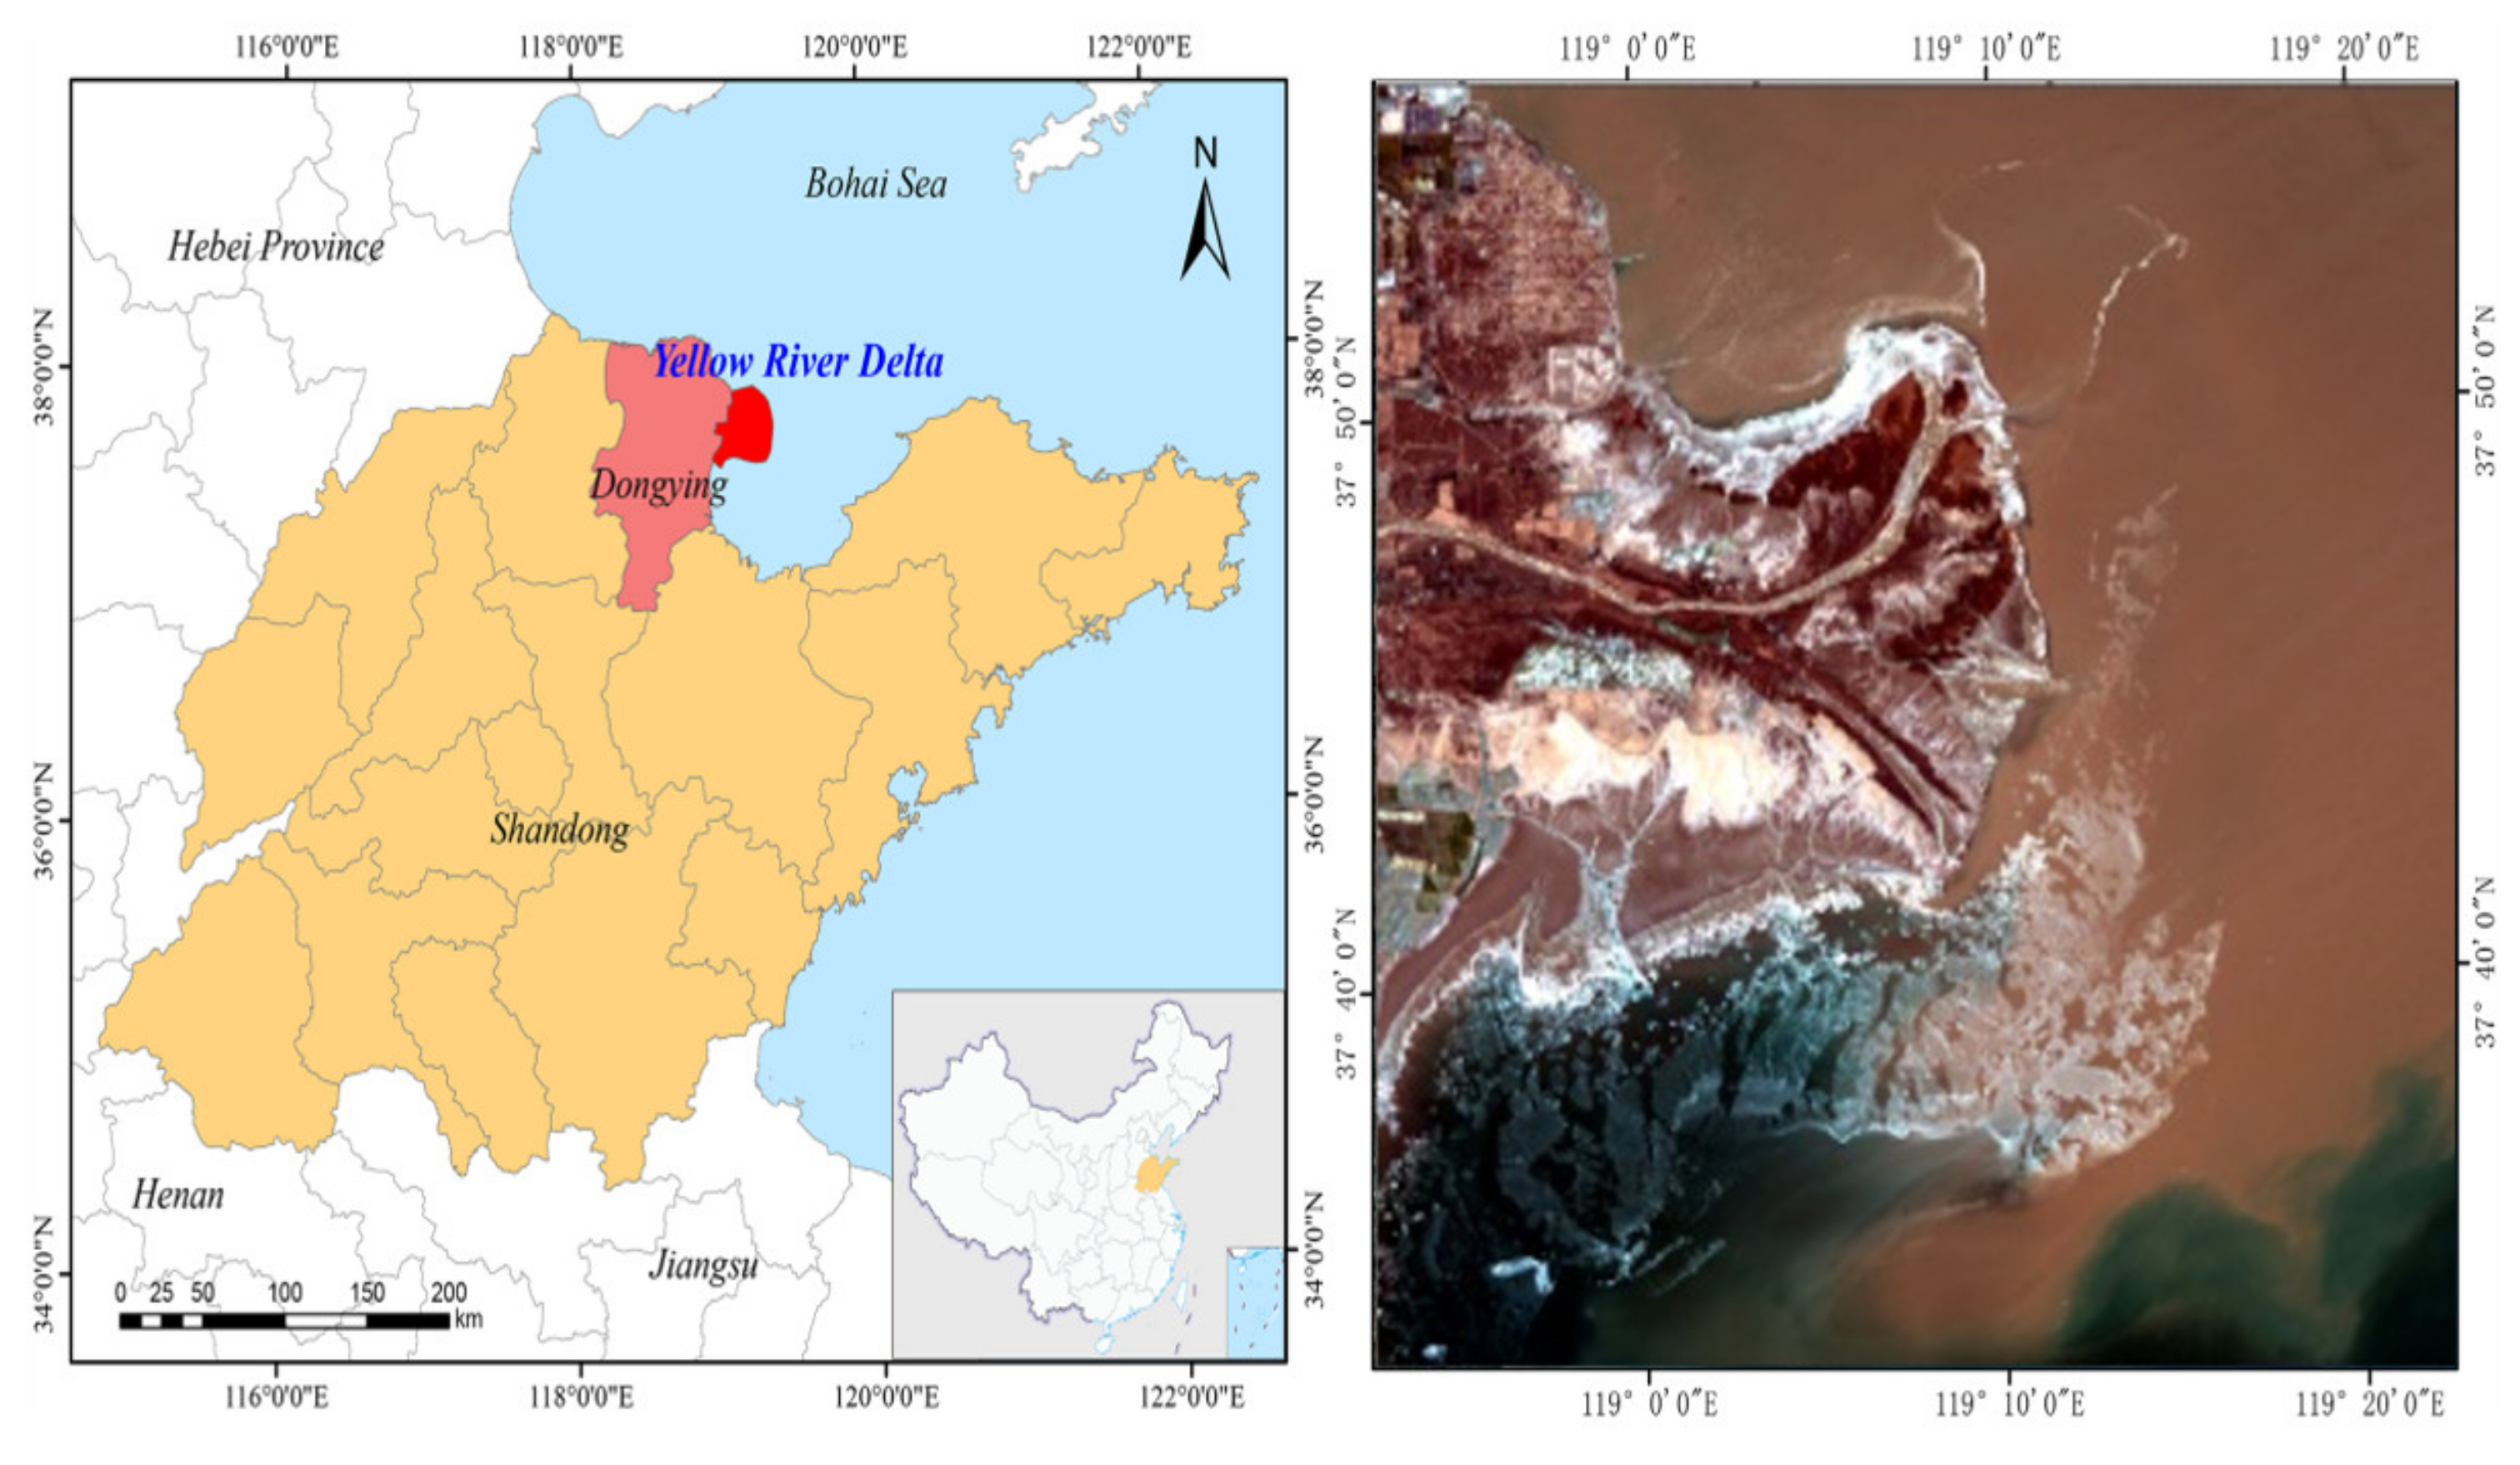
The bottom of the Yellow River Delta contains a small flat slope, shallow water low salinity, as a result of which seawater is easily frozen [
4]. The development of conditions conducive to ice formation and persistence in this sea area is unstable; that is, the ice disappears as the temperature rises and reappears as the temperature drops [
5]. Sea ice is formed at a rapid rate and responds more closely to the local climate. Sea ice disasters frequently occur in the waters of the Yellow River Delta, and sea ice often has a major impact on fishing ports, wharves, shallow beach aquaculture, and offshore infrastructure [
6]. For example, the operation area of the Shengli Oilfield, China’s second-largest oilfield, is mainly concentrated in the Yellow River Delta, the Bohai Sea and its adjacent waters. Sea ice severely affects and threatens offshore oilfield production operations and various engineering facilities in the winter [
7]. According to statistics, severe and relatively serious sea ice disasters occur roughly once every five years in China, and in some sea areas, sea ice disasters occur almost every year [
8]. In the winter of 2009–2010, the Bohai Sea and the northern part of the Yellow Sea experienced the worst ice conditions in nearly 30 years. The severe ice conditions had a significant impact on the society and economy of the provinces (cities) along the Yellow Sea and the Bohai Sea. According to statistics, sea ice disasters caused economic losses totaling nearly USD 900 million [
9]. Therefore, in the context of global warming, it is entirely possible that continuous low temperatures and severe sea ice disasters will occur in some areas. In particular, with the rapid economic development of the Bohai Rim region, the losses suffered by sea ice disasters are increasing year by year [
10]. In the new era, the country should promote the understanding of the ocean, rationally develop and utilize marine resources, protect the rights and interests of the ocean, and insist on the harmonious coexistence of man and the ocean. Faced with the new requirements as China enters a new era and accelerates the building of its maritime power, the existing sea ice disaster prevention and mitigation capabilities can no longer fully meet the actual needs of the economic and social development in icy sea areas, and sea ice monitoring capabilities remain relatively weak [
11]. It is the trend of future development to improve the three-dimensional marine disaster observation network that combines coastal observation, offshore platform and satellite remote sensing, so as to improve the ability of marine disaster observation [
12]. Therefore, the precise extraction of sea ice provides the basis for strengthening the analysis of and research on sea ice conditions, and is necessary for improving early sea ice warning technology, as well as ice prevention and disaster reduction capabilities.
Traditional sea ice monitoring methods, such as shore-based observations and icebreaker observations, cannot obtain large-scale sea ice information in a timely and accurate manner. Remote sensing monitoring technology has a high timeliness, can obtain repeated observations on a large scale, and is relatively inexpensive, providing long-term data support for dynamic and efficient sea ice monitoring [
13,
14,
15].
Large-scale monitoring of sea ice in high latitudes can be carried out using remote sensing technologies such as microwave and optical remote sensing. Passive microwave and synthetic aperture radar (SAR) imagery enables all-weather observations and the ability to penetrate through clouds [
16,
17]. The automatic segmentation algorithm based on statistical distance realizes the classification of C-band fully polarized sea ice data [
18]. A sea ice classification method is proposed for X-band, C-band and L-band fully polarized synthetic aperture radar images. By extracting the polarized features of sea ice classification, the feature vector provides input into the neural network classifier to realize the extraction of sea ice [
19]. However, it is challenging to obtain due to the high cost and the long revisit period for most of them [
20]. Optical remote sensing data, although limited by weather conditions, usually delivers better spatial resolution, lower cost, and shorter revisit times. For example, satellites such as Moderate Resolution Imaging Spectroradiometer (MODIS) [
21], Advanced Very High-Resolution Radiometer (AVHRR), Geostationary Ocean Color Imager (GOCI) [
22], and Feng Yun 3 (FY-3) [
23] has a high time resolution and can be used for continuous monitoring of sea ice in a large-scale area and a long time sequence. The disadvantage is that the spatial resolution is low, and it is difficult to perform refined regional sea ice monitoring. High spatial resolution remote sensing data represented by GF1 [
24], Landsat [
25], and Sentinel-2 [
26] can be used to achieve refined sea ice monitoring through data mining, and the effective combination of multi-source medium and high-resolution satellite data compensates for the low time resolution of the data and further improves its sea ice monitoring capabilities.
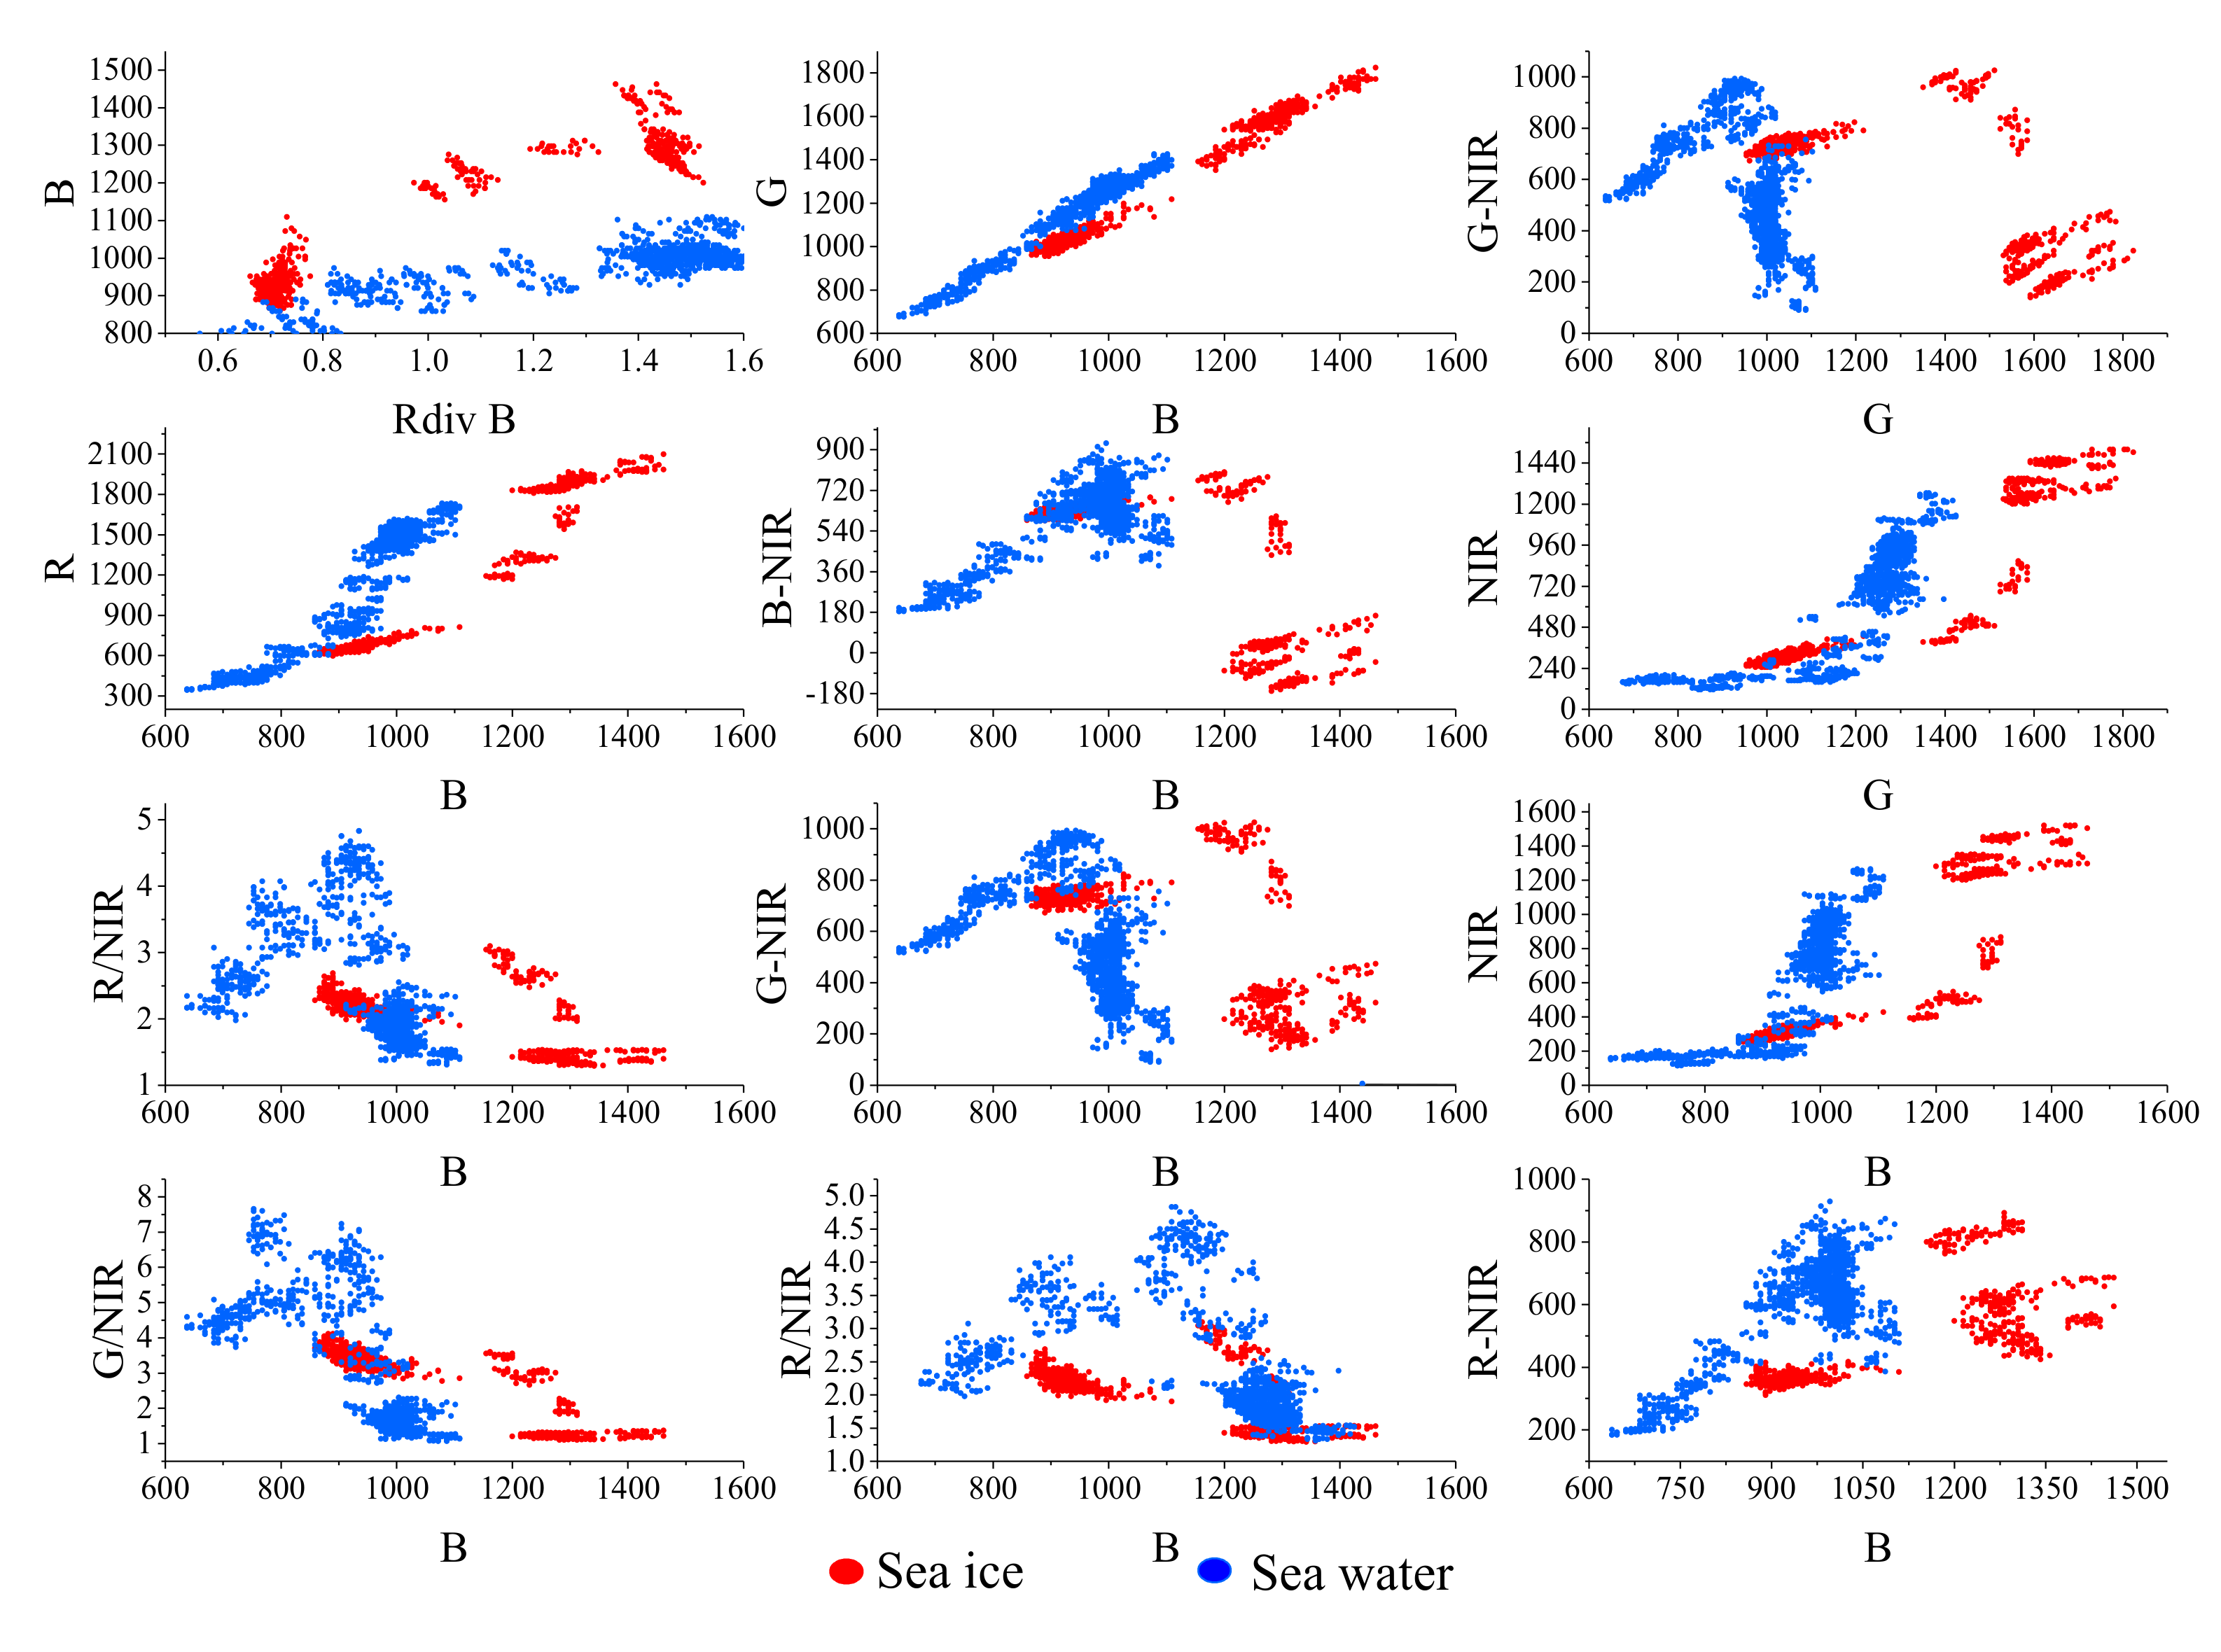
Three main types of feature parameters are used for sea ice extraction: spectral features, spatial features, and temperature features. The spectrum processing methods commonly used for sea ice extraction include the band ratio, band difference, and various normalized indexes, which highlight the sea ice information [
27]. In addition, the sample point selection and machine learning methods have also been used to extract spectral information about sea ice. The second concerns the spatial features. The spatial feature commonly used for sea ice extraction is the textural feature based on the gray-level co-occurrence matrix. Generally, the surface of sea ice is rough and has conspicuous irregular and unstable textural characteristics; while the surface of sea water is smooth and has constant textural characteristics [
28]. The third refers to the temperature feature. This parameter is used to retrieve the surface temperature through the thermal infrared band of the remote sensing image. The temperature feature is simple and easy to use, but has fewer data sources and a low spatial resolution; the accuracy of the temperature retrieval algorithm is also not very high, limiting its application [
29].
Current sea ice extraction methods can be divided into threshold segmentation methods, machine learning methods, and digital image processing methods. The threshold segmentation method mainly involves setting the threshold value of the sea ice’s spectral, textural, temperature, and other parameters and determining the threshold values using an artificial or bimodal histogram, scatter plots, and other methods, such as using the red band and the ratio threshold of the near-infrared band to achieve rapid extraction of sea ice [
27]. Su et al. used the red and near-infrared bands of Sentinel-3 images to establish a sea ice information index that highlights the spectral information of sea ice, and employed the Jenks method to determine the segmentation threshold of ice water [
30]. Hayashi et al. used reflectance scatter plots of MODIS bands 1 and 2 to derive a formula suitable for extracting the area of thin ice [
31]. Ice conditions in the Gulf of Riga in the Baltic Sea were counted by a bimodal histogram method, the statistical results were limited by the spatial resolution of MODIS [
32]. The threshold segmentation method is simple and fast, but it is difficult to determine the threshold value using this method, and the threshold value of different images will be slightly different. Machine learning methods such as support vector machines and Classification and Regression Trees (CART) decision trees select certain sample points and then classify the sea ice and seawater areas [
33]. The machine learning method is simple and easy to use, but the classification process is unclear, and the sample points need to be manually selected, making it difficult to achieve automation. In addition, the final accuracy depends entirely on the selected sample points. The digital image processing method is to highlight the sea ice information by processing and transforming the image. For example, Li et al. proposed a linear spectral decomposition method based on MODIS images with multiple constrained end members [
34]. The pixels are decomposed to extract the range of the sea ice. Liu et al. used a wavelet transform to extract the textural information from a SAR image, converted a China–Brazil Earth Resources Satellite (CBERS-02B) optical image from Red-Green-Blue space to Hue-Saturation-Intensity space, and finally employed Principal Component Analysis (PCA) to fuse the HSI image and the texture images [
35]. Digital image processing methods can highlight sea ice information more intuitively, but the process is more complicated and difficult to automate.
The seawater turbidity of the Yellow River Delta is high, and the changes are quite drastic, which intensifies the distinction between sea ice and seawater. Aiming at the problems of the low accuracy and efficiency of the current sea ice extraction methods used in the Yellow River Delta and based on multi-source remote sensing images, in this study, a set of sea ice automatic extraction method systems suitable for the Yellow River Delta was developed and the spatial and textural information about the sea ice was fully excavated. The automatic extraction method will be further extended to other areas such as Liaodong Bay in order to provide important technical support for the rational development of sea ice resources and to improve the early warning capabilities of sea ice disaster prevention and mitigation systems. This method explores the spectral information and texture information of different ice types. The spectral information, texture information and edge information of sea ice are used to extract sea ice, and the completeness and accuracy of sea ice extraction results are improved through multi-scale segmentation of images. This method can provide a reliable method for extracting sea ice extent from high-resolution optical remote sensing data such as GF1.
3. Results
3.1. Analysis of Sea Ice Spectral Information Index
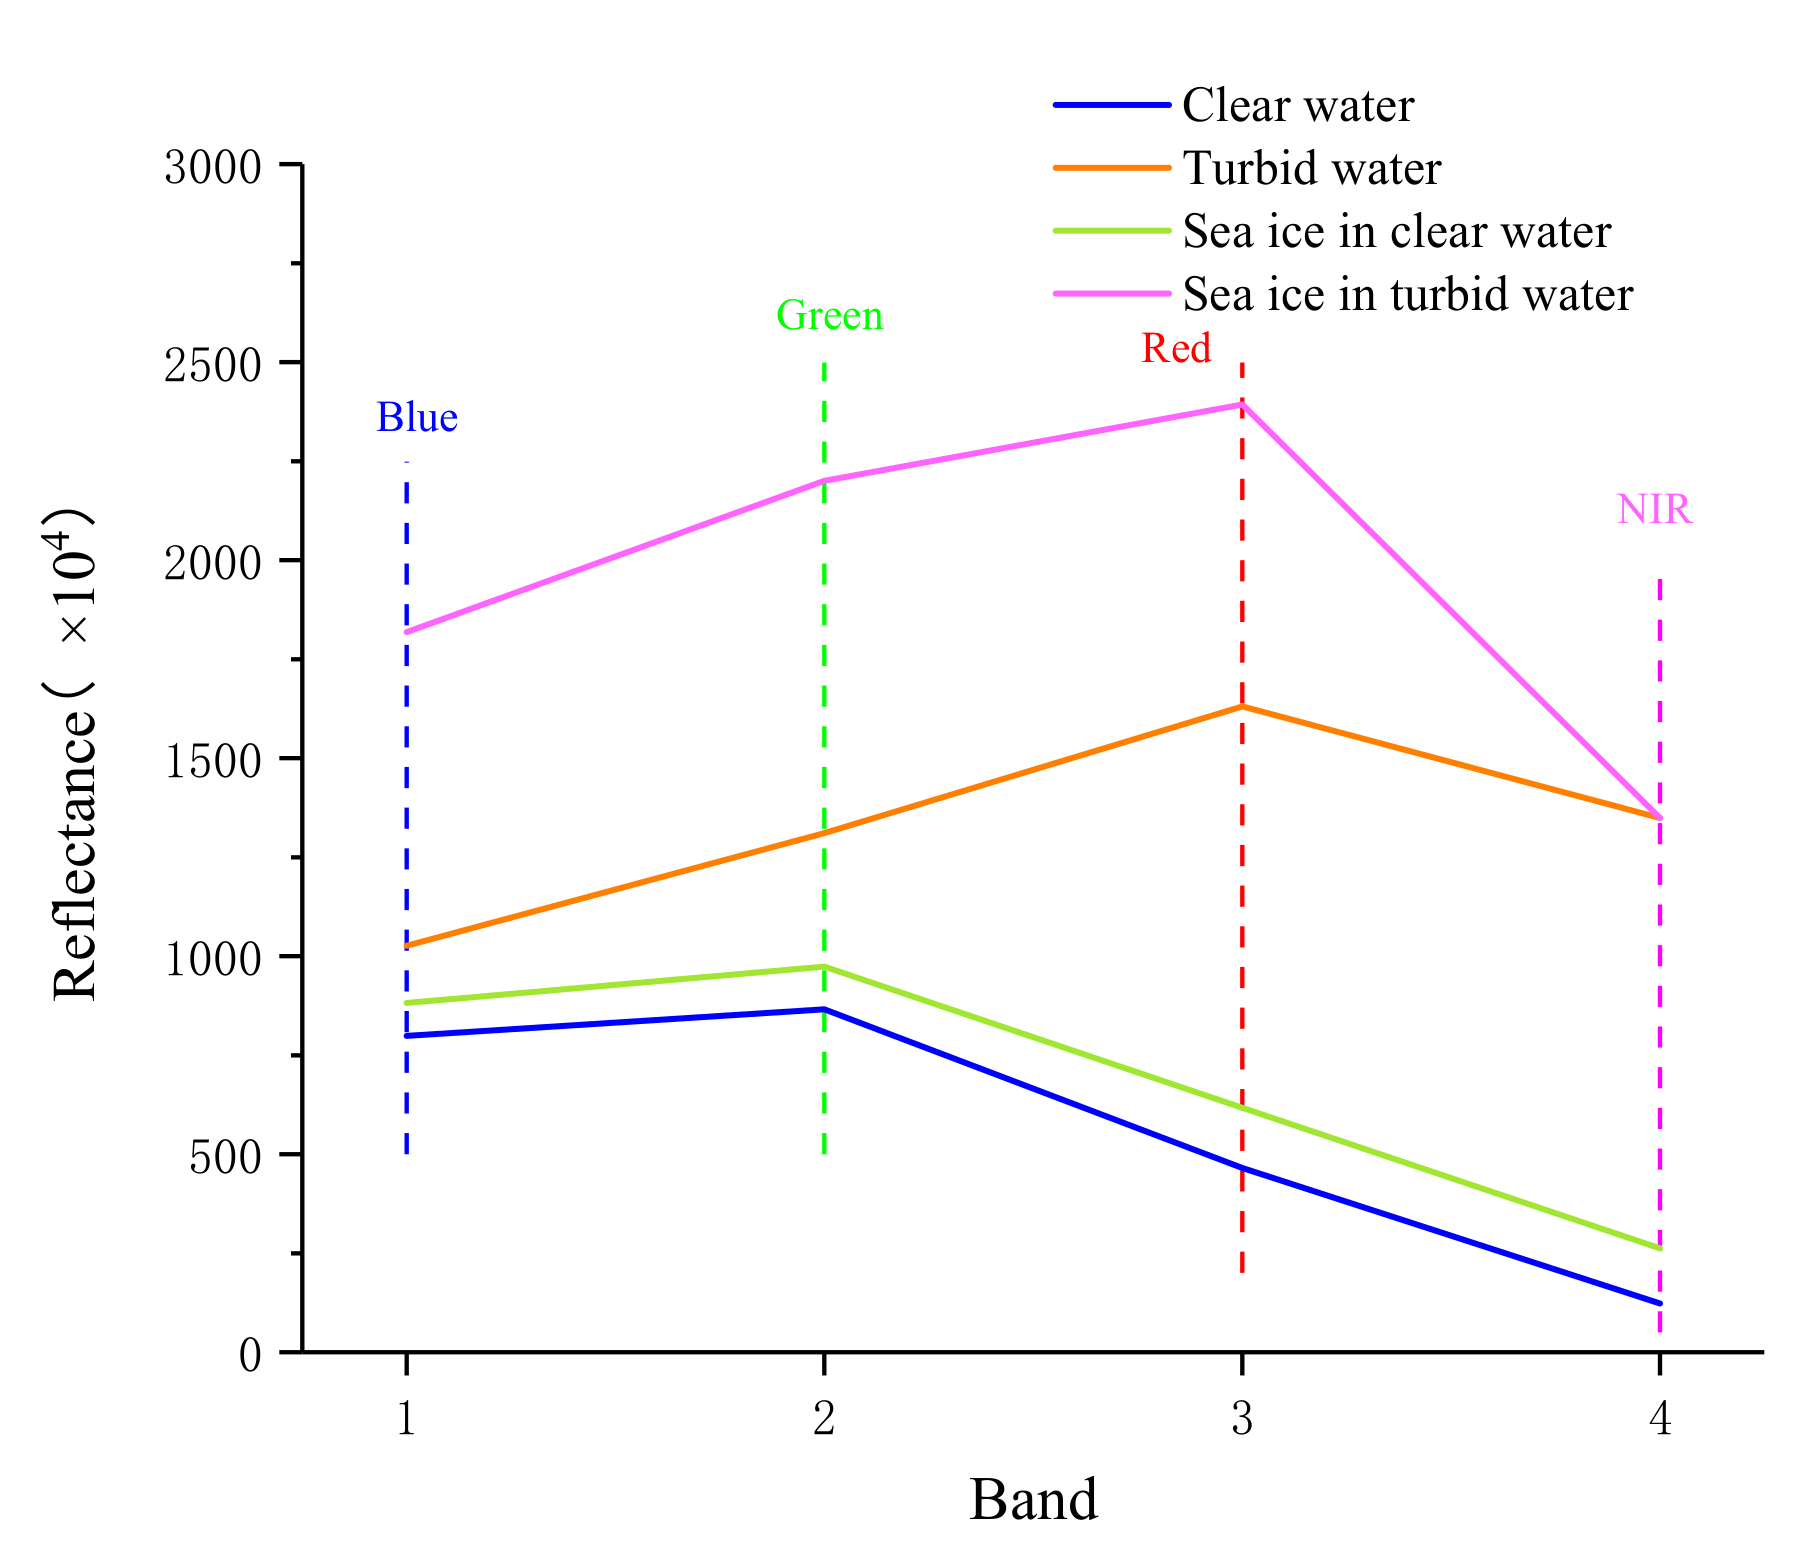
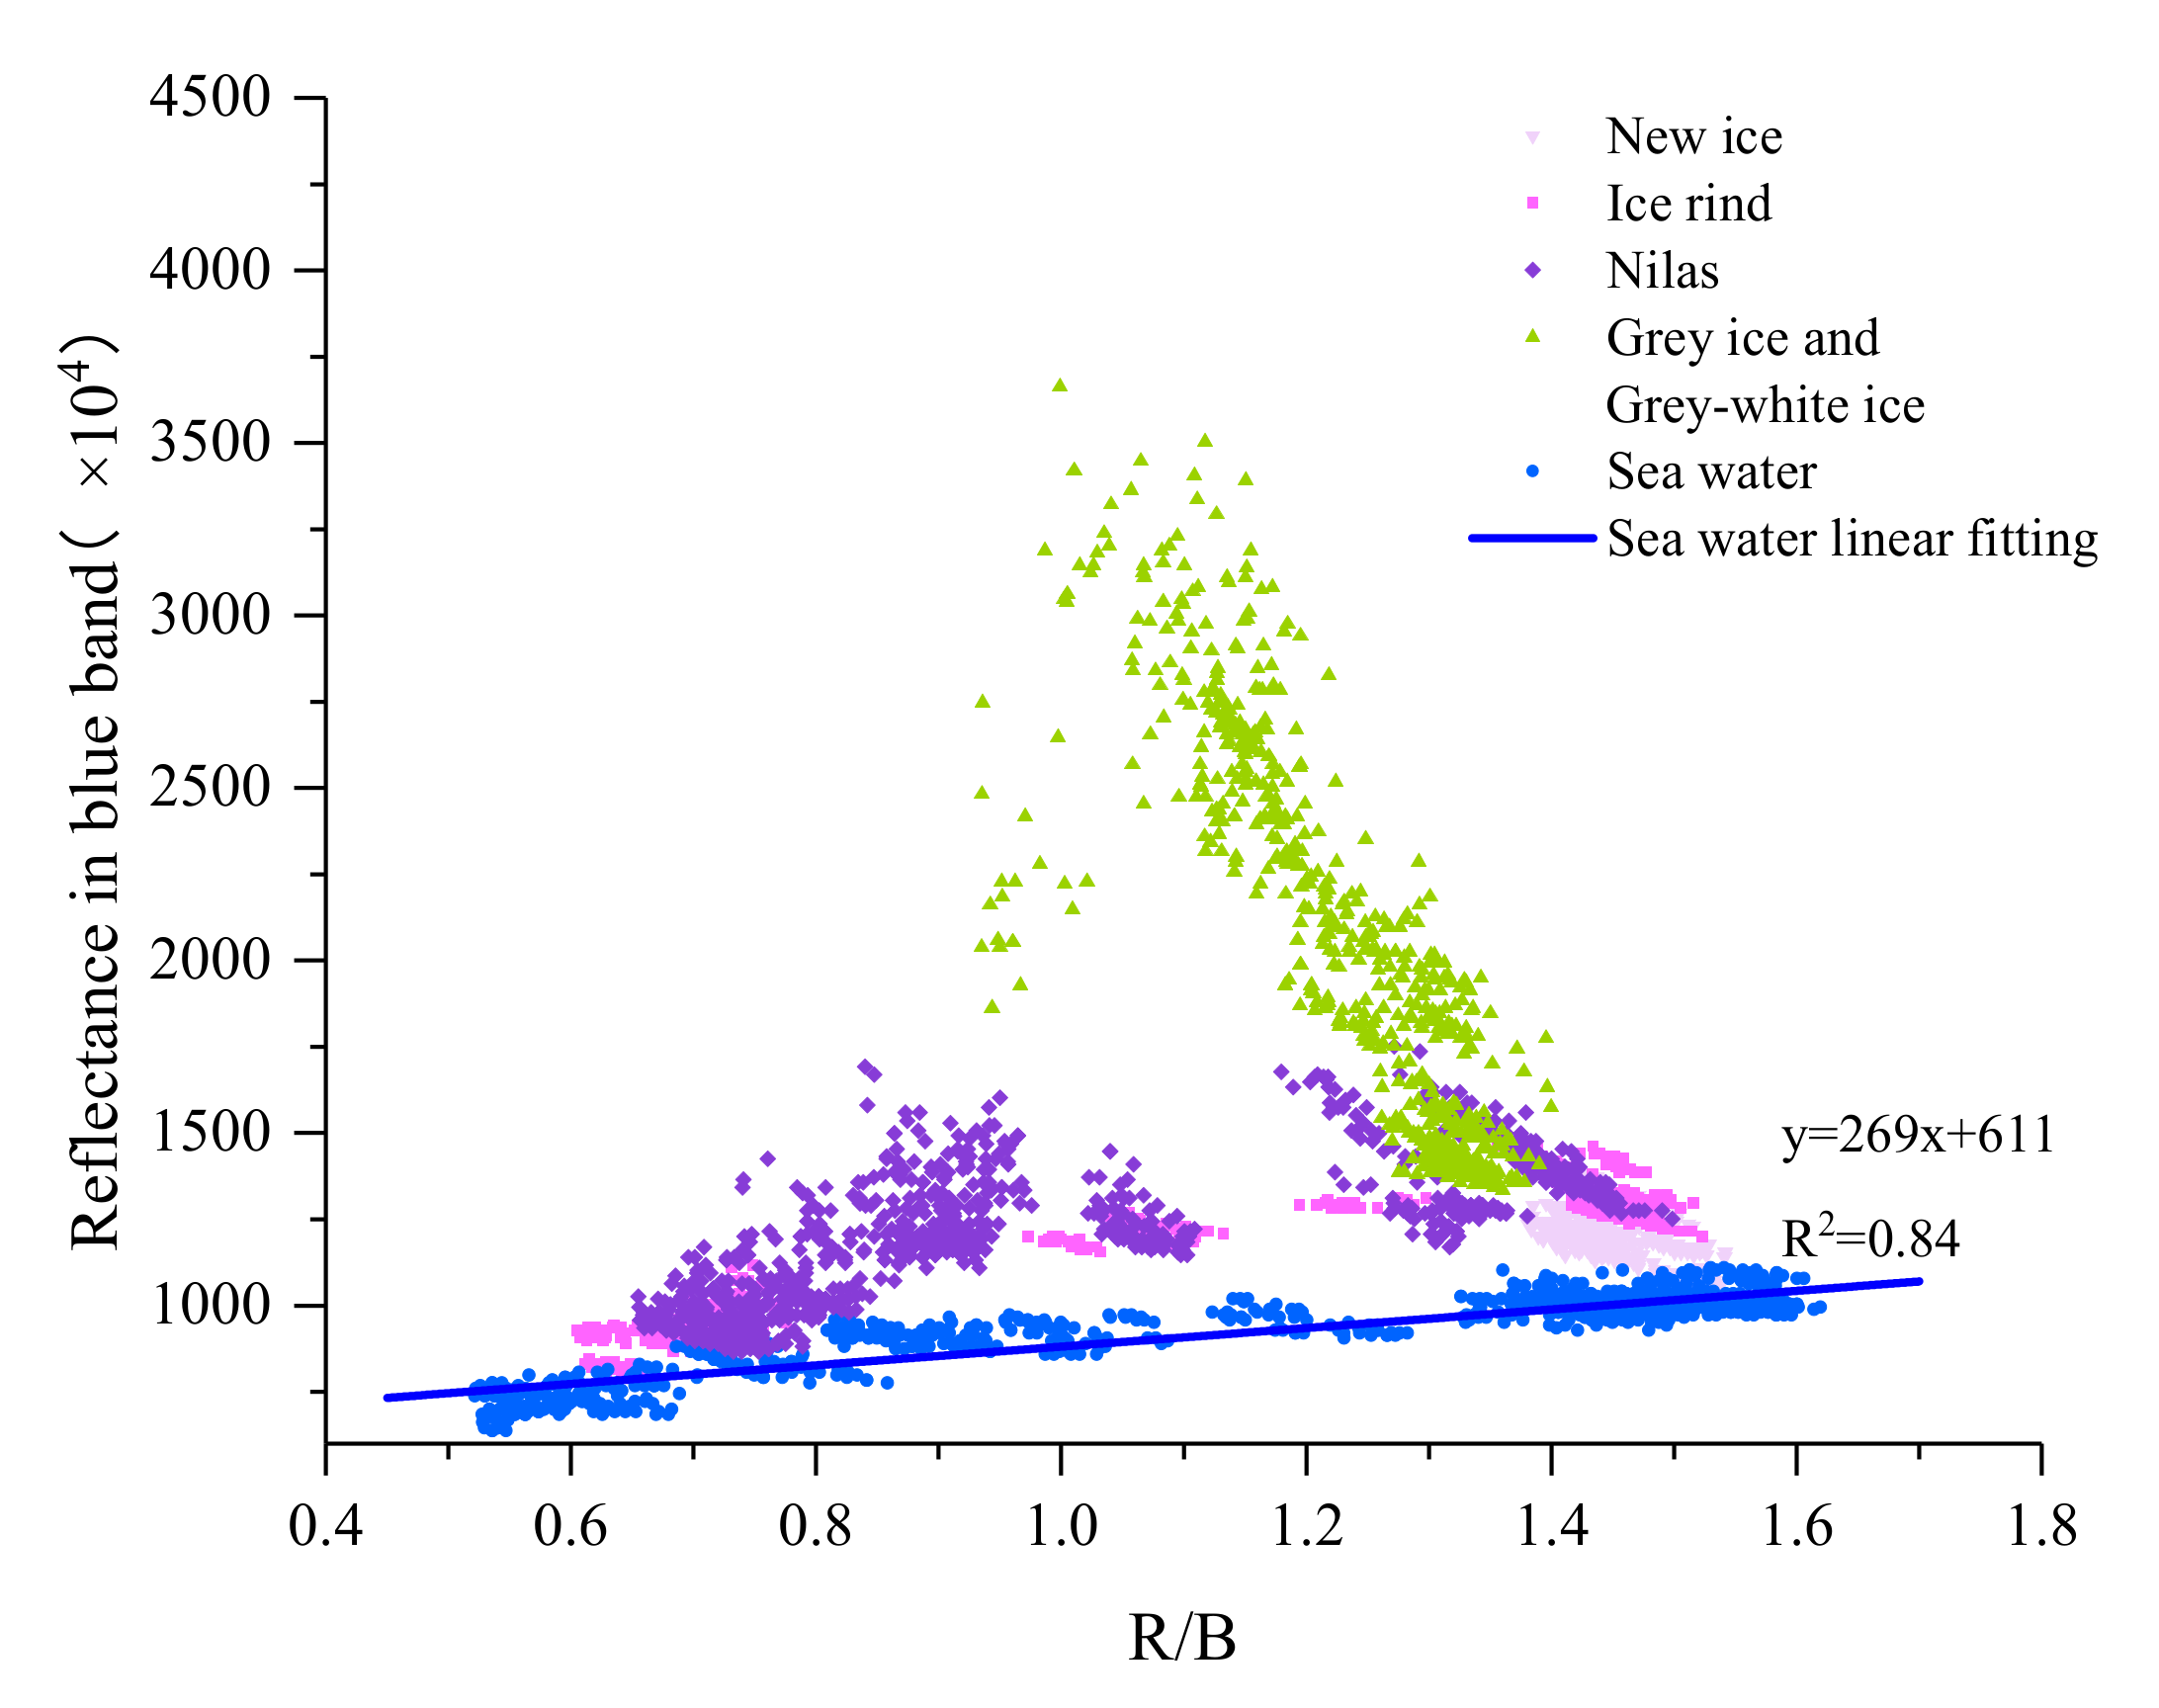
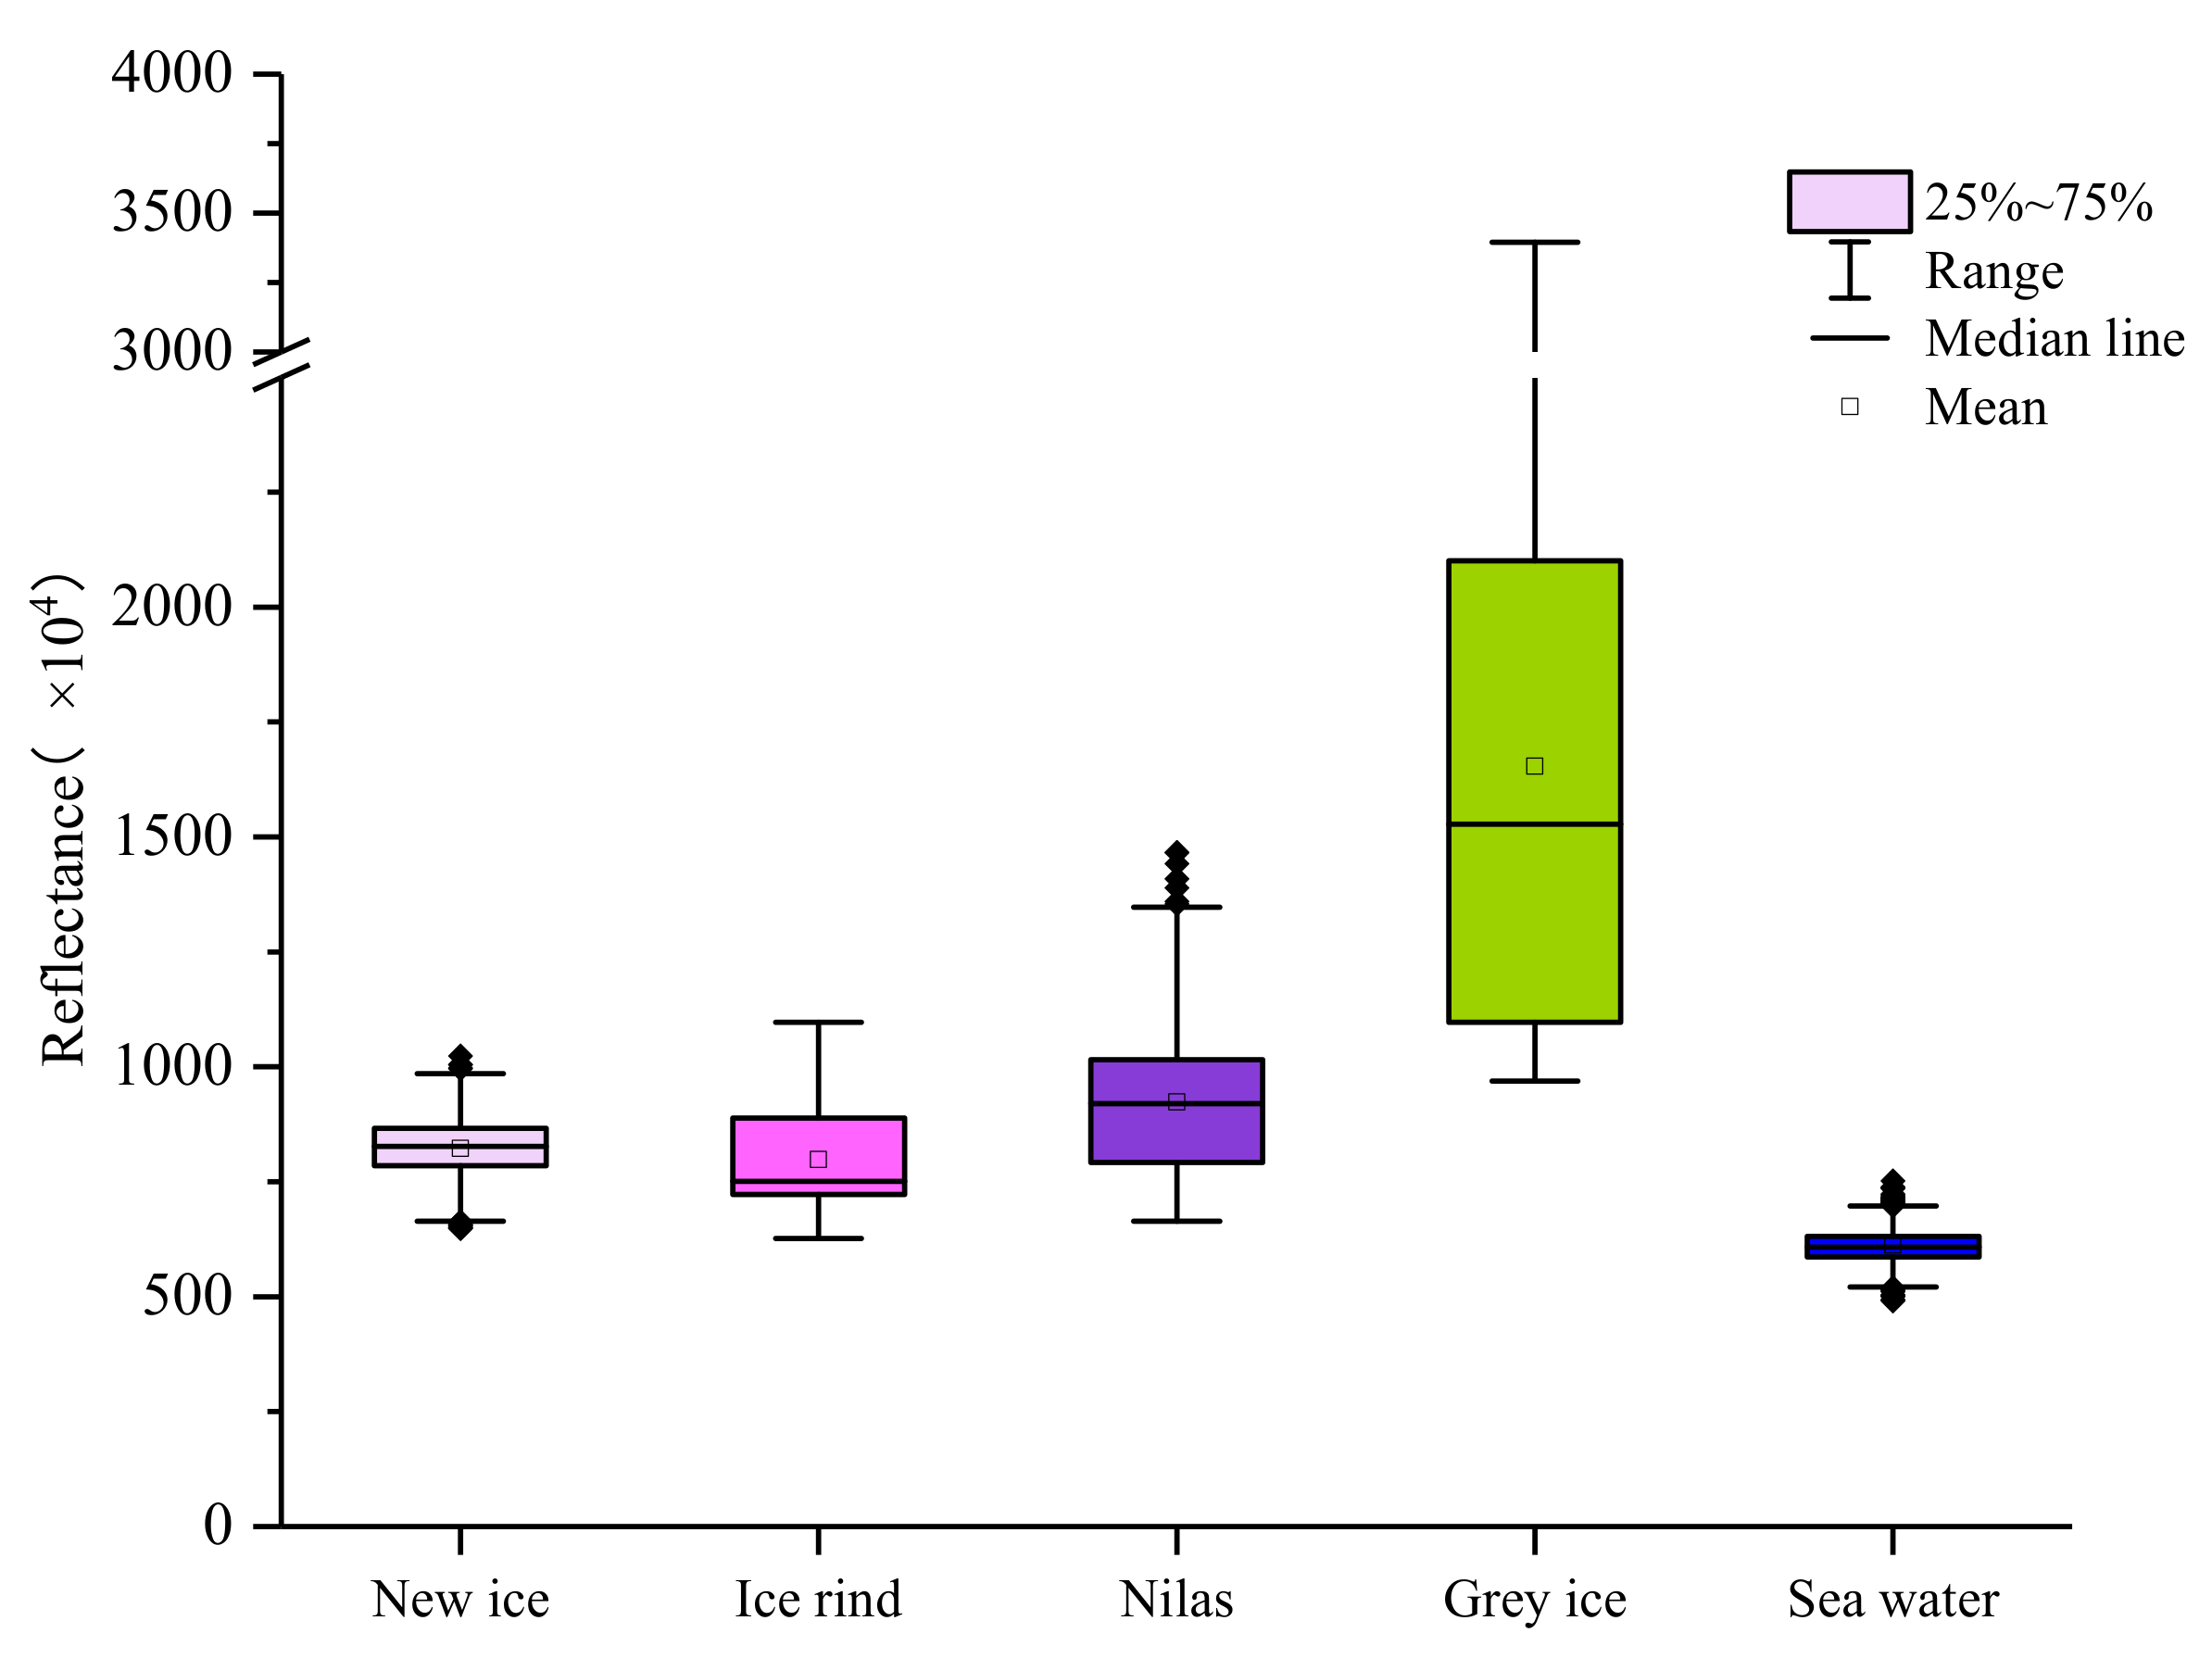
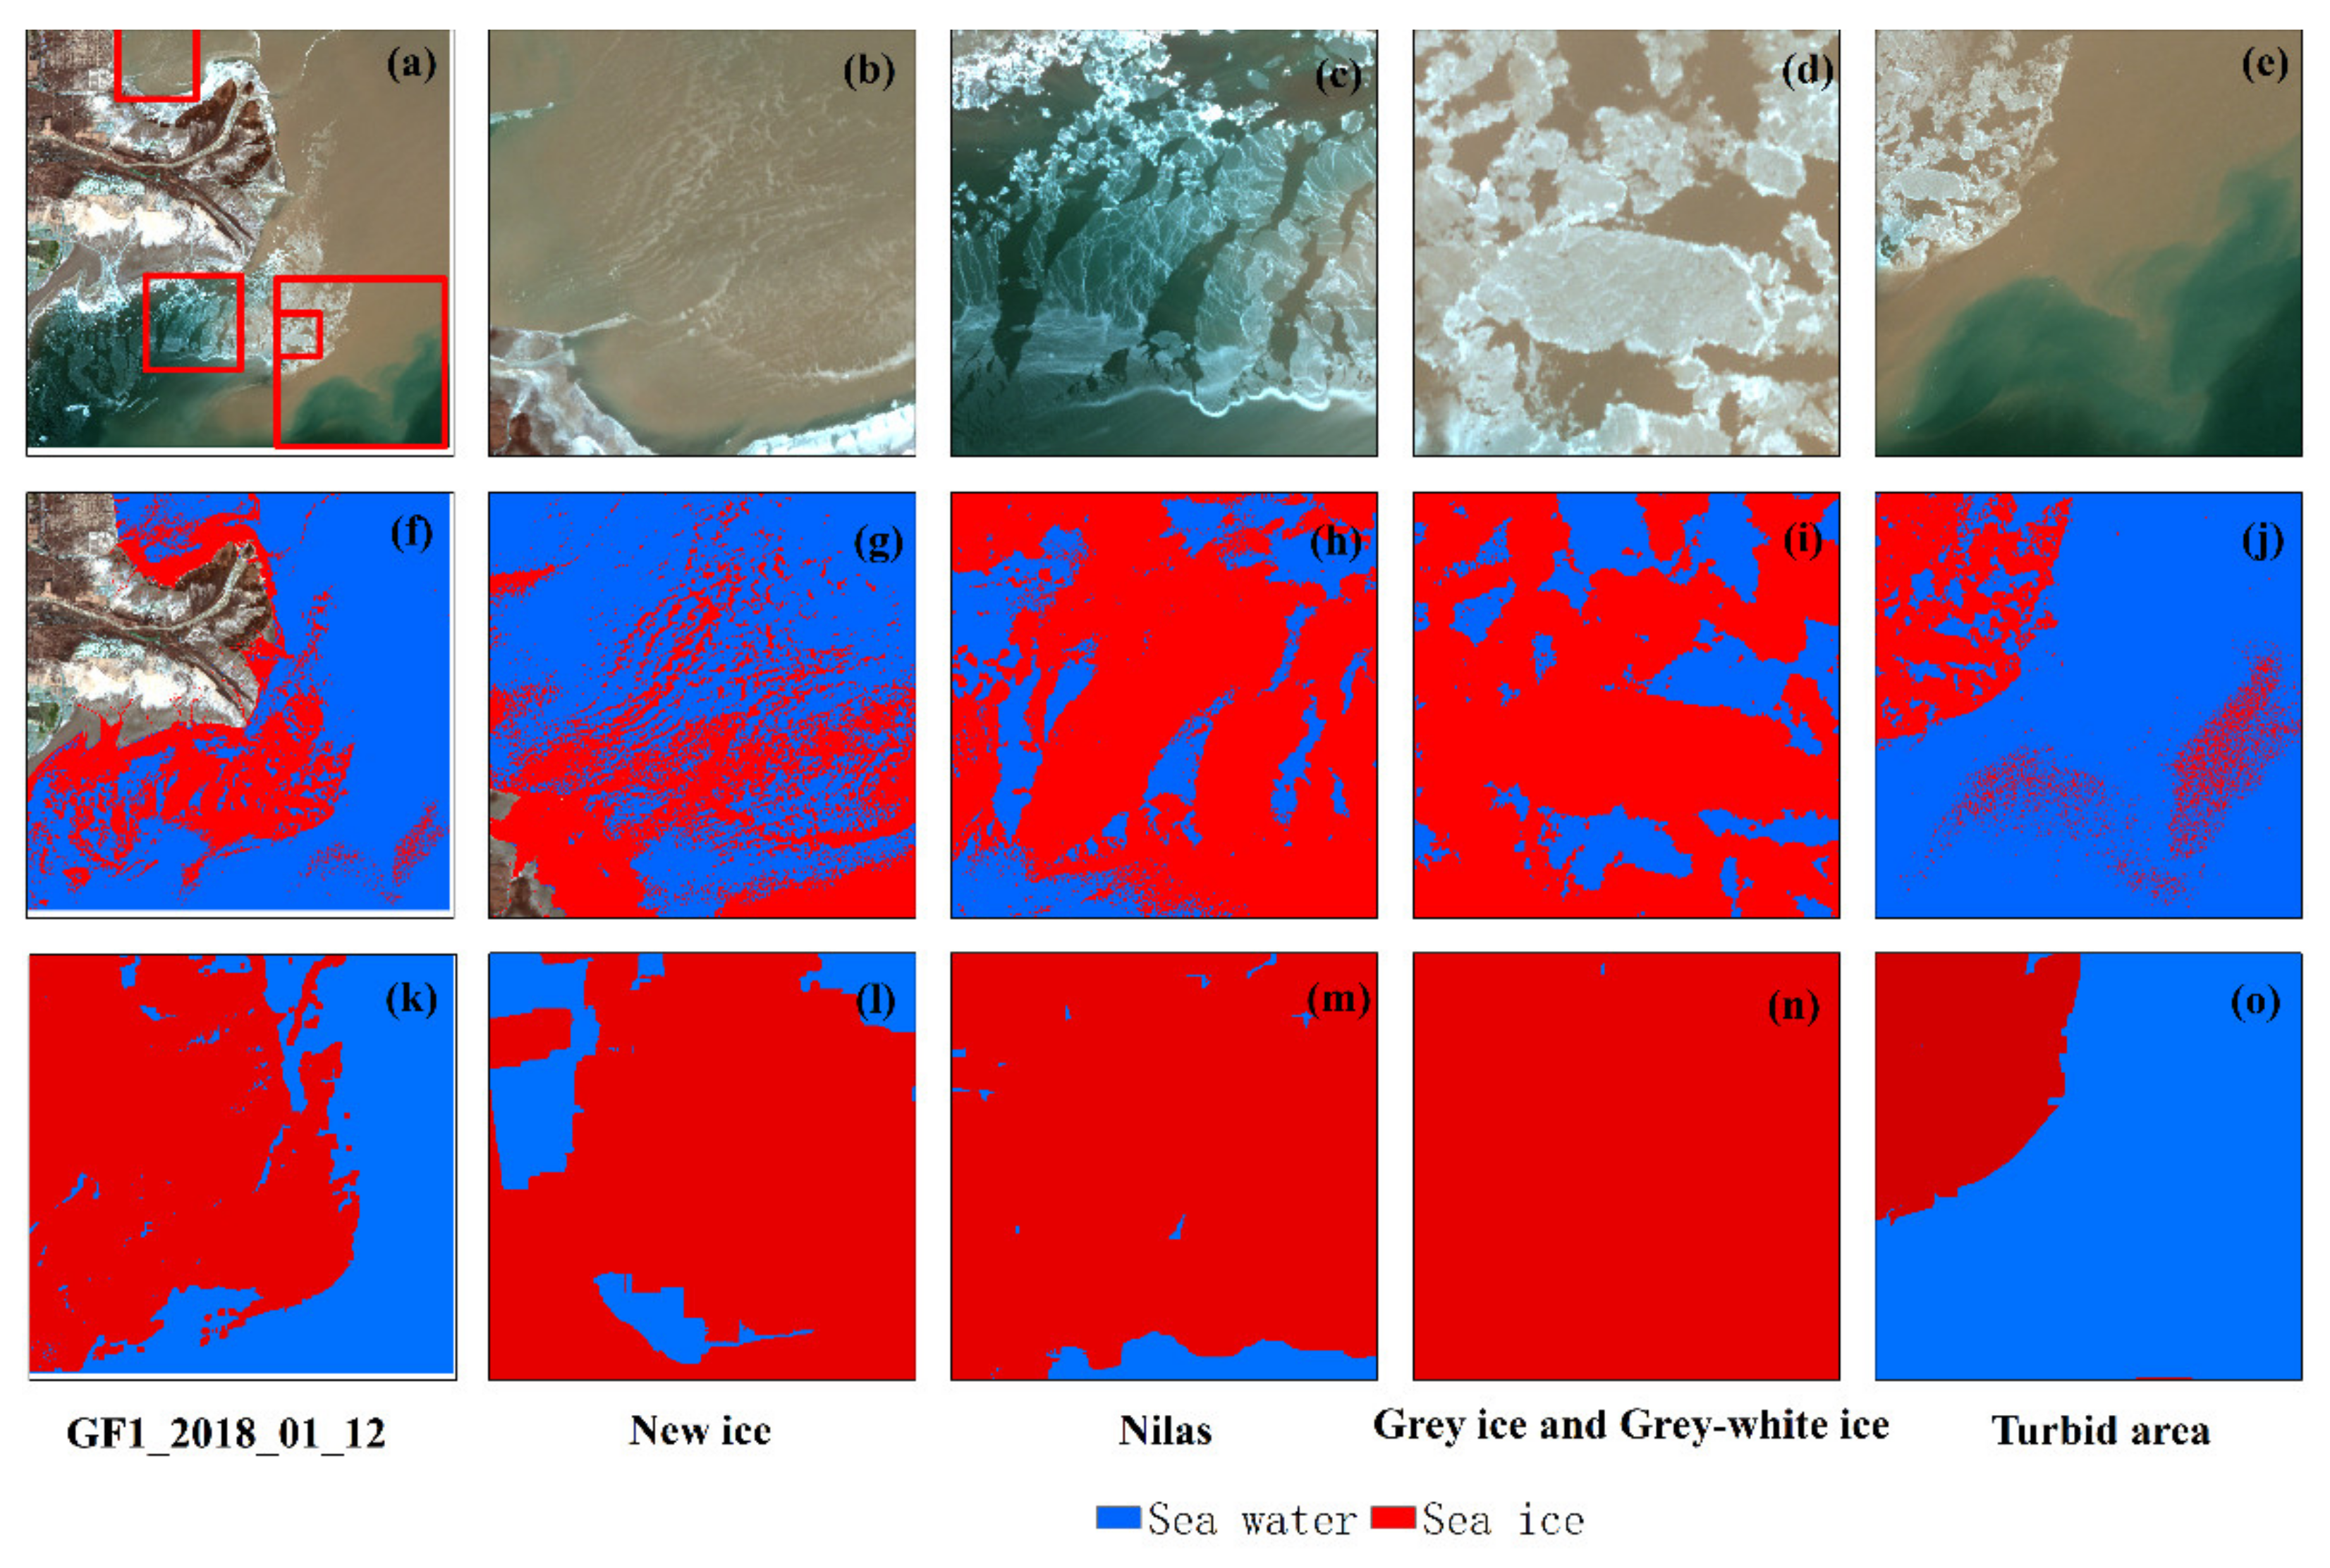
Based on a GF1 image acquired on 12 January 2018, 800 sea ice and seawater sample points were selected, and the sea ice spectral information index was used to plot the distribution ranges of the different types of sea ice and seawater reflectance values (
Figure 10). The results revealed that after the sea ice spectral information index was constructed, the reflectance values of the different types of sea ice were larger, while the reflectance values of the seawater were concentrated within a small interval, indicating that the sea ice spectral information index can effectively extract the sea ice spectral information.
The sea ice can be initially extracted by selecting a suitable threshold.
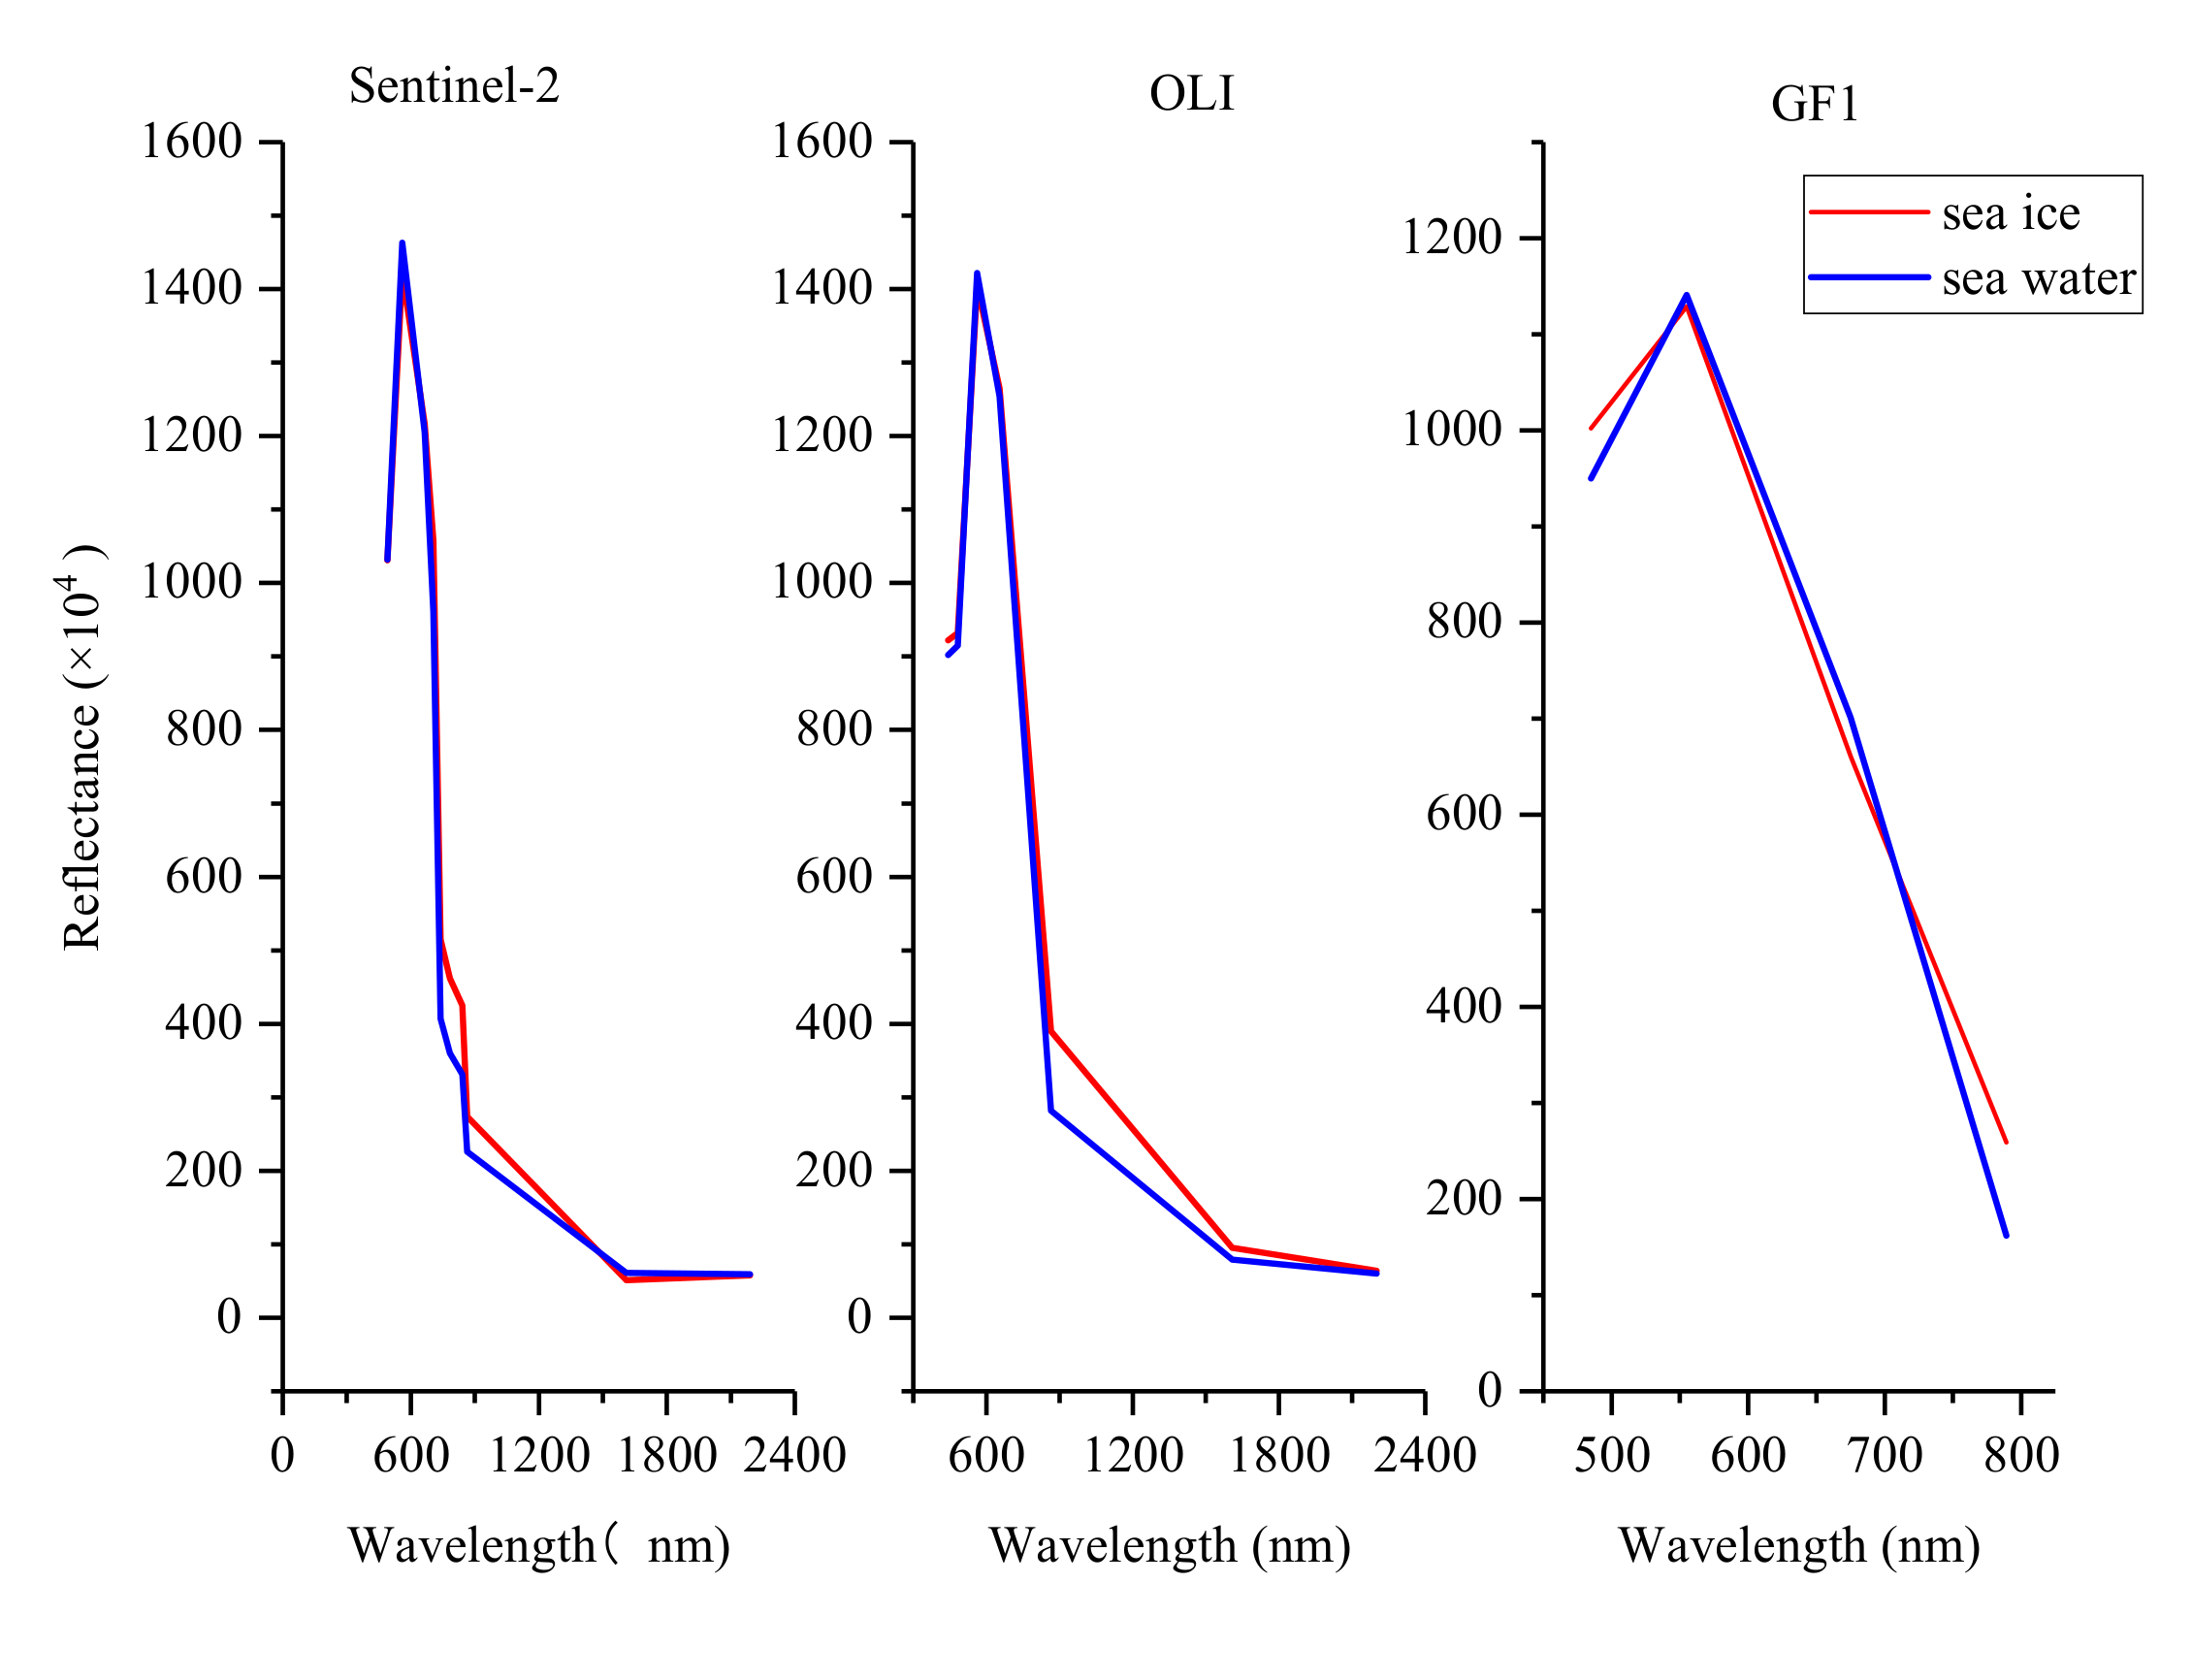
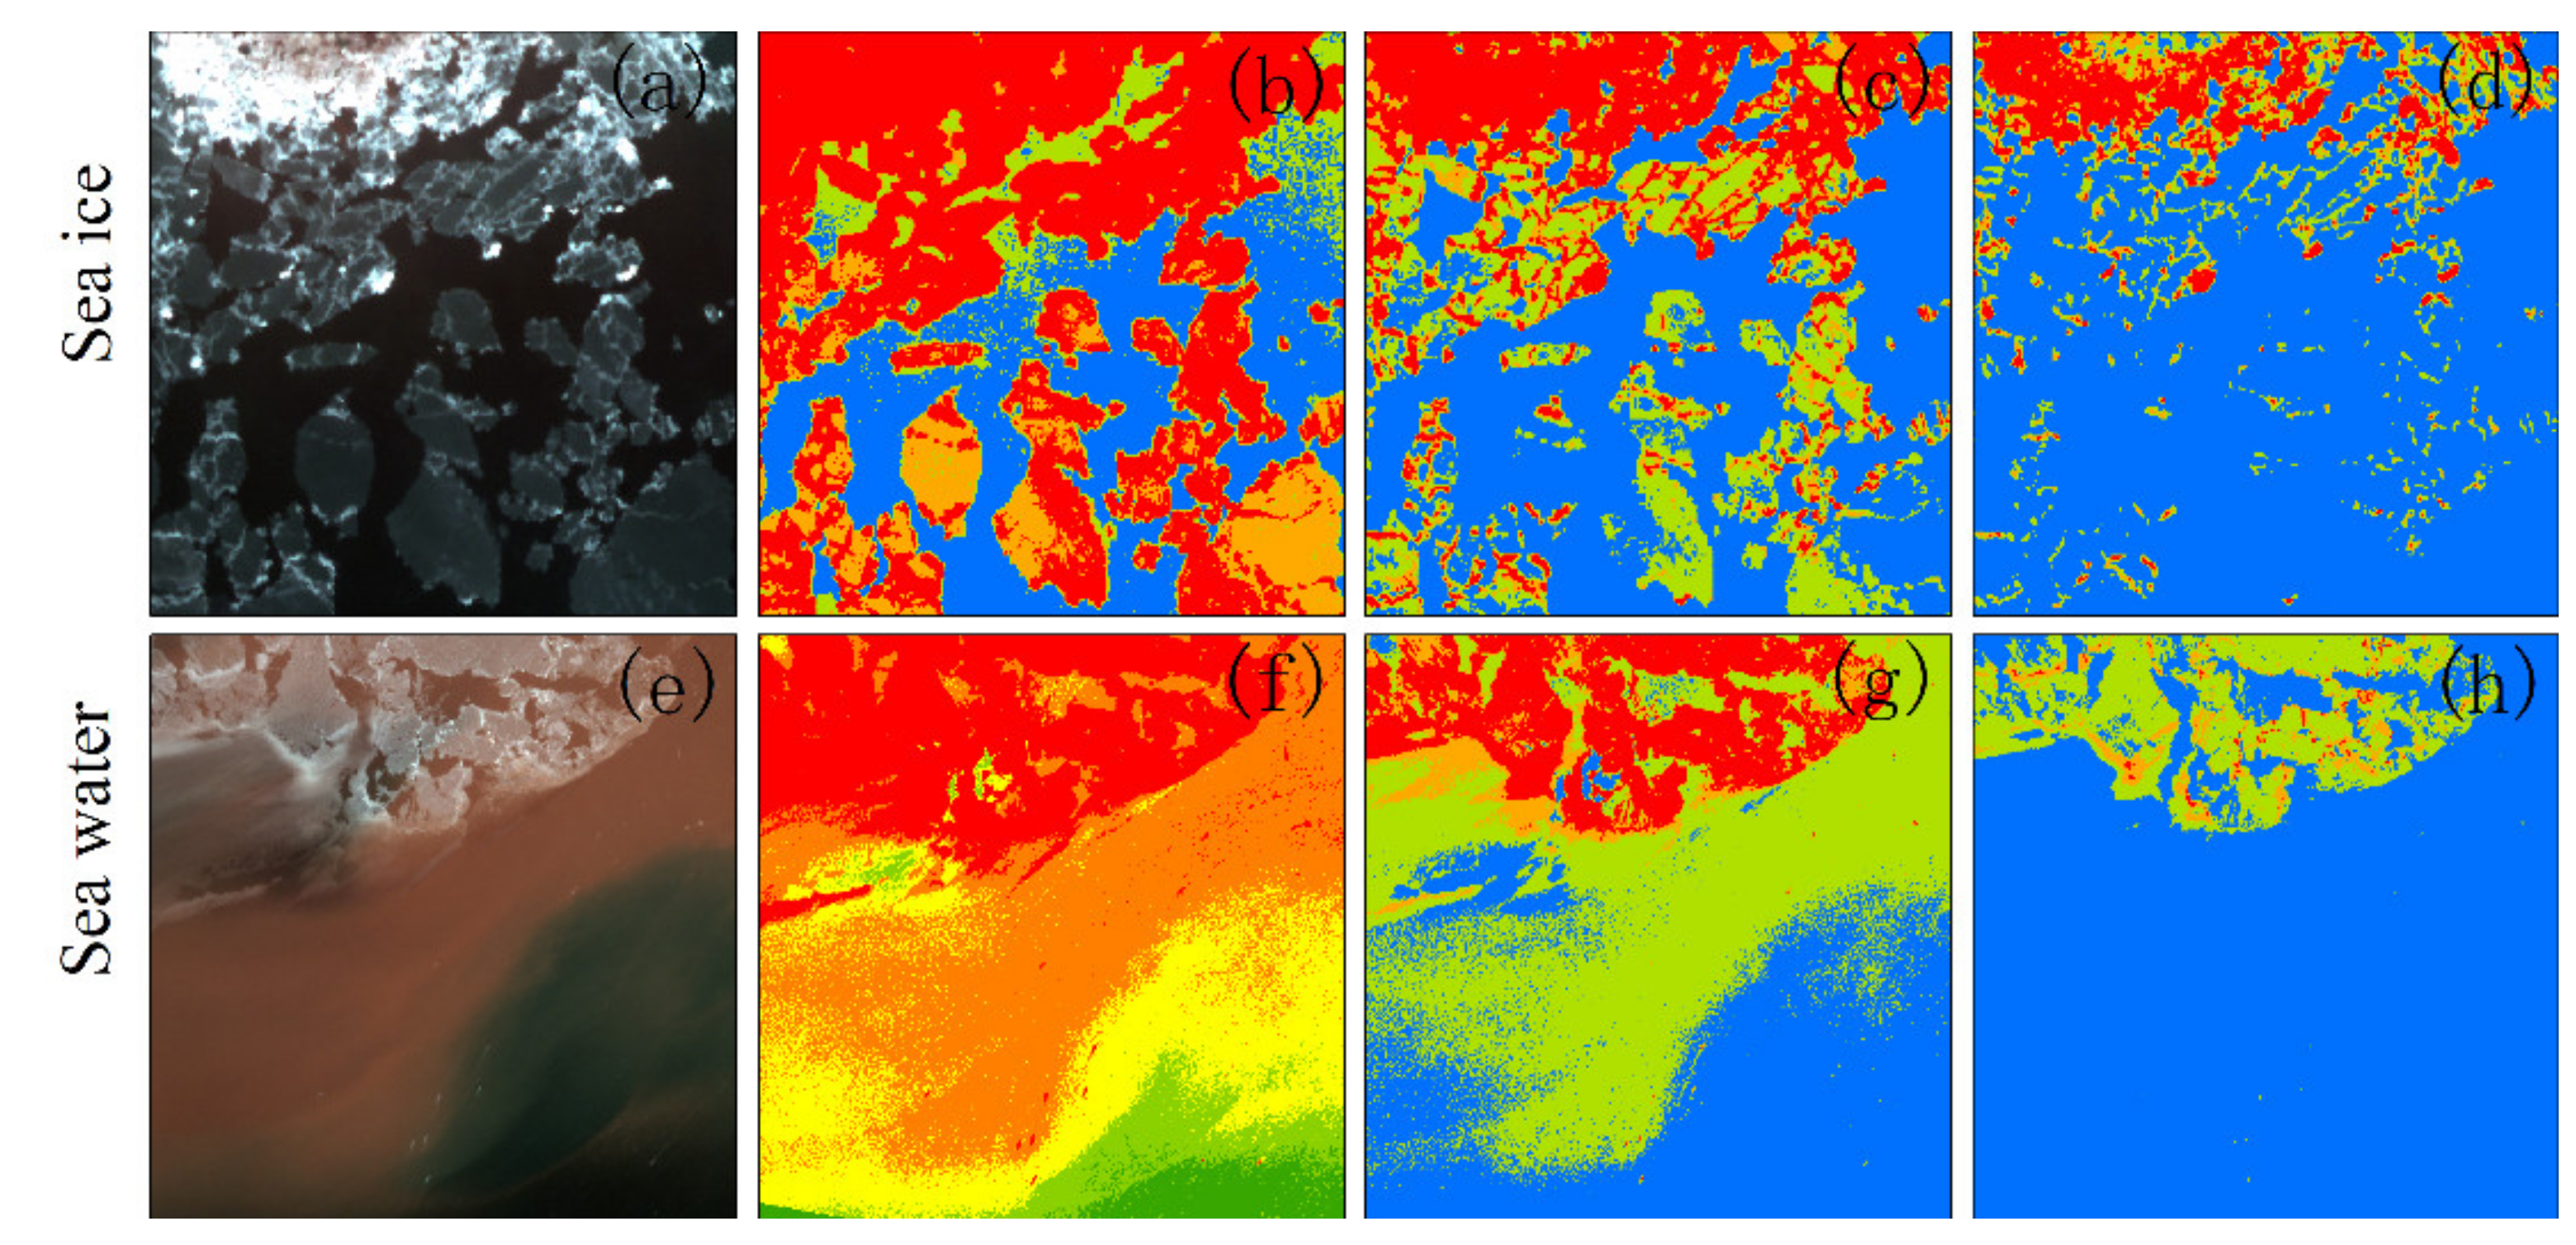
Figure 11 shows the sea ice extraction results. It can be seen that the sea ice spectral information index can effectively extract the sea ice in seawater with different suspended sediment concentrations. The new ice and ice rind in the high suspended sediment area can also be extracted more accurately. However, there are still some problems in the classification results. First, there is the salt and pepper phenomenon, which is a common problem in pixel-based classification methods. This will be solved by object segmentation and extraction. Second, there is still a small amount of confusion between seawater and sea ice in area c, which is mainly concentrated in the areas where the concentration of suspended particles changes drastically. This is because the seawater in these areas display spectral curves that are extremely similar to those of some of the types of sea ice such as new ice and ice rind, and this phenomenon is present in the GF1, Landsat, and Sentinel-2 images (
Figure 8). Therefore, it is not possible to completely distinguish between sea ice and seawater using only the spectral characteristics of the image, thus necessitating the addition of the spatial characteristics of the image.
3.2. Optimization of Spatial Feature Extraction Scheme
Scheme 1: The textural feature parameters based on the gray-level co-occurrence matrix mainly include the quantization level, the size of the moving window, and the movement direction and step length. Since the directional characteristics of sea ice are not evident, default values (0,1) were used for the movement directions of the x-axis and y-axis. Moreover, the movement step length was set to a default value of 1. The following section only discusses the quantization level of the gray-level co-occurrence matrix and the moving window size in detail.
Without compressing the gray level of the original image, the size of the gray level co-occurrence matrix is the square of the gray level of the original image, which will greatly increase the calculation load of the gray level co-occurrence matrix. Therefore, in practical applications, in order to improve the efficiency of the calculation of the textural features, the gray level of the original image is usually compressed, and quantization levels of 64, 32, and 16 are generally used.
Figure 12 shows the characteristics of the sea ice and seawater in the GF1 images under different quantitative levels. It can be observed that the images with 64 quantization levels maintain the textural characteristics of the original images better; the images with 32 quantization levels display a reduced ability to maintain details; and the images with 16 quantization levels have lost a significant amount of textural information. Therefore, the higher the quantization level, the better the textural details of the original image are preserved. However, images with high quantization levels are not suitable for the extraction of sea ice textural information.
Figure 13 shows the four textural feature indexes of the homogeneity, dissimilarity, entropy, and second moment under different quantization levels. Due to the drastic changes in the concentration of the suspended sediment in the Yellow River Delta, the images with 64 quantization levels exhibit a large amount of speckle noise in the seawater area. In the 32 quantization level images, this speckle noise is greatly suppressed. In addition, since the calculation load increases with increasing quantization level, the calculation efficiency is lower. Therefore, the quantization level of the gray-level co-occurrence matrix was finally set to 32.
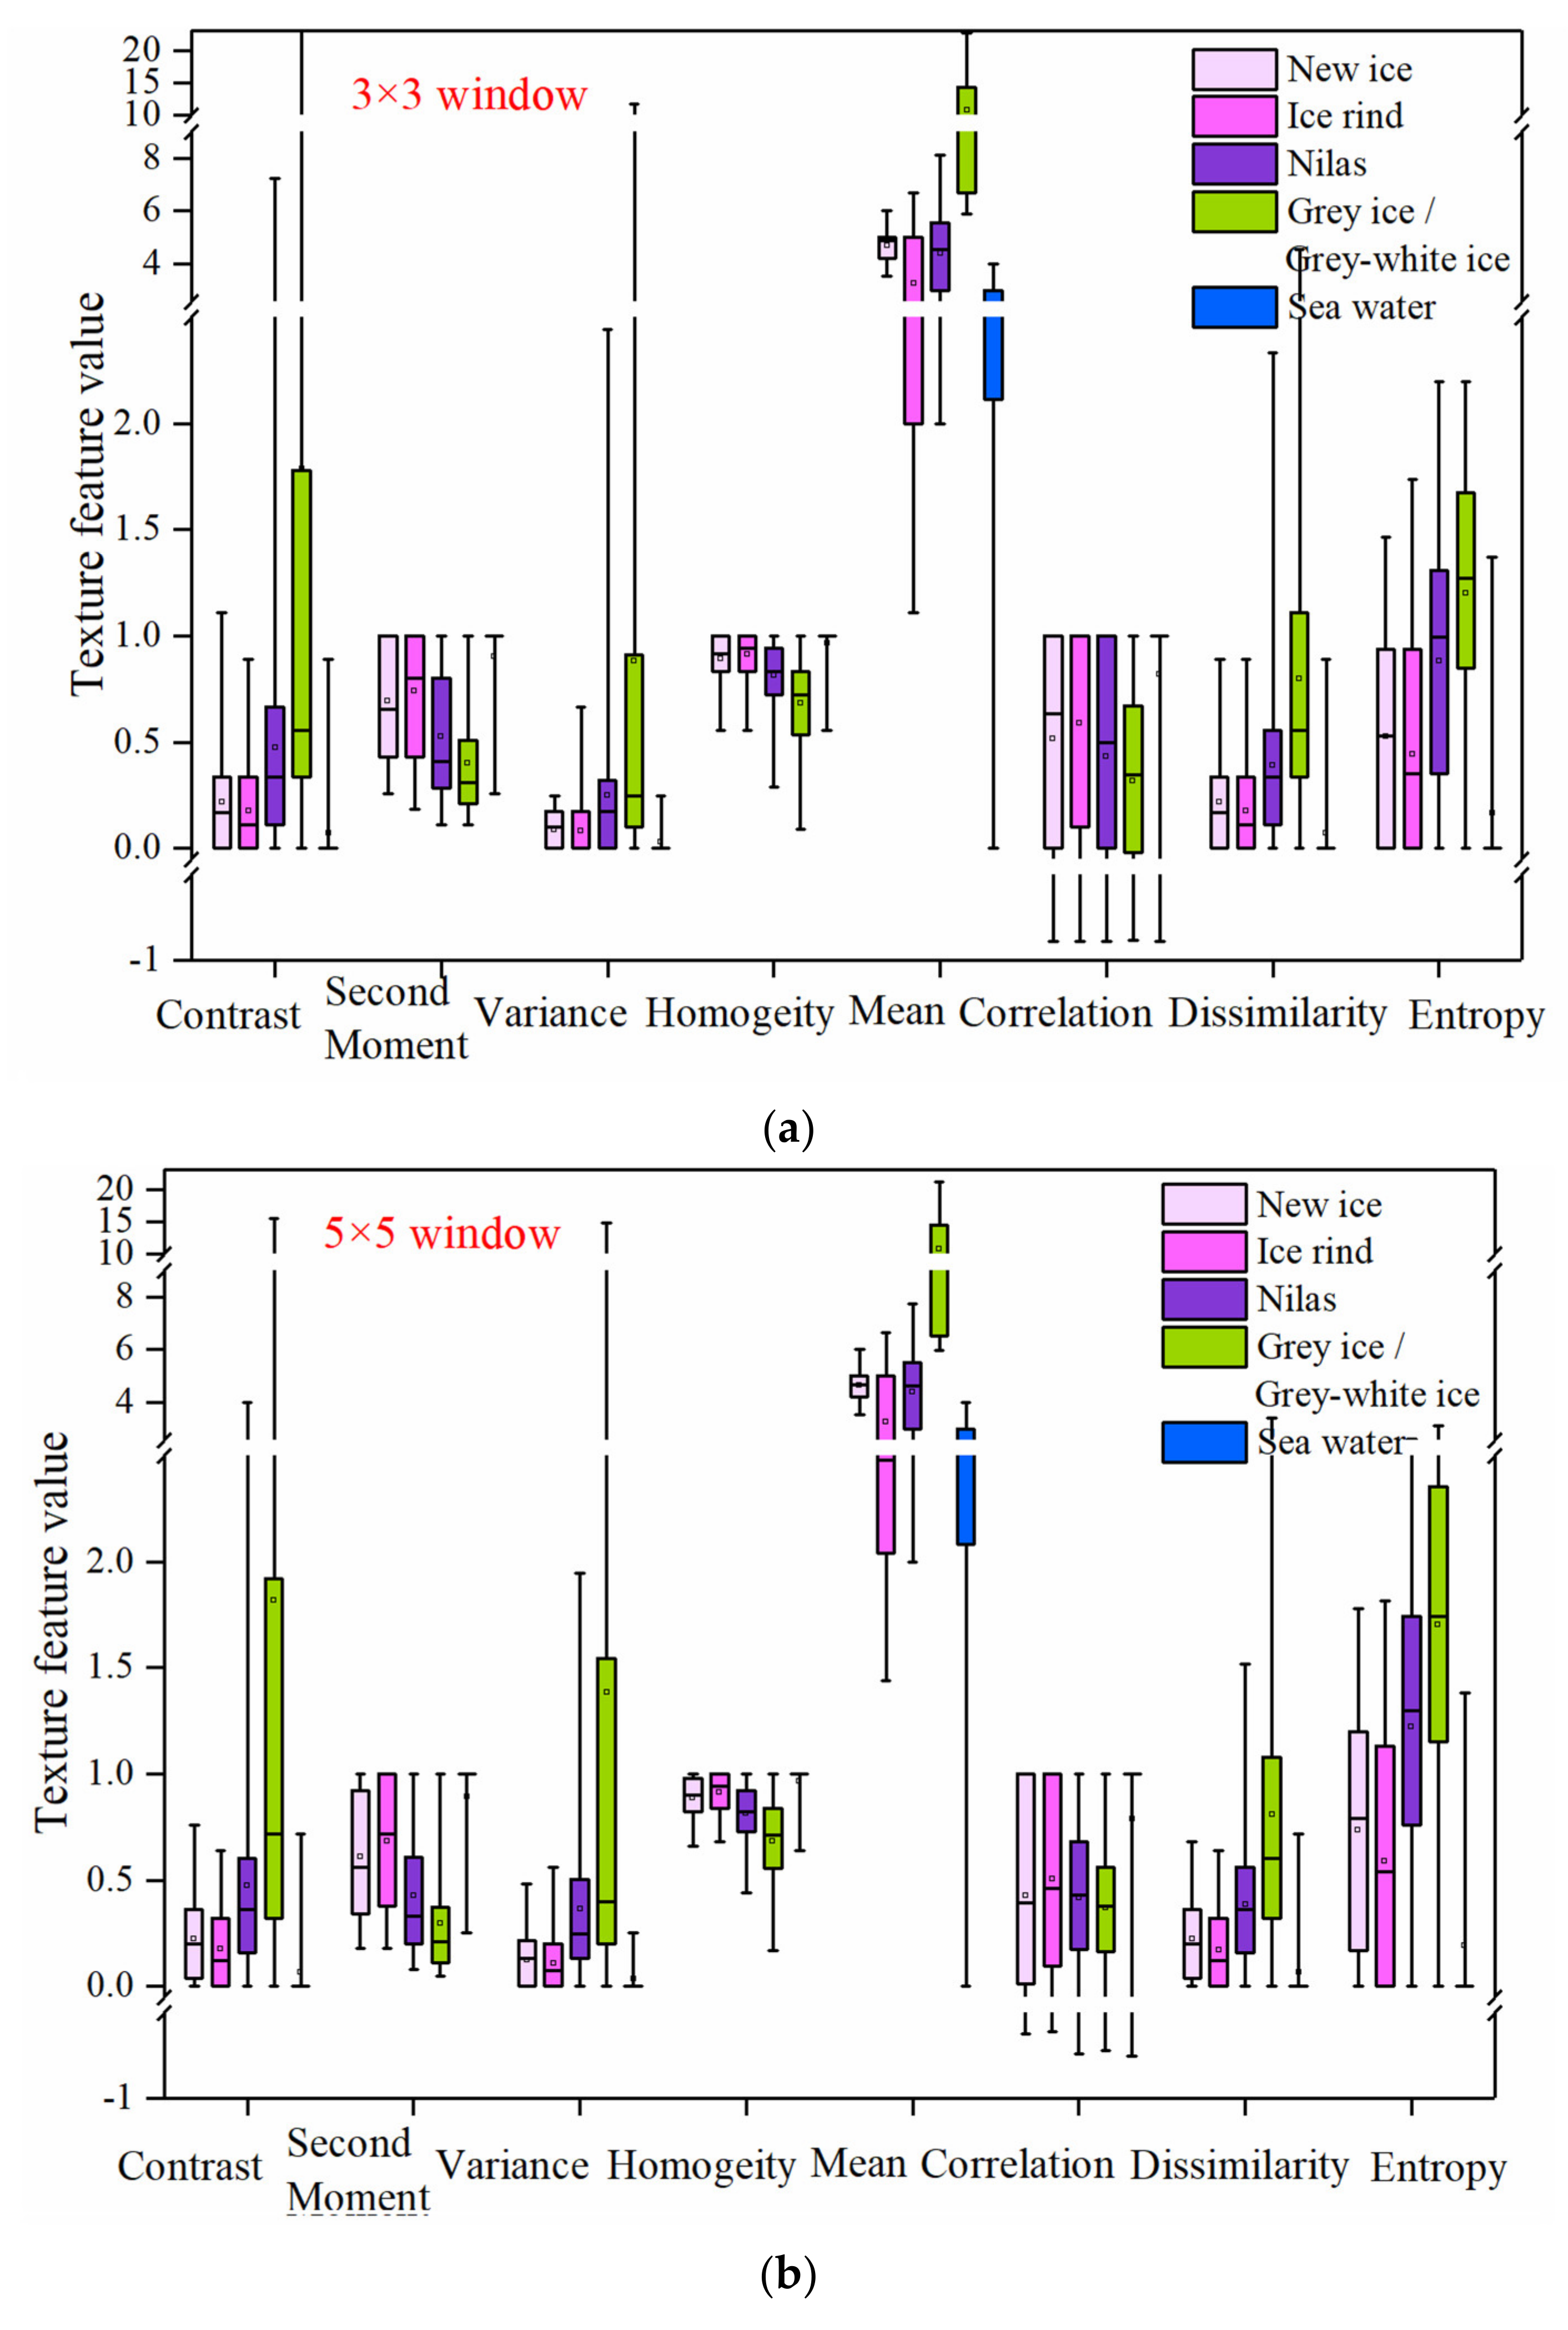
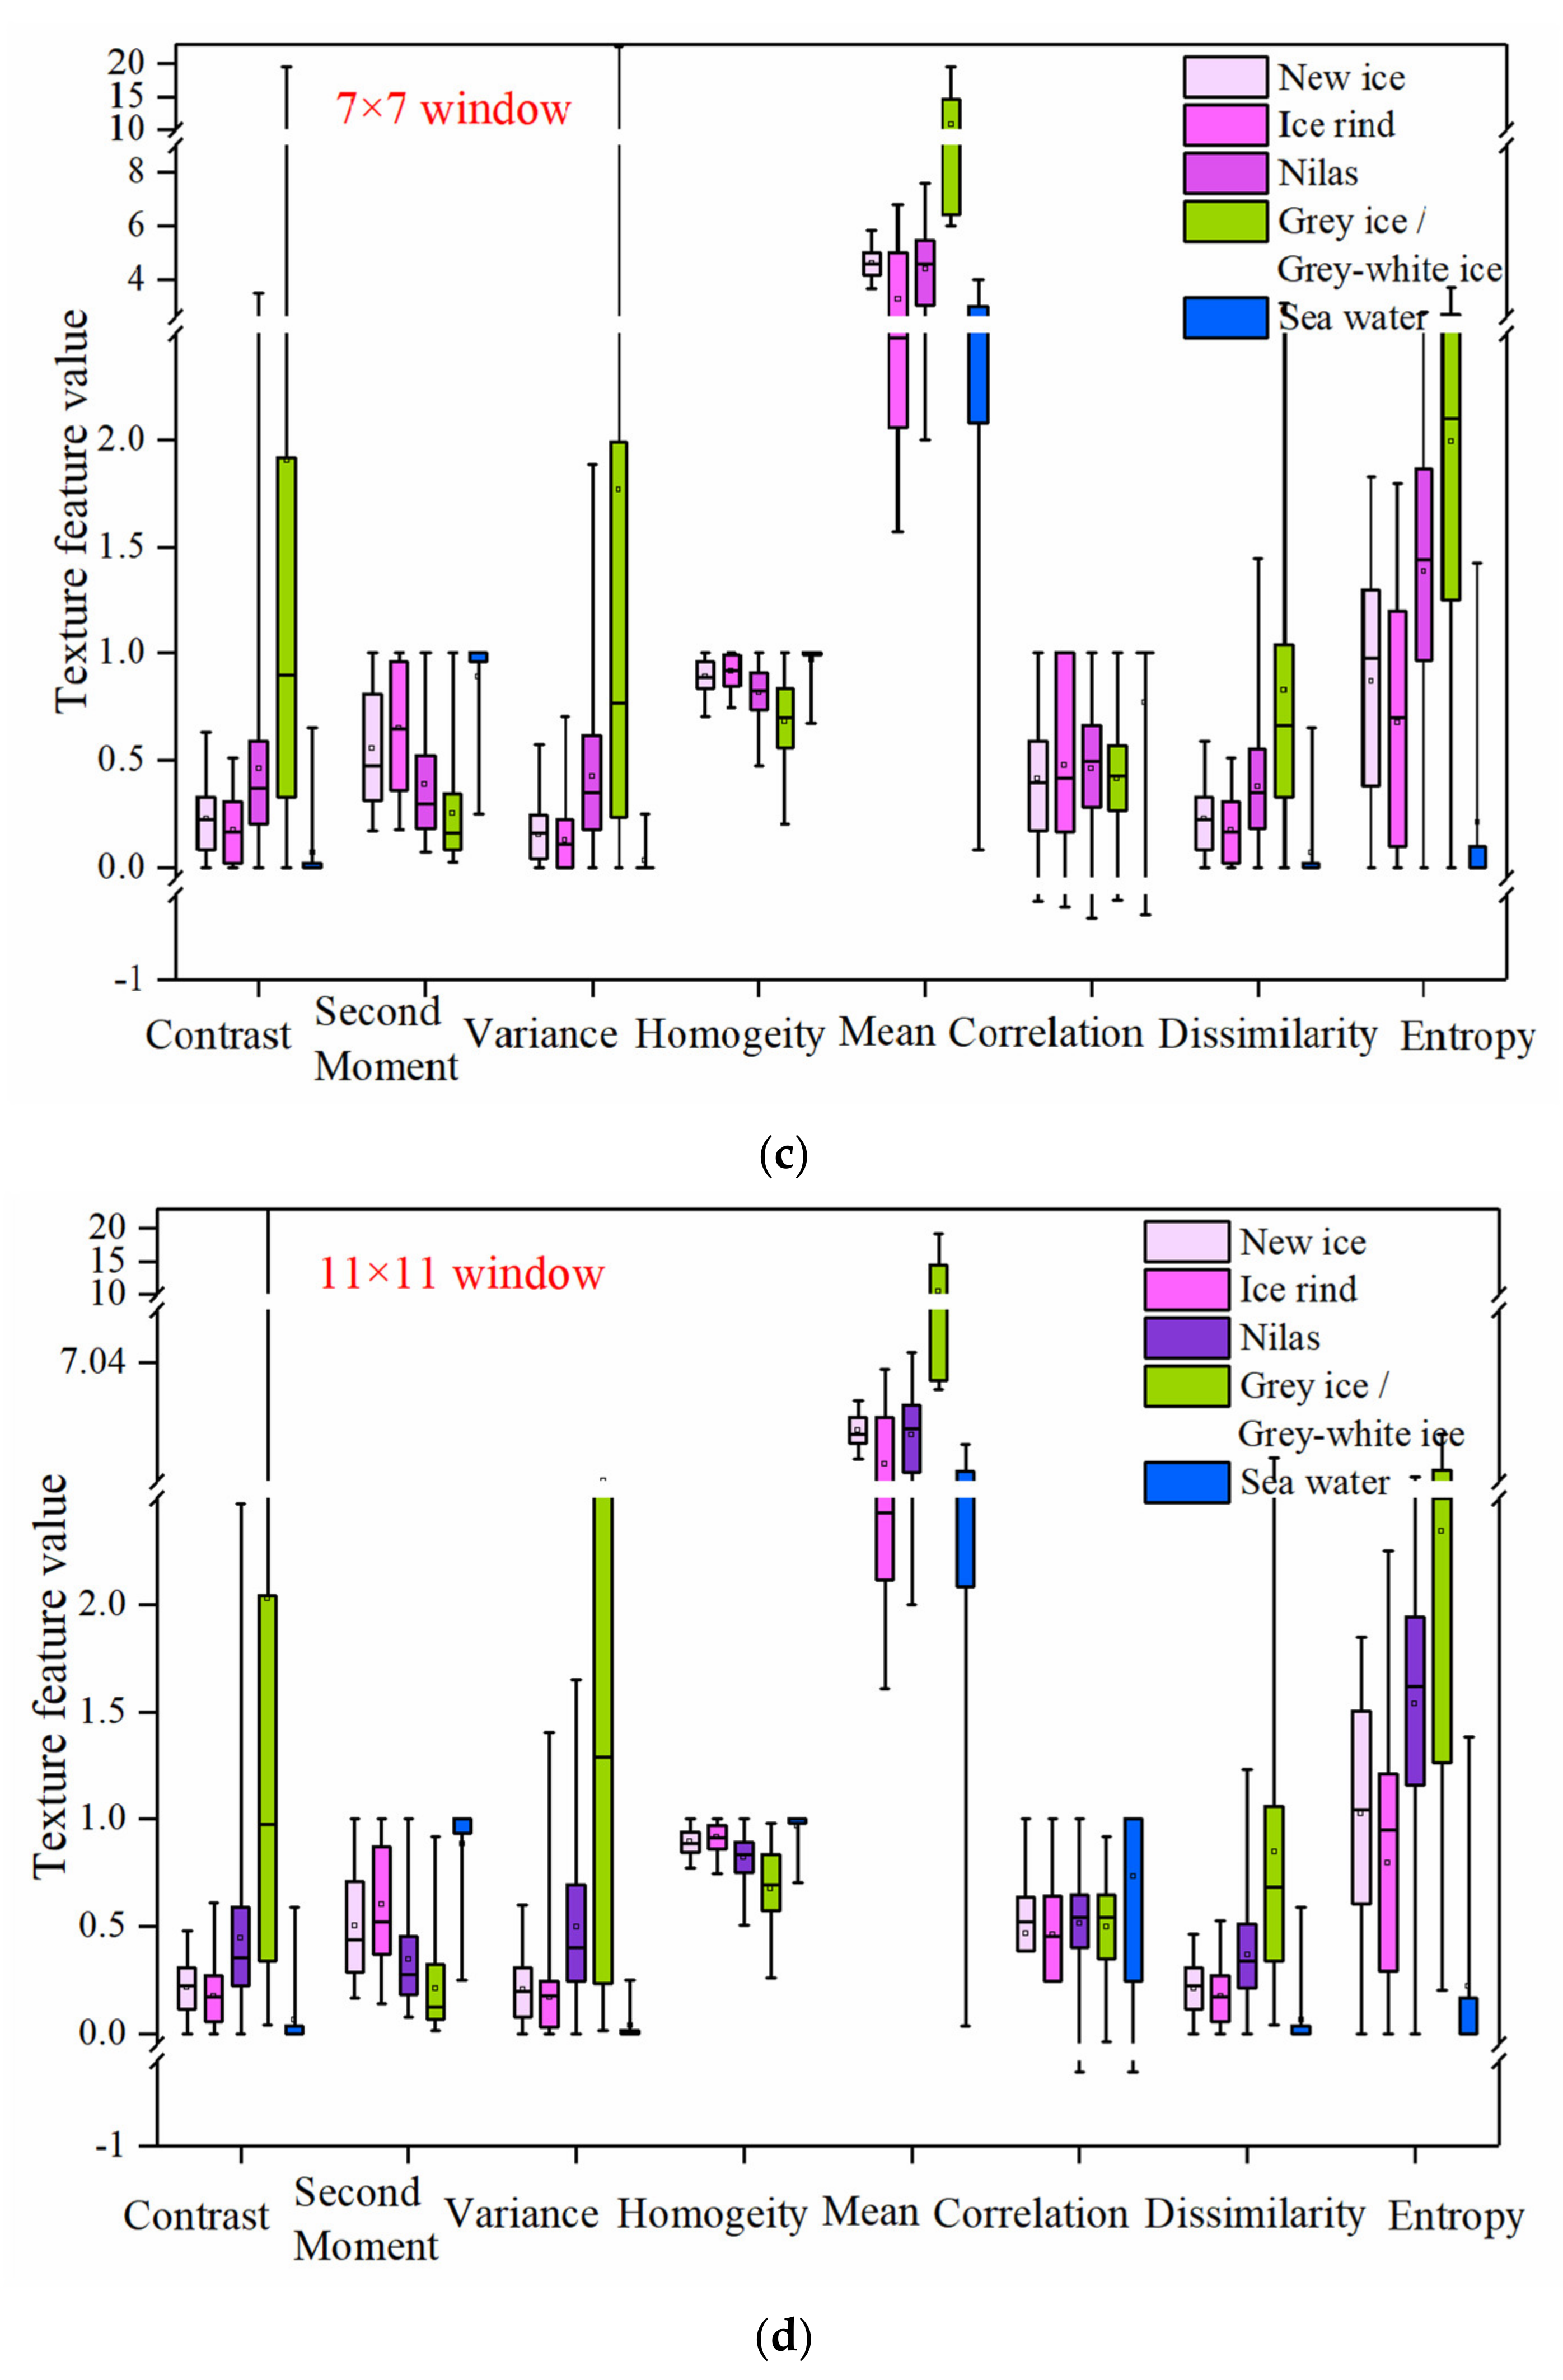
The moving window is an important factor that affects the textural feature extraction of the gray-level co-occurrence matrix.
Figure 14 shows the distribution range of the textural feature values of various types of sea ice and seawater for different window sizes. It can be seen that the size of the window has little effect on the textural characteristics of the sea ice and seawater, but as the texture window increases, the calculation load increases greatly, thus the window size selected in this study was 3. Based on the statistical results of the textural feature index values of the various types of sea ice and seawater, grey ice and grey-white ice have a higher degree of discrimination from seawater in terms of each textural feature value. The types of thin ice such as new ice, ice rind, and nilas cannot be completely distinguished from the textural characteristics of seawater. This is because the surfaces of the ice rind and nilas are relatively smooth, which is similar to the textural characteristic value of seawater. The surfaces of grey ice and grey-white ice are rough, and the textural characteristic value of seawater is quite different.
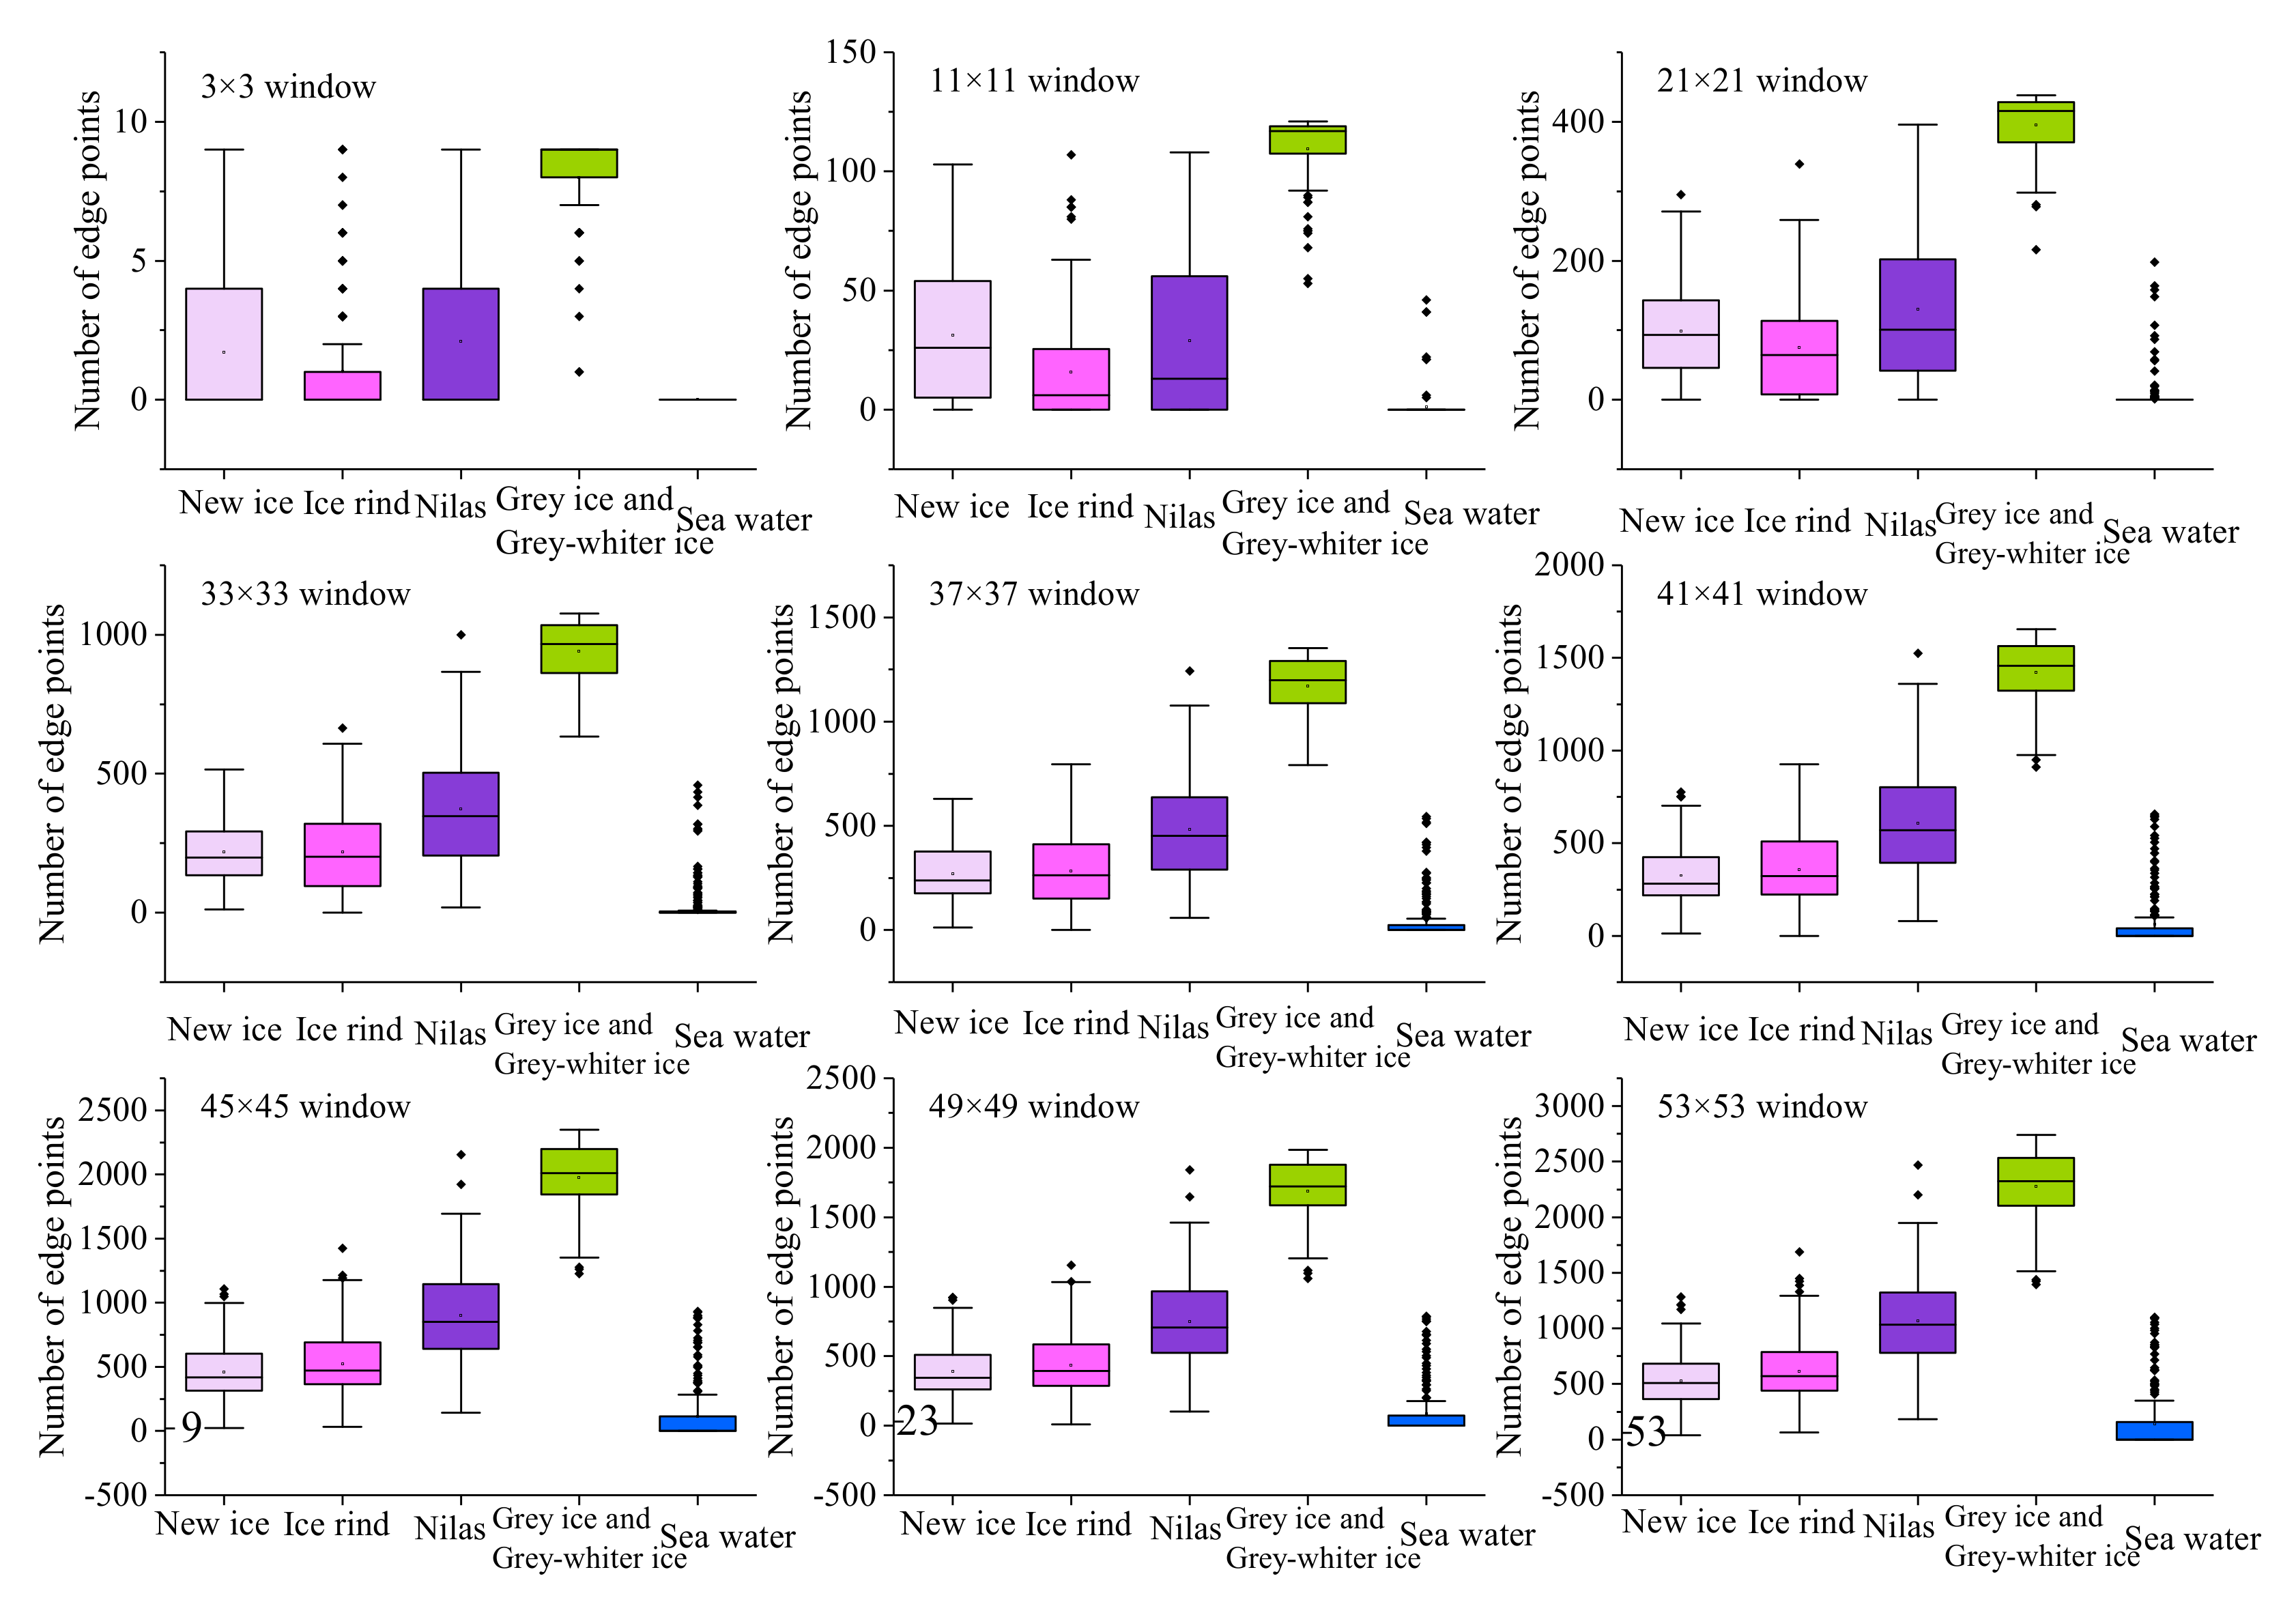
Scheme 2 uses the Sobel operator to generate an edge point density map to highlight the edge features of the sea ice. The distribution ranges of the edge density values of the different types of sea ice and the seawater for different window sizes were calculated (
Figure 15), and the optimal calculation window size for the sea ice edge points was compared and analyzed.
When the window was small, the edge density value of the seawater basically approached 0, and the edge density values of the grey ice, grey-white ice, and seawater were significantly different. The edge density values of the new ice, ice rind, nilas, and seawater partially overlapped. The overlapping area mainly contained the inner smooth sea ice. As the window size increased, the number of edge points that were detected inside the thin ice region such as new ice, ice rind, and nilas increased, and the edge point density value gradually increased. When the window size reached 45, the edge point density values of the various types of sea ice were significantly different from those of the seawater. As the window continued to grow, it greatly increased the amount of calculation load, thus 45 was selected as the best window size.
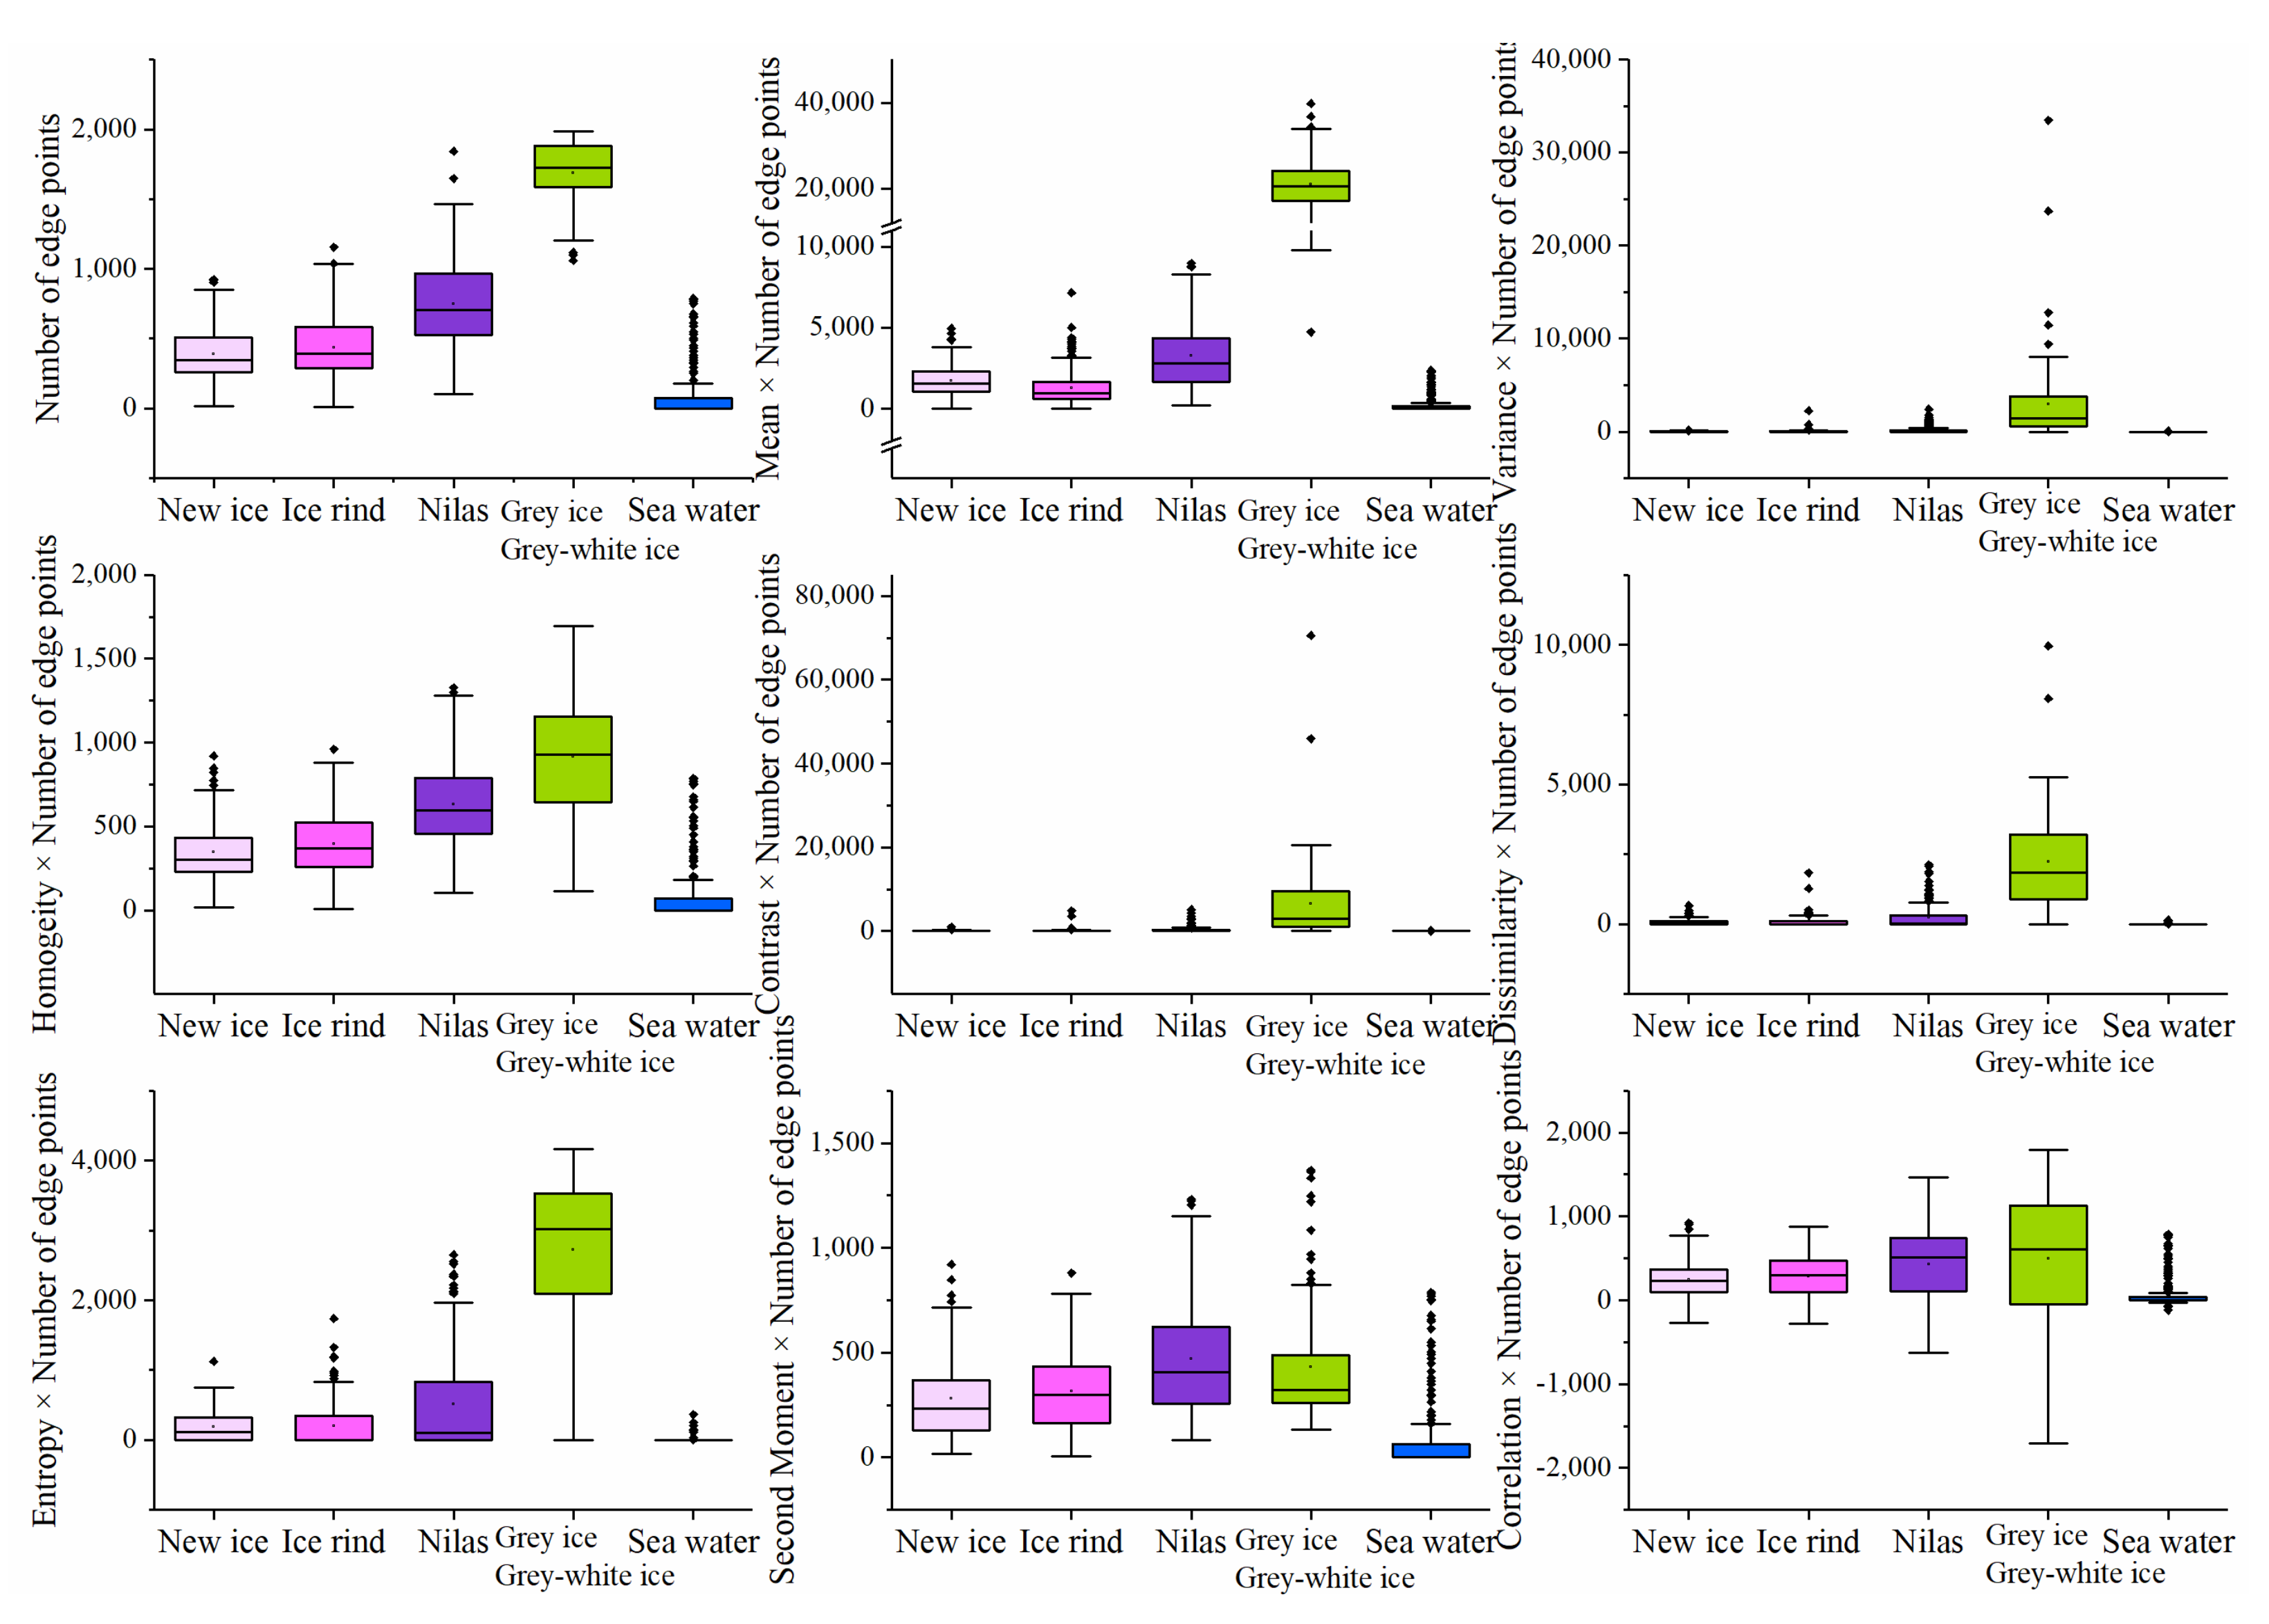
In Scheme 3, the texture feature window size was set to 3 × 3, and the quantization level was set to 32. After the edge point density map was combined with the various textural feature indicators, the distribution ranges of the various types of sea ice and the seawater were determined (
Figure 16). It can be seen from
Figure 16 that the combination of textural feature indicators such as the variance, homogeneity, and contrast with the edge point density map failed to produce a better extraction effect. After the mean textural feature was combined with the edge point density map, the range of the seawater decreased further and became more concentrated, and the distinction between the various types of sea ice and the seawater increased further. Therefore, the edge point density map combined with the mean textural feature index was selected as the final solution for extracting the sea ice spatial information.
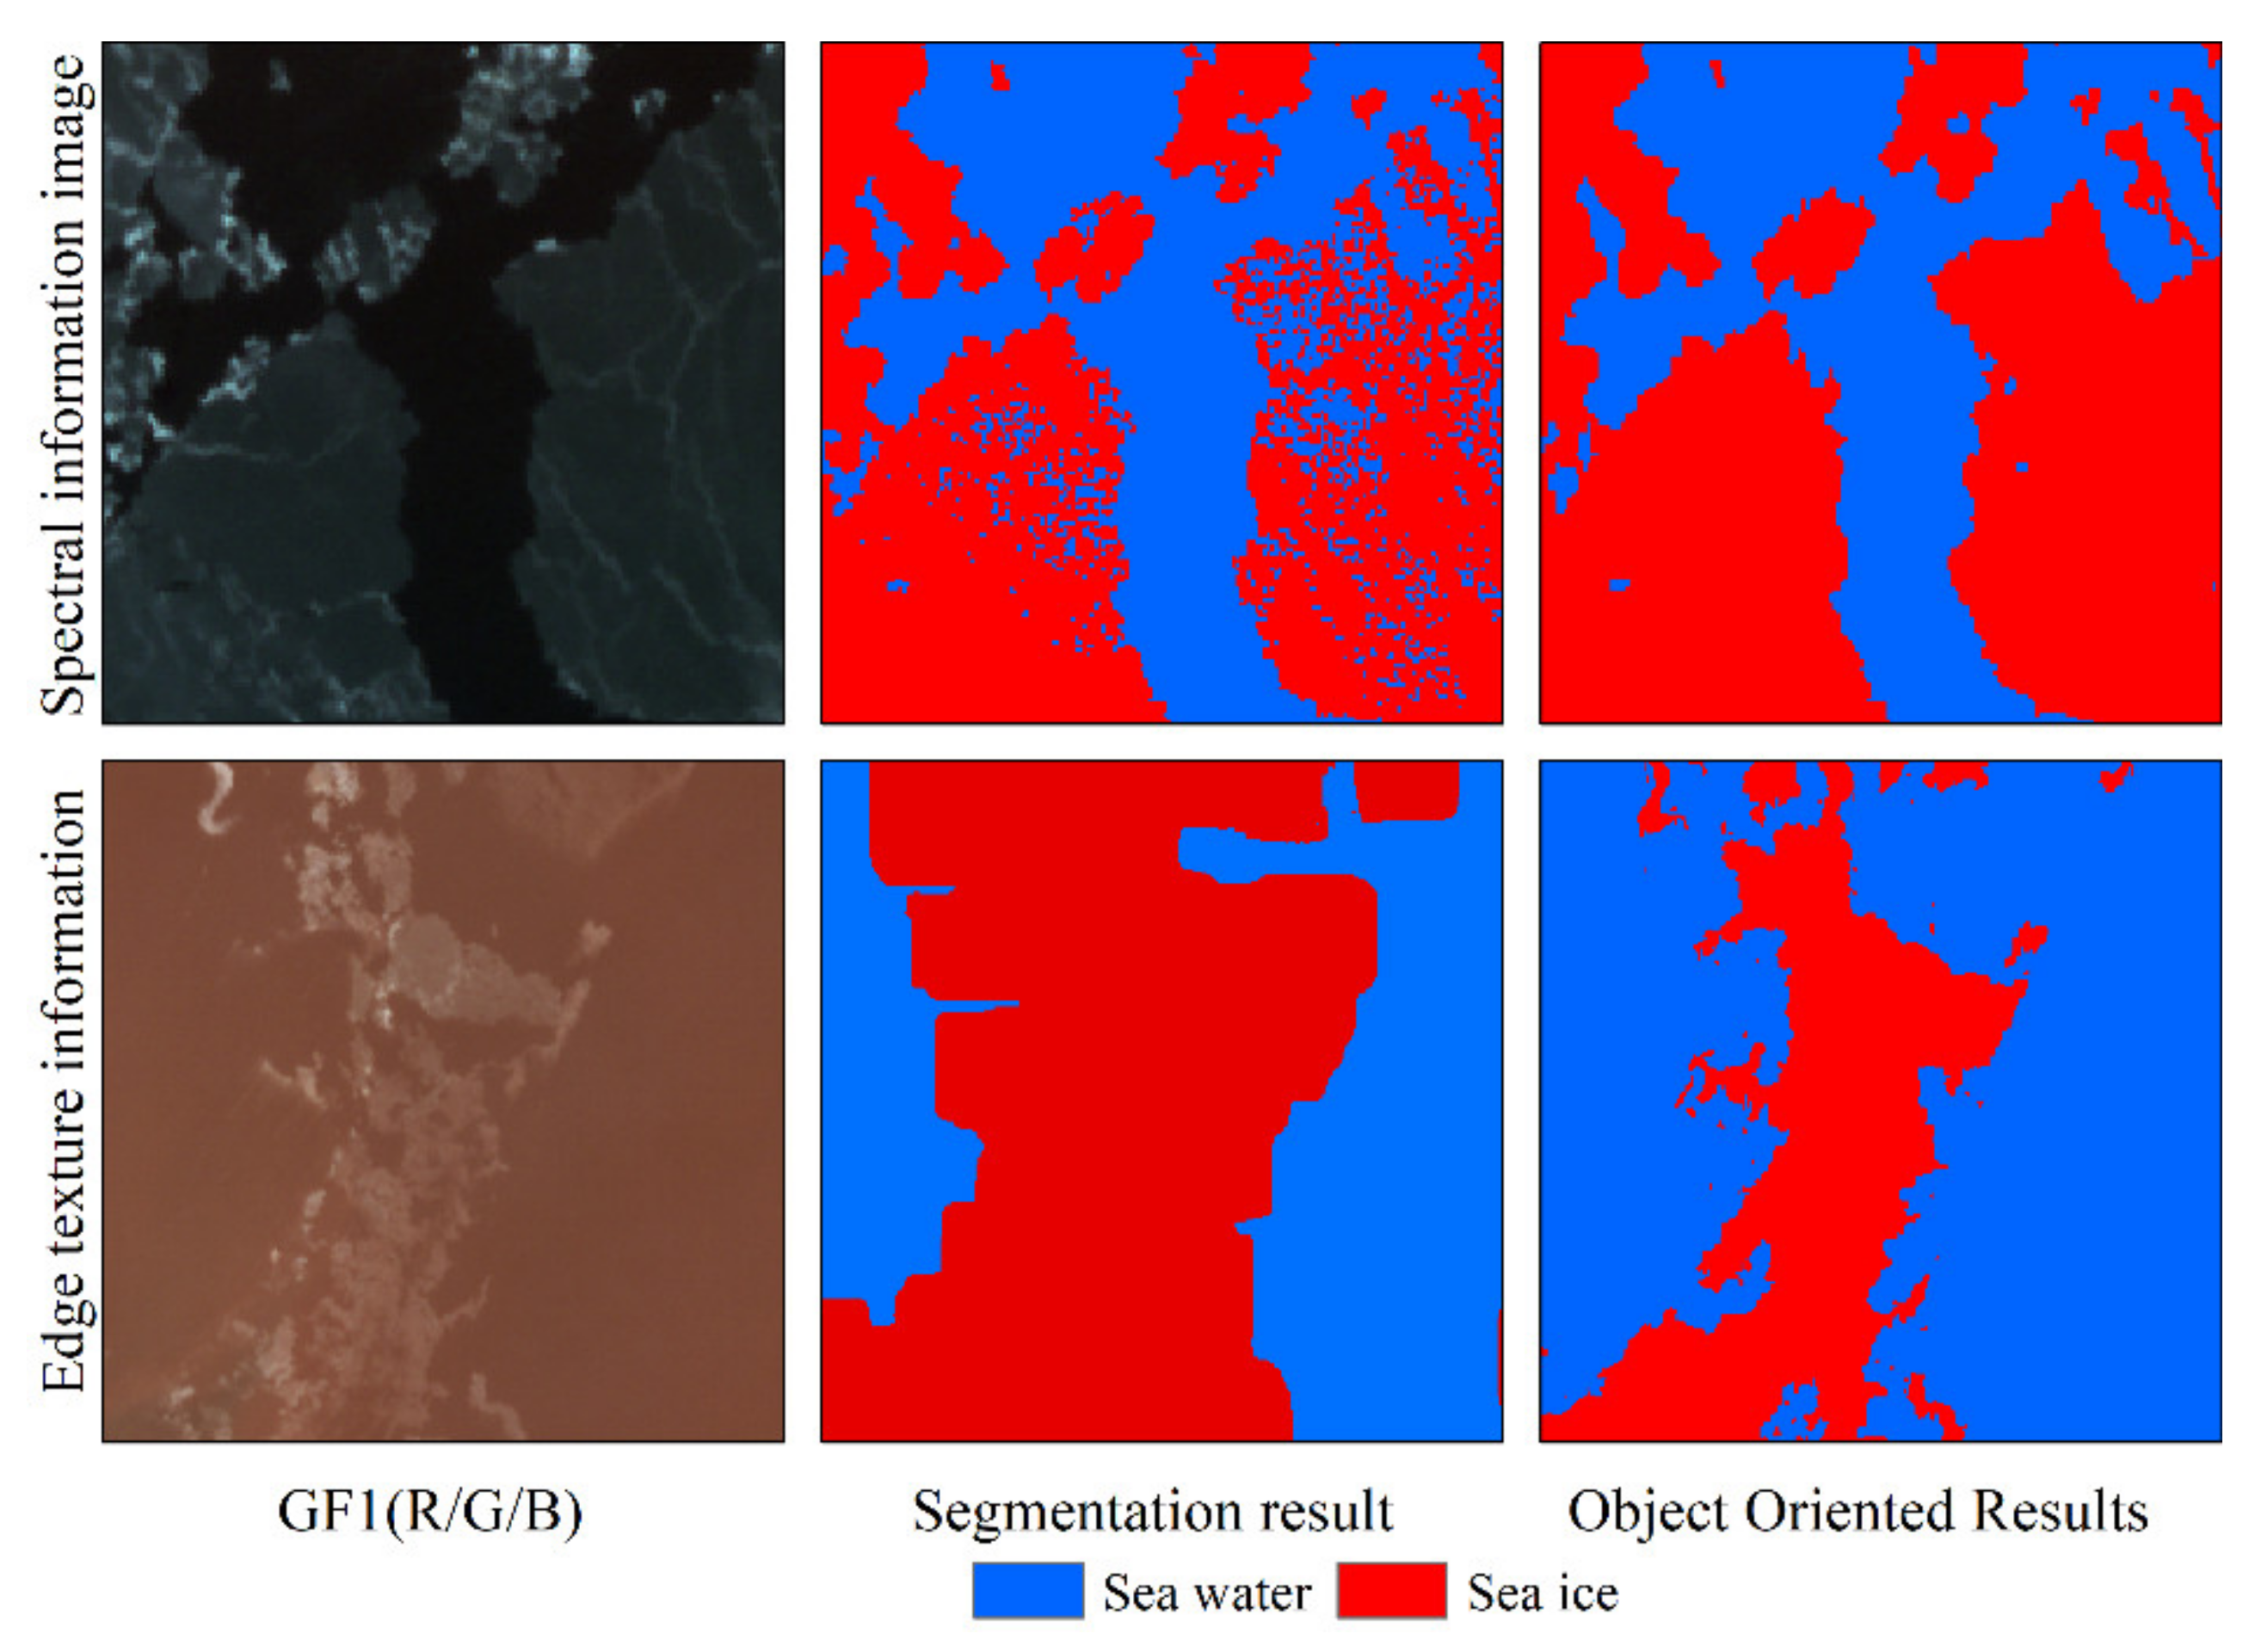
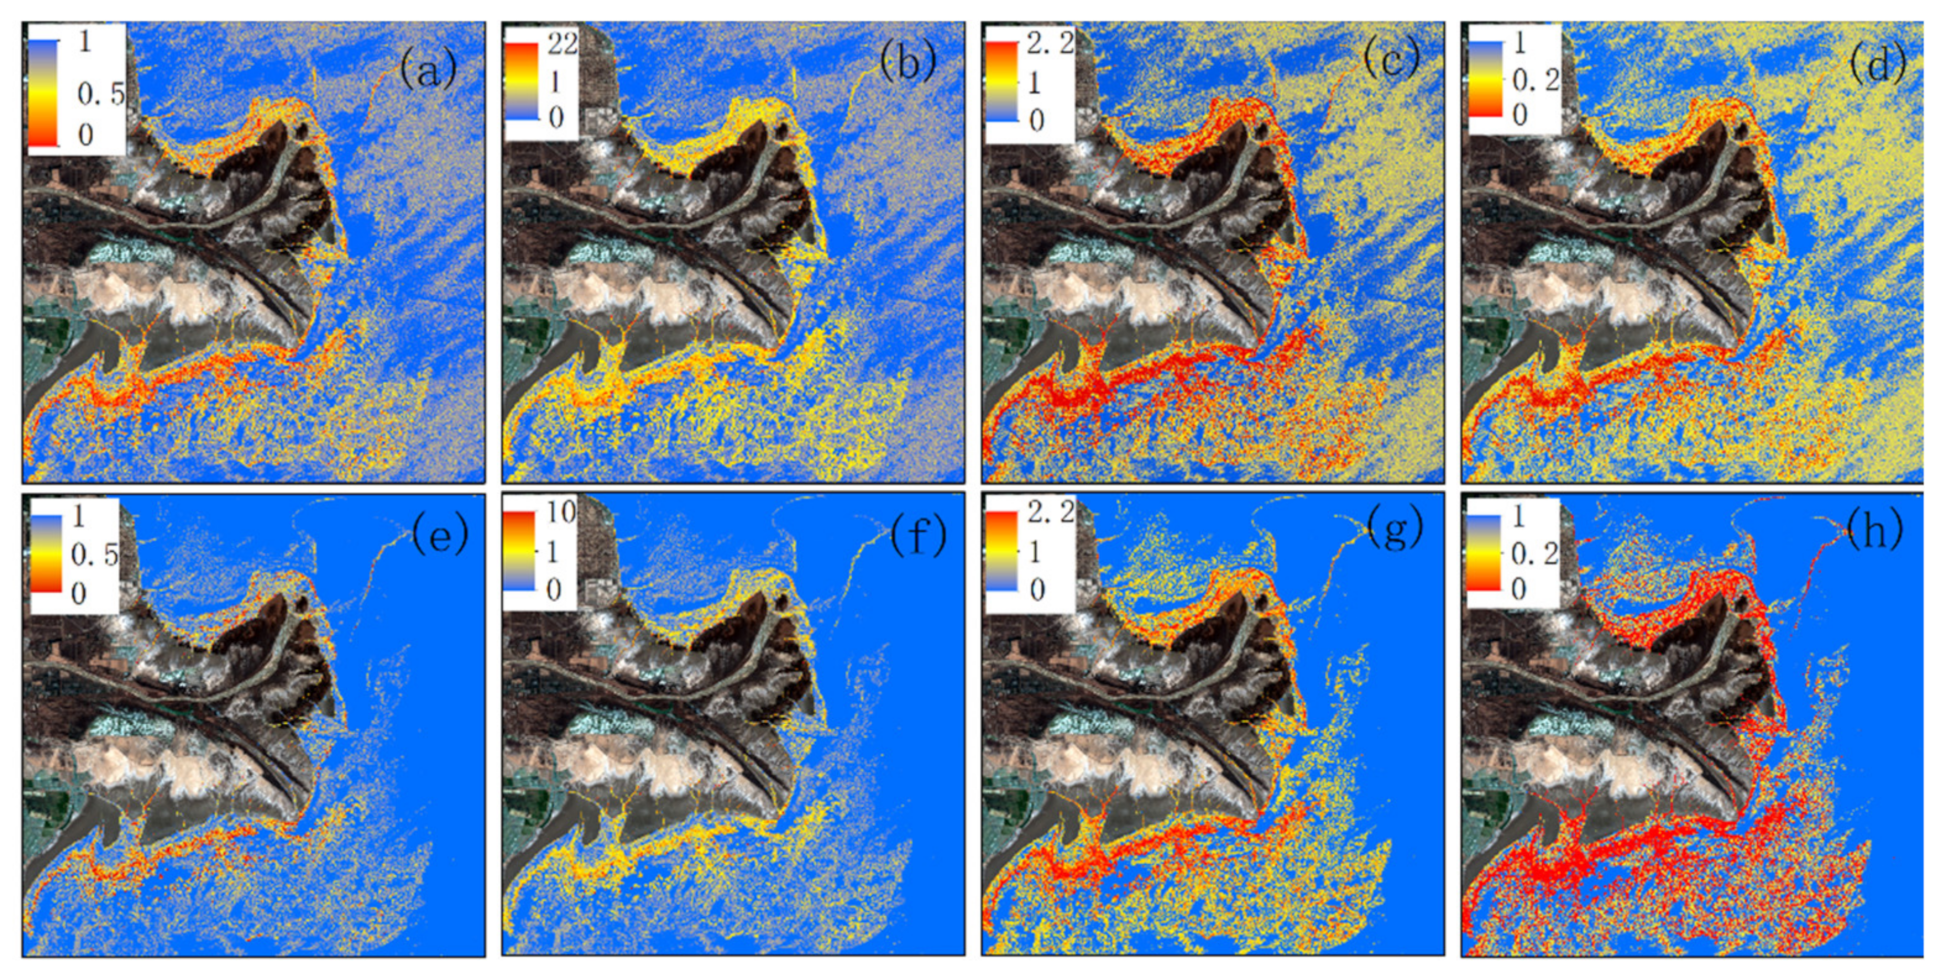
Figure 17 shows the comparison between the edge texture information extraction results and the spectral information extraction results. The edge texture image can extract the extent of the sea ice as a whole and can extract the types of ice such as new ice, nilas, grey ice, and grey-white ice. The most important factor is that the texture images at the edges can compensate for the similarity between the spectra of the sea ice and the seawater. As shown in
Figure 17j,o, the extraction accuracy of the spectral information is lower in areas where the concentration of the suspended particulate matter changes drastically. The edge texture images solve this problem. Although the seawater in the crevices between portions of ice can also be identified as sea ice, it can be combined with the spectral information to achieve a more accurate sea ice extraction.
3.3. Accuracy Verification
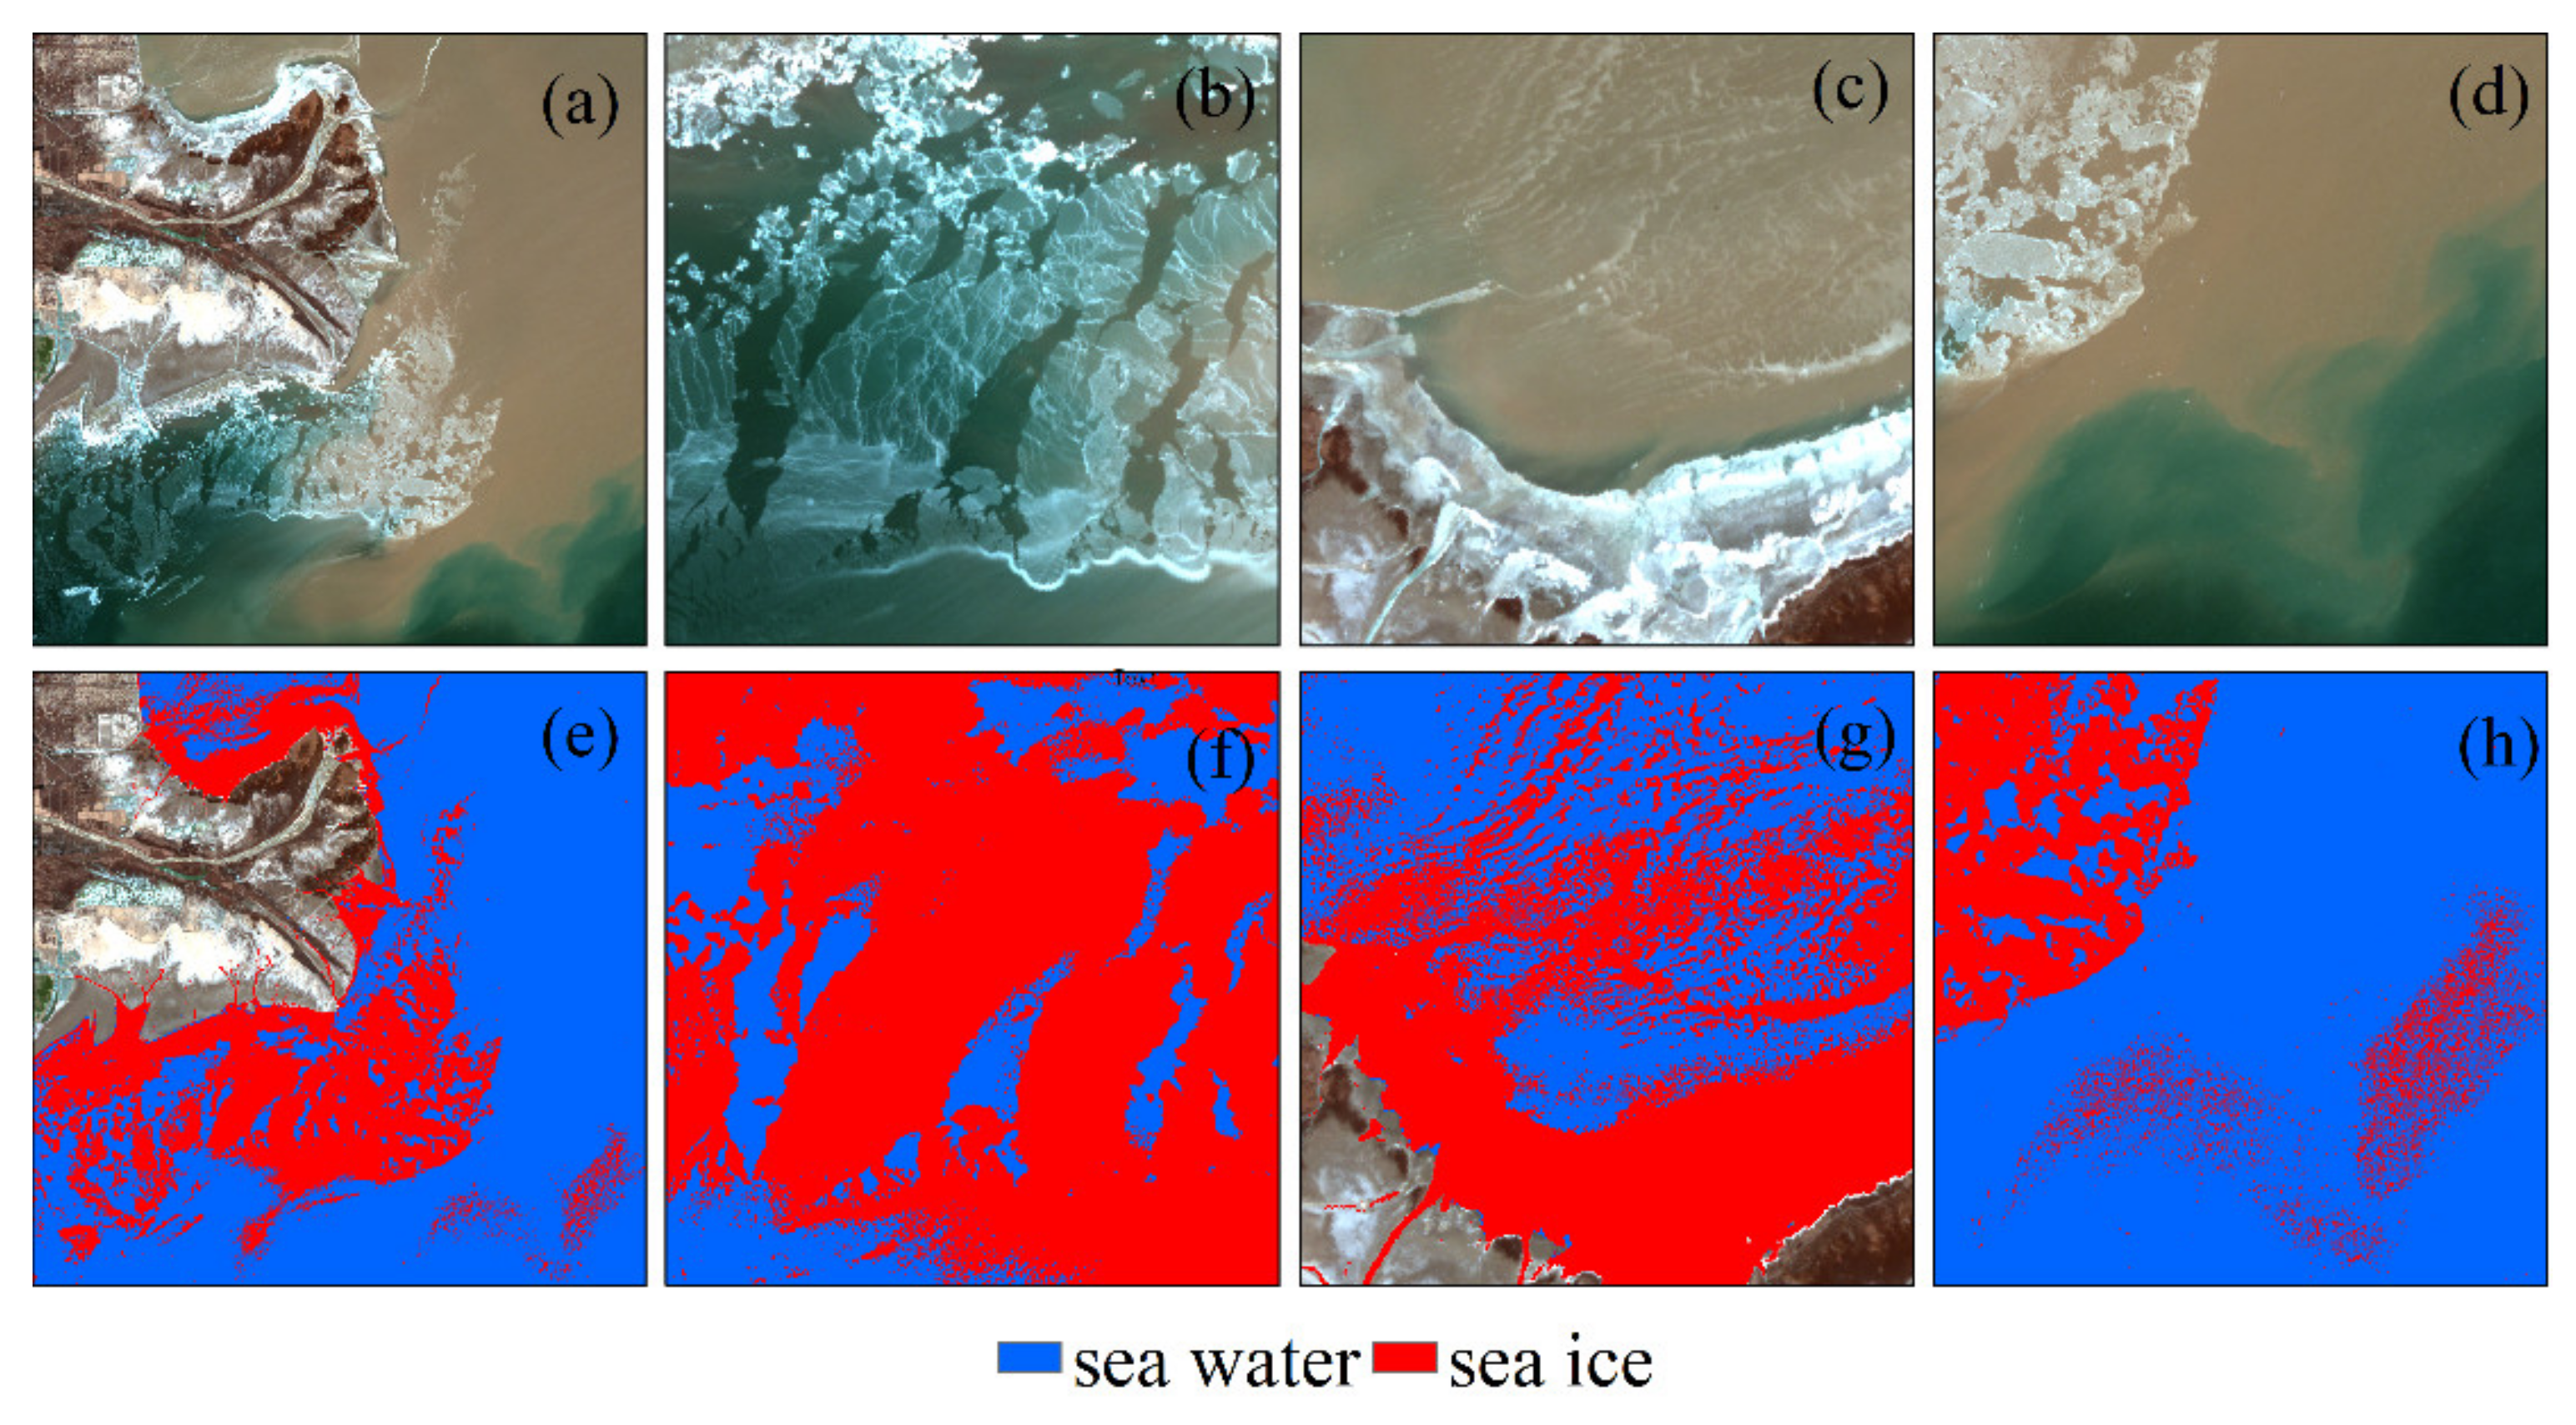
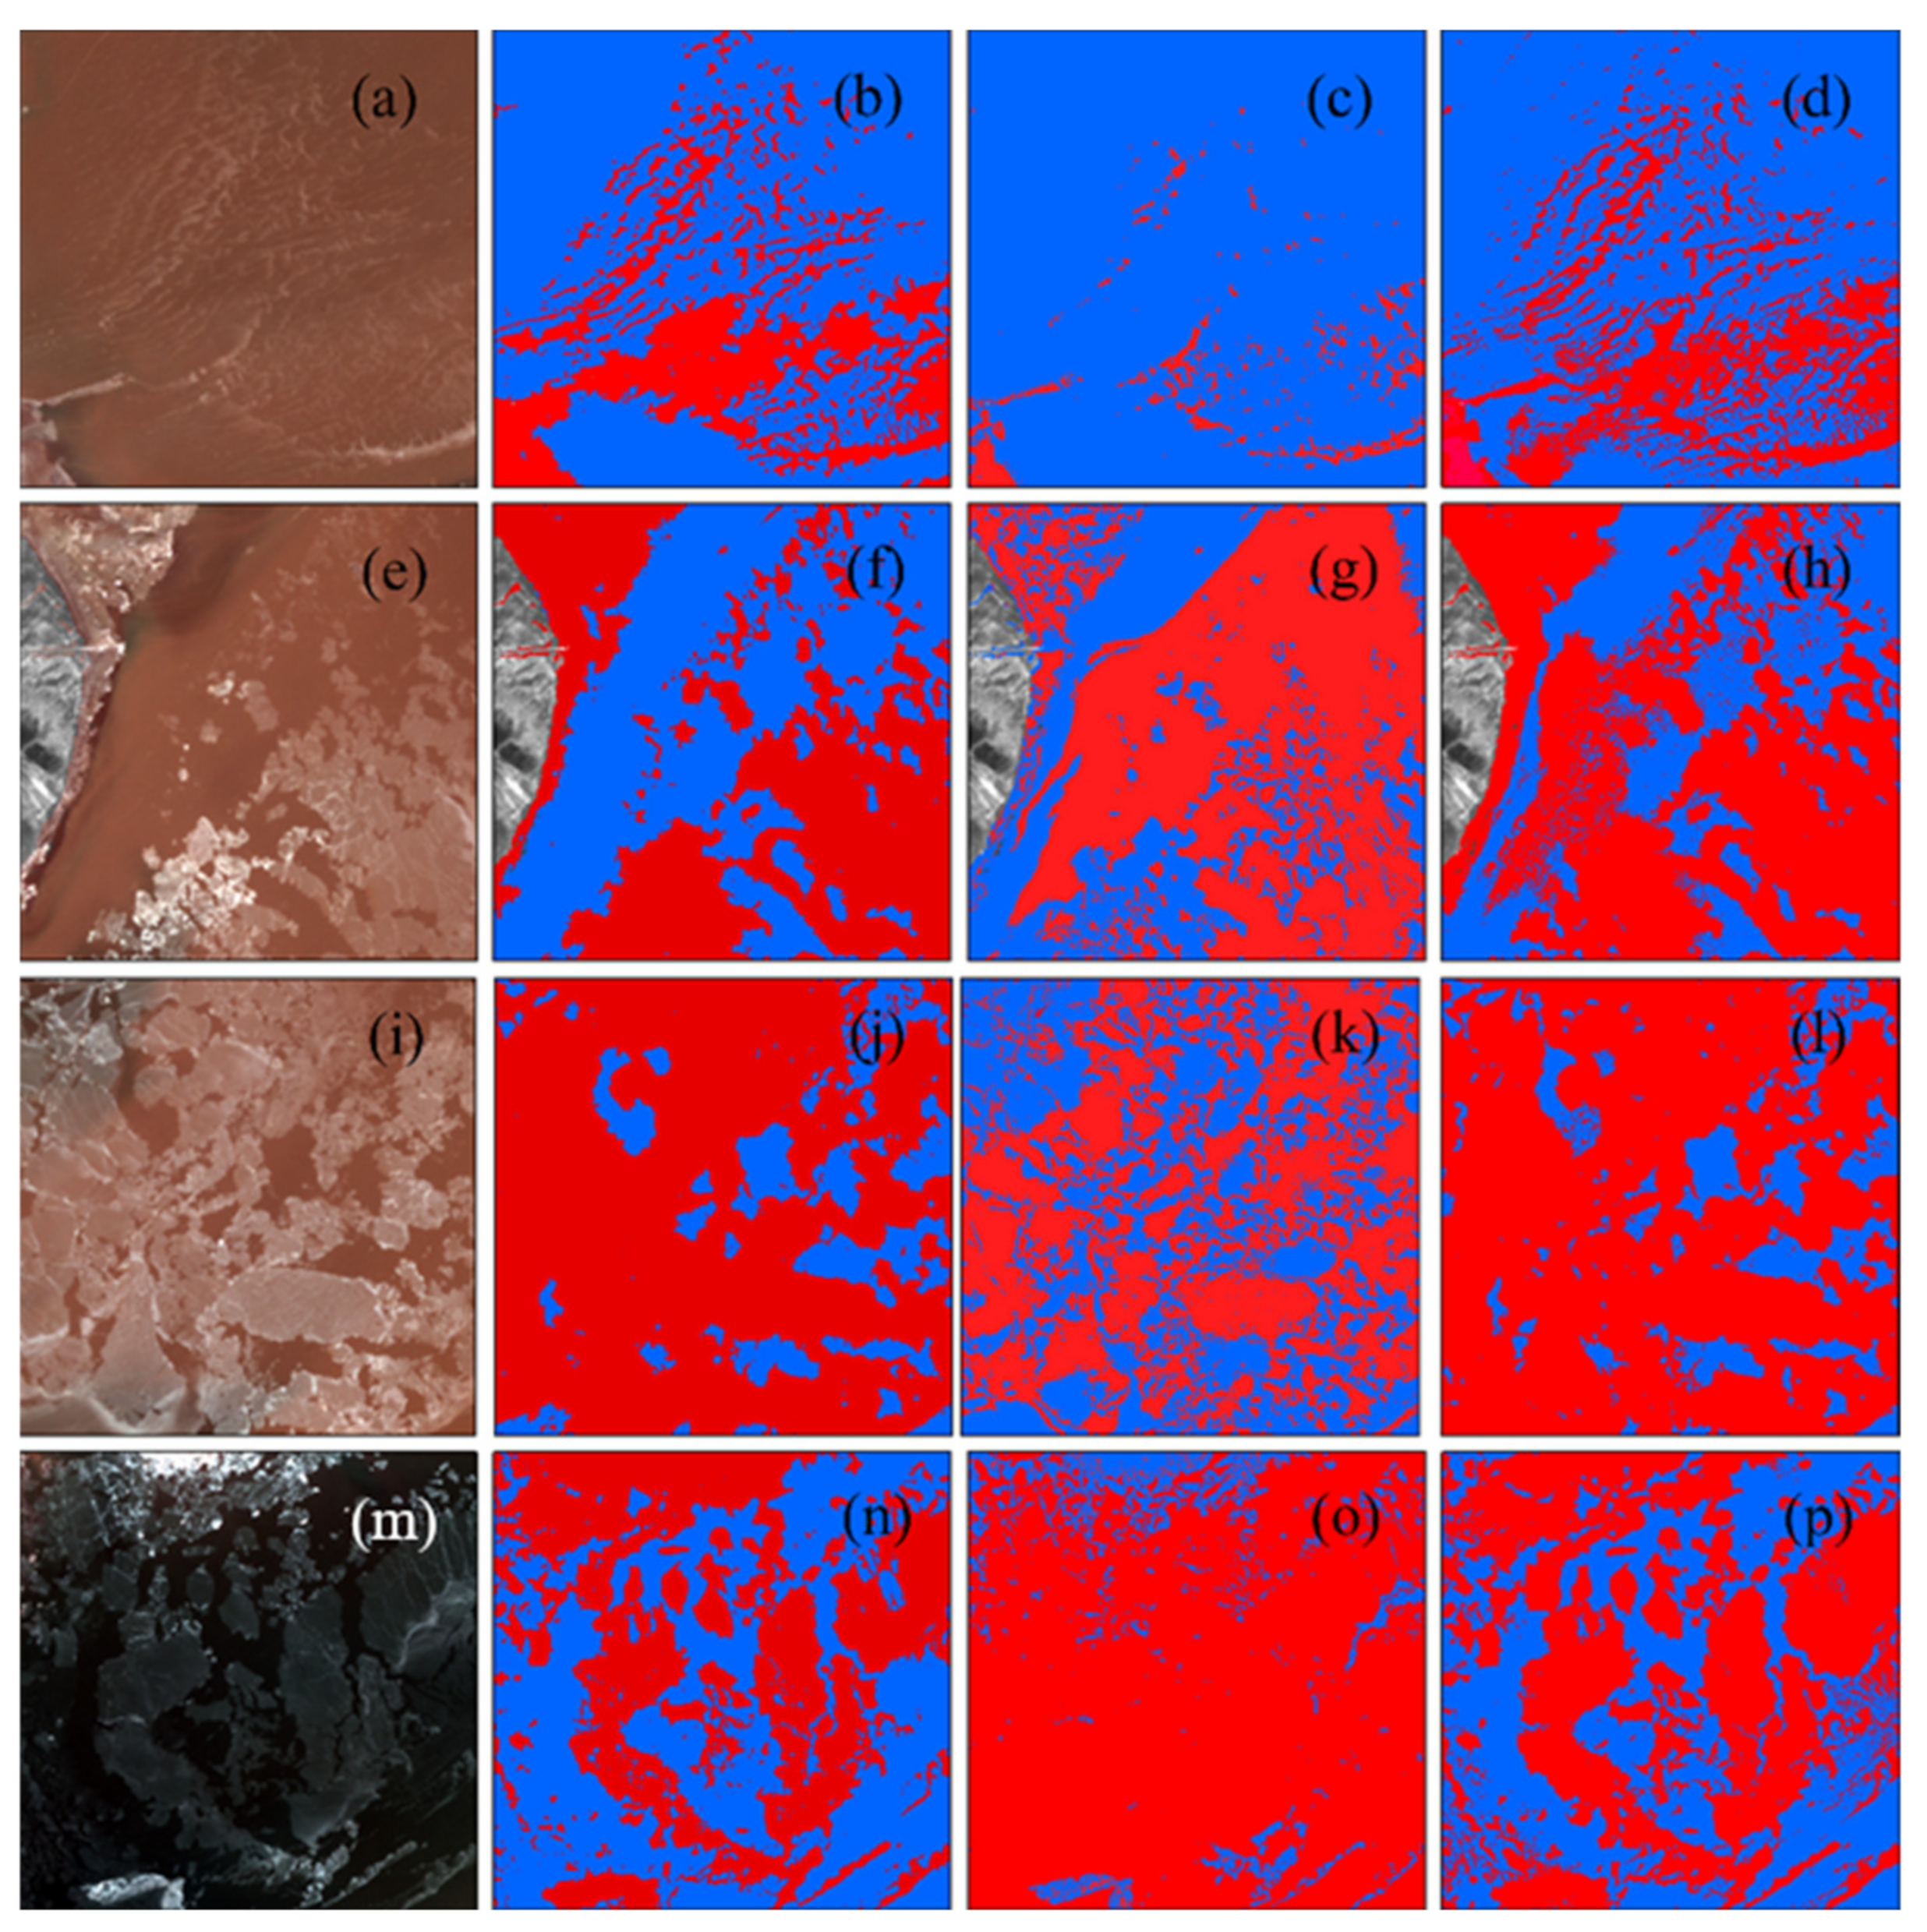
Figure 18 shows the sea ice extraction results obtained using the different methods for a GF1 image acquired on 12 January 2018. Four scenes including new ice, ice rind, nilas, grey ice, and grey-white ice were selected to illustrate the results of the sea ice extraction. In addition, the results were compared with the sea ice extraction results obtained using the K-Means and SVM methods. Taking into account the complexity of the changes between the various types of sea ice in the seawater with different suspended particulate matter concentrations in the Yellow River Delta, in order to improve the accuracy of the K-Means and SVM methods as much as possible, the K-Means method categories were set to 2–10 categories, and then, the classification post-processing was performed. The image was finally divided into two categories, namely, sea ice and seawater. When the SVM method was employed to select the sample points, the sample points were selected according to the types of ice in the Yellow River delta, turbid seawater, and clear seawater in order to improve the accuracy of the sea ice extraction.
It can be observed from
Figure 18c,h that the K-Means method cannot completely extract the sea ice when extracting thin ice such as new ice and ice rind in seawater with a high suspended particulate matter concentration. As
Figure 18g,o shows, most of the seawater was classified as sea ice in the areas with high suspended particulate matter concentrations near the shore and in the clear water areas. This demonstrates that the K-Means method is greatly affected by suspended sediment. The results of the SVM method of extracting sea ice were generally better than those of the K-Means method, but most of the seawater remained classified as sea ice in the areas with high suspended particulate matter concentrations. In addition, there is a significant salt and pepper phenomenon present in the extraction results. The method proposed in this paper can accurately extract the various types of sea ice in both turbid seas and clean seas. It also greatly reduces the salt and pepper phenomenon and improves the integrity of the sea ice extraction.
In order to quantitatively evaluate the accuracy of the sea ice extraction, the overall accuracies and kappa coefficients of the classification results for the GF1, Landsat 8, and Sentinel-2 images were compared and analyzed and additionally compared with those of the K-Means and SVM methods. In addition, the method was applied to the Yellow River Delta and Liaodong Bay. The results are presented in
Table 3. The overall accuracy of the method proposed in this paper is basically >95%, the kappa coefficient is > 80%, and the accuracy is 5% higher than those of the SVM and K-Means methods. On 21 January 2017, there were mixed pixels of clouds and water in some areas, which affected the accuracy of the final sea ice extraction. In Liaodong Bay, the accuracy of the SVM was close to that of the method proposed in this paper. This is because the sea ice in Liaodong Bay is predominantly thick ice such as grey ice and grey-white ice, and is less affected by suspended sediment. Therefore, both the proposed method and the SVM method achieved better accuracies.
The final results show that the accuracy of the K-Means method was the lowest among the three methods. This is due to the similarity between the spectra of the highly turbid seawater and thin ice sheets in the Yellow River Delta and the complexity of the various types of sea ice in the different turbid seawater regions. This led to the relatively low classification accuracy of the K-Means method. The SVM method exhibited a better classification accuracy than the K-Means method overall, but it only used the spectral information, thus the classification accuracy of the ice types, such as in the high suspended sediment areas and for ice rind, was lower. In addition, the SVM method is reliant on prior knowledge. It is a time-consuming process to manually select sample points, and the quality of the sample points directly affects the accuracy of the final classification. The method proposed in this paper attained good accuracy in both the turbid water and clear water areas, and achieved automation of the sea ice extraction. All processing methods were carried out in ENVI. The ENVI functions are called using IDL and can be easily automated.
5. Conclusions
The automatic and accurate extraction of sea ice is essential for studying the laws of sea ice generation and migration, improving sea ice disaster prevention and mitigation, and monitoring climate change. Accurate real-time observations of sea ice bear an important application value and is of theoretical significance.
In order to solve the problem of the low sea ice extraction accuracy caused by the influence of the suspended sediment in the Yellow River Delta, in this study, an automatic sea ice extraction method combining sea ice spectral, texture and edge information is proposed, where the sea ice extraction accuracy can reach over 93%, which is more than 5% higher than SVM and K-means. Compared with previous studies, the sea ice spectral information index suitable for different suspended sediment concentrations is constructed by a two-dimensional scatter diagram of characteristic bands, which improves the applicability of sea ice spectral information index. In changing from discussing the texture characteristics of sea ice as a whole in the past, this study discusses the texture characteristics and edge characteristics of various sea ice types in the Yellow River Delta in detail, laying a foundation for the classification of sea ice types. In addition, the automatic determination of threshold based on OTSU can realize the automatic extraction of sea ice. The method in this paper uses only four bands of visible light and near-infrared to extract sea ice, thus providing a method to be extended to other high-resolution optical remote sensing data and is of great significance to maximally utilize multi-source remote sensing data for real-time monitoring of sea ice.
In future research, we may expand the research area to the Bohai Sea in China, and realize real-time observation of sea ice through Landsat, Sentinel-2, GF1 and other optical remote sensing data. In terms of data sources, in order to improve the frequency of sea ice monitoring, SAR data may also be applied. We hope to conduct high-precision and high-frequency sea ice monitoring, so as to make a certain contribution to preventing disasters and studying climate change around the Bohai Sea.


 ,
, 


