1. Introduction
By the end of 2020, the total mileage of highways in China reached over 161,000 km, ranking it as first in the world. Based on the design concept of “Strong base, Thin surface”, the vast majority of highways in China adopt the layered structure, i.e., a semi-rigid base layer overlaid by an asphalt pavement [
1,
2]. The pavement structure is an essential part of the highways that directly contributes to improving safety and vehicle comfort and reduces fuel consumption. However, the pavement structure usually suffers from a number of defects (e.g., cracks, voids, and delamination). Among the various pavement defects, fatigue cracks and reflective cracks are considered as two major failure modes of the pavement structure [
3]. Typically, fatigue cracks are mainly imposed by repetitive traffic loading [
4]. They usually crack from top to bottom, and only occur in the asphalt surface layer. In contrast, reflective cracks start to shrink and crack in the semi-rigid base layer, and then extend to the asphalt surface layer (from bottom to top) due to traffic and temperature effects [
5,
6]. Note that cracks are just one of the several common defects found in highway pavement [
7], but their existences indicate that the structural layer has been damaged. What is worse is that cracks might provide preferential pathways for rainfall infiltration, which usually lead to a faster deterioration of the layered structure (both the sub-base and asphalt surface layer) and a reduction in the pavement foundation-bearing capacity [
8,
9]. Due to the importance of the highways for China’s economy, the regular and effective maintenance of highway pavements is crucial.
Fatigue cracks in the asphalt surface layer are usually treated by slotting and grouting, the objective of which is to stop water infiltrating into the cracks and prevent the deterioration of the asphalt surface layer. However, this treatment measure is not suitable for reflective cracks, because it only stitches the upper part of the cracks. Afterwards, the deeper part of the cracks in the semi-rigid base layer can further extend to the asphalt layer due to traffic and temperature effects [
10]. Generally, an advisable treatment measure for reflective cracks is to fill the cracks using high-strength polymer with certain elasticity, viscosity and strength, joining together the broken semi-rigid base and asphalt surface. Therefore, the most appropriate rehabilitation method requires knowledge of the crack conditions (locations and types) in highway pavement.
Conventional visual inspection techniques of road surface can only detect and characterize the visible cracks on the road surface; however, it often fails to identify the internal conditions and the penetration depth of the cracks. Ground Penetrating Radar (GPR) is one of the most frequently recommended non-destructive testing (NDT) methods for road inspections because it is a relatively fast technique that provides an overall internal image [
11,
12]. GPR investigation of road pavements can be performed either with ground-coupled or air-coupled antennas [
8]. Normally, air-coupled antennas lead to a better identification of pavement layer interfaces while ground-coupled antennas are preferable to detect anomalous areas, namely cracks and debonding [
13,
14].
In a homogeneous medium, the responses of the top and bottom of a single vertical crack in a GPR profile appear as two different diffraction hyperbolas [
14,
15]. Compared with the nether hyperbola, the upper hyperbola with an opposite-phase has a greater curvature and stronger amplitude, making it easy to identify the crack type and locate the top and bottom of the crack [
16,
17]. Some studies on the detection of vertical cracks in flexible pavements over the granular layer demonstrate that the vertical thin crack features can be clearly displayed in the GPR profile [
14]. The wavefield characteristics of the vertical crack are influenced by the infilling materials, the depth of the crack and the conductivity of the surrounding medium [
18]. When the crack width is larger than the radius of the first Fresnel zone, the diffraction asymptotes on both edges of the crack can be clearly seen in the GPR profile, thus the crack width can be directly identified from the GPR profile. When the crack width is smaller than the radius of the first Fresnel zone, the amplitude of the diffracted wave generated by the top of the crack increases with the crack width [
19,
20]. Generally, the cracks present inside the highway pavement not only form a diffraction hyperbola at the actual locations (the top and bottom) of the crack, but also form multiple diffraction hyperbolas, which are tangential to the reflected waves generated at the interfaces between each underlying medium [
21]. These diffraction hyperbolas are similar in shape and hard to distinguish. This phenomenon easily leads to the misjudgment of the locations of the bottom of the cracks [
22]. Fatigue cracks and reflective cracks are the two common defects in highways, and the location of the bottom of the two types of cracks are different, thus the treatment and repair methods are also different. The correct identification of the location of the bottom of a crack is the key to determining the crack type and selecting appropriate treatment; however, few studies have addressed how to accurately solve this problem.
In this paper, we aim to realize the detection and characterization of cracks in highway pavement based on the amplitude variation of GPR diffracted waves. First, we compare how the locations (the top and bottom) of cracks in the homogeneous and layered homogeneous media affect the GPR responses in the simulated GPR profile using the travel-time curve and numerical simulation methods. Then, we provide a detailed and contrastive analysis of the amplitude variation of the GPR diffracted waves when the bottom of the vertical crack is buried at different depths in layered homogeneous media. We maintain focus on the correspondence between the amplitude of the direct ground wave and the locations of the cracks, as well as the crack width. In particular, we summarize the corresponding relationships between the amplitude variation of GPR reflected waves and the different buried depths of the bottom of cracks. Furthermore, these findings have been validated through the application to real GPR data of a highway pavement. The results show that the amplitude variation of the electromagnetic waves can be used to determine the locations (the top and bottom) of cracks in highway pavement, thus providing a basis for the accurate classification of crack types and corresponding characterization.
3. Numerical Tests and Results
3.1. GPR Responses of Cracks in Homogeneous Media
In a homogeneous medium, the top of a crack is equivalent to a “point”. The high-frequency electromagnetic wave emitted by GPR will generate a diffracted wave when it encounters an isolated “point” during propagation, and its travel time curve is a classical hyperbola. Normally, the location of the top of the crack is the same as the vertex of the diffraction hyperbola in the depth profile. Thus, the actual location of the top of the crack in the GPR profile can be accurately located under this condition.
Model 1 (
Figure 1a) and Model 2 (
Figure 1c) present the “point” and vertical crack in a homogeneous medium, respectively. The total number of grids for the two models is 400 × 250, the spatial grid size is 0.5 cm and the time step is 0.0118 ns. Both of the upper area of the two models (with a thickness of 5 cm) is air medium, and the lower area of the two models (with a thickness of 1.2 m) is a homogeneous medium. We used a typical dielectric constant (
= 7.56) based on GPR data and coring information. Asphalt has a very low electrical conductivity of 0.001 S/m. The size of the “point” in Model 1 is 1 × 1 cm at depth of 10 cm, and the size of the vertical crack in Model 2 is 1 cm × 10 cm (in length) at the same depth of 10 cm. Note that both the “point” and vertical crack are filled with air. Based on the FDTD method and the CPML absorption boundary condition [
30], the numerical simulation of GPR data was carried out using a Blackman-Harris pulse with a center frequency of 900 MHz. The numerically simulated results are shown in
Figure 1b,d. It can be seen that the “point” and the top of the vertical crack are both typical diffraction hyperbolas in the corresponding GPR profiles. Additionally, their phases are the same as the phases of the direct ground wave. Similarly, the bottom of the vertical crack is also a typical diffraction hyperbola in the GPR profile, but its phase is opposite to the phase of the direct ground wave. This phenomenon of the positive or negative phases has a close relationship with the reflection coefficient.
In Models 1 and 2, the GPR responses of the top and bottom of the crack correspond to two diffraction hyperbolas. If we correctly convert the two GPR profiles from time domain to depth domain, the locations of the corresponding vertices are the corresponding top and bottom of the crack. The top of the crack is closer to the excitation source, so its wavefront spreading and absorption are relatively smaller, resulting in the amplitude of the diffracted wave of the top of the crack being significantly larger than that of the bottom. Moreover, their phases are opposite to one another. When the cracks are filled with water, the phases of the diffracted wave of the top of the cracks are opposite to that of the direct ground wave, while the phases of the diffracted wave of the bottom of the cracks are the same as that of the direct ground wave. Thus, the dielectric constant of the filling medium in the crack can be roughly inferred from the phase relationship between the diffracted waves (upper and lower) and the direct ground wave.
3.2. GPR Responses of Cracks in Layered Homogeneous Media
The highway pavement is a typical layered medium, which consists of, from top to bottom, the asphalt surface layer, the semi-rigid base layer and roadbed.
Figure 2 shows a schematic diagram of the propagation path of the secondary diffracted wave of the top of the crack in a layered homogeneous medium (assuming that the offset is approximately zero, namely self-exciting and self-receiving). Suppose that the thickness of the upper medium is
, the electromagnetic wave propagation velocity
, the burial depth of the top of crack
is
, and the distance of the transceiver antenna from the projection point of point
on the ground is
. Then, the time distance curve of the secondary diffracted wave of the crack top point
can be expressed as
Equation (1) is similar in form to the diffraction hyperbola of a “point”, and it can also be converted into two standard hyperbolic equations. When the transceiver antenna is located directly above the top of the crack (i.e., ), and the value of is it means that the value of is only related to the thickness of the upper medium and the electromagnetic wave propagation speed , and has nothing to do with the burial depth . The value of is exactly equal to the two way travel time . So, a hyperbola of the secondary diffracted wave tangent to the event of the reflected wave at the interface of the lower medium can always be seen in the GPR profiles when the top and bottom of the crack exist in the upper medium.
Model 3 (
Figure 3a) and Model 4 (
Figure 3c) present the “point” and crack in a layered homogeneous medium, respectively. Both the models are divided into four layers from top to bottom, the first layer is air (
= 1,
= 0 S/m) with a thickness of 5 cm, the second layer is asphalt surface (
= 7.56,
= 0.001 S/m) with a thickness 18 cm, the third layer is the semi-rigid base (
= 9,
= 0.005 S/m) with a thickness 36 cm, the fourth layer is roadbed (
= 12,
= 0.012 S/m) with infinite thickness.
Figure 3b,d show the simulated GPR profiles with respect to Models 3 and 4, respectively.
It can be seen from
Figure 3b,d that the simulated results of the “point” and the crack in the layered medium are consistent with the results described above. They not only form clear diffracted waves at their actual positions, but also form multiple diffracted waves that are tangential to the reflected wave at the interface of each lower medium. The shapes of the multiple diffracted waves are similar to the shape of the diffracted wave of the bottom of the crack, and the amplitudes of the multiple diffracted waves increase with the increase in the crack height. In addition, the interference and superposition of multiple diffracted waves and reflected waves lead to partially missing and obvious misalignment of reflected waves, which would seriously affect the determination of the location of the bottom of the crack.
3.3. Influence of GPR Responses by the Locations of Cracks
To study the influence of GPR responses by the locations of cracks, we designed Model 5 (
Figure 4a) and Model 6 (
Figure 4b). Model 5 is derived from Model 2 in
Figure 1c, from which the locations (top and bottom) of the cracks changed sequentially. The horizontal spacing of the adjacent cracks are all set to 2 m, and the burial depth of the cracks increases from 0 cm to 40 cm by a constant value of 5 cm. Note that Model 6 is also derived from Model 4 in
Figure 3c in the same manner. Finally, the corresponding simulated GPR profiles with respect to Models 5 and 6 are shown in
Figure 5a,b, respectively.
As shown in
Figure 5a,b, the amplitudes of the diffracted waves of the top and bottom of the cracks as well as the curvatures of corresponding diffraction hyperbolas decrease with the increase in the burial depth. It can be found that the two diffracted waves generated by the top and bottom of a certain crack have opposite phases. Additionally, the diffracted waves generated by the top of the cracks have relatively larger amplitudes and curvatures. An obvious difference between
Figure 5a,b is that the two reflected waves can be found in
Figure 5b. In addition, the two reflected waves might always be accompanied by a multiple diffracted waves tangent to the reflected wave. In particular, for the leftmost four cracks of which the tops or bottoms are located at the asphalt surface, two multiple diffracted waves are found to be tangential to the two reflected waves at different time positions. However, for the rest cracks of which the tops or bottoms are all located at the semi-rigid base, only a multiple diffracted waves can be found to be tangential to the later reflected wave. Note that
Figure 5a,b indicate that the vertex of the diffracted wave and the direct ground wave might superimpose each other when the top of the crack is shallowly buried. In this case, it is difficult to determine the position of the top of the crack from the simulated GPR profiles.
3.4. GPR Responses of Fatigue and Reflective Cracks
Fatigue cracks and reflective cracks are two common diseases in a highway pavement while the vast majority of discovered cracks in the actual crack detection has proven to be the latter. Generally, the bottom of reflective cracks is located at the interface between semi-rigid base and roadbed. Unlike reflective cracks, however, the bottom of fatigue cracks is located at the interface between asphalt surface layer and semi-rigid base. In this section, a layered homogeneous model with different types of cracks (Model 7), as shown in
Figure 6, was designed to analyze the GPR response of fatigue cracks and reflective cracks in highway pavement.
Model 7 is also divided into four layers from top to bottom. The first layer is air (
= 1,
= 0 S/m), with a thickness of 5 cm. The second layer represents an asphalt surface layer (
= 7.56,
= 0.001 S/m), with a thickness of 15 cm. The third layer represents a semi-rigid base (
= 9,
= 0.005 S/m), with a thickness of 36 cm. The fourth layer is a roadbed (
= 12,
= 0.012 S/m), with infinite thickness. Model 7 contains four vertical cracks, for which the burial depths are all set to 0 cm. From left to right, the width of the four cracks are 1 cm, 2 cm, 3 cm and 1 cm in order. Among the four cracks, the rightmost one is a reflective crack while the rest are all fatigue cracks. As can be seen from
Figure 6, the fatigue cracks only exist in the asphalt surface layer, and their bottoms are all located at the interface between the asphalt surface layer and the semi-rigid base. The reflective crack runs through the asphalt surface and the semi-rigid base, and its bottom is located at the interface between the semi-rigid base and the roadbed. Transceiver antennas are placed 0.5 cm above the surface layer. The center frequencies of the pulse excitation sources are 900 MHz and 400 MHz, and the corresponding offsets are set to 10 cm and 26 cm, respectively. The numerically simulated GPR profiles are shown in
Figure 7a,e.
Since the tops of the four cracks are buried at the same burial depth (0 cm), there is overlap and coupling between the diffracted waves of the top of the four cracks and direct ground waves as shown in
Figure 7a,e. Moreover, as the frequency decreases, the phenomenon of overlap and coupling becomes more apparent, which makes it more difficult to determine the locations of the top of the cracks and the corresponding burial depths. It also can be seen that the diffraction hyperbolas of the four cracks are all tangential to the reflected waves generated by the interface between the asphalt surface and the semi-rigid base. In addition, the opening size and the shape of the four diffraction hyperbolas are nearly the same, and their vertexes are located at the same time positions. At the interface between the semi-rigid base and the roadbed, the multiple diffracted waves of three fatigue cracks are similar in shape to the diffracted wave of the reflective crack, and their corresponding vertexes are in the same time positions. Although, the curvature of the three fatigue cracks is slightly larger than that of the reflective cracks, and it is not easy to distinguish the four cracks due to the small differences.
Based on the above analysis of simulated GPR profiles, we can find that the morphological characteristics of diffracted waves and multiple diffracted waves related to the four cracks are quite similar. Therefore, it is difficult to distinguish the location of bottom of the cracks from the simulated GPR profiles, so as to accurately identify the type of the cracks. However, the diffracted waves generated by the top and the bottom of the cracks or the subsequent multiple diffracted waves are tangential to the nearby reflected waves. The diffracted waves and the reflected waves are superimposed on each other at the corresponding interfaces, which implies that the amplitude of the reflected wave is closely related to the amplitude of the diffracted wave. To compare the characteristics of the amplitude variation of these waves, we normalized the amplitude of the direct ground wave (
Figure 7b,f) and the reflected waves (
Figure 7c,d,g,h).
Figure 7b,f show the normalized amplitude curves of the negative phase of the direct ground wave. As can be seen from the two figures, the normalized amplitude values of the negative phase of the direct ground wave decreases with the crack width when the cracks are buried at the same depth. This is because the negative phases of the direct ground wave are superimposed and coupled with the diffracted wave of the top of the cracks, which indeed results in a significantly smaller amplitude at the crack position in the normalized amplitude curves. This important visual characteristic can be used to determine the location of the top of the cracks. In addition, since the amplitude of the negative phase of the direct ground wave is sensitive to crack width, it can also be used to qualitatively compare the width of the cracks.
For the three fatigue cracks, we can observe from
Figure 7c,g that their normalized amplitude curves of the negative phase of the reflected waves at the interface between the asphalt surface and the semi-rigid base increase with the crack width. Additionally, their amplitude is higher than that of the reflective crack. However, for the leftmost fatigue crack and the reflective crack, which have the same crack width but different locations of the bottom, the difference of the two corresponding amplitude values of the negative phase of the reflected wave is not significant. To further distinguish the leftmost fatigue crack and the reflective crack, the amplitude values of the negative phase of the reflected wave at the interface between the semi-rigid base and the roadbed are very different (
Figure 7d,h). Additionally, the corresponding amplitude value of the reflective crack is significantly greater than the corresponding value of the leftmost fatigue crack, which can be used as a judgment index to distinguish the crack type.
In this section, we have analyzed and summarized some useful experiences to detect and characterize the fatigue cracks and reflection cracks in layered homogeneous models. As the highway pavement is a typical layered media, whether these above-mentioned experiences can still be used to help determine the locations (the top and bottom) of the cracks and crack type in the GPR field data of highway pavement needs to be investigated.
4. Application to Field Data
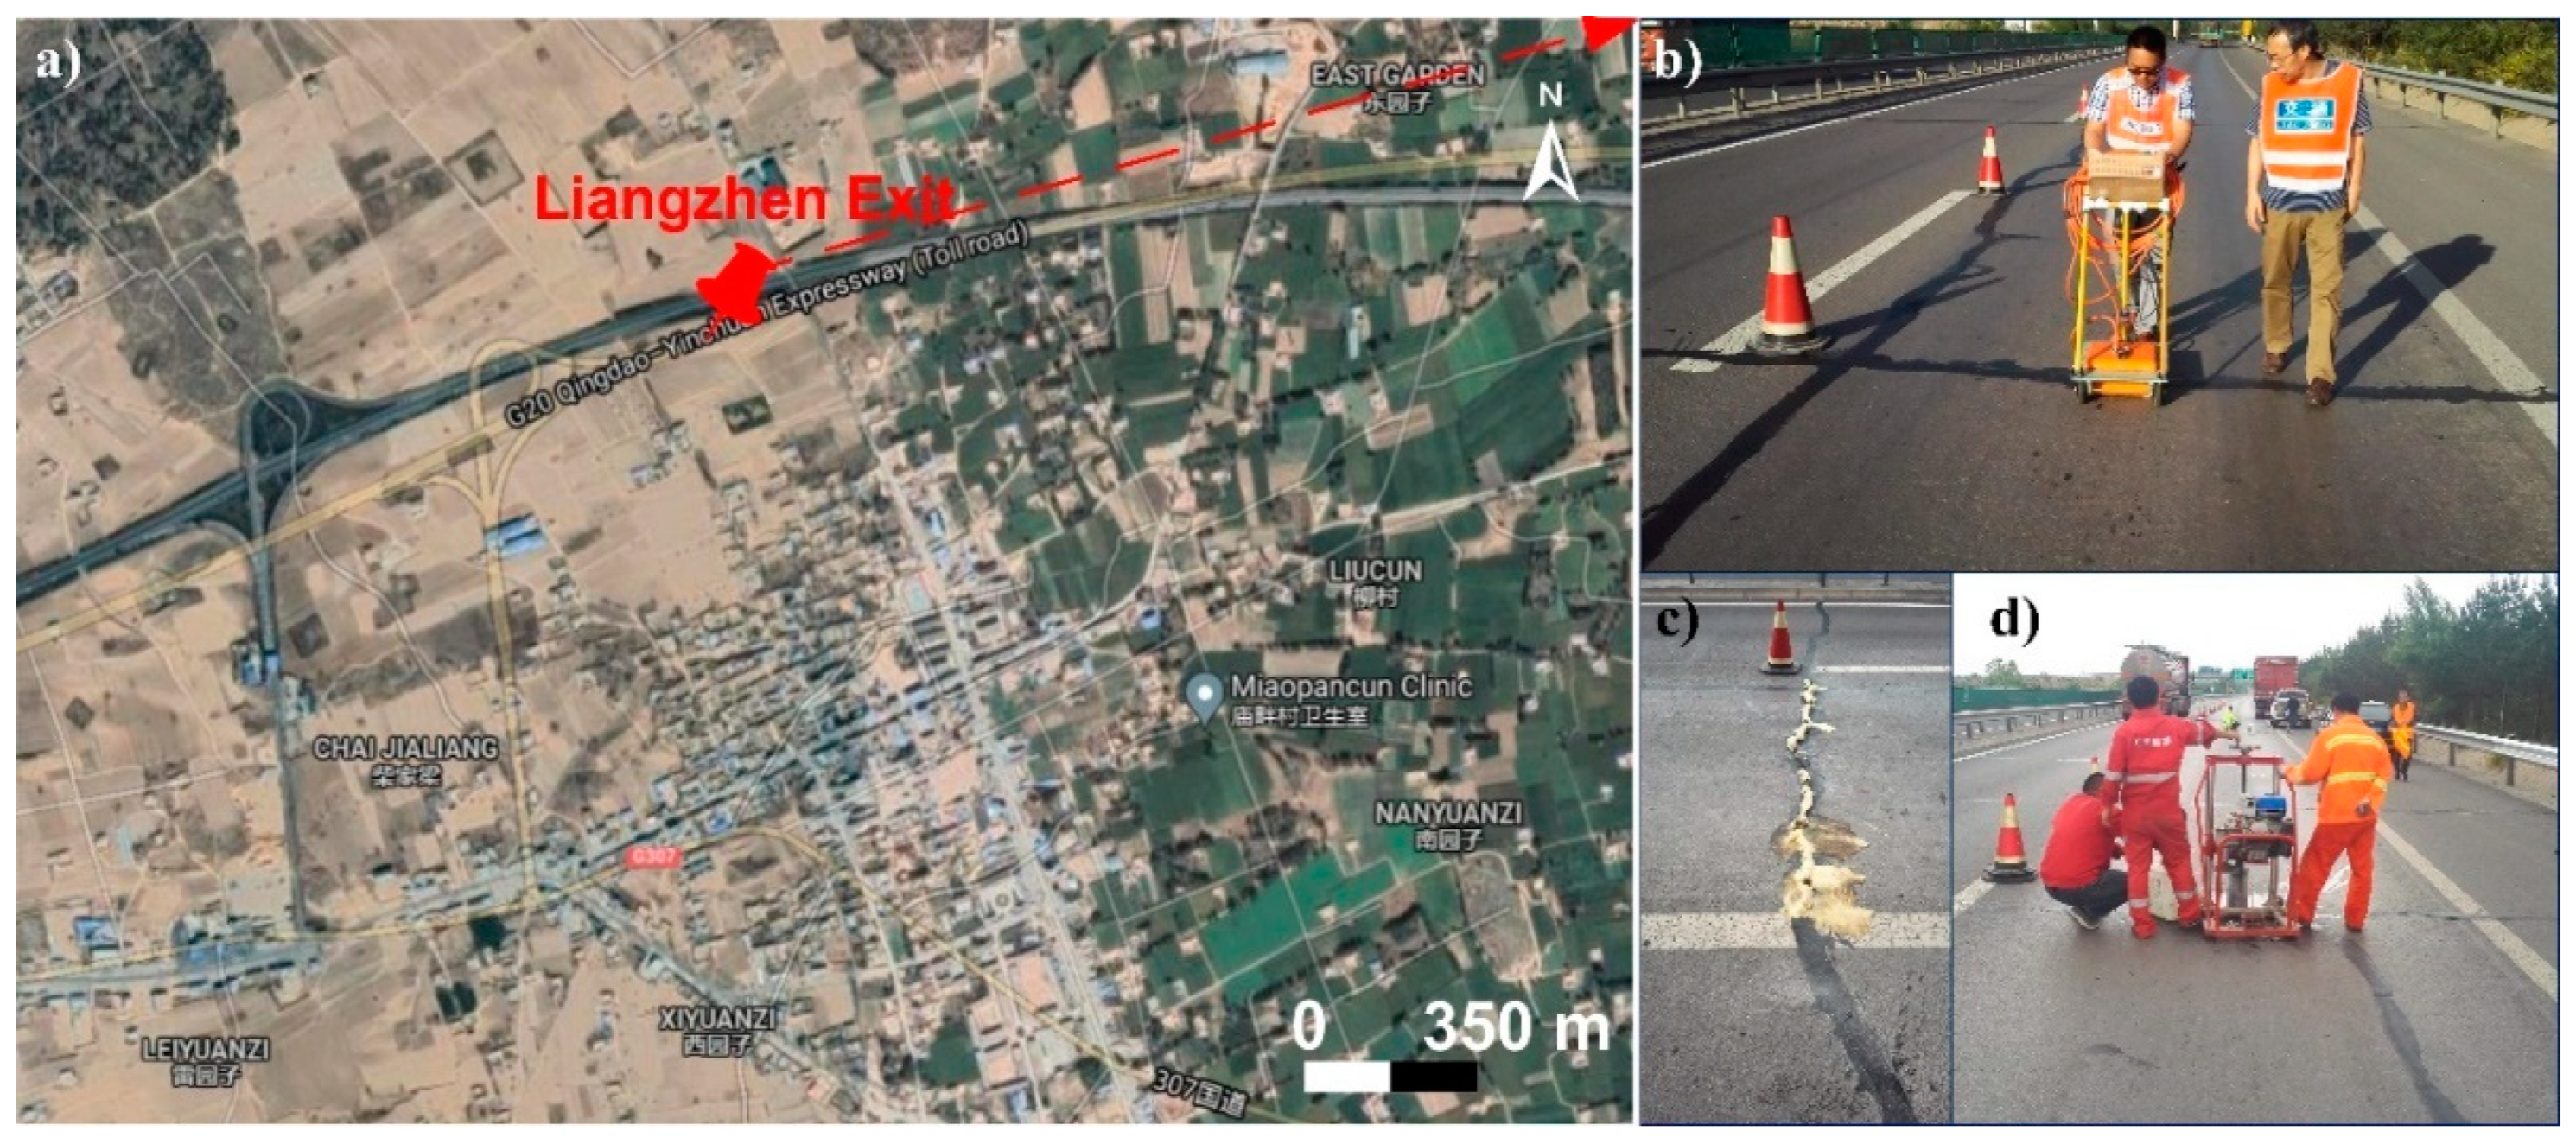
As shown in
Figure 8a, the test section is a small section of the G20 highway in the Shaanxi Province, China. The G20 highway uses a common “semi-rigid base + asphalt surface layer” system. The asphalt surface layer has a thickness of 15 cm, and the semi-rigid base course consists of two layers of 18 cm thick cement stabilized macadam. Winters in the region are quite cold, with an average temperature ranging from −5 to −9 degrees Celsius, and the lowest temperature can even be around −30 degrees Celsius. Under low temperature conditions, the highway pavement will shrink and further result in transverse cracks [
12]. Five transverse cracks have been visually visible on the road surface at the test section. In order to ensure a sufficient detection depth, a shielded ground-coupled antenna with a center frequency of 400 MHz as mentioned in
Section 2.2 was used for this detection. During the data acquisition, the radar line was perpendicular to the transverse cracks, and the antenna polarization direction was parallel to the crack orientation (
Figure 8b). After GPR detection and interpretation, the reflective cracks were treated with bottom-up trenchless grouting, and the road surface was a modified epoxy material that spilled from the crack (
Figure 8c).
Figure 8d shows the coring of the test results using a borehole corer to verify the results.
Figure 9a shows the processed GPR profile using the methods described in
Section 2.2. Since we used a ground-coupled antenna with a center frequency of 400 MHz for this data acquisition, which means the wavelength of the wavelet is long, this frequency has a poor resolution for the asphalt surface layer with a thickness of 15 cm. As a result, it can be seen from this figure that the reflected waves of the interface between the asphalt surface layer and the semi-rigid base layer also overlaps and superposes the direct ground wave, which is consistent with the simulated GPR profile in
Figure 7e.
Figure 9b shows the normalized amplitude curve of the negative phase of the direct ground wave. We can observe that the amplitude values at the locations of the crack becomes sharply smaller and depress into a valley. Moreover, the location of the minimal value of the amplitude curve corresponds to the actual location of the crack in the GPR profile, which can be used to determine the location of the top of the crack in the profile. Based on the relationship between the amplitude of the diffracted wave and the crack width, we can infer that the widths of the five cracks follow a descending order of crack 5, crack 1, crack 2, crack 4 and crack 3.
Figure 9c shows the normalized amplitude curve of the negative phase of the reflected wave at the interface between the asphalt surface layer and the semi-rigid base layer. Theoretically, the amplitude of the reflected wave is mainly related to the difference of the electrical parameter between the upper and lower layers of the media. Normally, the amplitude has a positive relationship with the difference of electrical parameters. However, it can be considered that this electrical parameter difference is a constant value and only affects the average amplitude in a short distance range. Therefore, we consider that this amplitude variation of the reflected wave is mainly determined by the amplitude of the crack-derived diffracted waves which superimpose on the reflected waves. A comparison of
Figure 9b,c shows that the ranges of amplitude variation of the five cracks in
Figure 9c are relatively smaller than the ranges of amplitude variation of the five cracks in
Figure 9b.
Figure 9d shows the normalized amplitude curve of the negative phase of the reflected wave at the interface between the semi-rigid base and the roadbed. Firstly, the locations of maximum value of amplitude curves represents the locations of the five cracks. The amplitude curve decreases sharply on both sides of locations of the five cracks, resembling a “mountain peak”. Additionally, the amplitudes of the three cracks (cracks 3, 4 and 5) are obviously larger than those of the rest of the cracks (cracks 1 and 2). Based on the experiences we summarized in
Section 3.4, we identify cracks 1 and 2 as fatigue cracks, for which the bottoms are located at the interface between the asphalt layer and the semi-rigid base. In addition, the rest of the three cracks (cracks 3, 4 and 5) are identified as reflective cracks, for which the bottoms are located at the interface between the semi-rigid base and the roadbed. We used the core sampling machine to obtain the core in orders based on the locations of the five cracks, and the core results are shown in
Figure 10. Due to the limitation of the coring machine, the core sample only contains the asphalt surface layer and the upper layer of the semi-rigid base, i.e., the lower layer of the semi-rigid base is not taken out. It can be seen from the two left subfigures in
Figure 10 that cracks 1 and 2 are indeed fatigue cracks (untreated). From the rest of the three subfigures in
Figure 10, we can conclude that cracks 3, 4 and 5 are reflective cracks, which have been filled with modified epoxy resin material using the non-excavation treatment technique. The validation results of the core information demonstrate that our experiences are reasonable and feasible for identifying the crack types.
5. Discussion
The phase characteristics of the wavelets used in our numerical simulation and field application are both “negative-positive-negative”. If we placed the ground-coupled antenna 1 cm above the road surface, the phase characteristics of the direct ground wave are also “negative-positive-negative”. For the crack on the road surface, its top corresponds to a diffraction hyperbola, and the vertex of the hyperbola could indicate the top of the crack. Furthermore, the vertex usually has the strongest energy, and the energy decreases rapidly along the two wings of the hyperbola. When the crack is filled with air, the diffracted wave and the direct ground wave share the same phase characteristics, i.e., “negative-positive-negative”. Therefore, the first negative phase of the direct ground wave is only affected by the first negative phase of the diffracted wave of the top of the crack rather than other phases or the later arriving waves. This means that the amplitude variation of the first negative phase of the direct ground wave might be superposed by the diffracted wave of the top of the crack. Generally, the wider the crack (filled air) is, the smaller the normalized amplitude value of the diffracted top position will be. Thus, a greater crack width might result in a larger amplitude variation with respect to the first negative phase of the direct ground wave. Comparing
Figure 7b,f and
Figure 9b, it can be seen that the measured GPR profile of the transverse cracks is basically consistent with the numerically simulated GPR profiles. Besides, the locations of the top of the cracks can be inferred and the relative width of the crack can be compared as directly proportional to the amplitude variation of the first negative phase of the direct ground wave.
The highway pavement is a typical layered media, whose dielectric constant gradually increase from the top to the bottom. So, the reflection coefficients with respect to each interface within the highway pavement are all negative, and the phase characteristics of the reflected wave is characterized as “positive-negative-positive”, which is opposite to the phase characteristics of the direct ground wave. Now, we can assume that the influence of the reflection coefficient on the amplitude of the reflected wave can be denoted as a constant factor as we only studies a small section of the pavement structure. Based on this assumption, the amplitude variation of the negative phase of the reflected wave, generated by the interface between the asphalt surface and the semi-rigid base, is mainly caused by the superposition of the diffracted waves of the top and bottom of the crack. In general, the bottom of the fatigue cracks is located at the interface between the asphalt surface and the semi-rigid base while the bottom of the reflective cracks is located at the interface between the semi-rigid base and the roadbed. Thus, the reflected wave, generated by the interface between the asphalt surface and the semi-rigid base, has been superimposed by the diffracted wave of the bottom of the fatigue cracks and the secondary diffracted wave of the top of the crack, which results in an amplitude variation of the reflected wave. Due to the dielectric constant difference between the asphalt surface layer and the semi-rigid base, the reflective crack also forms a diffracted wave at the interface between the asphalt surface and the semi-rigid base; however, the amplitude of the diffracted wave is slightly smaller than that of the diffracted wave of the bottom of the fatigue cracks. Thus, it is not recommended as the basis for distinguishing the crack type.
The effect of fatigue cracks on the amplitude variation of the reflected wave generated by the interface between the semi-rigid base and roadbed is significantly different to that of reflective cracks on the corresponding amplitude variation. Both the amplitudes of the multiple diffracted waves of the top of the fatigue cracks and the secondary diffracted wave of the bottom of the fatigue cracks are inherently relatively weak, and their curvatures are also quite different. Thus, their corresponding amplitudes cannot be superimposed and coherently strengthened at the same phase. The bottom of the reflective cracks is mainly located at the interface between the semi-rigid base and the roadbed. Normally, the amplitude of the diffracted wave of the bottom of the reflective cracks is relative strong, which will cause a drastic alteration of the amplitude of the reflected wave. This means that the existence of reflective cracks will result in a more significant amplitude variation of above the reflected wave when compared with the existence of fatigue cracks. Thus, this rule can be used as an important basis for judging the location of the bottom of the crack and the crack type.
6. Conclusions
For fatigue cracks and reflective cracks extending to the road surface, the direct ground wave and the diffracted wave generated by the top of the crack superimpose on each other, resulting in a sharp change in the normalized amplitude curve of the negative phase the direct ground wave. Normally, the amplitude curve drops sharply and becomes a valley at the location of the cracks. This characteristic can visually and intuitively display the location of the top of the cracks, which could be used as effective guidance to determine the location of the top of the cracks quickly and accurately. Meanwhile, the crack width can be compared qualitatively based on analyzing the amplitude values of the direct ground waves with respect to the cracks, thus the characteristics of the cracks can be evaluated more comprehensively.
An analysis of the normalized amplitude curve of the negative phase of the reflected waves at the interface between the asphalt surface layer and semi-rigid base indicates that the amplitude values of fatigue cracks are slightly higher than those of reflective cracks. However, the corresponding normalized amplitude values of reflective cracks are significantly higher than those of fatigue cracks if we focus on the normalized amplitude curve of the negative phase of the reflected waves at the interface between the semi-rigid base and roadbed. The mentioned amplitude relationships thus can be used to determine the bottoms of the cracks and as a judgment index to distinguish the crack type.
The results of this study could provide a basis for the classification and treatment of cracks, however, further work will be focused on two main aspects to extend and improve this research. Firstly, we will investigate how the water-filled cracks affect the GPR response and summarized useful experiences for detecting this kind of crack, because water can significantly affect the electrical parameters of highway pavement. In addition, we will investigate the influence of the center frequency on the simulated and real GPR responses, and try to find an optimal frequency range for the detection of cracks.


