Article

Where Anthropogenic Activity Occurs, Anthropogenic Activity Dominates Vegetation Net Primary Productivity Change

1
State Key Laboratory of Desert and Oasis Ecology, Xinjiang Institute of Ecology and Geography, Chinese Academy of Sciences, Urumqi 830011, China
2
University of Chinese Academy of Sciences, Beijing 100049, China
3
State Key Laboratory of Information Engineering in Surveying, Mapping and Remote Sensing, Wuhan University, Wuhan 430079, China
*
Author to whom correspondence should be addressed.
Remote Sens. 2022, 14(5), 1092; https://doi.org/10.3390/rs14051092
Submission received: 19 December 2021 / Revised: 8 February 2022 / Accepted: 21 February 2022 / Published: 23 February 2022

Abstract

:
Anthropogenic activities and climate change affect the type, structure and function of ecosystems, resulting in important changes in vegetation net primary productivity (NPP). Therefore, in this study we used the vegetation photosynthesis model (VPM) to reveal the spatiotemporal variations in NPP in Xinjiang from 2000 to 2019. The impacts of climate change and anthropogenic activities on NPP changes were quantified and separated by the residual analysis-control variables (RES-CON) method. The results showed that the average NPP in Xinjiang increased by 17.77% from 2000 to 2019. Anthropogenic activities and climate change generally had a positive impact on NPP from 2000 to 2019. The most important anthropogenic activity was land use and land cover (LULC) transformation from grass to arable land, which significantly increased vegetation productivity. Regarding climate change, precipitation has played a significant role in promoting the productivity of vegetation. Overall, the average contribution of climate change (temperature and precipitation) to NPP variation (21.44%) is much greater than the contribution of anthropogenic activities (3.46%), but in areas where anthropogenic activities occur, the average contribution of anthropogenic activities to NPP variation (75.01%) is much greater than the average contribution of climate change (15.53%). Where there are no anthropogenic activities, the average contribution of climate change to NPP variation is 21.72%. In summary, anthropogenic activities are the main driver of NPP variation in areas where anthropogenic activities occur, while the total area in Xinjiang where climate change is the most important driver is larger than the total area where anthropogenic activities are the dominant driver.

1. Introduction

Xinjiang has a typical temperate continental arid climate, and the ecological environment is fragile. Recently, with natural environmental change and anthropogenic activities (e.g., ecological engineering and construction, urban expansion and other influential processes), vegetation dynamics have become increasingly complex [1]. Net primary productivity (NPP) refers to the total amount of organic dry matter accumulated by vegetation per unit time and area, including the production of plant branches, leaves and roots and dead plant matter [2]. NPP can reflect ecosystem productivity on a uniform scale [1] and is a good indicator of the productivity of vegetation. NPP is also a critical component of the global carbon cycle, with significant implications for the global carbon balance [3,4]. Temporal changes in NPP are affected by the complex interactions among temperature, precipitation and other global environmental changes and are strongly influenced by anthropogenic activities. Therefore, studying the spatiotemporal variations in regional NPP, quantitatively representing the effects of the main determinants of NPP and investigating the main mechanisms underlying NPP patterns are important for improving our understanding of the dynamics of vegetation productivity in Xinjiang.
Climate change and anthropogenic activities are major factors that influence vegetation productivity [5,6,7,8]. Meteorological factors affect regional hydrothermal conditions and directly influence vegetation growth [9,10]. Previous studies have shown that temperature is positively correlated with vegetation growth [11] and that the effects of precipitation vary with humidity in different regions [12]. In arid and semiarid areas, vegetation growth is mainly improved by precipitation, and the effects of temperature and radiation are relatively weak [1]. Xinjiang is characterized by drought, little rainfall, and sufficient light and heat resources. In previous research on the NPP in Xinjiang [13,14], simulations of the correlations between NPP and meteorological factors suggested that precipitation and temperature play major roles in NPP variation.
De Jong et al. noted that climate change can explain only approximately 54% of the changes in vegetation NPP occurring in recent decades, with the rest likely related to anthropogenic activities [15]. There is much controversy about the impact of anthropogenic activities on increases in NPP. With population aggregation and economic development, the expansion of cities and agriculture has transformed natural ecosystems into human-driven or naturally coupled ecosystems [16,17]. Many studies have shown that anthropogenic activities play an important role in increasing biomass and improving vegetation productivity and cover [5,18,19]. However, the loss of cultivated land caused by extensive construction activities is considered one of the most serious problems limiting food security in China [20]. Land use and land cover (LULC) changes can significantly affect vegetation productivity by altering the type and structure of ecosystems [21]. Therefore, LULC changes are the most important anthropogenic drivers of NPP.
Early studies showed that it is difficult to separate the contributions of climate change and anthropogenic activities to NPP variations effectively [22,23]. In addition, anthropogenic activities and meteorological variables vary widely from year to year, and the indicators used to separate them are diverse and heterogeneous. Consequently, no well-established quantitative analysis protocol currently exists [24]. Residual analysis is widely used as a robust method for quantifying the impact of climate change on vegetation productivity [25,26]. It is performed to quantify the impacts of anthropogenic activities on vegetation by using the residuals of multiple regression between climatic factors and NPP. However, there is some uncertainty about this method of quantifying the impact of climate change and anthropogenic activities on NPP, which assumes that vegetation productivity is affected only by changes in the main climatic factors and LULC. In areas where there is no anthropogenic activity, the impact of anthropogenic activities on vegetation productivity is often not as large as that calculated by this method. For example, in primary forests, in addition to the climatic factors included in the calculation, there are also factors that are not included in the calculation. Moreover, the impact of human activities is very small, but this method attributes all the NPP changes caused by these factors that are not included in the calculation to anthropogenic activities. In addition, the quantitative changes in vegetation productivity associated with changes in individual classes of LULC were ignored or not effectively evaluated in previous studies [27]. We developed the residual analysis-control variables (RES-CON) method, which can reasonably solve these problems. The main step in the RES-CON method is to calculate the contributions of climate change and anthropogenic activities to NPP change by using residual analysis and control variables separately. Although the computational process of the RES-CON method is relatively complex, the method can more reasonably demonstrate the impact of climatic factors and anthropogenic activities on regional NPP.
Vegetation dynamics and the corresponding driving mechanisms (e.g., climate warming and land reclamation) have been studied extensively [1,28], and assessments of the impacts of urbanization, climate warming and anthropogenic activities on NPP have received extensive attention. However, there is still a lack of research on arid, semiarid and ecologically fragile areas. Moreover, there are uncertainties in existing studies on separating contributions of climate change and anthropogenic activities to changes in NPP [22,23,27]. These limitations make our research meaningful. Xinjiang is an area very sensitive to climate change and anthropogenic activities. By using temperature and precipitation as two proxies for climatic factors and LULC changes as a proxy for anthropogenic activities, we assessed the influence of climate change and anthropogenic activities on NPP from 2000 to 2019 in Xinjiang. The aims of this study were: (I) to bridge the gap in vegetation productivity research in arid and semiarid zones; (II) to develop a method for effectively separating the contributions of climate change and anthropogenic activities to NPP change; and (III) to investigate the mechanisms underlying the impacts of climate change and anthropogenic activities on NPP in Xinjiang.

2. Datasets and Methodologies

2.1. Study Area

The Xinjiang Uygur Autonomous Region (Xinjiang) is located in northwestern China, with an area of approximately 1.60 million km2, accounting for 1/6 of that of the country (Figure 1). The Altay Mountains are located in the northern part of Xinjiang. The Tianshan is in the central part of Xinjiang. The Karakoram Mountains, Kunlun Mountains and Arkin Mountains are located in the southern part of this area. The Junggar Basin is located between the Altay Mountains and the Tianshan. The Tarim Basin is located between the Tianshan and the Kunlun Mountains, and the region includes both the Gurbantonggut Desert and the Taklamakan Desert. The Tianshan divides Xinjiang into two parts: northern and southern Xinjiang; northern Xinjiang is a moderate temperate arid zone, and southern Xinjiang is a warm temperate arid zone. The area is characterized by a typical arid continental climate. The vast desert area background and irrigation from alpine snowmelt make the Xinjiang oasis one of the largest in China. The vertical mountainous areas in the study region are quite different, and there are large areas of forest and grassland vegetation in the Tianshan, Altay and Kunlun mountain areas. There is typical temperate desert vegetation in both the Junggar Basin and the Tarim Basin. Xinjiang’s climate is a typical temperate continental arid climate with abundant light and heat resources. The annual sunshine hours reach 2550–3500 h. The average annual temperature is 9–12 °C. The frost-free period ranges from 180–220 d. Precipitation is scarce. The annual precipitation in northern Xinjiang is 100–200 mm, and in the south, it is below 100 mm. Evaporation, on the other hand, is 1500–2300 mm in the north and 2100–3400 mm in the south. Based on the geographical location of the region and its topographic conditions and arid climate, plant species are scarce, vegetation coverage is low, and the plant type structure is simple. Thus, the Xinjiang ecological environment is extremely fragile.

2.2. Methodology

2.2.1. NPP Estimation and Validation

The vegetation photosynthesis model (VPM) is a light-energy utilization model based on CO2 flux observations and remote sensing data. Compared with other models of the same kind, the VPM model has a simple structure and high computational efficiency [29,30]. The model has exhibited superior performance for site-level validations across a wide range of biome types. Relevant studies have also displayed satisfactory performance in simulating NPP in China [31,32,33,34]. In estimating the NPP of terrestrial ecosystems, the VPM considers dividing vegetation leaves and crowns based on the concepts of nonchlorophyll and chlorophyll parts, and the effective radiation ratio of vegetation absorption photosynthesis is divided into nonphotosynthetic vegetation absorption (FPARnpv) and chlorophyll absorption (FPARchl); only the photosynthetically active radiation (PAR) absorbed by FPARCchl is used for photosynthesis [35,36]. The VPM can be expressed as Figure 2.
The enhanced vegetation index (EVI) and land surface moisture index (LSWI) required for vegetation index calculations are calculated from the MOD09A1 surface reflectance product with a spatial resolution of 500 m and a temporal resolution of 8 days, derived from the National Aeronautics and Space Administration on 10 May 2021 (https://lpdaac.usgs.gov/). The calculation formula is as follows:
E V I = G × ρ n i r ρ r e d ρ n i r + C 1 × ρ r e d C 2 × ρ b l u e + L
L S W I = ρ n i r ρ s w i r ρ n i r + ρ s w i r
In the above equation, L = 1; C 1 = 6; C 2 = 7.5; G = 2.5; ρ n i r , ρ r e d , and ρ b l u e and ρ s w i r represent the surface reflectance of the near-infrared band (0.841 to 0.876 μm), the red band (0.620 to 0.670 μm), the blue band (0.459 to 0.479 μm), and the shortwave infrared band (1.628 to 1.652 μm), respectively.
In the VPM, F P A R c h l is approximated as a linear function of the enhanced vegetation index (EVI).
F P A R c h l = a × E V I
In the above equation, a is the empirical coefficient, and in the current version the value is 1 [35,36].
PAR data are obtained by using MODIS 1B data combined with MODIS surface reflectance products and BRDF model parameter products by retrieving the lookup table calculated by the radiation transmission model [37], with a spatial resolution of 1 km and a temporal resolution of 16 d. The PAR with a time resolution of 8 days used in the model is obtained by adding the photosynthetically active radiation in the scattered radiation and the photosynthetically active radiation in the direct radiation and multiplying by 8. The photosynthetically active radiation absorbed by the photosynthetic portion of the vegetation (APAR) is obtained by the following formula:
A P A R = F P A R c h l × P A R
T s c a l a r characterizes the effects of temperature on photosynthesis using the terrestrial ecosystem model (TEM) algorithm [38]. Temperature data are derived from the average daily temperature (http://data.cma.gov.cn/) recorded by the National Meteorological Service’s meteorological observation station on 8 June 2021. AUSPLIN is a professional meteorological interpolation software. It mainly performs interpolation through thin spline functions. The introduction of covariates (usually elevation) can make the interpolation accuracy higher, and the interpolation results smoother. We used AUNSPLINE weather interpolation software to obtain an average temperature raster dataset with a temporal resolution of 8 d and a spatial resolution of 500 m based on the DEM raster data with a spatial resolution of 100 m [39].
T s c a l a r = T T m i n T T m a x T T m i n T T m a x T T o p t 2
In the above equation, T m i n , T m a x , and T o p t are the lowest, highest, and optimum temperatures of vegetation for photosynthesis, respectively. When the air temperature is less than the minimum photosynthetic temperature, Tscalar is set to 0.
W s c a l a r characterizes the effects of moisture on photosynthesis. In the VPM, we use the land surface water index (LSWI) for calculations. The vegetation moisture factor is calculated as follows:
W s c a l a r = 1 + L S W I 1 + L S W I m a x
In the above equation, L S W I m a x is the largest LSWI in the vegetation growth season within a single cell.
P s c a l a r characterizes the effects of leaf age on photosynthesis at the canopy scale. The calculation method of P s c a l a r depends on the length of leaf life. For vegetation with a leaf life of one year, that is, it undergoes the process of budding, stretching, wilting and littering. It is calculated in two stages. The formula from the appearance of the blade to the full stretching stage is as follows:
P s c a l a r = 1 + L S W I 2
After the leaves are stretched, P s c a l a r = 1. The P s c a l a r of vegetation with leaves maintained for several growing seasons, with a canopy consisting of leaves of different leaf ages and vegetation with new leaves growing continuously throughout the growing season, P s c a l a r = 1.
The light-use efficiency (LUE) can be calculated as follows:
L U E = L U E m a x × T s c a l a r × W s c a l a r × P s c a l a r
In the above equation, L U E m a x is the maximum light-use efficiency (μmol CO2/μmol PAR). The value of L U E m a x was calculated from NEE (Net Ecosystem Exchange) and incident PAR observed from CO2 eddy flux tower sites [33].
GPP can be calculated as follows:
G P P = L U E × A P A R
NPP is estimated by the ratio of autotrophic respiration to GPP. According to the experimental results of respiration rate on crops [40,41,42,43,44], the ratio value of autotrophic respiration to GPP generally remains constant and equal to 0.42.
Model validation data were based on the Xinjiang statistical yearbook during 2000–2019, and we obtained it on 20 July 2021 (http://nianjian.xiaze.com/info/xjtjnj.html). The agricultural statistics in it contain the data of each county-level administrative unit and have continuous records, so it is feasible to apply statistical data for NPP model simulation results verification. The approach of verifying the NPP estimated by the model is based on the crop yield and area data and the corresponding statistical data. The principle of this method is as follows: based on the water content and harvest index values of different crop harvest parts, the various crop yields obtained from agricultural statistics are converted into vegetation carbon reserves. Correlation analysis was carried out between the vegetation carbon storage calculated through the yearbook data and the NPP simulated by the model (average NPP per year) to verify the simulation effect of the model. The formula used to convert China’s main crop data to NPP is as follows [45]:
N P P = i = 1 N Y i × 1 M c i × 0.45 g C g H I i × 0.9 / i = 1 N A i
where N is the number of crop types; Y i is the total yield (g) of crop i ; A i is the harvest area (m2) of crop i ; M c i is the moisture content of the harvested portion of crop i ; and H I i is the harvest index of crop i . The water content and harvest index of the main crop harvest parts were obtained from the literature [45].
The correlation between these two variables was proven significant (R2 = 0.64, p < 0.001). It indicates that the model estimation accuracy is satisfactory.

2.2.2. Theil–Sen Median Method

The Theil–Sen median method is often used to calculate the trend of long sequences because of its robustness.
β = m e a n x j x i j i , j > i
In the above equation, x j and x i are time series, β > 0 indicates an upward trend in the time series, and β < 0 indicates a downward trend in the time series.
The Mann–Kendall method was first proposed by Mann in 1945 and expanded by Kendall in 1970 [46]. The advantage of this approach is that it does not require measurements to be normally distributed, nor does it require that the trend be linear. Moreover, this approach is not affected by missing values and outliers, and it is widely used in trend-significant tests of long-term sequence data. The statistical test in this method can be formulated as follows.
For time series x , x = x 1 , x 2 ,   , x n , the statistics of the Mann–Kendall trend test are as follows:
s = i = 1 n 1 j = i + 1 n s i g n x j x i n j i
where x j and x i are the j-th and i-th values of the time series, n is the length of the data sample, and s i g n is the sign function, which is defined as follows:
s i g n θ = 1 ( θ > 0 ) 0 θ = 0 1   ( θ < 0 )
when n ≥ 8, the statistic S roughly obeys the normal distribution, its mean is 0, and the variance is:
V a r S = n n 1 2 n + 5 18
The standardized statistics are calculated according to the following formula:
Z = S 1 V a r S S > 0 0 S = 0 S + 1 V a r S S < 0
Null hypothesis H0: β = 0, when Z > Z 1 α / 2 , reject the null hypothesis. Z is the standard normal variance, and α is the significance test level.

2.2.3. Hurst Index

Self-similarity and long-range dependence have become important concepts in recent years [47,48]. One of the main ways to quantify long-range dependencies is to estimate the Hurst index. R/S analysis is the most common method used to calculate the Hurst index. The calculation steps are as follows [49]:
N P P τ ¯ = 1 τ t = 1 τ N P P τ τ = 1 , 2 , 3 , , n
X t , τ = t = 1 t N P P t N P P τ ¯ 1 t τ
R τ = max 1 t τ X t , τ min 1 t τ X t , τ τ = 1 , 2 , 3 , , n
S τ = 1 τ t = 1 τ N P P t N P P τ 2 1 2 τ = 1 , 2 , 3 , , n
R τ S τ = c τ H
In the above equation, c is a constant, and the H value can be obtained by linearly fitting the equation log R / S n = a + H × l o g n with the least squares’ method.
According to Wang [50], the Hurst index varies from 0 to 1. When 0 < H < 0.5, the time series changes inconsistently and may display the opposite trend in the future. The time series changes are random when H is 0.5, and the past trend has no effect on the future trend. When 0.5 < H < 1, the time series changes are consistent, and the future trend is the same as that in the past.

2.2.4. Partial Correlation Analysis

Partial correlation analysis has been used in many studies to explore vegetation-climate interactions [51,52,53]. Following these studies, the partial correlation analysis can test the links among NPP, temperature, and precipitation. The temperature and precipitation data were obtained from the National Meteorological Information Center on 8 June 2021 (http://data.cma.cn/). We used AUNSPLINE weather interpolation software to obtain an average temperature raster dataset and annual precipitation raster dataset with a temporal resolution of one year and a spatial resolution of 500 m based on the DEM raster data with a spatial resolution of 100 m.
R X Y · Z = R X Y R X Z × R Y Z 1 R X Z 2 × 1 R Y Z 2
In the above equation, R X Y · Z is the partial correlation coefficient of X to Y , Z = Z 1 ,   Z 2 ,   ,   Z n is the control variable, and R X Y , R Y Z and R X Z represent the general correlation coefficients of X and Y , X and Z , and Y and Z , respectively.

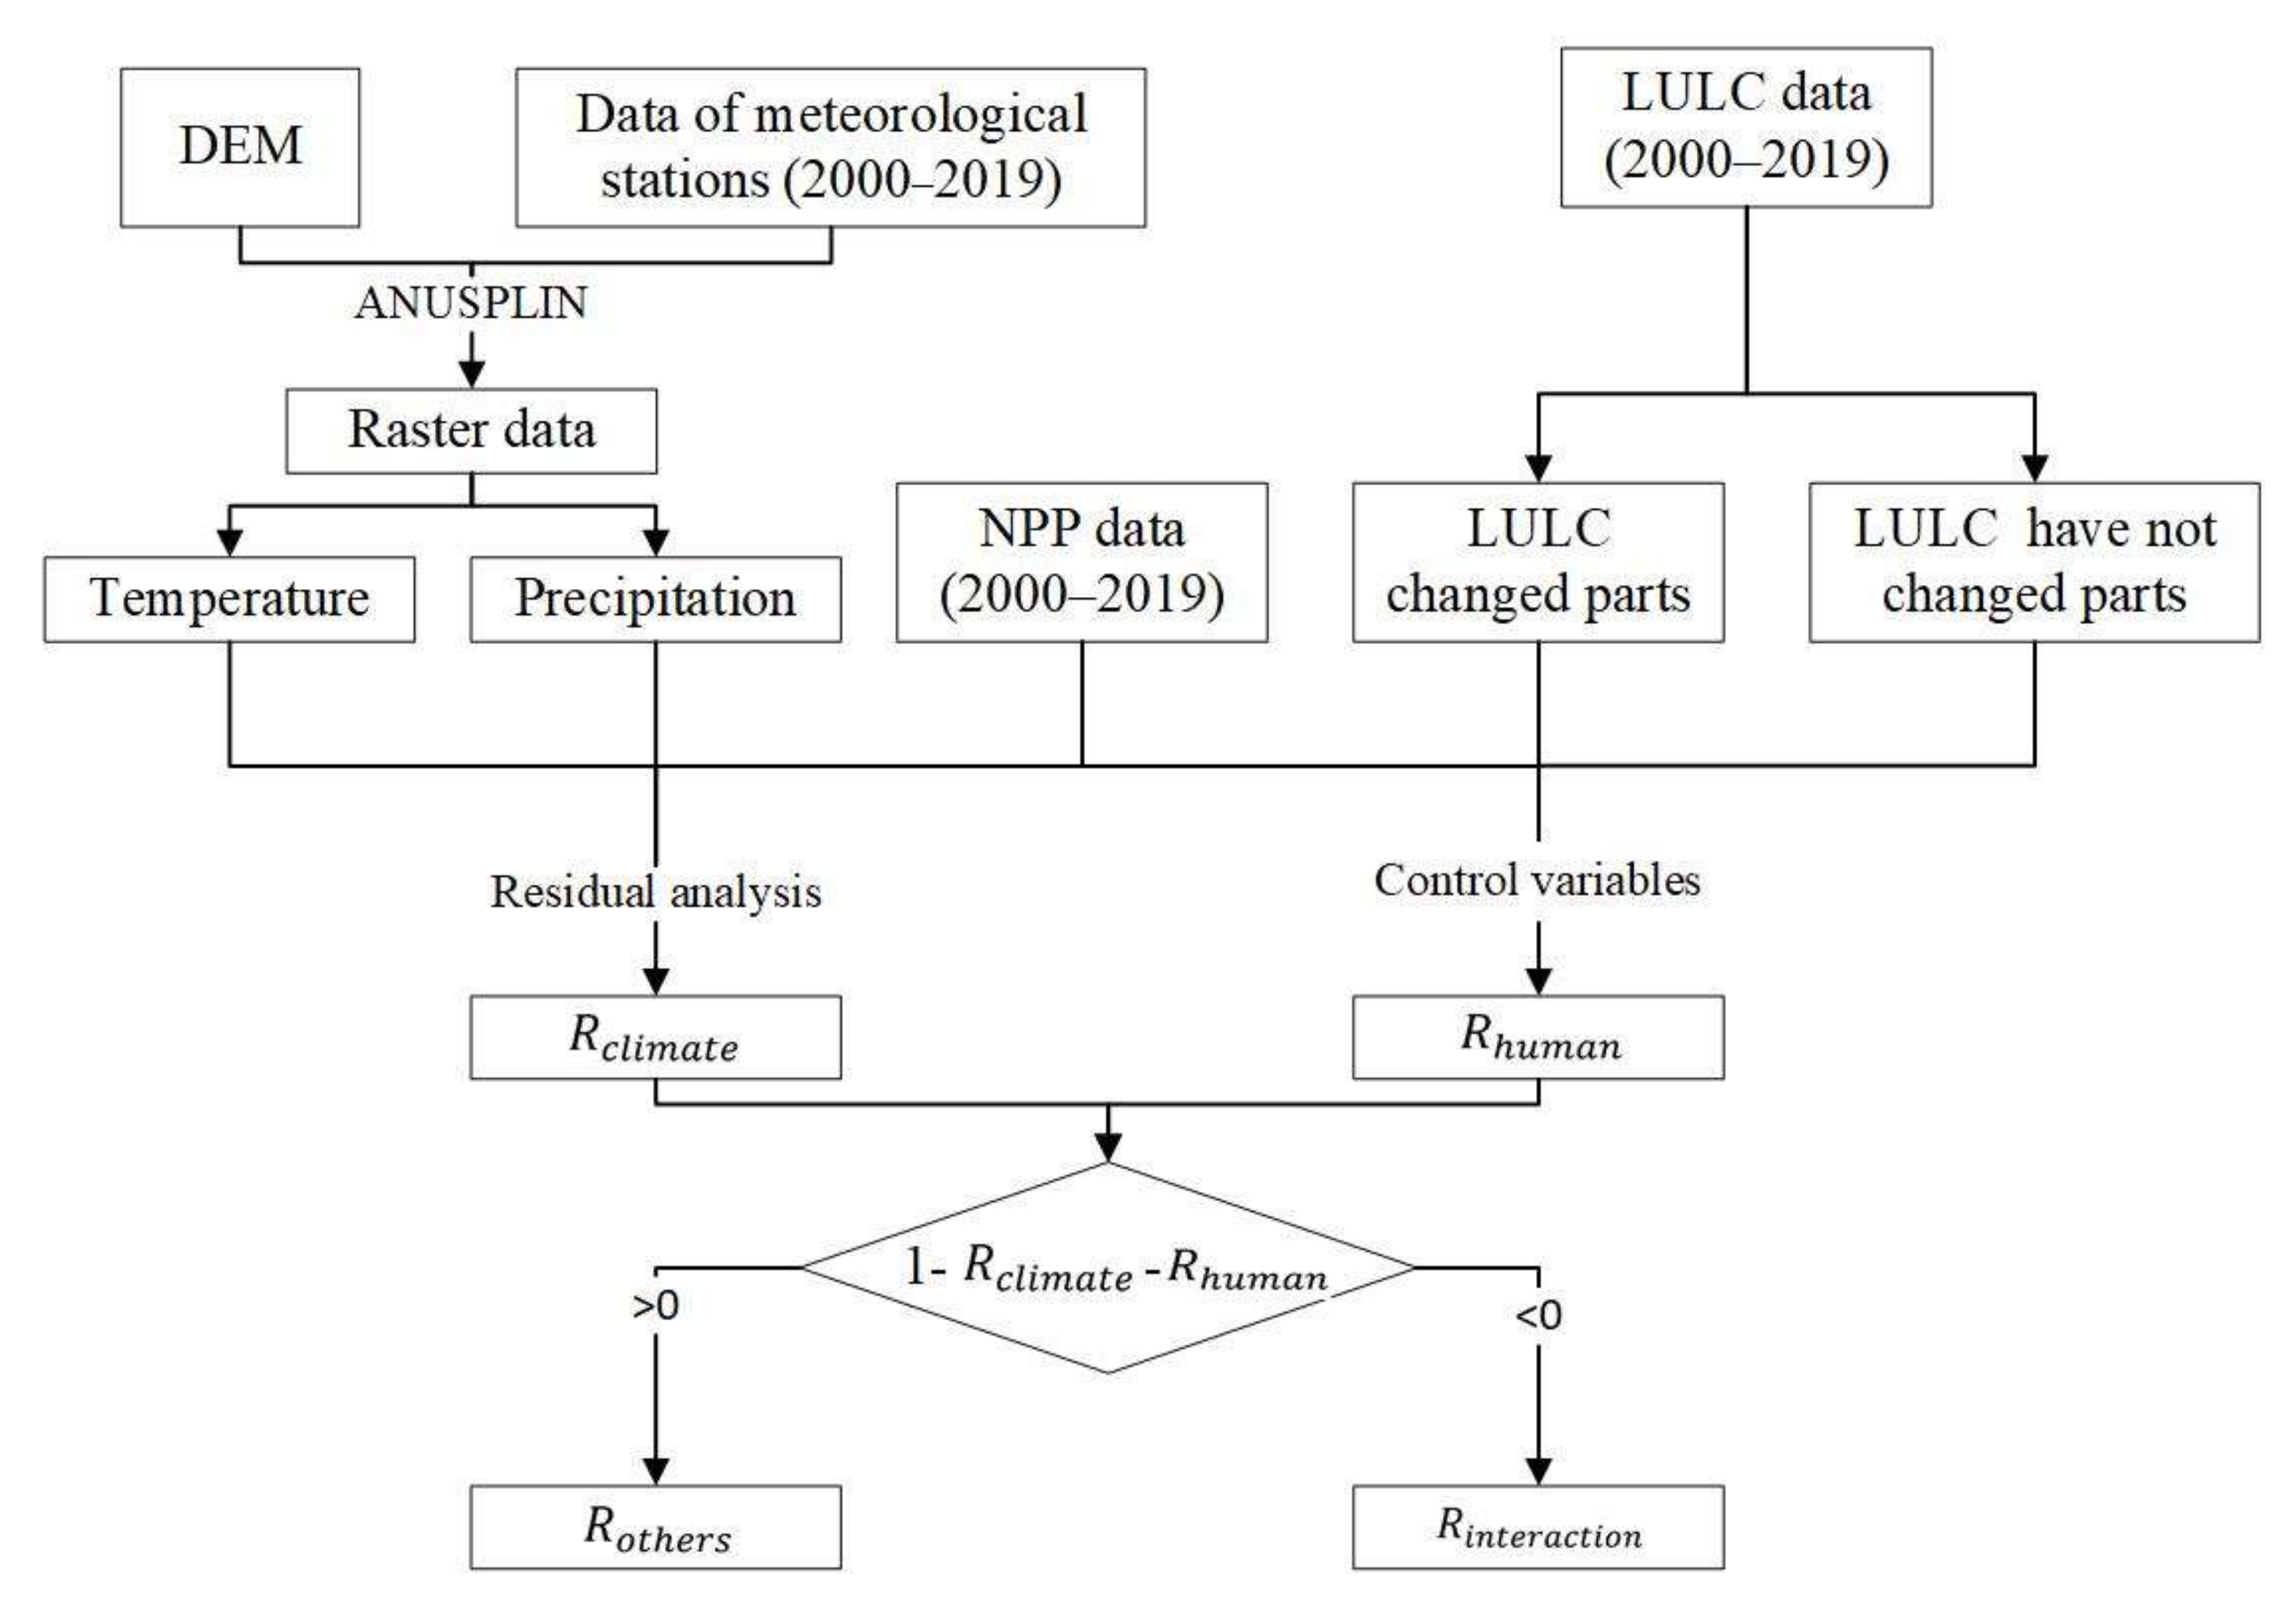
2.2.5. The RES-CON Method

The contents of the RES-CON method are shown in Figure 3.
We used AUNSPLINE weather interpolation software to obtain an average temperature raster dataset and annual precipitation raster dataset with a temporal resolution of one year and a spatial resolution of 500 m based on the DEM raster data with a spatial resolution of 100 m. We used the residual analysis method to study the impact of climate change to NPP. The method mainly includes the following three steps [54,55,56,57]: (I) NPP is the dependent variable, temperature and precipitation are the independent variables, a binary linear regression model is established, and the parameters in the model are calculated. (III) Based on temperature and precipitation data and the parameters of the established regression model, NPP prediction values are calculated to indicate the effects of climatic factors on NPP. (III) The difference between the observed NPP and forecasted NPP (i.e., the NPP residual) is used to indicate the effects of other factors (such as anthropogenic activities) on the NPP. The corresponding formula is as follows:
N P P C C = a × T + b × P + c
N P P O 1 = N P P o b s N P P C C
In the above equation, N P P C C and N P P o b s refer to NPP predictions based on a regression model and actual NPP, respectively; a , b and c are model parameters; T and P are the average temperature (°C) and cumulative precipitation (mm), respectively, and N P P O 1 is the residual.
In addition, considering the complexity of each driving mechanism, the relative contributions of climate change and other factors to the NPP variation are calculated according to Table 1 [58,59]. A positive slope for N P P o b s from 2000 to 2019 represents an NPP increase, whereas a negative N P P o b s represents NPP degradation. The slopes of N P P C C and N P P O 1 from 2000 to 2019 reflect the impacts of climate change and other factors on NPP, respectively.
Pan et al. [60] proposed a method to quantify the effects of an individual LULC change on NPP. The LULC data for Xinjiang were obtained from the National Land Use Dataset on 1 June 2021 (NLUD), which is established from the remote sensing surveys of resources and the environment by the Chinese Academy of Sciences (https://www.resdc.cn/Datalist1.aspx?FieldTyepID=1,3). First, the study area is divided into LULC changed parts and LULC have not changed parts. In the LULC changed parts, NPP variation is influenced not only by LULC conversion, but also by impact factors other than anthropogenic activities. In the LULC have not changed parts, other factors lead to NPP variations for certain types of LULC from the initial NPP values to the final NPP values. The initial and final NPP values were averaged for the first five years (2000–2004) and the final five years (2015–2019). The NPP variation caused by the transformation of a certain LULC type is expressed as follows:
Δ N P P t r a n s f o r m = Δ N P P f a c t Δ N P P O 2
In the above equation, Δ N P P f a c t is the actual NPP variation in a LULC changed part, and Δ N P P O 2 is the NPP variation in the have not changed part of the LULC. O2 is other factors 2 (impact factors other than anthropogenic activities). In areas where the type of LULC is changed, the relative contribution of anthropogenic activities to NPP variations is expressed as follows:
R h u m a n = Δ N P P t r a n s f o r m Δ N P P t r a n s f o r m + Δ N P P O 2 × 100 %
After calculating the contribution of meteorological factors and human activities to NPP changes, respectively, we attribute the remaining contribution to factors such as climate factors that have not been taken into account. In addition, there are interactions between climate change and human activities, so the degree of contribution may be double calculated to be greater than the actual contribution. We attribute the part of the sum of the contributions of meteorological factors and human activities to NPP change greater than one to the interaction between climate change and human activities.

3. Results

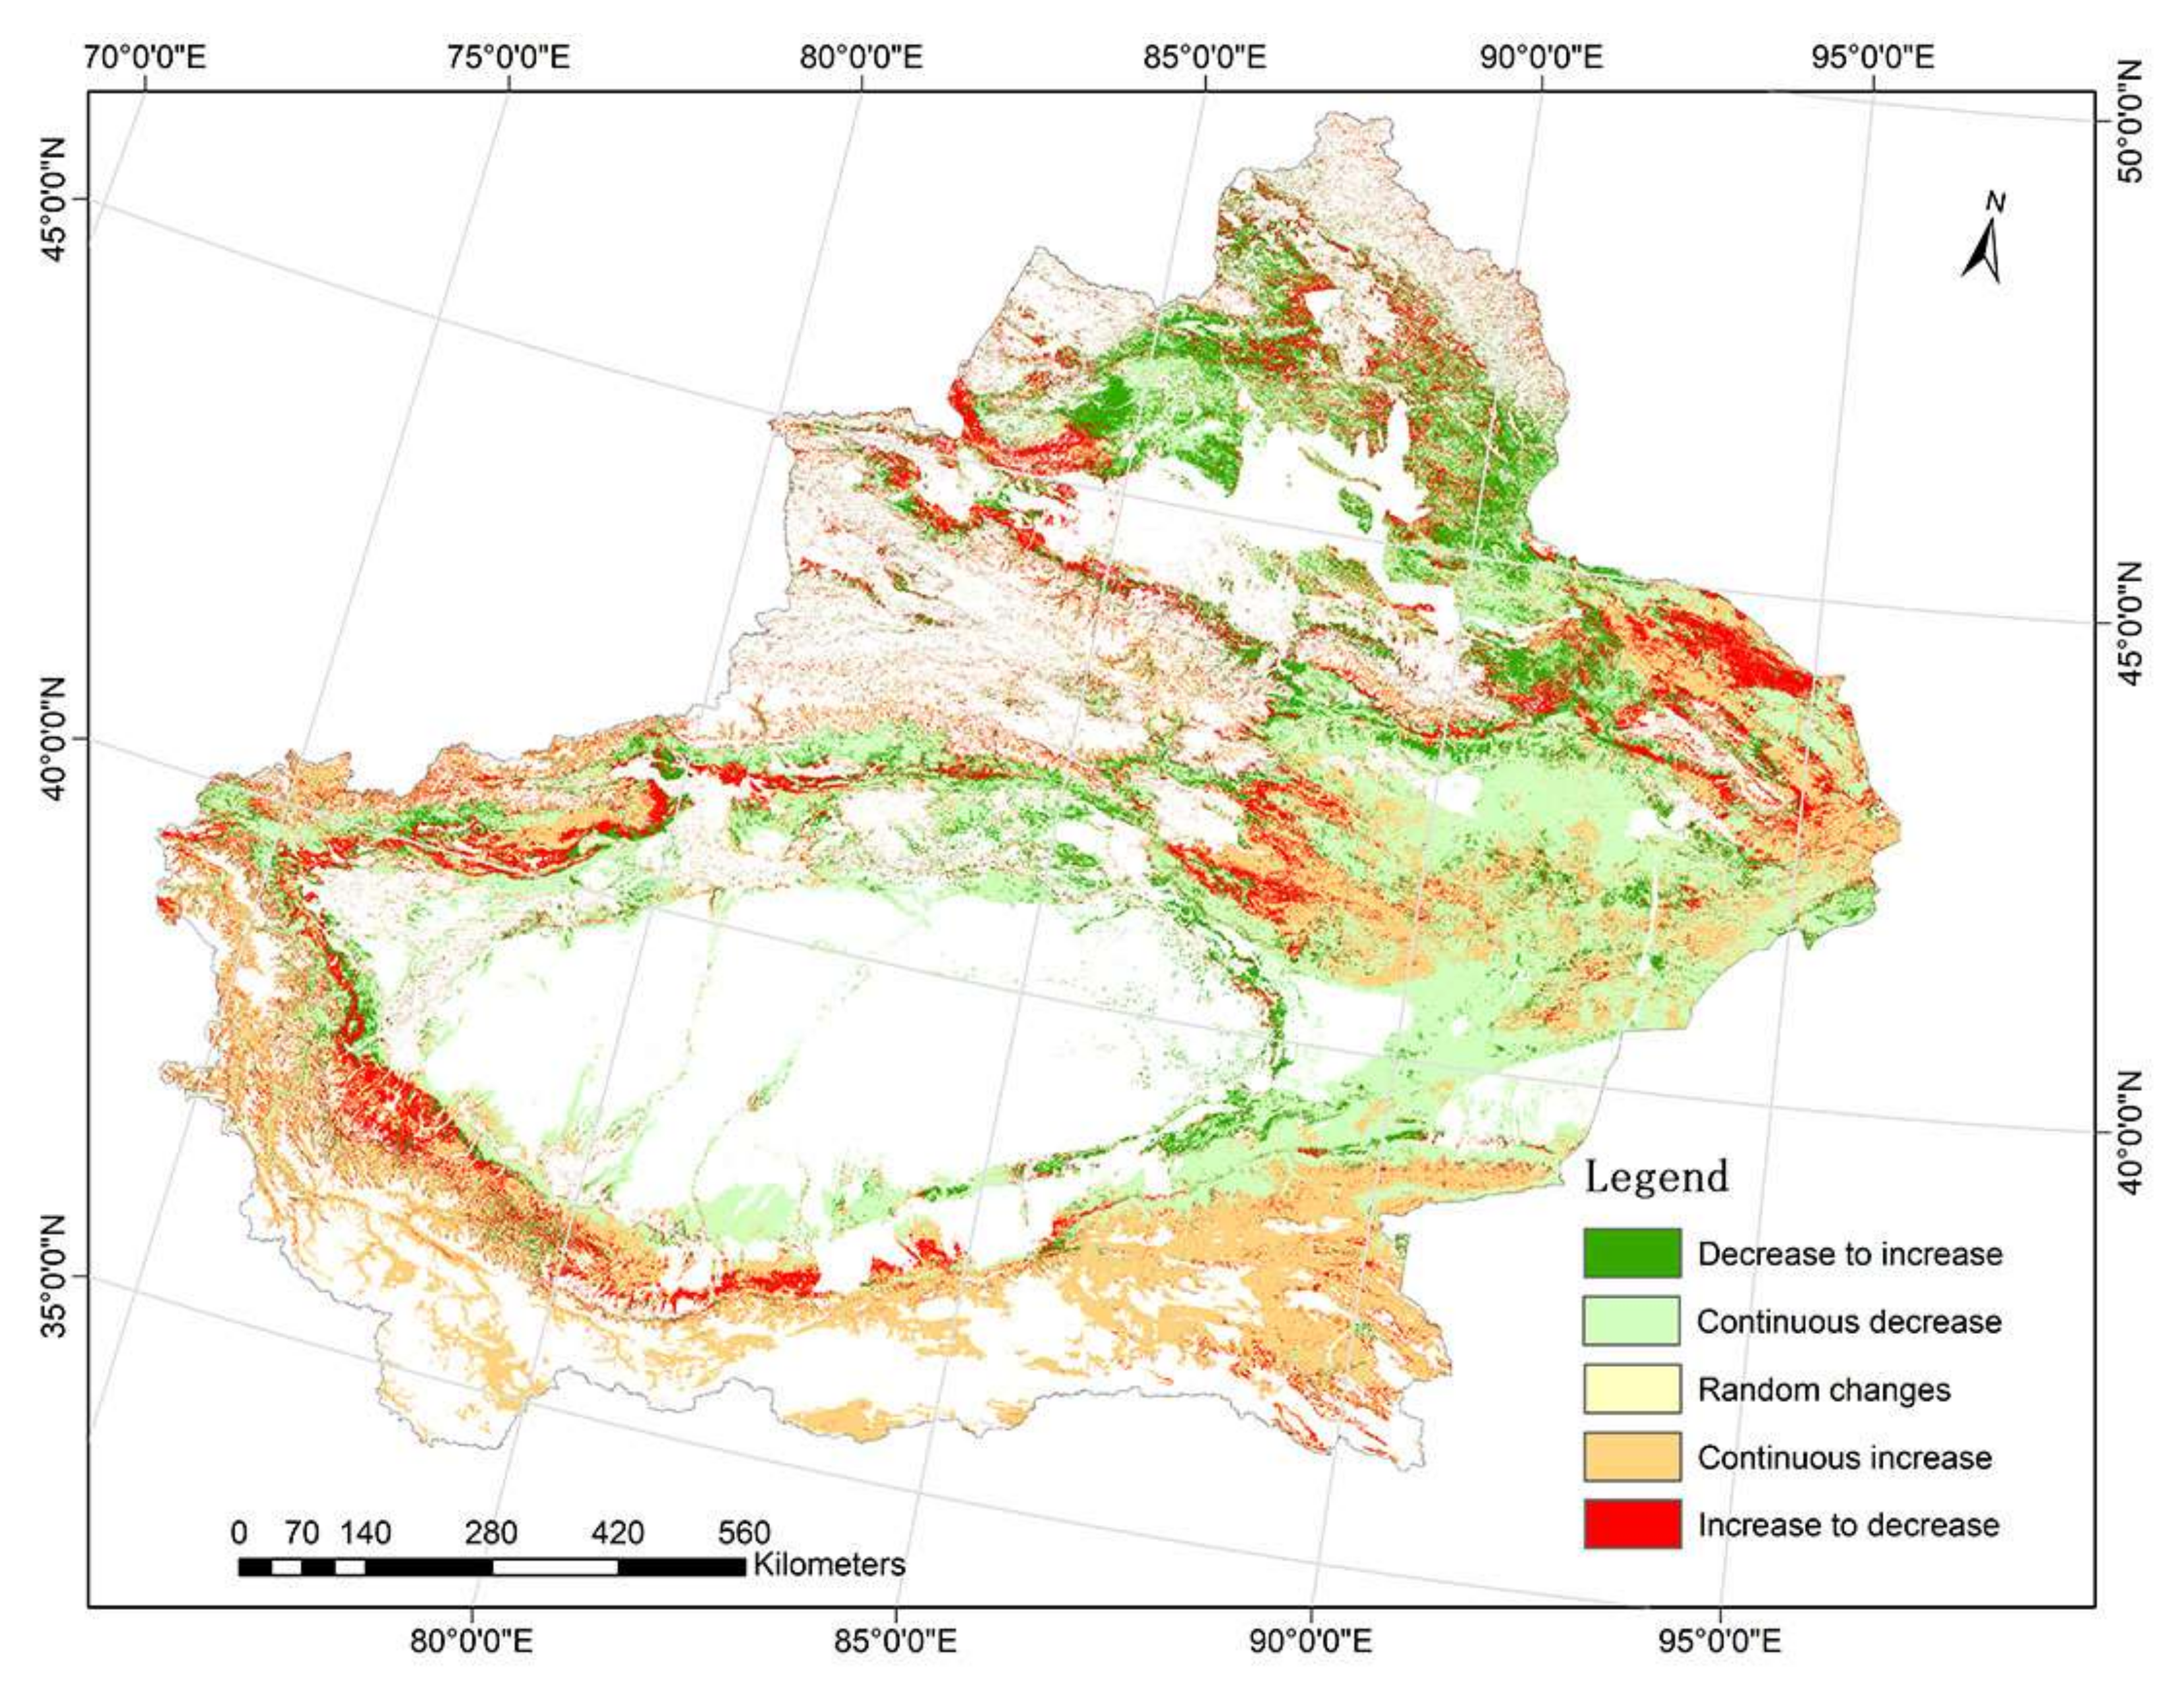
3.1. Spatiotemporal Variation in NPP from 2000 to 2019

As shown in Figure 4, in the 2000–2019 period, the average NPP in Xinjiang exhibited an overall growth trend. According to statistics, the average NPP in Xinjiang increased by 17.77% in 2019 compared with the value in 2000. The annual average NPP in Xinjiang from 2000 to 2019 was 117.91 gC·km−2. The highest value in this period was 148.06 gC·km−2, and the lowest was 101.15 gC·km−2. In the 95% significance test, reductions were observed in 0.26% of the study area, minor reductions were observed in 5.55% of the study area, no change was observed in 70.65% of the study area, obvious increases were observed in 1.75% of the study area, and minor increases were observed in 21.78% of the study area. Overall, 17.72% more regions displayed increases than displayed decreases. Spatially, most regions in Xinjiang exhibited a significant growth trend. The areas where obvious increases occurred were mainly distributed on the northern slope of the Tianshan; in the Tarim and Kashgar River basins and in the specific areas of Tacheng, Changji, Bortala, Aksu, Kashgar, Ili and other artificial oasis areas. The areas with notable reductions were mainly located in the northern Altay Mountains and the western mountains of the Tianshan, and on specific area is Ili. Areas of obvious increase were approximately seven times more abundant than areas of obvious decrease. In addition, 33.79% of the areas with obvious increases in NPP were arable land areas (based on the LULC in 2000), and 61.70% were grassland.
According to Figure 5, between 2000 and 2019, the average NPP in Xinjiang exhibited a continuous increasing trend, continuous decreasing trend, increasing-to-decreasing trend, decreasing-to-increasing trend and random/nonsignificant trend in 17.2%, 17.63%, 7.70%, 8.10% and 49.37% of the region, respectively. Overall, the area of the region in which the future trend is projected to increase is very similar to that in which the future trend is projected to decrease. Spatially, the areas of continuous increase are mostly located in the eastern Tianshan and the Kunlun Mountains, and the increasing-to-decreasing areas and the decreasing-to-increasing areas are mainly located at the edges of the Tianshan and the Altay and Kunlun Mountains. Continuous decreases are mainly observed around the deserts of eastern Xinjiang. For cultivated land and grassland (based on the LULC from 2000), the area of the region with continuous increasing and increasing-to-decreasing trends is larger than the area of the region with continuous decreasing and decreasing-to-increasing trends. This result is opposite for woodland land cover areas. For construction land, areas with a continuous decreasing trend are larger than areas with a continuous increasing trend.

3.2. The Contributions of Climate Change to NPP Variations

Figure 6 and Figure 7 shows that the correlations between temperature and NPP are generally opposite the correlations between precipitation and NPP. Precipitation and temperature in Xinjiang from 2000 to 2019 exhibited an overall upwards trend. Except for a very small number of meteorological sites where temperature and precipitation are declining, other meteorological sites exhibited increasing trends. Precipitation plays an important role in promoting vegetation productivity. In Xinjiang, 2.63% of the region exhibited a significant positive correlation between precipitation and NPP, and these areas were mainly located in the Tianshan, the Tarim Basin and the Junggar Basin. NPP and precipitation were significantly negatively correlated in 0.88% of the area, mainly in the northern Tarim River basin. In addition, in the western Kunlun Mountains, NPP is significantly positively correlated with temperature. The partial correlation analysis showed that 1.87% of Xinjiang exhibited a significant positive correlation between temperature and NPP, mainly in the western Kunlun Mountains. Additionally, 2.20% of the region was significantly negative, and these areas were mainly distributed in the Tianshan and the eastern Kunlun Mountains.
According to Figure 8, the contribution of climate change to NPP variations was below 40% in 86.76% of Xinjiang. The area with a contribution of 60–100% accounts for 13.24% of the region. The areas in which climate change contributed to the NPP variations were mostly located in grassland and unused land in mountains, deserts and their marginal areas. The total area in which climate change influenced vegetation productivity was larger than the total area influenced by anthropogenic activities. The average contribution of climate change to the NPP variation was 21.44%. In regions where anthropogenic activities occur, the average contribution of climate change was 15.53%. The average contribution to climate change in other regions was 21.72%.

3.3. The Contributions of Anthropogenic Activities to NPP Variations

According to Figure 9, Figure 10 and Table 2, areas of LULC conversion in Xinjiang accounted for 4% of the total area. Compared with the proportion of arable land in Xinjiang in 2000, the arable land area increased significantly in 2019, from 3.99% of the region to 5.7%. Grassland and unused land were the main sources of transformation. The areas that experienced increases in arable land were mainly distributed on the northern slope of the Tianshan, the Irtysh River basin and the Tarim River basin. The reduction in arable land area was very small. The reduction in grassland was mainly due to conversion into cultivated land and unused land. Woodland and unused land were minimally reduced. Construction land and water areas exhibited slight increases in abundance, mainly due to the conversion of cultivated land, grassland and unused land. New construction land was mainly distributed in northern Xinjiang, and areas with reductions in construction land were mainly located in Ili. In addition, the proportion of farmland expansion into grassland areas was much higher than that for the conversion of farmland to woodland and grassland. The proportion of converted unused land to other LULC types was much higher than that from other LULC types to unused land.
As shown in Table 3, in general, LULC changes had an important positive impact on the increase in NPP in Xinjiang, especially in grassland areas. The conversion of grassland to other LULC types (mainly cultivated land) resulted in a significant increase in NPP, and the conversion of cultivated land to other LULC types led to a significant decrease in NPP. In addition, the conversion of woodland, waters, construction land and unused land to other LULC types led to an increase in NPP. Therefore, in addition to urbanization and the loss of arable land, LULC changes are conducive to improvements in NPP. In addition, the NPP in areas with unaltered LULC increased to varying degrees, especially in cultivated areas and construction land. This is inseparable from the proper management of anthropogenic activities.
According to Figure 11, the contribution of anthropogenic activities to NPP was below 20% in 96.33% of the region. The areas with a contribution of 80–100% accounted for 1.95% of Xinjiang, and the remaining 1.72% of the region included areas with a contribution of 20–80%. Overall, in the study area, climate change contributed far more to the NPP variation than anthropogenic activities. The average contribution of anthropogenic activities to the NPP variation was 3.46%. In regions where anthropogenic activities occur, the contribution of anthropogenic activities was 75.01%. Thus, in areas with anthropogenic activities, anthropogenic activities were the dominant factor affecting the variations in NPP, and climate change contributed more to NPP in other regions. The areas with anthropogenic activities that significantly contributed to NPP changes were in basins. Most LULC changes involved the mutual conversion of cultivated land, grassland, construction land and unused land.

4. Discussion

4.1. Method Evaluation

To solve the problem of uncertainty in quantitative analysis of the contributions of factors affecting vegetation productivity, we proposed the RES-CON method. Based on the research of Wu et al. [61] and Pan et al. [60], six different scenarios were established through residual analysis, and the contribution of climate change to NPP was evaluated. The control variable method was used to determine the impact of anthropogenic activities on NPP. Our research showed that the quantitative representation of the effects of climate change and anthropogenic activities on the NPP variation based on the RES-CON method was reasonable. In addition, we effectively separated the contributions of climate change and anthropogenic activities to the NPP variation. Compared with common contribution separation methods, the RES-CON method avoids the problem of uncertainty assessment regarding the impact of anthropogenic activities on vegetation far from human settlements. We quantitatively revealed the impact of changes in each LULC on vegetation. Moreover, the effect of anthropogenic activities on vegetation productivity was not influenced by the number of meteorological factors considered. The RES-CON method provides a new way of quantitatively assessing the impacts of anthropogenic activities and climate change on NPP and supports the consideration of other factors, thus effectively reflecting the actual situation.

4.2. Impact Mechanisms of Climate Change and Anthropogenic Activities on Vegetation Productivity in Xinjiang

4.2.1. Changes in Vegetation Productivity in Xinjiang

NPP across the study area increased between 2000 and 2019, as reported in previous studies [21]. For grasslands and woodlands, the increase in NPP was mainly due to increased moisture. The improvements in NPP in arable land, unused land and construction land areas were mainly related to proper human management. The ecological projects implemented during the study period yielded some notable results. However, arable land and construction land areas still face a higher risk of vegetation degradation than do other LULC types. Anthropogenic activities are the main driver of NPP variation in areas where they occur, while the total area in Xinjiang where climate change (mainly temperature and precipitation, the same below) is the most important driver is larger than the total area where anthropogenic activities are the dominant driver. On the whole, the results of this paper indicate that both climate change and anthropogenic activities have a positive impact on NPP.

4.2.2. Impact Mechanisms of Climate Change on Vegetation Productivity

In Xinjiang, climate change has a large area of influence on vegetation productivity, but its contribution is generally small. The mechanism of influence of climate variables on vegetation NPP variations is complex. Moisture is the raw material used to make organic matter. The amount of water affects the photosynthesis of crops and the absorption and transport of nutrients in crops. Moisture is the largest component of the plant itself, which allows the plant to use evapotranspiration to regulate its temperature and physiology. Jiao et al. reported that in arid areas, increased precipitation can improve plant growth conditions and thus increase vegetation productivity [62]. The general increase in precipitation in Xinjiang is the key factor in the general increase in vegetation productivity. Moreover, the effect of temperature on growth is comprehensive: it can influence plant growth by affecting metabolic processes such as photosynthesis, respiration and evapotranspiration and by affecting the synthesis and transportation of organic matter. It can also directly affect soil temperature and affect plant growth by affecting the absorption and transmission of water and fertilizer. An increase in temperature can improve the photosynthesis of plants, promote vegetation growth, increase evaporation and reduce the photosynthesis rate [1,28,63].
In our study area, an increase in precipitation improved the soil water conditions and the vegetation photosynthesis rate. An increase in temperature promoted photosynthesis and other processes, which, in turn, promoted plant growth but also water loss through transpiration and redistribution, leading to plant water shortage. Our study suggests that in the mountain areas of Xinjiang, the increases in precipitation and snowmelt associated with climate warming provide sufficient moisture to promote vegetation growth, so there is a clear growth trend in grassland portions of most mountain areas. However, when evaporation exceeds the amount of water supplied by precipitation and snowmelt, the vegetation NPP shifts from increasing to decreasing. This change is most likely the reason why grassland and woodland exhibited a downward trend or an increasing-to-decreasing trend in NPP in many areas in future projections.
The general increase in precipitation in the study area in recent decades can supplement the increase in the water demand associated with rising temperatures, which is, to some extent, helpful for promoting the growth of farmland, grassland and woodland vegetation. There is a clear decreasing precipitation trend in the Tianshan and Altay Mountains in northwest Xinjiang. NPP is highly correlated with precipitation in these places, so vegetation NPP also displays a significant decreasing trend. In the Kunlun Mountains in southern Xinjiang, there is a clear upward trend in temperature, and the correlation between NPP and temperature is high. Therefore, the NPP in the Kunlun Mountains exhibits an upward trend in both the past and future projections.

4.2.3. Impact Mechanisms of Anthropogenic Activities on Vegetation Productivity

In areas where anthropogenic activities occur, their impact is much greater than the impact of climate change, and changes in cultivated land have had a particularly large impact on NPP. Previous studies have shown that agricultural expansion has increased NPP in dryland areas [5], and this conclusion is consistent with those of our study. In the past 50 years, large-scale land reclamation has resulted in the rapid transformation of grassland into farmland. Numerous studies have shown that projects such as the Grain for Green Program (GGP), the Natural Forest Protection Project (NFPP) and the Sloping Land Conversion Project (SLCP) have effectively mitigated enormous environmental challenges and induced LULC changes in China (Yu et al., 2011). In our study, we found that in Xinjiang, vegetation productivity has improved significantly in areas influenced by anthropogenic activities. This result demonstrates that human environmental construction has played a great role. However, it is worth noting that the main result of NPP increases in arable land is an improved food supply, not carbon sequestration [64,65,66,67]. Irrigation, long-term chemical fertilization, high-density cultivation and other measures may result in the degradation of soil conditions.
Moreover, the woodland area exhibiting a continuous decrease in NPP in the future is significantly larger than that with increasing NPP. This may be related to the insufficient supply of water resources to newly afforested areas. According to previous research [68,69], in arid and semiarid areas, planting trees can increase vegetation cover, but as afforestation increases, soil moisture shortages increase. Thus, in Xinjiang, we should consider the natural conditions when implementing ecological repair projects, and these projects should be considered from multiple perspectives according to the local conditions without overreliance on afforestation.
In Xinjiang, to meet people’s food needs based on protecting the environment, it is most important to increase yield in existing agricultural land. In the future, increasing food production should be prioritized based on a sustainable approach to agricultural intensification, e.g., improving the efficiency of the use of natural resources based on the sustainable use of water, soil and nutrients instead of reclaiming grasslands and woodlands to increase the arable land area. Increased attention should be given to how existing agricultural practices could be better managed to mitigate the conflict between NPP growth and sustainable development.

4.3. Uncertainties and Limitations

It should be noted that there are some limitations in this paper. Because meteorological sites are sparse in mountain zones, there are inherent errors in the calculated meteorological data to a certain extent. In this paper, only the two main climatic factors, temperature and precipitation, were considered, whereas the influences of climate change are controlled by a variety of factors. In addition, there are complex positive and negative feedback effects between climate change and LULC changes. Due to the complexity and lag of the impact of LULC changes on ecosystems and the difficulty of obtaining large-scale and continuous LULC data, the impact of many anthropogenic activities (e.g., ecological restoration projects) on the local ecological environment cannot be quantified. To better understand changes in the carbon sequestration capacity of terrestrial ecosystems in arid areas under changing circumstances, it is necessary to further study the response of vegetation to the dynamics of LULC structures and functions and to comprehensively explore the quantitative expressions of the impacts of climate change and anthropogenic activities on NPP.

5. Conclusions

In this study, NPP simulated by the VPM was selected as an index of vegetation productivity. Temperature and precipitation were selected as the evaluation indices of the main climatic factors, and LULC changes were selected as the evaluation indices of anthropogenic activities. Then, the impact of climate change and anthropogenic activities on NPP were evaluated through the RES-CON method. The main conclusions of this study are as follows.
(1)
The RES-CON method effectively separates the contributions of climate change and anthropogenic activities to the NPP variation. It avoids the problem of uncertain assessment regarding the impact of anthropogenic activities on vegetation far from human settlements. In addition, the effect of anthropogenic activities on vegetation productivity is not influenced by the number of meteorological factors considered.
(2)
Where anthropogenic activity occurs, it dominates vegetation NPP change, while the total area in Xinjiang where climate change is the most important driver is larger than the total area where anthropogenic activities are the dominant driver. The average contribution of climate change to the NPP variation (21.44%) is much greater than that of anthropogenic activities (3.46%). However, in areas where anthropogenic activities occur, the average contribution of anthropogenic activities to the NPP variation (75.01%) is much greater than the average contribution of climate change (15.53%).
(3)
NPP in the research area displayed an upward overall trend between 2000 and 2019. Most anthropogenic activities and climate change in Xinjiang contributed to the increase in NPP during the study period. For grasslands and woodlands, the increase in NPP was mainly due to increased moisture. The improvements in NPP in arable land, unused land and construction land areas were mainly related to proper human management.

Author Contributions

Conceptualization, G.H.; methodology, C.X.; software, C.X.; validation, C.X.; formal analysis, Z.H.; investigation, C.X. and G.H.; resources, C.X.; data curation, Z.Z.; writing—original draft preparation, C.X.; writing—review and editing, S.W., Q.Z., G.L. and Z.H.; visualization, C.X.; supervision, G.L.; project administration, G.L.; funding acquisition, S.W. All authors have read and agreed to the published version of the manuscript.

Funding

This work is supported by the Strategic Priority Research Program (A) of the Chinese Academy of Sciences (XDA23100201) and The National Science and Technology Basic Resources Survey Special Project under Grant 2017FY101004.

Acknowledgments

We would like to extend our sincere gratitude to the academic editor and reviewers for their constructive comments, which greatly helped us improve the quality of this manuscript.

Conflicts of Interest

The authors declare no conflict of interest. The founding sponsors had no role in the design of the study, in the collection, analyses, or interpretation of the data, in the writing of the manuscript, or in the decision to publish the results.

References

  1. Jiang, H.; Xu, X.; Guan, M.; Wang, L.; Huang, Y.; Jiang, Y. Determining the contributions of climate change and human activities to vegetation dynamics in agro-pastural transitional zone of Northern China from 2000 to 2015. Sci. Total Environ. 2020, 718, 134871. [Google Scholar] [CrossRef]
  2. Smithson, P.A. IPCC, 2001: Climate change 2001: The scientific basis. Contribution of working group 1 to the third assessment report of the intergovernmental panel on climate change, edited by J.T. Houghton, Y. Ding, D.J. Griggs, M. Noguer, P.J. Van der linden, X. Dai, K. Maskell and C.A. Johnson (eds). Cambridge University Press, Cambridge, UK, and New York, USA, 2001. No. of pages: 881. Price £34.95, us$ 49.95, isbn 0-521-01495-6 (paperback). £90.00, us$ 130.00, isbn 0-521-80767-0 (hardback). Int. J. Climatol. 2002, 22, 1144. [Google Scholar] [CrossRef]
  3. Bond-Lamberty, B.; Bailey, V.L.; Chen, M.; Gough, C.M.; Vargas, R. Globally rising soil heterotrophic respiration over recent decades. Nature 2018, 560, 80–83. [Google Scholar] [CrossRef] [PubMed]
  4. Li, H.; Wang, S.; Bai, X.; Luo, W.; Tang, H.; Cao, Y.; Wu, L.; Chen, F.; Li, Q.; Zeng, C.; et al. Spatiotemporal distribution and national measurement of the global carbonate carbon sink. Sci. Total Environ. 2018, 643, 157–170. [Google Scholar] [CrossRef] [PubMed]
  5. Piao, S.; Yin, G.; Tan, J.; Cheng, L.; Huang, M.; Li, Y.; Liu, R.; Mao, J.; Myneni, R.B.; Peng, S.; et al. Detection and attribution of vegetation greening trend in China over the last 30 years. Glob. Change Biol. 2015, 21, 1601–1609. [Google Scholar] [CrossRef] [PubMed]
  6. Liu, X.; Pei, F.; Wen, Y.; Li, X.; Wang, S.; Wu, C.; Cai, Y.; Wu, J.; Chen, J.; Feng, K.; et al. Global urban expansion offsets climate-driven increases in terrestrial net primary productivity. Nat. Commun. 2019, 10, 5558. [Google Scholar] [CrossRef] [Green Version]
  7. Zhu, Z.; Piao, S.; Myneni, R.B.; Huang, M.; Zeng, Z.; Canadell, J.G.; Ciais, P.; Sitch, S.; Friedlingstein, P.; Arneth, A.; et al. Greening of the earth and its drivers. Nat. Clim. Change 2016, 6, 791–795. [Google Scholar] [CrossRef]
  8. Liu, Y.; Yang, Y.; Wang, Q.; Du, X.; Li, J.; Gang, C.; Zhou, W.; Wang, Z. Evaluating the responses of net primary productivity and carbon use efficiency of global grassland to climate variability along an aridity gradient. Sci. Total Environ. 2019, 652, 671–682. [Google Scholar] [CrossRef]
  9. Sun, H.; Wang, J.; Xiong, J.; Bian, J.; Jin, H.; Cheng, W.; Li, A. Vegetation change and its response to climate change in Yunnan province, China. Adv. Meteorol. 2021, 2021, 8857589. [Google Scholar] [CrossRef]
  10. Seleiman, M.F.; Kheir, A.M.S. Saline soil properties, quality and productivity of wheat grown with bagasse ash and thiourea in different climatic zones. Chemosphere 2018, 193, 538–546. [Google Scholar] [CrossRef]
  11. Kun, Y.; Chuanmin, H. Changes in vegetative coverage of the Hongze Lake national wetland nature reserve: A decade-long assessment using modis medium-resolution data. J. Appl. Remote Sens. 2013, 7, 073589. [Google Scholar]
  12. Xu, G.; Zhang, H.; Chen, B.; Zhang, H.; Innes, J.L.; Wang, G.; Yan, J.; Zheng, Y.; Zhu, Z.; Myneni, R.B. Changes in vegetation growth dynamics and relations with climate over China’s landmass from 1982 to 2011. Remote Sens. 2014, 6, 3263–3283. [Google Scholar] [CrossRef] [Green Version]
  13. Wei, G.; Zhiqiang, G.; Xiaoling, P.; James, R.S.; Mingkui, C.; Jiaguo, Q.; Jie, Z.; Xiwu, Z.; Yingjun, M. Responses of net primary productivity (npp) in Xinjiang to climate changes from 1981–2000. Proc. SPIE 2003, 5153, 73–84. [Google Scholar]
  14. Zhuang, Q.; Shao, Z.; Li, D.; Huang, X.; Cai, B.; Altan, O.; Wu, S. Unequal weakening of urbanization and soil salinization on vegetation production capacity. Geoderma 2022, 411, 115712. [Google Scholar] [CrossRef]
  15. De Jong, R.; Schaepman, M.E.; Furrer, R.; de Bruin, S.; Verburg, P.H. Spatial relationship between climatologies and changes in global vegetation activity. Glob. Change Biol. 2013, 19, 1953–1964. [Google Scholar] [CrossRef]
  16. Qiu, B.; Li, H.; Zhou, M.; Zhang, L. Vulnerability of ecosystem services provisioning to urbanization: A case of China. Ecol. Indic. 2015, 57, 505–513. [Google Scholar] [CrossRef]
  17. Dadashpoor, H.; Azizi, P.; Moghadasi, M. Land use change, urbanization, and change in landscape pattern in a metropolitan area. Sci. Total Environ. 2019, 655, 707–719. [Google Scholar] [CrossRef]
  18. Tong, X.; Brandt, M.; Yue, Y.; Ciais, P.; Rudbeck Jepsen, M.; Penuelas, J.; Wigneron, J.P.; Xiao, X.; Song, X.P.; Horion, S.; et al. Forest management in Southern China generates short term extensive carbon sequestration. Nat. Commun. 2020, 11, 129. [Google Scholar] [CrossRef]
  19. Zhuang, Q.; Shao, Z.; Huang, X.; Zhang, Y.; Wu, W.; Feng, X.; Lv, X.; Ding, Q.; Cai, B.; Altan, O. Evolution of soil salinization under the background of landscape patterns in the irrigated northern slopes of Tianshan mountains, Xinjiang, China. Catena 2021, 206, 105561. [Google Scholar] [CrossRef]
  20. Stavi, I.; Roque de Pinho, J.; Paschalidou, A.K.; Adamo, S.B.; Galvin, K.; de Sherbinin, A.; Even, T.; Heaviside, C.; van der Geest, K. Food security among dryland pastoralists and agropastoralists: The climate, land-use change, and population dynamics nexus. Anthr. Rev. 2021, 20530196211007512. [Google Scholar] [CrossRef]
  21. Yang, H.; Mu, S.; Li, J. Effects of ecological restoration projects on land use and land cover change and its influences on territorial npp in Xinjiang, China. Catena 2014, 115, 85–95. [Google Scholar] [CrossRef]
  22. Wu, S.; Zhou, S.; Chen, D.; Wei, Z.; Dai, L.; Li, X. Determining the contributions of urbanisation and climate change to npp variations over the last decade in the Yangtze River Delta, China. Sci. Total Environ. 2014, 472, 397–406. [Google Scholar] [CrossRef] [PubMed]
  23. Chen, B.; Zhang, X.; Tao, J.; Wu, J.; Wang, J.; Shi, P.; Zhang, Y.; Yu, C. The impact of climate change and anthropogenic activities on alpine grassland over the Qinghai-Tibet Plateau. Agric. For. Meteorol. 2014, 189–190, 11–18. [Google Scholar] [CrossRef]
  24. Gu, L.; Chen, J.; Xu, C.-Y.; Kim, J.-S.; Chen, H.; Xia, J.; Zhang, L. The contribution of internal climate variability to climate change impacts on droughts. Sci. Total Environ. 2019, 684, 229–246. [Google Scholar] [CrossRef]
  25. He, C.; Tian, J.; Gao, B.; Zhao, Y. Differentiating climate—and human—induced drivers of grassland degradation in the Liao River Basin, China. Environ. Monit. Assess. 2015, 187, 4199. [Google Scholar] [CrossRef]
  26. Qi, X.; Jia, J.; Liu, H.; Lin, Z. Relative importance of climate change and human activities for vegetation changes on China’s silk road economic belt over multiple timescales. Catena 2019, 180, 224–237. [Google Scholar] [CrossRef]
  27. Zhang, Y.; Liu, Y.; Zhang, Y.; Liu, Y.; Zhang, G.; Chen, Y. On the spatial relationship between ecosystem services and urbanization: A case study in Wuhan, China. Sci. Total Environ. 2018, 637–638, 780–790. [Google Scholar] [CrossRef]
  28. Miao, L.; Jiang, C.; Xue, B.; Liu, Q.; He, B.; Nath, R.; Cui, X. Vegetation dynamics and factor analysis in arid and semi-arid inner mongolia. Environ. Earth Sci. 2015, 73, 2343–2352. [Google Scholar] [CrossRef]
  29. Wang, Z.; Xiao, X.; Yan, X. Modeling gross primary production of maize cropland and degraded grassland in northeastern China. Agric. For. Meteorol. 2010, 150, 1160–1167. [Google Scholar] [CrossRef]
  30. Madugundu, R.; Al-Gaadi, K.A.; Tola, E.; Kayad, A.G.; Jha, C.S. Estimation of gross primary production of irrigated maize using landsat-8 imagery and eddy covariance data. Saudi J. Biol. Sci. 2017, 24, 410–420. [Google Scholar] [CrossRef] [Green Version]
  31. Du, W.; Yan, H.; Feng, Z.; Yang, Y.; Liu, F. The supply-consumption relationship of ecological resources under ecological civilization construction in China. Resour. Conserv. Recycl. 2021, 172, 105679. [Google Scholar] [CrossRef]
  32. Niu, Z.; Yan, H.; Liu, F. Decreasing cropping intensity dominated the negative trend of cropland productivity in Southern China in 2000–2015. Sustainability 2020, 12, 10070. [Google Scholar] [CrossRef]
  33. Yan, H.; Fu, Y.; Xiao, X.; Huang, H.Q.; He, H.; Ediger, L. Modeling gross primary productivity for winter wheat–maize double cropping system using modis time series and CO2 eddy flux tower data. Agric. Ecosyst. Environ. 2009, 129, 391–400. [Google Scholar] [CrossRef]
  34. Yan, H.; Xue, Z.; Niu, Z. Ecological restoration policy should pay more attention to the high productivity grasslands. Ecol. Indic. 2021, 129, 107938. [Google Scholar] [CrossRef]
  35. Xiao, X.; Zhang, Q.; Braswell, B.; Urbanski, S.; Boles, S.; Wofsy, S.; Moore, B.; Ojima, D. Modeling gross primary production of temperate deciduous broadleaf forest using satellite images and climate data. Remote Sens. Environ. 2004, 91, 256–270. [Google Scholar] [CrossRef]
  36. Xiao, X.; Hollinger, D.; Aber, J.; Goltz, M.; Davidson, E.A.; Zhang, Q.; Moore, B. Satellite-based modeling of gross primary production in an evergreen needleleaf forest. Remote Sens. Environ. 2004, 89, 519–534. [Google Scholar] [CrossRef]
  37. Yan, H.; Xiao, X.; Huang, H.; Liu, J.; Chen, J.; Bai, X. Multiple cropping intensity in China derived from agro-meteorological observations and modis data. Chin. Geogr. Sci. 2014, 24, 205–219. [Google Scholar] [CrossRef] [Green Version]
  38. Raich, J.W.; Rastetter, E.B.; Melillo, J.M.; Kicklighter, D.W.; Steudler, P.A.; Peterson, B.J.; Grace, A.L.; Moore, B., 3rd; Vorosmarty, C.J. Potential net primary productivity in South America: Application of a global model. In Ecological Applications; Ecological Society of America: Washington, DC, USA, 1991; Volume 1, pp. 399–429. [Google Scholar]
  39. Fang, L.; Huimin, Y.; Fengxue, G.; Zhongen, N.; Mei, H. Net primary productivity increased on the loess plateau following implementation of the grain to green program. J. Resour. Ecol. 2017, 8, 413–421. [Google Scholar] [CrossRef]
  40. Yan, H.; Ji, Y.; Liu, J.; Liu, F.; Hu, Y.; Kuang, W. Potential promoted productivity and spatial patterns of medium- and low-yield cropland land in China. J. Geogr. Sci. 2016, 26, 259–271. [Google Scholar] [CrossRef] [Green Version]
  41. Albrizio, R.; Steduto, P. Photosynthesis, respiration and conservative carbon use efficiency of four field grown crops. Agric. For. Meteorol. 2003, 116, 19–36. [Google Scholar] [CrossRef]
  42. Luo, Y.; Sims, D.A.; Thomas, R.B.; Tissue, D.T.; Ball, J.T. Sensitivity of leaf photosynthesis to CO2 concentration is an invariant function for c3 plants: A test with experimental data and global applications. Glob. Biogeochem. Cycles 1996, 10, 209–222. [Google Scholar] [CrossRef] [Green Version]
  43. Cheng, W.; Sims, D.A.; Luo, Y.; Coleman, J.S.; Johnson, D.W. Photosynthesis, respiration, and net primary production of sunflower stands in ambient and elevated atmospheric CO2 concentrations: An invariant npp:Gpp ratio? Glob. Change Biol. 2000, 6, 931–941. [Google Scholar] [CrossRef] [Green Version]
  44. Gifford, R.M. Whole plant respiration and photosynthesis of wheat under increased CO2 concentration and temperature: Long-term vs. Short-term distinctions for modelling. Glob. Change Biol. 1995, 1, 385–396. [Google Scholar] [CrossRef]
  45. Lobell, D.B.; Hicke, J.A.; Asner, G.P.; Field, C.B.; Tucker, C.J.; Los, S.O. Satellite estimates of productivity and light use efficiency in United States agriculture, 1982–1998. Glob. Change Biol. 2002, 8, 722–735. [Google Scholar] [CrossRef]
  46. Li, Z.; Huffman, T.; McConkey, B.; Townley-Smith, L. Monitoring and modeling spatial and temporal patterns of grassland dynamics using time-series modis ndvi with climate and stocking data. Remote Sens. Environ. 2013, 138, 232–244. [Google Scholar] [CrossRef]
  47. Jiang, L.; Guli, J.; Bao, A.; Guo, H.; Ndayisaba, F. Vegetation dynamics and responses to climate change and human activities in Central Asia. Sci Total Environ. 2017, 599–600, 967–980. [Google Scholar] [CrossRef]
  48. Gu, Z.; Duan, X.; Shi, Y.; Li, Y.; Pan, X. Spatiotemporal variation in vegetation coverage and its response to climatic factors in the Red River basin, China. Ecol. Indic. 2018, 93, 54–64. [Google Scholar] [CrossRef]
  49. Li, Y.; Qin, Y. The response of net primary production to climate change: A case study in the 400 mm annual precipitation fluctuation zone in China. Int. J. Environ. Res. Public Health 2019, 16, 1497. [Google Scholar] [CrossRef] [Green Version]
  50. Wang, B.; Xu, G.; Li, P.; Li, Z.; Zhang, Y.; Cheng, Y.; Jia, L.; Zhang, J. Vegetation dynamics and their relationships with climatic factors in the Qinling mountains of China. Ecol. Indic. 2020, 108, 105719. [Google Scholar] [CrossRef]
  51. Kamali, A.; Khosravi, M.; Hamidianpour, M. Spatial–temporal analysis of net primary production (npp) and its relationship with climatic factors in Iran. Environ. Monit. Assess. 2020, 192, 718. [Google Scholar] [CrossRef]
  52. Liu, C.; Dong, X.; Liu, Y. Changes of npp and their relationship to climate factors based on the transformation of different scales in Gansu, China. Catena 2015, 125, 190–199. [Google Scholar] [CrossRef]
  53. Yan, M.; Xue, M.; Zhang, L.; Tian, X.; Chen, B.; Dong, Y. A decade’s change in vegetation productivity and its response to climate change over Northeast China. Plants 2021, 10, 821. [Google Scholar] [CrossRef] [PubMed]
  54. Evans, J.; Geerken, R. Discrimination between climate and human-induced dryland degradation. J. Arid. Environ. 2004, 57, 535–554. [Google Scholar] [CrossRef]
  55. Wang, J.; Wang, K.; Zhang, M.; Zhang, C. Impacts of climate change and human activities on vegetation cover in hilly Southern China. Ecol. Eng. 2015, 81, 451–461. [Google Scholar] [CrossRef]
  56. Tong, S.; Zhang, J.; Ha, S.; Lai, Q.; Ma, Q. Dynamics of fractional vegetation coverage and its relationship with climate and human activities in inner Mongolia, China. Remote Sens. 2016, 8, 776. [Google Scholar] [CrossRef] [Green Version]
  57. Tong, X.; Wang, K.; Yue, Y.; Brandt, M.; Liu, B.; Zhang, C.; Liao, C.; Fensholt, R. Quantifying the effectiveness of ecological restoration projects on long-term vegetation dynamics in the Karst regions of Southwest China. Int. J. Appl. Earth Obs. Geoinf. 2017, 54, 105–113. [Google Scholar] [CrossRef] [Green Version]
  58. Li, Q.; Zhang, C.; Shen, Y.; Jia, W.; Li, J. Quantitative assessment of the relative roles of climate change and human activities in desertification processes on the Qinghai-Tibet Plateau based on net primary productivity. Catena 2016, 147, 789–796. [Google Scholar] [CrossRef]
  59. Zhou, W.; Gang, C.; Zhou, F.; Li, J.; Dong, X.; Zhao, C. Quantitative assessment of the individual contribution of climate and human factors to desertification in Northwest China using net primary productivity as an indicator. Ecol. Indic. 2015, 48, 560–569. [Google Scholar] [CrossRef]
  60. Pan, N.; Wang, S.; Liu, Y.; Hua, T.; Zhang, J.; Xue, F.; Fu, B. Quantifying responses of net primary productivity to agricultural expansion in drylands. Land Degrad. Dev. 2021, 32, 2050–2060. [Google Scholar] [CrossRef]
  61. Wu, L.; Wang, S.; Bai, X.; Tian, Y.; Luo, G.; Wang, J.; Li, Q.; Chen, F.; Deng, Y.; Yang, Y.; et al. Climate change weakens the positive effect of human activities on Karst vegetation productivity restoration in Southern China. Ecol. Indic. 2020, 115, 106392. [Google Scholar] [CrossRef]
  62. Jiao, K.; Gao, J.; Wu, S. Climatic determinants impacting the distribution of greenness in China: Regional differentiation and spatial variability. Int. J. Biometeorol. 2019, 63, 523–533. [Google Scholar] [CrossRef] [PubMed]
  63. Liu, Q.; Yang, Z.; Han, F.; Wang, Z.; Wang, C. Ndvi-based vegetation dynamics and their response to recent climate change: A case study in the Tianshan mountains, China. Environ. Earth Sci. 2016, 75, 1189. [Google Scholar] [CrossRef]
  64. Chen, C.; Park, T.; Wang, X.; Piao, S.; Xu, B.; Chaturvedi, R.K.; Fuchs, R.; Brovkin, V.; Ciais, P.; Fensholt, R.; et al. China and India lead in greening of the world through land-use management. Nat. Sustain. 2019, 2, 122–129. [Google Scholar] [CrossRef] [PubMed]
  65. Fenta, A.A.; Tsunekawa, A.; Haregeweyn, N.; Tsubo, M.; Yasuda, H.; Shimizu, K.; Kawai, T.; Ebabu, K.; Berihun, M.L.; Sultan, D.; et al. Cropland expansion outweighs the monetary effect of declining natural vegetation on ecosystem services in Sub-Saharan Africa. Ecosyst. Serv. 2020, 45, 101154. [Google Scholar] [CrossRef]
  66. He, B.; Miao, L.; Cui, X.; Wu, Z. Carbon sequestration from China’s afforestation projects. Environ. Earth Sci. 2015, 74, 5491–5499. [Google Scholar] [CrossRef]
  67. Sheikhy Narany, T.; Aris, A.Z.; Sefie, A.; Keesstra, S. Detecting and predicting the impact of land use changes on groundwater quality, a case study in Northern Kelantan, Malaysia. Sci. Total Environ. 2017, 599–600, 844–853. [Google Scholar] [CrossRef]
  68. Lu, C.; Zhao, T.; Shi, X.; Cao, S. Ecological restoration by afforestation may increase groundwater depth and create potentially large ecological and water opportunity costs in arid and semiarid China. J. Clean. Prod. 2018, 176, 1213–1222. [Google Scholar] [CrossRef]
  69. Zhang, J.; Zhao, T.; Jiang, C.; Cao, S. Opportunity cost of water allocation to afforestation rather than conservation of natural vegetation in China. Land Use Policy 2016, 50, 67–73. [Google Scholar] [CrossRef]
Figure 1. Location of Xinjiang in China and LULC in Xinjiang in 2019. Note: This map is based on the standard map of the XinS (2021) 023 downloaded from the Xinjiang Uygur Autonomous Region Geographic Information Public Service Platform.
Remotesensing 14 01092 g001
Figure 2. The flowchart of VPM.
Remotesensing 14 01092 g002
Figure 3. The flowchart of the RES-CON method.
Remotesensing 14 01092 g003
Figure 4. The spatiotemporal trend of NPP based on a Mann–Kendall test in Xinjiang from 2000 to 2019.
Remotesensing 14 01092 g004
Figure 5. Hurst index for NPP in Xinjiang.
Remotesensing 14 01092 g005
Figure 6. Partial correlations between annual mean precipitation and NPP.
Remotesensing 14 01092 g006
Figure 7. Partial correlations between annual accumulated temperature and NPP.
Remotesensing 14 01092 g007
Figure 8. Contributions of climate change to NPP variations in Xinjiang from 2000 to 2019.
Remotesensing 14 01092 g008
Figure 9. (a) LULC in Xinjiang in 2000; (b) LULC in Xinjiang in 2019.
Remotesensing 14 01092 g009
Figure 10. (a) dynamics of arable land from 2000 to 2019; (b) dynamics of construction land from 2000 to 2019.
Remotesensing 14 01092 g010
Figure 11. Contributions of anthropogenic activities to NPP variations in Xinjiang from 2000 to 2019.
Remotesensing 14 01092 g011
Table 1. Contributions of climate change to NPP variations.
S l o p e N P P o b s   a DriversThe Criteria for the Division of DriversContributions (%)
S l o p e N P P C C   b S l o p e N P P O 1   c Climate Change
>0CC&O1>0>0 s l o p e N P P C C s l o p e N P P o b s
CC>0<0100
O1<0>00
<0CC&O1<0<0 s l o p e N P P C C s l o p e N P P o b s
CC<0>0100
O1>0<00
Note: a, b and c refer to the trend of NPP observations based on the VPM, the trend of NPP predictions based on binary regression analysis and the trend of NPP residuals, respectively. Additionally, b and c are used to represent trends in the NPP variation considering the effects of climate change and other factors. CC is climate change. O1 is other factors 1 (impact factors other than climate change).
Table 2. Transfer matrix of LULC in Xinjiang from 2000 to 2019 (km2).
Year2000
LULC123456TotalIncrease
2019162,356.50612.2024,860.30112.1797.764932.3992,971.3330,614.83
250.1426,723.25299.693.925.89169.8227,252.71529.46
31494.991198.52467,943.25804.3615.909336.11480,793.1312,849.88
418.8513.69903.9531,851.751.202316.0035,105.433253.68
51154.4439.281480.9922.675060.501937.969695.844635.34
640.6569.939828.86480.506.15974,990.75985,416.8410,426.09
Total65,115.5728,656.86505,317.0433,275.385187.40993,683.031,631,235.28\
Decrease2759.071933.6137,373.791423.63126.9018,692.28\\
Note: 1 is arable land; 2 is woodland; 3 is grassland; 4 is water; 5 is construction land; and 6 is unused land.
Table 3. Variation in NPP associated with LULC changes in Xinjiang.
LULC ChangeNPP2019–NPP2000 (gC/m2·a)NPPhuman (gC/m2·a)
1131.310.00
1 to 2/3/4/5/66.62−124.69
220.680.00
2 to 1/3/4/5/645.7325.05
312.630.00
3 to 1/2/4/5/6155.47142.83
43.310.00
4 to 1/2/3/5/613.6810.37
555.650.00
5 to 1/2/3/4/6111.1555.51
61.550.00
6 to 1/2/3/4/534.2332.68
Note: 1 is arable land; 2 is woodland; 3 is grassland; 4 is water; 5 is construction land; and 6 is unused land.
Publisher’s Note: MDPI stays neutral with regard to jurisdictional claims in published maps and institutional affiliations.

