
Identifying Reservoirs and Estimating Evaporation Losses in a Large Arid Inland Basin in Northwestern China


Abstract
:1. Introduction
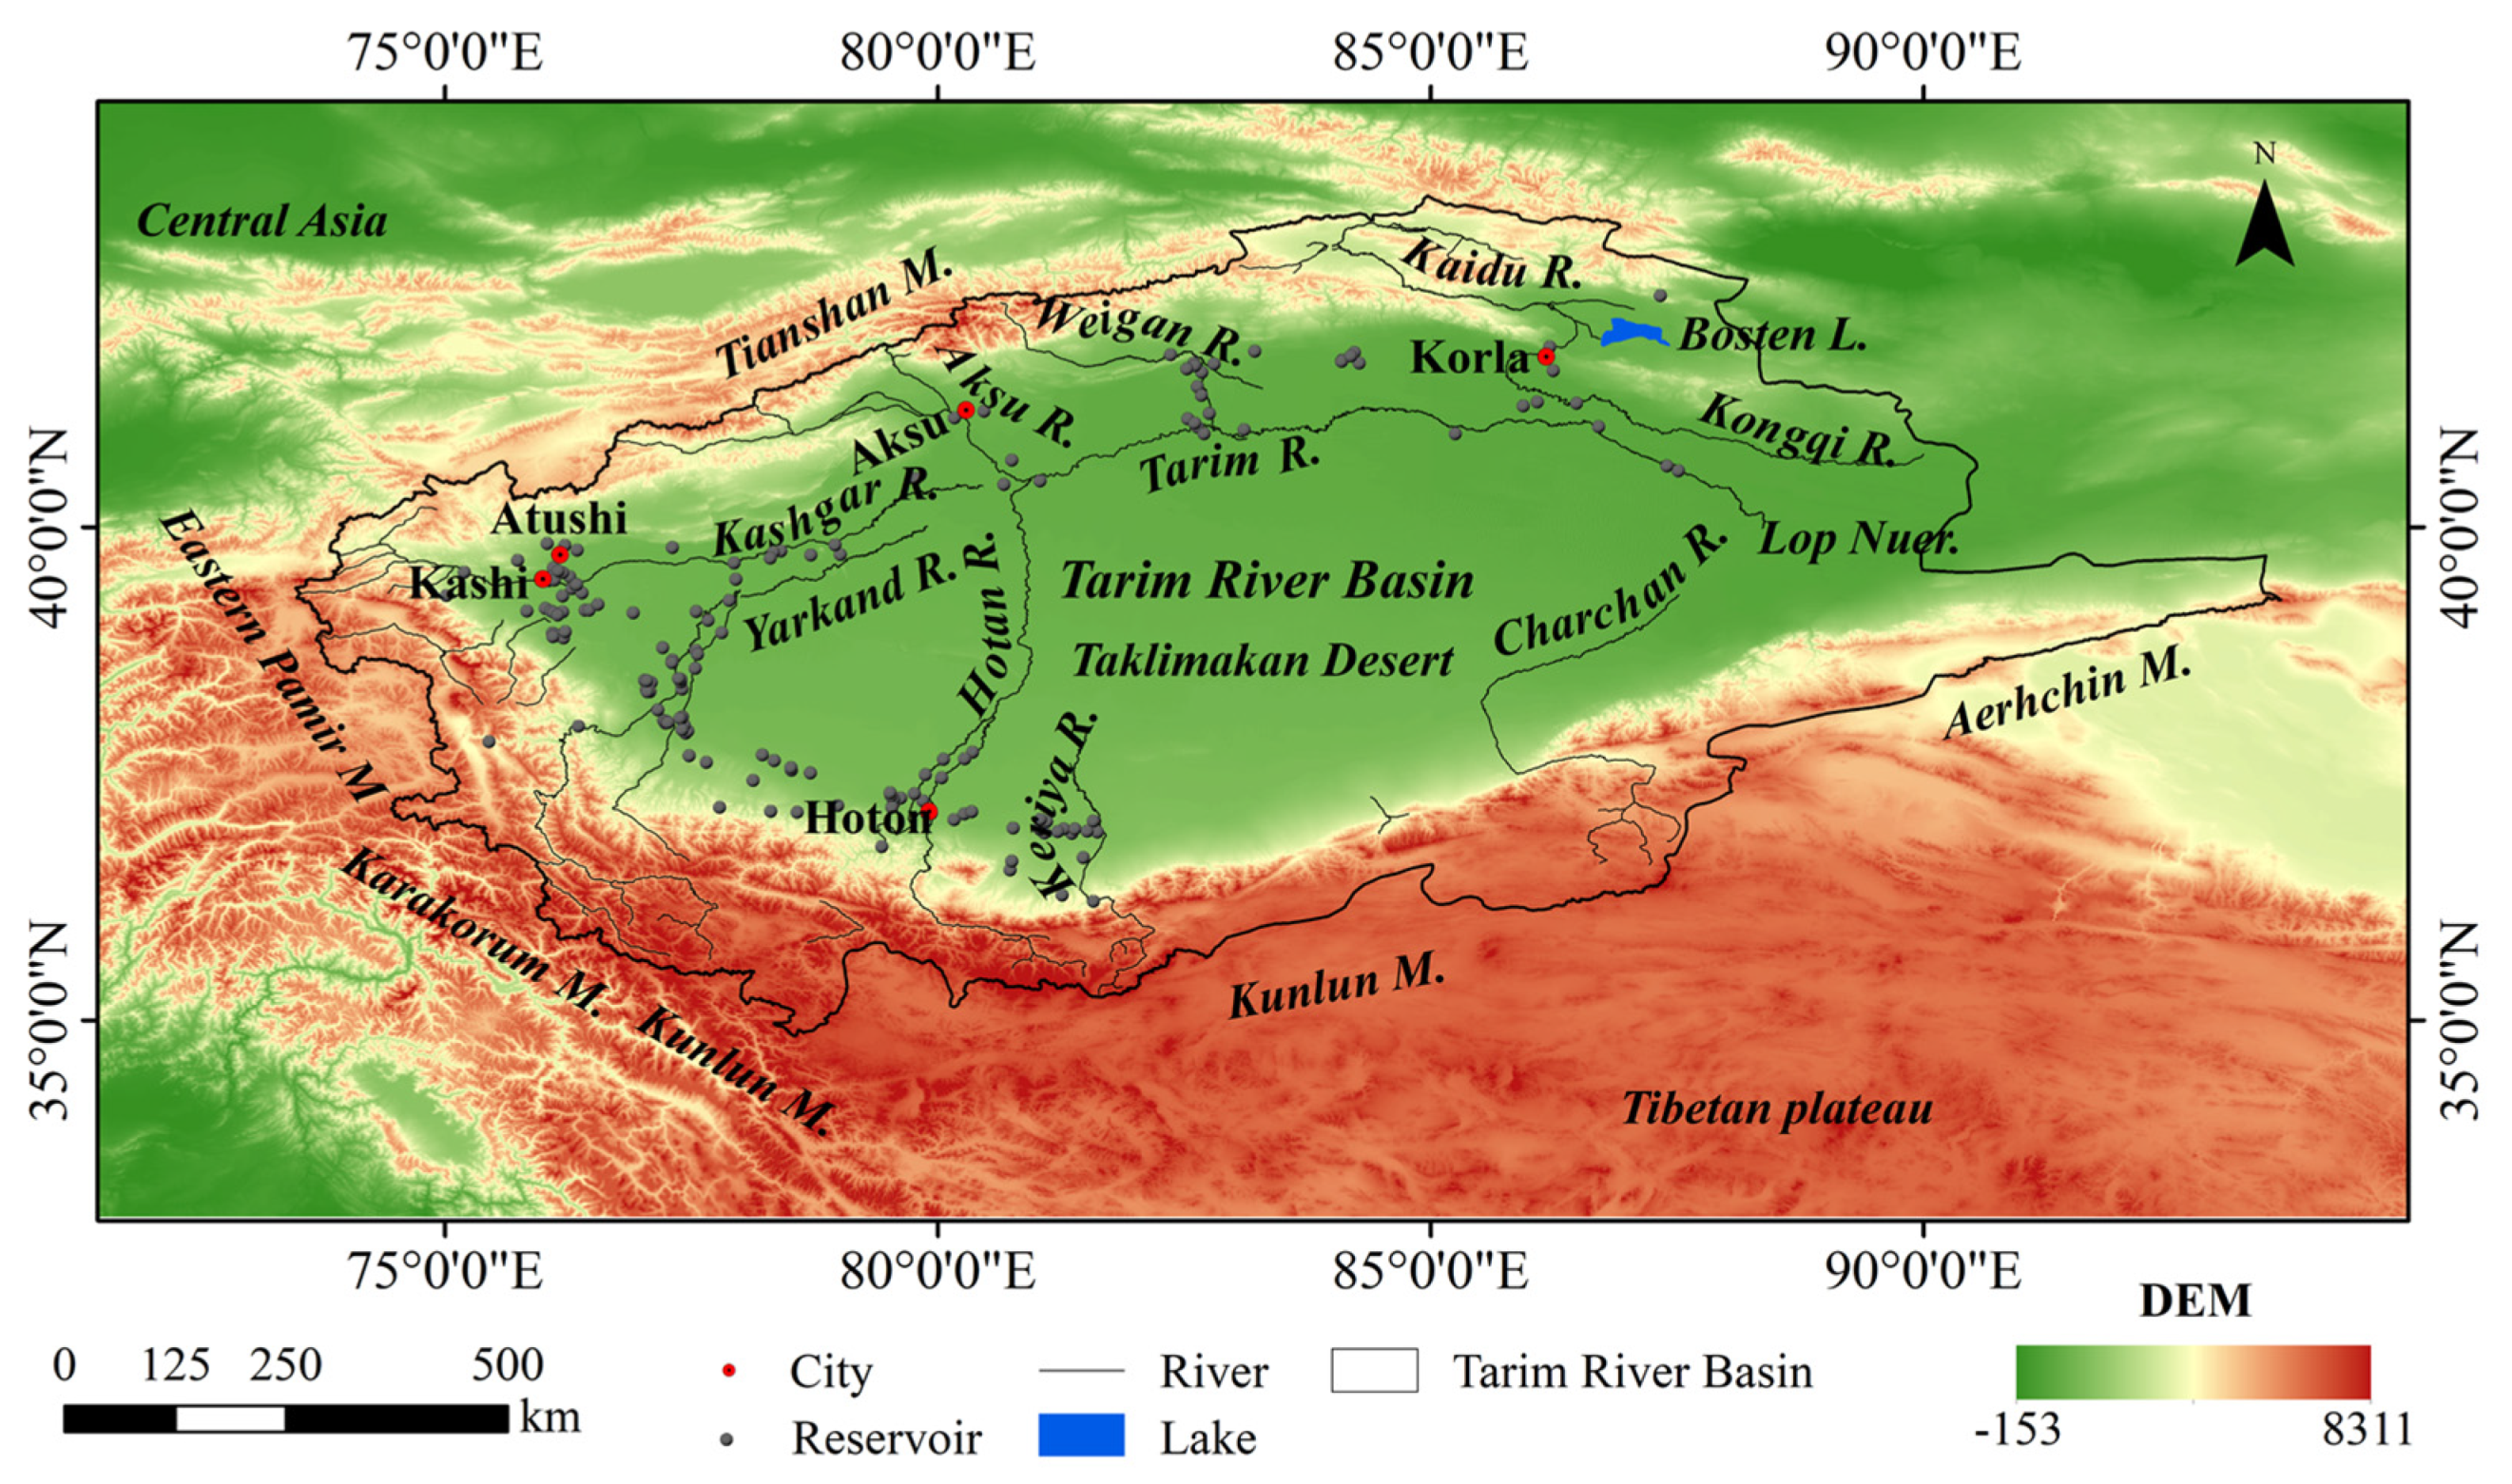
2. Study Area
3. Data and Methods
3.1. Data
3.2. Methods
3.2.1. Reservoir Inventory Formation
3.2.2. Water Extraction and Validation
3.2.3. Estimation of Reservoir Evaporation Rate
3.2.4. Trend Analysis
4. Results
4.1. Reservoirs in Tarim Basin
4.2. Magnitudes and Trends of Reservoir Surface Areas
4.3. Magnitudes and Trends of Reservoir Evaporation Rate
4.4. Magnitudes and Trends of Reservoir Evaporation Volume
5. Discussion
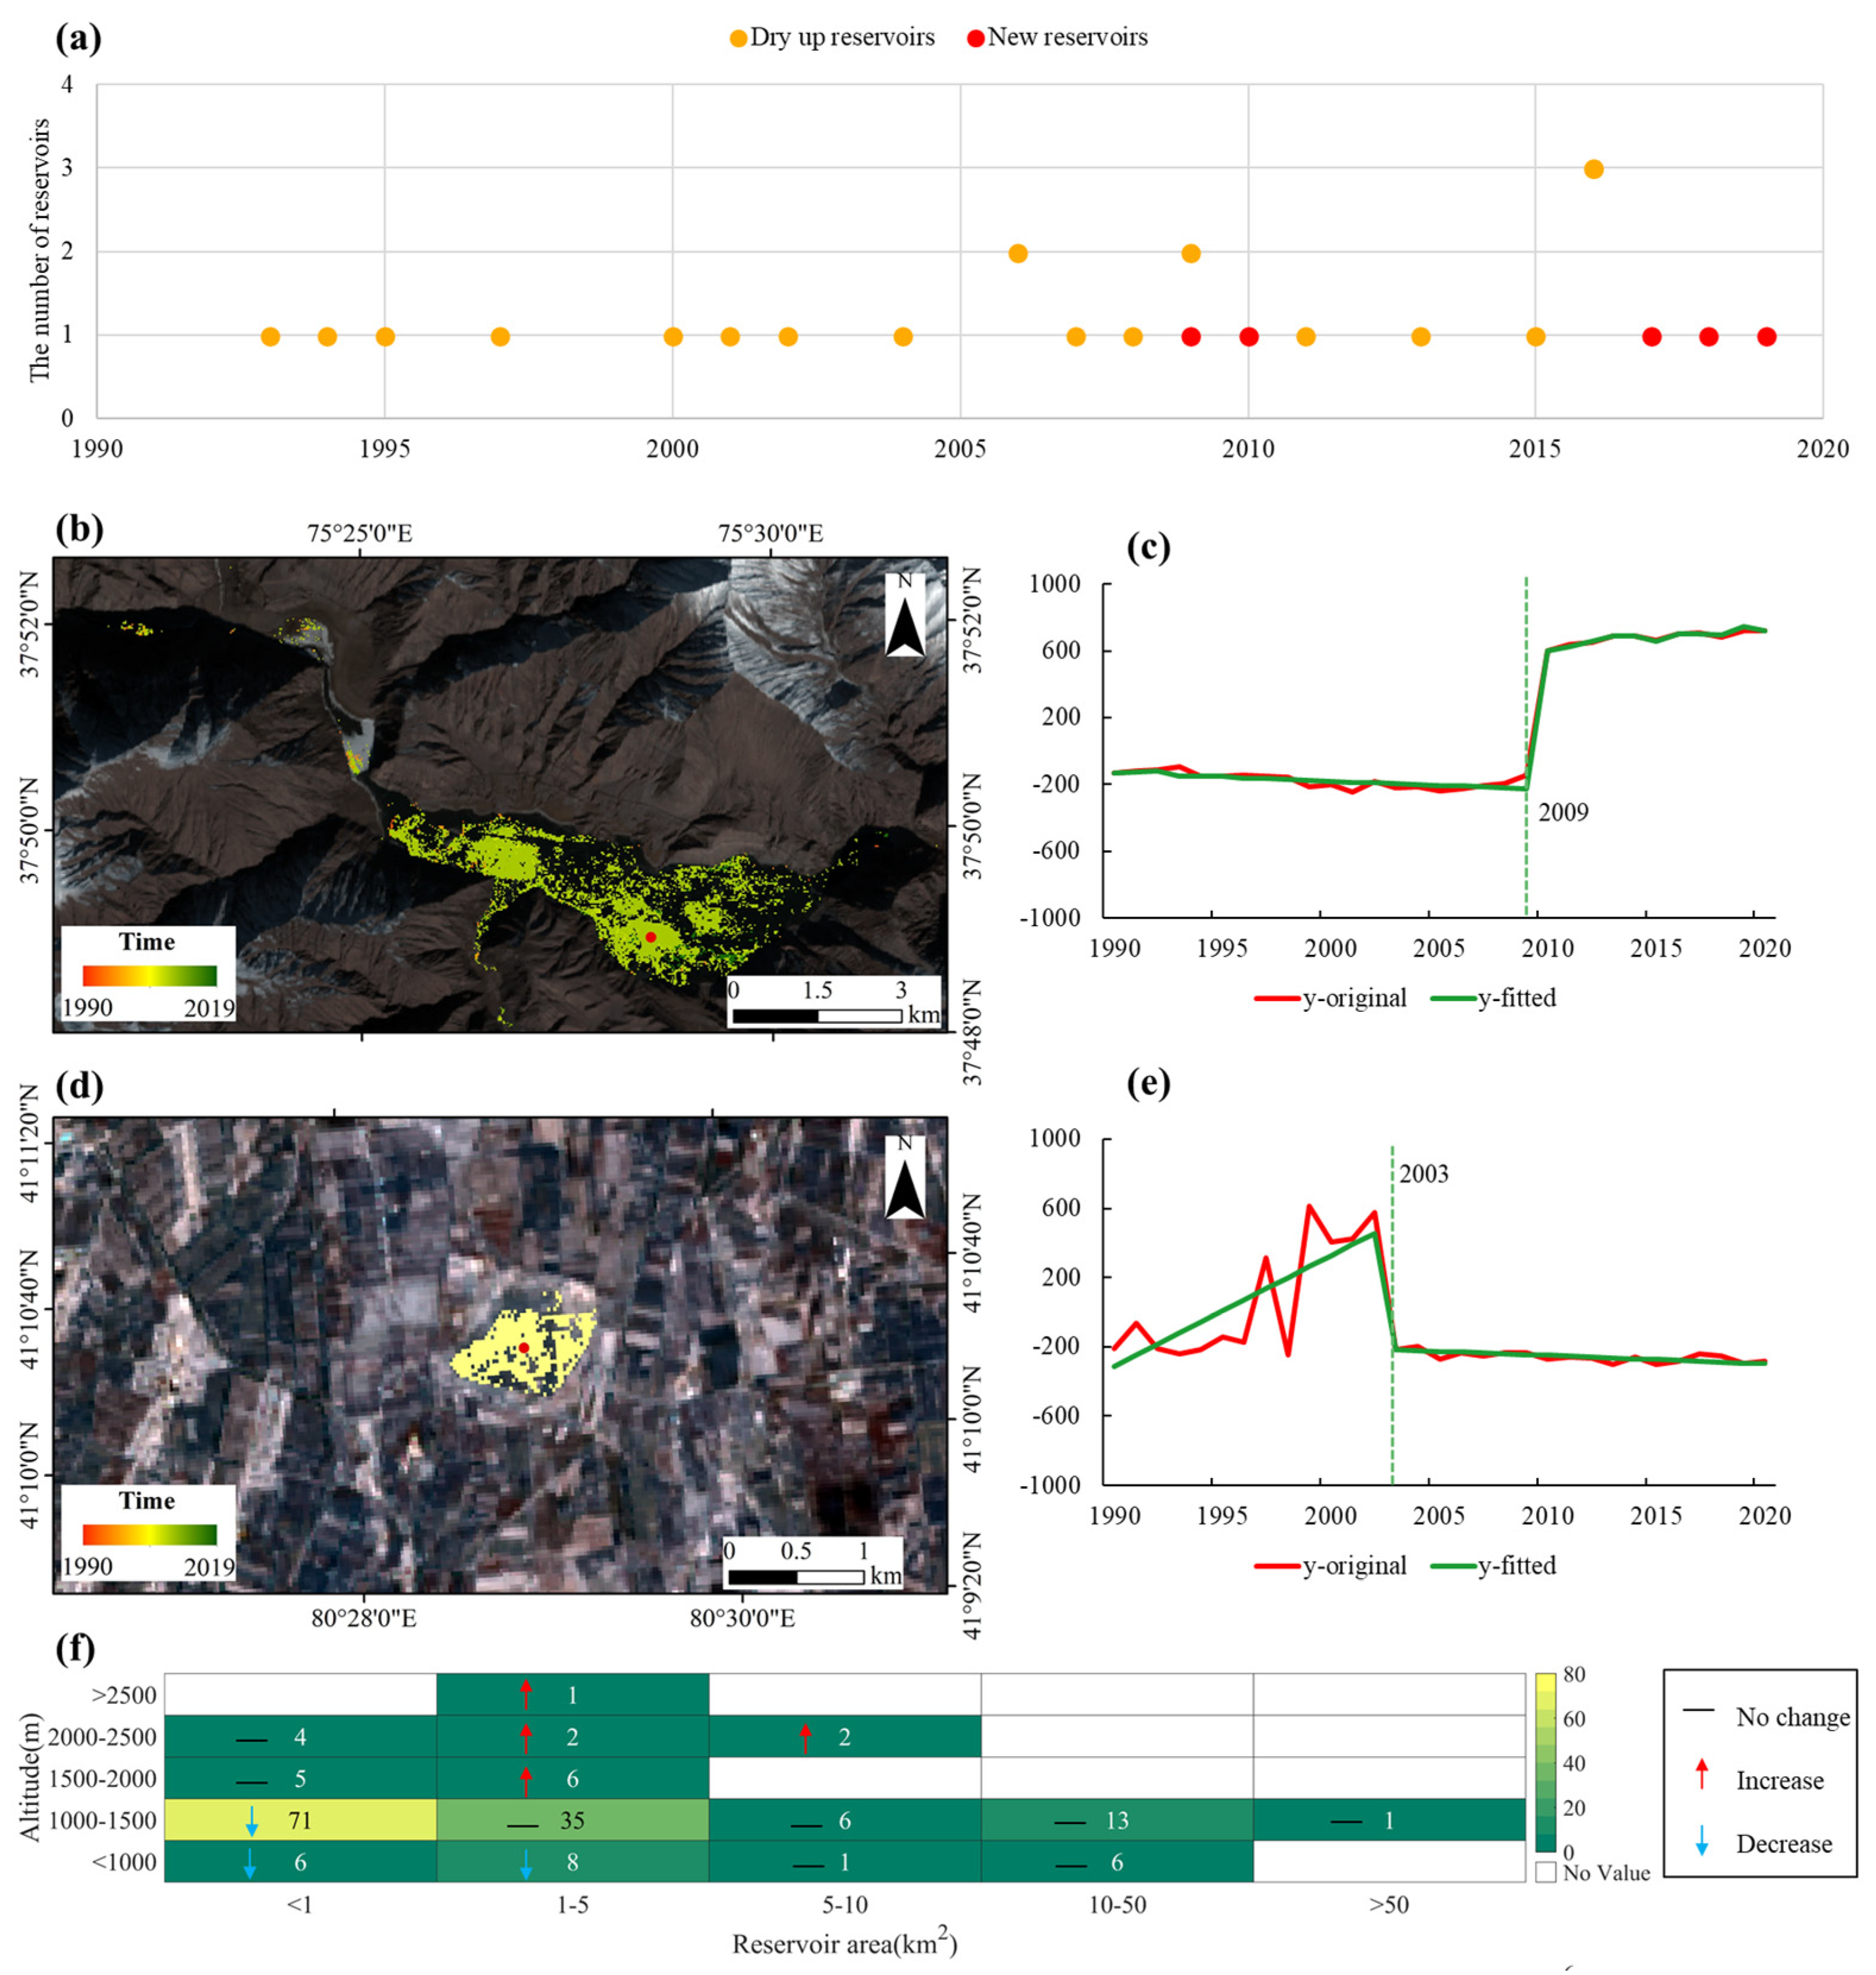
5.1. Analyzing the Evolution of Reservoirs
5.2. Analysis of Variations in Reservoir Surface Area
5.3. Analysis of Evaporation Rate Change of Reservoir
5.4. Influence of Reservoir Evaporation Losses on Water Resources Management
6. Conclusions
Author Contributions
Funding
Institutional Review Board Statement
Informed Consent Statement
Data Availability Statement
Conflicts of Interest
References
- Konapala, G.; Mishra, A.K.; Wada, Y.; Mann, M.E. Climate change will affect global water availability through compounding changes in seasonal precipitation and evaporation. Nat. Commun. 2020, 11, 1–10. [Google Scholar] [CrossRef] [PubMed]
- Zhao, G.; Gao, H. Automatic Correction of Contaminated Images for Assessment of Reservoir Surface Area Dynamics. Geophys. Res. Lett. 2018, 45, 6092–6099. [Google Scholar] [CrossRef] [PubMed]
- Zhang, H.; Gorelick, S.M.; Zimba, P.V.; Zhang, X.D. A remote sensing method for estimating regional reservoir area and evaporative loss. J. Hydrol. 2017, 555, 213–227. [Google Scholar] [CrossRef]
- Bozorgi, A.; Bozorg-Haddad, O.; Sima, S.; Loaiciga, H.A. Comparison of methods for estimating loss from water storage by evaporation and impacts on reservoir management. Water Environ. J. 2021, 35, 218–228. [Google Scholar] [CrossRef]
- Mady, B.; Lehmann, P.; Gorelick, S.M.; Or, D. Distribution of small seasonal reservoirs in semi-arid regions and associated evaporative losses. Environ. Res. Commun. 2020, 2, 061002. [Google Scholar] [CrossRef]
- Zhao, G.; Gao, H.L. Estimating reservoir evaporation losses for the United States: Fusing remote sensing and modeling approaches. Remote Sens. Environ. 2019, 226, 109–124. [Google Scholar] [CrossRef] [Green Version]
- Tian, W.; Liu, X.M.; Wang, K.W.; Bai, P.; Liu, C.M. Estimation of reservoir evaporation losses for China. J. Hydrol. 2021, 596, 126142. [Google Scholar] [CrossRef]
- Huang, C.; Chen, Y.; Zhang, S.Q.; Wu, J.P. Detecting, Extracting, and Monitoring Surface Water From Space Using Optical Sensors: A Review. Rev. Geophys. 2018, 56, 333–360. [Google Scholar] [CrossRef]
- Gao, H.L. Satellite remote sensing of large lakes and reservoirs: From elevation and area to storage. Wires Water 2015, 2, 147–157. [Google Scholar] [CrossRef]
- Deng, Y.; Jiang, W.G.; Tang, Z.H.; Ling, Z.Y.; Wu, Z.F. Long-Term Changes of Open-Surface Water Bodies in the Yangtze River Basin Based on the Google Earth Engine Cloud Platform. Remote Sens. 2019, 11, 2213. [Google Scholar] [CrossRef] [Green Version]
- Wang, Y.B.; Ma, J.; Xiao, X.M.; Wang, X.X.; Dai, S.Q.; Zhao, B. Long-Term Dynamic of Poyang Lake Surface Water: A Mapping Work Based on the Google Earth Engine Cloud Platform. Remote Sens. 2019, 11, 313. [Google Scholar] [CrossRef] [Green Version]
- Xia, H.M.; Zhao, J.Y.; Qin, Y.; Yang, J.; Cui, Y.P.; Song, H.Q.; Meng, Q.M. Changes in Water Surface Area during 1989-2017 in the Huai River Basin using Landsat Data and Google Earth Engine. Remote Sens. 2019, 11, 1824. [Google Scholar] [CrossRef] [Green Version]
- Chen, J.H.; Kang, T.T.; Yang, S.; Bu, J.Y.; Cao, K.X.; Gao, Y.C. Open-Surface Water Bodies Dynamics Analysis in the Tarim River Basin (North-Western China), Based on Google Earth Engine Cloud Platform. Water 2020, 12, 2822. [Google Scholar] [CrossRef]
- Penman, H.L. Natural evaporation from open water, bare soil and grass. Proc. R. Soc. London Ser. A 1948, 193, 120–145. [Google Scholar] [CrossRef] [Green Version]
- Edinger, J.; Duttweiler, D.; Geyer, J. The Response of Water Temperature to Meteorological Conditions. Water Resour Res. 1968, 4, 1137–1143. [Google Scholar] [CrossRef]
- Debruin, H.A.R. Temperature and energy-balance of a water reservoir determined from standard weather data of a land station. J. Hydrol. 1982, 59, 261–274. [Google Scholar] [CrossRef]
- Mohseni, O.; Stefan, H.G. Stream temperature air temperature relationship: A physical interpretation. J. Hydrol. 1999, 218, 128–141. [Google Scholar] [CrossRef]
- McJannet, D.L.; Webster, I.T.; Cook, F.J. An area-dependent wind function for estimating open water evaporation using land-based meteorological data. Environ. Modell Softw. 2012, 31, 76–83. [Google Scholar] [CrossRef]
- McMahon, T.A.; Peel, M.C.; Lowe, L.; Srikanthan, R.; McVicar, T.R. Estimating actual, potential, reference crop and pan evaporation using standard meteorological data: A pragmatic synthesis. Hydrol. Earth Syst. Sci. 2013, 17, 1331–1363. [Google Scholar] [CrossRef] [Green Version]
- Shi, K.B.; Chen, L.L. Water Saving in the Plain Reservoirs in the Inland Arid Region and Prevention of Salinization in Surrounding Soil; China Water Conservancy Hydropower: Beijing, China, 2016; pp. 1–5. [Google Scholar]
- Han, K.W.; Shi, K.B.; Yan, X.J.; Cheng, Y.Y. Water Savings Efficiency of Counterweighted Spheres Covering a Plain Reservoir in an Arid Area. Water Resour. Manag. 2019, 33, 1867–1880. [Google Scholar] [CrossRef]
- Wu, S. Estimation of evaporation from Shangyou Reservoir in Aksu Basin. Xinjiag Geogr. 1984, 7, 19–23. [Google Scholar] [CrossRef]
- Jiang, H.; He, X.; Liu, B.; Zhou, Y. Study on evaporation rules of plain reservoir in Aksu river basin under background of climate change. J. Water Res. Water Eng. 2014, 25, 81–84. [Google Scholar] [CrossRef]
- Chen, H.; Yang, T.; Hu, G.; Wang, S. Study on evaporation change of reservoirs in Yarkant River Basin under climate change. Yangtze River 2016, 47, 31–34. [Google Scholar] [CrossRef]
- Zhang, J.; Yuan, Y. A tentative discussion on the impact of climate on surface water resources in Xinjiang. J. Nat. Resour. 2002, 17, 28–34. [Google Scholar]
- Yu, G.A.; Disse, M.; Huang, H.Q.; Yu, Y.; Li, Z.W. River network evolution and fluvial process responses to human activity in a hyper-arid environment—Case of the Tarim River in Northwest China. Catena 2016, 147, 96–109. [Google Scholar] [CrossRef]
- You, P.D. Surface water resources and runoff composition in the Tarim River Basin. Arid Land Geogr. 1995, 18, 29–35. (In Chinese) [Google Scholar] [CrossRef]
- Deng, X.Y.; Song, C.Q.; Liu, K.; Ke, L.H.; Zhang, W.S.; Ma, R.H.; Wu, Q.H. Remote sensing estimation of catchment-scale reservoir water impoundment in the upper Yellow River and implications for river discharge alteration. J. Hydrol. 2020, 585, 124791. [Google Scholar] [CrossRef]
- Kennedy, R.E.; Yang, Z.G.; Cohen, W.B. Detecting trends in forest disturbance and recovery using yearly Landsat time series: 1. LandTrendr—Temporal segmentation algorithms. Remote Sens. Environ. 2010, 114, 2897–2910. [Google Scholar] [CrossRef]
- Zhu, Z.; Woodcock, C.E. Automated cloud, cloud shadow, and snow detection in multitemporal Landsat data: An algorithm designed specifically for monitoring land cover change. Remote Sens Environ. 2014, 152, 217–234. [Google Scholar] [CrossRef]
- Yan, Y.B.; Mao, K.B.; Shi, J.C.; Piao, S.L.; Shen, X.Y.; Dozier, J.; Bao, Q. Driving forces of land surface temperature anomalous changes in North America in 2002–2018. Sci. Rep. 2020, 10, 1–13. [Google Scholar] [CrossRef]
- Zhou, Y.; Dong, J.; Xiao, X.; Liu, R.; Zou, Z.; Zhao, G.; Ge, Q. Continuous monitoring of lake dynamics on the Mongolian Plateau using all available Landsat imagery and Google Earth Engine. Sci. Total Environ. 2019, 689, 366–380. [Google Scholar] [CrossRef] [PubMed]
- Huang, W.; Duan, W.; Nover, D.; Sahu, N.; Chen, Y. An integrated assessment of surface water dynamics in the Irtysh River Basin during 1990–2019 and exploratory factor analyses. J. Hydrol. 2021, 593, 125905. [Google Scholar] [CrossRef]
- Sen, P. Estimates of the Regression Coefficient Based on Kendall’s Tau. Publ. Am. Stat. Assoc. 1968, 63, 1379–1389. [Google Scholar] [CrossRef]
- Mann, H.B. Non-parametric tests against trend. Econometrica 1945, 13, 245–259. [Google Scholar] [CrossRef]
- Kendall, M.; Gibbons, J. Rank Correlation Method. Br. J. Psychol. 1990, 25, 86–91. [Google Scholar] [CrossRef]
- Ward, P.; de Ruiter, M.; Mård, J.; Schröter, K.; Van Loon, A.; Veldkamp, T.I.E.; Wens, M. The need to integrate flood and drought disaster risk reduction strategies. Water Secur. 2020, 11, 100070. [Google Scholar] [CrossRef]
- Li, J.; Liu, Y.; Wu, T.; Peng, Z. 70 years of dam construction in Xinjiang. J. China Inst. Water Resour. Hydropower Res. 2020, 18, 322–330. [Google Scholar]
- Li, J.; Liu, J.; Xie, L. Efficient utilization of water resources and layout of major water conservancy projects in Southern Xinjiang. Water Resour. Plan. Des. 2020, 6, 78–85. [Google Scholar] [CrossRef]
- Li, J.; Liu, Y.; Liu, S.; Peng, Z.; Wu, T. Main problems and countermeasures of reservoir dam construction in Xinjiang in the new period. Arid Land Geogr. 2020, 43, 1409–1416. [Google Scholar] [CrossRef]
- Xie, X.; Shi, K. Analysis of plain reservoir seepage and downstream soil salinization in arid area. J. Water Resour. Water Eng. 2014, 25, 180–183. [Google Scholar] [CrossRef]
- Mohammed, R.; Scholz, M. Adaptation Strategy to Mitigate the Impact of Climate Change on Water Resources in Arid and Semi-Arid Regions: A Case Study. Water Resour. Manag. 2000, 31, 3557–3573. [Google Scholar] [CrossRef] [Green Version]
- Li, Y.; Deng, M. Spatiotemporal variations of agricultural water footprint and its economic benefits in Xinjiang, northwestern China. Sci. Rep. 2021, 11, 1–12. [Google Scholar] [CrossRef] [PubMed]
- Chen, Y.; Wubuli, W.; Abula, A.; Cheng, Y.; Chen, Y.; Hao, X.; Wang, Y. Monitoring and analysis of ecological benefits of water conveyance in the lower reaches of Tarim River in recent 20 years. Arid Land Geogr. 2021, 44, 605–611. [Google Scholar] [CrossRef]
- Ahmad Danboos, O.J.; El-Shafie, A. Effect of Evaporation on the Haditha Reservoir on the Euphrates River in Iraq and Recommendations for Reducing Evaporation Losses. Int. J. Appl. Eng. Res. 2018, 13, 929–941. [Google Scholar]
- Han, K.; Shi, K.; Yan, X. Evaporation loss and energy balance of agricultural reservoirs covered with counterweighted spheres in arid region. Agric. Water Manag. 2020, 238, 106227. [Google Scholar] [CrossRef]


| Waterbody Map | Sentinel−2 MSI | Sum of Classified Pixels | User Accuracy (%) | ||
|---|---|---|---|---|---|
| Water | Non−water | ||||
| Landsat | Water | 1005 | 50 | 1055 | 95.26% |
| Non−water | 45 | 1010 | 1055 | 95.73% | |
| Sum of reference pixels | 1050 | 1060 | 95.50% | ||
| Producer accuracy (%) | 95.71% | 95.28% | Kappa = 0.91 | ||
Publisher’s Note: MDPI stays neutral with regard to jurisdictional claims in published maps and institutional affiliations. |
© 2022 by the authors. Licensee MDPI, Basel, Switzerland. This article is an open access article distributed under the terms and conditions of the Creative Commons Attribution (CC BY) license (https://creativecommons.org/licenses/by/4.0/).
Share and Cite
Xia, Q.-Q.; Chen, Y.-N.; Zhang, X.-Q.; Ding, J.-L.; Lv, G.-H. Identifying Reservoirs and Estimating Evaporation Losses in a Large Arid Inland Basin in Northwestern China. Remote Sens. 2022, 14, 1105. https://doi.org/10.3390/rs14051105
Xia Q-Q, Chen Y-N, Zhang X-Q, Ding J-L, Lv G-H. Identifying Reservoirs and Estimating Evaporation Losses in a Large Arid Inland Basin in Northwestern China. Remote Sensing. 2022; 14(5):1105. https://doi.org/10.3390/rs14051105
Chicago/Turabian StyleXia, Qian-Qian, Ya-Ning Chen, Xue-Qi Zhang, Jian-Li Ding, and Guang-Hui Lv. 2022. "Identifying Reservoirs and Estimating Evaporation Losses in a Large Arid Inland Basin in Northwestern China" Remote Sensing 14, no. 5: 1105. https://doi.org/10.3390/rs14051105
APA StyleXia, Q.-Q., Chen, Y.-N., Zhang, X.-Q., Ding, J.-L., & Lv, G.-H. (2022). Identifying Reservoirs and Estimating Evaporation Losses in a Large Arid Inland Basin in Northwestern China. Remote Sensing, 14(5), 1105. https://doi.org/10.3390/rs14051105