
Rheology of the Northern Tibetan Plateau Lithosphere Inferred from the Post-Seismic Deformation Resulting from the 2001 Mw 7.8 Kokoxili Earthquake


Abstract
:1. Introduction
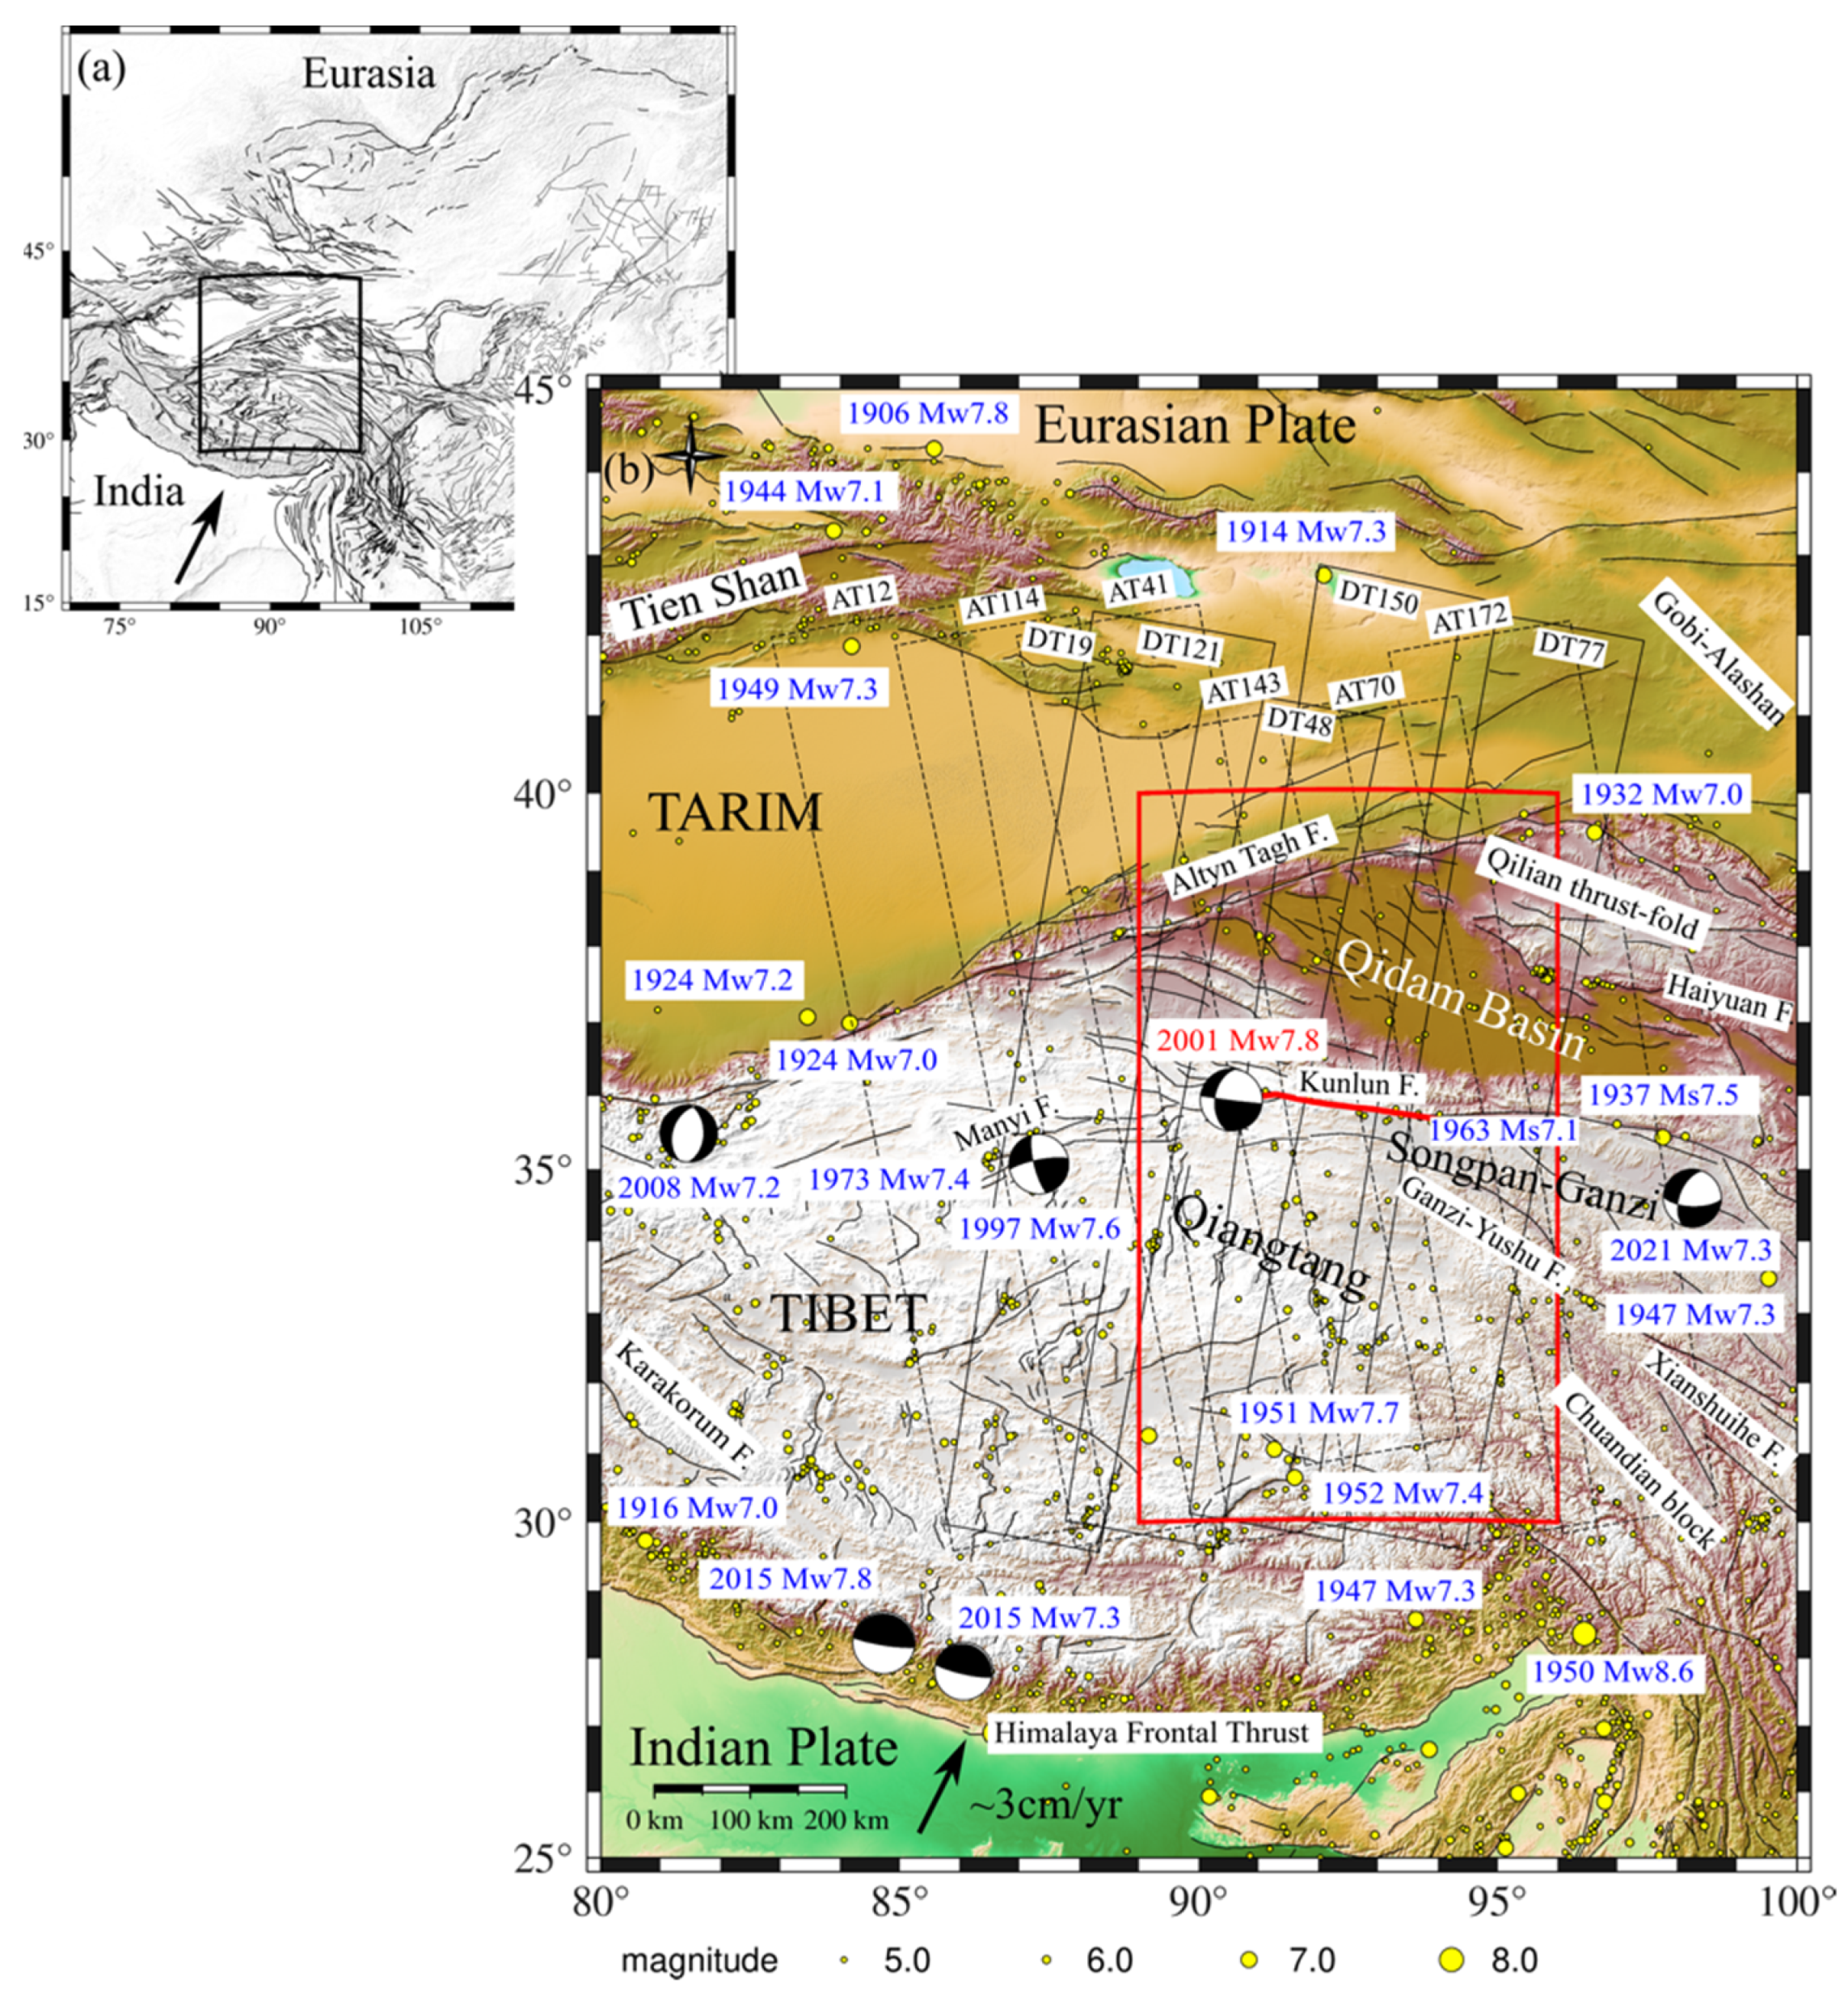
2. Geologic Setting
3. InSAR Data and Processing Methodology
4. Modelling Approach
4.1. Interseismic Deformation Velocity Field Simulation
4.2. Setting of Viscoelastic Relaxation Model Parameters
4.3. Inversion Approach
5. Results
5.1. Observed Post-Seismic Deformation Velocity
5.2. Simulated Interseismic Deformation Velocity
5.3. Inversion Results of the Mixed Model
6. Discussion
7. Conclusions
- The best estimated viscosities for the lower crust and upper mantle were and , respectively. The estimated effective lower crustal viscosity was similar to the steady-state viscosity estimated by Ryder and Penchao, who considered a Burgers body. In addition, the temporal trend in the effective viscosity obtained by combining our results with those of previous studies was a significant logarithmic curve. Therefore, it can be concluded that the viscosity of the viscoelastic layer beneath the Kokoxili region has almost reached its steady state.
- The lower crustal steady-state viscosity of Songpan–Ganzi and Qiangtang terrane was , which was larger than that obtained by the channelized lower crustal flow model (). This comparison means that the channelized lower crustal flow cannot be the main mechanism for the north Tibet Plateau deformation.
Supplementary Materials
Author Contributions
Funding
Data Availability Statement
Acknowledgments
Conflicts of Interest
References
- Deng, Q.; Zhang, P.; Ran, Y.; Yang, X.; Min, W.; Chu, Q. Basic characteristics of China active tectonics. Sci. China 2002, 32, 1020–1030. [Google Scholar]
- Ryder, I.; Burgmann, R.; Pollitz, F. Lower crustal relaxation beneath the Tibetan Plateau and Qaidam Basin following the 2001 Kokoxili earthquake. Geophys. J. Int. 2011, 187, 613–630. [Google Scholar] [CrossRef] [Green Version]
- He, P.C.; Wang, M.; Wang, Q.; Shen, Z. Rheological structure of lithosphere in northern Tibet inferred from postseismic deformation 319 modeling of the 2001 M0 7.8 Kokoxili earthquake. Chin. J. Geophys. 2018, 61, 531–544. (In Chinese) [Google Scholar]
- Shen, Z.-K.; Jackson, D.D.; Feng, Y.; Cline, M.; Kim, M.; Fang, P.; Bock, Y. Postseismic deformation following the Landers earthquake, California, 28 June 1992. Bull. Seism. Soc. Am. 1994, 84, 780–791. [Google Scholar] [CrossRef]
- Freed, A.M. Earthquake Triggering by Static, Dynamic, And Postseismic Stress Transfer. Annu. Rev. Earth Planet. Sci. 2005, 33, 335–367. [Google Scholar] [CrossRef] [Green Version]
- Wei, S.; Barbot, S.; Graves, R.; Lienkaemper, J.J.; Wang, T.; Hudnut, K.; Fu, Y.; Helmberger, D. The 2014 Mw 6.1 South Napa Earthquake: A Unilateral Rupture with Shallow Asperity and Rapid Afterslip. Seism. Res. Lett. 2015, 86, 344–354. [Google Scholar] [CrossRef] [Green Version]
- Avouac, J.-P. From Geodetic Imaging of Seismic and Aseismic Fault Slip to Dynamic Modeling of the Seismic Cycle. Annu. Rev. Earth Planet. Sci. 2015, 43, 233–271. [Google Scholar] [CrossRef] [Green Version]
- Deng, J.; Gurnis, M.; Kanamori, H.; Hauksson, E. Viscoelastic Flow in the Lower Crust after the 1992 Landers, California, Earthquake. Science 1998, 282, 1689–1692. [Google Scholar] [CrossRef]
- Wiseman, K.; Bürgmann, R.; Freed, A.M.; Banerjee, P. Viscoelastic relaxation in a heterogeneous Earth following the 2004 Sumatra–Andaman earthquake. Earth Planet. Sci. Lett. 2015, 431, 308–317. [Google Scholar] [CrossRef] [Green Version]
- Pollitz, F.F. Lithosphere and shallow asthenosphere rheology from observations of post-earthquake relaxation. Phys. Earth Planet. Inter. 2019, 293, 106271. [Google Scholar] [CrossRef]
- Peltzer, G.; Rosen, P.; Rogez, F.; Hudnut, K. Poroelastic rebound along the Landers 1992 earthquake surface rupture. J. Geophys. Res. Earth Surf. 1998, 103, 30131–30145. [Google Scholar] [CrossRef]
- Hughes, K.L.; Masterlark, T.; Mooney, W.D. Poroelastic stress-triggering of the 2005 M8.7 Nias earthquake by the 2004 M9.2 Sumatra–Andaman earthquake. Earth Planet. Sci. Lett. 2010, 293, 289–299. [Google Scholar] [CrossRef]
- Hu, Y.; Burgmann, R.; Freymueller, J.T.; Banerjee, P.; Wang, K. Contributions of poroelastic rebound and a weak volcanic arc to the postseismic deformation of the 2011 Tohoku earthquake. Earth Planets Space 2014, 66, 106. [Google Scholar] [CrossRef] [Green Version]
- Mikumo, T.; Yagi, Y.; Singh, S.K.; Santoyo, M.A. Coseismic and postseismic stress changes in a subducting plate: Possible stress interactions between large interplate thrust and intraplate normal-faulting earthquakes. J. Geophys. Res. Earth Surf. 2002, 107, ESE 5-1–ESE 5-12. [Google Scholar] [CrossRef] [Green Version]
- Cattania, C.; Hainzl, S.; Wang, L.; Enescu, B.; Roth, F. Aftershock triggering by postseismic stresses: A study based on Coulomb rate-and-state models. J. Geophys. Res. Solid Earth 2015, 120, 2388–2407. [Google Scholar] [CrossRef] [Green Version]
- Verdecchia, A.; Pace, B.; Visini, F.; Scotti, O.; Peruzza, L.; Benedetti, L. The Role of Viscoelastic Stress Transfer in Long-Term Earthquake Cascades: Insights After the Central Italy 2016–2017 Seismic Sequence. Tectonics 2018, 37, 3411–3428. [Google Scholar] [CrossRef] [Green Version]
- Wright, T.J.; Elliott, J.R.; Wang, H.; Ryder, I. Earthquake cycle deformation and the Moho: Implications for the rheology of continental lithosphere. Tectonophysics 2013, 609, 504–523. [Google Scholar] [CrossRef]
- Via, G.D.; Sabadini, R.; De Natale, G.; Pingue, F. Lithospheric rheology in southern Italy inferred from postseismic viscoelastic relaxation following the 1980 Irpinia earthquake. J. Geophys. Res. Earth Surf. 2005, 110, B06311. [Google Scholar] [CrossRef]
- Pollitz, F.F.; Burgmann, R.; Segall, P. Joint estimation of afterslip rate and postseismic relaxation following the 1989 Loma Prieta earthquake. J. Geophys. Res. Earth Surf. 1998, 103, 26975–26992. [Google Scholar] [CrossRef] [Green Version]
- Hao, M.; Shen, Z.-K.; Wang, Q.; Cui, D. Postseismic deformation mechanisms of the 1990 Mw 6.4 Gonghe, China earthquake constrained using leveling measurements. Tectonophysics 2012, 532–535, 205–214. [Google Scholar] [CrossRef]
- Deng, J.; Hudnut, K.; Gurnis, M.; Hauksson, E. Stress loading from viscous flow in the lower crust and triggering of after-shocks following the 1994 Northridge, California, Earthquake. Geophys. Res. Lett. 1999, 26, 3209–3212. [Google Scholar] [CrossRef] [Green Version]
- Riva, R.E.M.; Borghi, A.; Aoudia, A.; Barzaghi, R.; Sabadini, R.; Panza, G.F. Viscoelastic relaxation and long-lasting after-slip following the 1997 Umbria-Marche (Central Italy) earthquakes. Geophys. J. Int. 2007, 169, 534–546. [Google Scholar] [CrossRef] [Green Version]
- Ryder, I.; Parsons, B.; Wright, T.J.; Funning, G.J. Post-seismic motion following the 1997 Manyi (Tibet) earthquake: InSAR observations and modelling. Geophys. J. Int. 2007, 169, 1009–1027. [Google Scholar] [CrossRef] [Green Version]
- Sheu, S.-Y.; Shieh, C.-F. Viscoelastic-afterslip concurrence: A possible mechanism in the early post-seismic deformation of theMw7.6, 1999 Chi-Chi (Taiwan) earthquake. Geophys. J. Int. 2004, 159, 1112–1124. [Google Scholar] [CrossRef] [Green Version]
- Reddy, C.D.; Sunil, P.S.; Burgmann, R.; Chandrasekhar, D.V.; Kato, T. Postseismic relaxation due to Bhuj earthquake on 26 January 2001: Possible mechanisms and processes. Nat. Hazards 2012, 65, 1119–1134. [Google Scholar] [CrossRef]
- Wimpenny, S.; Copley, A.; Ingleby, T. Fault mechanics and post-seismic deformation at Bam, SE Iran. Geophys. J. Int. 2017, 209, 1018–1035. [Google Scholar] [CrossRef] [Green Version]
- Bruhat, L.; Barbot, S.; Avouac, J.-P. Evidence for postseismic deformation of the lower crust following the 2004 Mw6.0 Parkfield earthquake. J. Geophys. Res. Earth Surf. 2011, 116, B08401. [Google Scholar] [CrossRef] [Green Version]
- Diao, F.; Xiong, X.; Wang, R. Mechanisms of Transient Postseismic Deformation Following the 2001 Mw 7.8 Kunlun (China) Earthquake. Pure Appl. Geophys. 2010, 168, 767–779. [Google Scholar] [CrossRef] [Green Version]
- Gourmelen, N.; Amelung, F. Postseismic Mantle Relaxation in the Central Nevada Seismic Belt. Science 2005, 310, 1473–1476. [Google Scholar] [CrossRef] [PubMed] [Green Version]
- Nishimura, T.; Thatcher, W. Rheology of the lithosphere inferred from postseismic uplift following the 1959 Hebgen Lake earthquake. J. Geophys. Res. Solid Earth 2003, 108, 2389. [Google Scholar] [CrossRef]
- Pollitz, F.F.; Peltzer, G.; Burgmann, R. Mobility of continental mantle: Evidence from postseismic geodetic observations following the 1992 Landers earthquake. J. Geophys. Res. Earth Surf. 2000, 105, 8035–8054. [Google Scholar] [CrossRef]
- Pollitz, F.F.; Wicks, C.; Thatcher, W. Mantle Flow Beneath a Continental Strike-Slip Fault: Postseismic Deformation After the 1999 Hector Mine Earthquake. Science 2001, 293, 1814–1818. [Google Scholar] [CrossRef] [PubMed]
- Johnson, K.M.; Bürgmann, R.; Freymueller, J.T. Coupled afterslip and viscoelastic flow following the 2002 Denali Fault, Alaska earthquake. Geophys. J. Int. 2009, 176, 670–682. [Google Scholar] [CrossRef] [Green Version]
- Jónsson, S. Importance of post-seismic viscous relaxation in southern Iceland. Nat. Geosci. 2008, 1, 136–139. [Google Scholar] [CrossRef]
- Pollitz, F.F.; Burgmann, R.; Thatcher, W. Illumination of rheological mantle heterogeneity by the M7.2 2010 El Mayor-Cucapah earthquake. Geochem. Geophys. Geosyst. 2012, 13, Q06002. [Google Scholar] [CrossRef]
- Wang, L.; Wang, R.; Roth, F.; Enescu, B.; Hainzl, S.; Ergintav, S. Afterslip and viscoelastic relaxation following the 1999M7.4 İzmit earthquake from GPS measurements. Geophys. J. Int. 2009, 178, 1220–1237. [Google Scholar] [CrossRef] [Green Version]
- Vergnolle, M.; Pollitz, F.; Calais, E. Constraints on the viscosity of the continental crust and mantle from GPS measurements and postseismic deformation models in western Mongolia. J. Geophys. Res. Earth Surf. 2003, 108, 2502. [Google Scholar] [CrossRef] [Green Version]
- Gualandi, A.; Liu, Z.; Rollins, C. Post-large earthquake seismic activities mediated by aseismic deformation processes. Earth Planet. Sci. Lett. 2020, 530, 115870. [Google Scholar] [CrossRef]
- Fujiwara, S.; Tobita, M.; Ozawa, S. Spatiotemporal functional modeling of postseismic deformations after the 2011 Toho-ku-Oki earthquake. Earth Planets Space 2022, 74, 13. [Google Scholar] [CrossRef]
- Zhang, C.; Shi, Y.; Ma, L.; Lomnitz, C. A rheological model of post–seismic deformation for the 2001 Kunlun, China earthquake, Mw 7. Geofísica Int. 2007, 46, 145–154. [Google Scholar] [CrossRef]
- Wen, Y.; Li, Z.; Xu, C.; Ryder, I.; Bürgmann, R. Postseismic motion after the 2001 MW 7.8 Kokoxili earthquake in Tibet observed by InSAR time series. J. Geophys. Res. Solid Earth 2012, 117, B08405. [Google Scholar] [CrossRef]
- Shao, Z.-G.; Fu, R.-S.; Xue, T.-X.; Huang, J.-H. Numerical Simulation and Discussion on the Mechanism of Postseismic Deformation After KunlunMs8.1 Earthquake. Chin. J. Geophys. 2008, 51, 584–596. [Google Scholar] [CrossRef]
- Li, Y.; Shan, X.; Qu, C. Geodetic Constraints on the Crustal Deformation along the Kunlun Fault and Its Tectonic Implications. Remote Sens. 2019, 11, 1775. [Google Scholar] [CrossRef] [Green Version]
- Huang, M.-H.; Burgmann, R.; Freed, A.M. Probing the lithospheric rheology across the eastern margin of the Tibetan Plateau. Earth Planet. Sci. Lett. 2014, 396, 88–96. [Google Scholar] [CrossRef]
- Chen, L.; Capitanio, F.; Liu, L.; Gerya, T.V. Crustal rheology controls on the Tibetan Plateau formation during India-Asia convergence. Nat. Commun. 2017, 8, 15992. [Google Scholar] [CrossRef] [PubMed] [Green Version]
- Tapponnier, P.; Peltzer, G.; Dain, A.Y.L.; Armijo, R.; Cobbold, P. Propagating extrusion tectonics in Asia: New insights from simple experiments with plasticine. Geology 1982, 10, 611–616. [Google Scholar] [CrossRef]
- Avouac, J.-P.; Tapponnier, P. Kinematic model of active deformation in central Asia. Geophys. Res. Lett. 1993, 20, 895–898. [Google Scholar] [CrossRef] [Green Version]
- Clark, M.K.; Bush, J.W.M.; Royden, L.H. Dynamic topography produced by lower crustal flow against rheological strength heterogeneities bordering the Tibetan Plateau. Geophys. J. Int. 2005, 162, 575–590. [Google Scholar] [CrossRef] [Green Version]
- Royden, L.H.; Burchfiel, B.C.; van der Hilst, R.D. The Geological Evolution of the Tibetan Plateau. Science 2008, 321, 1054–1058. [Google Scholar] [CrossRef] [PubMed] [Green Version]
- Zhu, L.; Helmberger, D.V. Moho Offset Across the Northern Margin of the Tibetan Plateau. Science 1998, 281, 1170–1172. [Google Scholar] [CrossRef] [Green Version]
- Braitenberg, C.; Wang, Y.; Fang, J.; Hsu, H. Spatial variations of flexure parameters over the Tibet–Quinghai plateau. Earth Planet. Sci. Lett. 2003, 205, 211–224. [Google Scholar] [CrossRef]
- Karplus, M.S.; Zhao, W.; Klemperer, S.L.; Wu, Z.; Mechie, J.; Shi, D.; Brown, L.D.; Chen, C. Injection of Tibetan crust beneath the south Qaidam Basin: Evidence from INDEPTH IV wide-angle seismic data. J. Geophys. Res. Earth Surf. 2011, 116, B07301. [Google Scholar] [CrossRef] [Green Version]
- Unsworth, M.; Wenbo, W.; Jones, A.; Li, S.; Bedrosian, P.; Booker, J.; Sheng, J.; Ming, D.; Handong, T. Crustal and upper mantle structure of northern Tibet imaged with magnetotelluric data. J. Geophys. Res. Earth Surf. 2004, 109, B02403. [Google Scholar] [CrossRef]
- Fan, G.-W.; Lay, T. Strong Lg Attenuation in the Tibetan Plateau. Bull. Seismol. Soc. Am. 2003, 93, 2264–2272. [Google Scholar] [CrossRef]
- Owens, T.J.; Zandt, G. Implications of crustal property variations for models of Tibetan plateau evolution. Nature 1997, 387, 37–43. [Google Scholar] [CrossRef]
- Shapiro, N.M.; Ritzwoller, M.H.; Molnar, P.; Levin, V. Thinning and Flow of Tibetan Crust Constrained by Seismic Anisotropy. Science 2004, 305, 233–236. [Google Scholar] [CrossRef] [Green Version]
- Funning, G.J.; Parsons, B.; Wright, T.J. Fault slip in the 1997 Manyi, Tibet earthquake from linear elastic modelling of InSAR displacements. Geophys. J. Int. 2007, 169, 988–1008. [Google Scholar] [CrossRef] [Green Version]
- Wang, M.; Shen, Z.K.; Chen, J.; Zhang, Z.; Wang, Q.L.; Gan, W. Slip Distribution of the 2001 Mw 7.8 Kokoxili Earthquake, Western China; EGS—AGU—EUG Joint Assembly: Nice, France, 2003; p. 5549. [Google Scholar]
- Lasserre, C.; Peltzer, G.; Crampé, F.; Klinger, Y.; Van Der Woerd, J.; Tapponnier, P. Coseismic deformation of the 2001 MW = 7.8 Kokoxili earthquake in Tibet, measured by synthetic aperture radar interferometry. J. Geophys. Res. Earth Surf. 2005, 110, B12408. [Google Scholar] [CrossRef] [Green Version]
- Wan, Y.-G.; Wang, M.; Shen, Z.-K.; Chen, J.; Zhang, Z.-S.; Wangm, Q.-L.; Gan, W.-J. Co-seismic slip distribution of the 2001 west of kunlun mountain pass earthquake inverted by gps and leveling data. Seismol. Egology 2004, 26, 393–404. [Google Scholar]
- Fattahi, H.; Agram, P.; Simons, M. A Network-Based Enhanced Spectral Diversity Approach for TOPS Time-Series Analysis. IEEE Trans. Geosci. Remote Sens. 2017, 55, 777–786. [Google Scholar] [CrossRef] [Green Version]
- Rosen, P.A.; Gurrola, E.; Sacco, G.F.; Zebker, H. The InSAR scientific computing environment. In Proceedings of the 9th European Conference on Synthetic Aperture Rada, Nuremberg, Germany, 23–26 April 2012; pp. 730–733. [Google Scholar]
- Farr, T.G.; Rosen, P.A.; Caro, E.; Crippen, R.; Duren, R.; Hensley, S.; Alsdorf, D. The Shuttle Radar Topography Mission. Rev. Geophys. 2007, 45, RG2004. [Google Scholar] [CrossRef] [Green Version]
- Chen, C.W.; Zebker, H.A. Two-dimensional phase unwrapping with use of statistical models for cost functions in nonlinear optimization. J. Opt. Soc. Am. A 2001, 18, 338–351. [Google Scholar] [CrossRef] [PubMed] [Green Version]
- Yunjun, Z.; Fattahi, H.; Amelung, F. Small baseline InSAR time series analysis: Unwrapping error correction and noise reduction. Comput. Geosci. 2019, 133, 104331. [Google Scholar] [CrossRef] [Green Version]
- Fattahi, H.; Amelung, F. InSAR observations of strain accumulation and fault creep along the Chaman Fault system, Pakistan and Afghanistan. Geophys. Res. Lett. 2016, 43, 8399–8406. [Google Scholar] [CrossRef] [Green Version]
- Liang, C.; Agram, P.; Simons, M.; Fielding, E.J. Ionospheric Correction of InSAR Time Series Analysis of C-band Sentinel-1 TOPS Data. IEEE Trans. Geosci. Remote Sens. 2019, 57, 6755–6773. [Google Scholar] [CrossRef] [Green Version]
- Okada, Y. Internal deformation due to shear and tensile faults in a half-space. Bull. Seism. Soc. Am. 1992, 82, 1018–1040. [Google Scholar] [CrossRef]
- Gan, W.; Zhang, P.; Shen, Z.-K.; Niu, Z.; Wang, M.; Wan, Y.; Zhou, D.; Cheng, J. Present-day crustal motion within the Tibetan Plateau inferred from GPS measurements. J. Geophys. Res. Earth Surf. 2007, 112, B08416. [Google Scholar] [CrossRef] [Green Version]
- Liu, Y.; Xu, C.; Li, Z.; Wen, Y.; Forrest, D. Interseismic slip rate of the Garze–Yushu fault belt in the Tibetan Plateau from C-band InSAR observations between 2003 and 2010. Adv. Space Res. 2011, 48, 2005–2015. [Google Scholar] [CrossRef]
- Li, Y.; Shan, X.; Qu, C.; Liu, Y.; Han, N. Crustal Deformation of the Altyn Tagh Fault Based on GPS. J. Geophys. Res. Solid Earth 2018, 123, 10309–10322. [Google Scholar] [CrossRef]
- Bell, M.A.; Elliott, J.R.; Parsons, B. Interseismic strain accumulation across the Manyi fault (Tibet) prior to the 1997 Mw7.6 earthquake. Geophys. Res. Lett. 2011, 38, 38. [Google Scholar] [CrossRef]
- Li, Y.; Shan, X.; Qu, C.; Wang, Z. Fault locking and slip rate deficit of the Haiyuan-Liupanshan fault zone in the northeastern margin of the Tibetan Plateau. J. Geodyn. 2016, 102, 47–57. [Google Scholar] [CrossRef]
- Guo, R.; Zheng, Y.; Tian, W.; Xu, J.; Zhang, W. Locking Status and Earthquake Potential Hazard along the Middle-South Xianshuihe Fault. Remote Sens. 2018, 10, 2048. [Google Scholar] [CrossRef] [Green Version]
- Diao, F.; Xiong, X.; Wang, R.; Walter, T.R.; Wang, Y.; Wang, K. Slip Rate Variation Along the Kunlun Fault (Tibet): Results From New GPS Observations and a Viscoelastic Earthquake-Cycle Deformation Model. Geophys. Res. Lett. 2019, 46, 2524–2533. [Google Scholar] [CrossRef]
- Barbot, S.; Fialko, Y. Fourier-domain Green’s function for an elastic semi-infinite solid under gravity, with applications to earthquake and volcano deformation. Geophys. J. Int. 2010, 182, 568–582. [Google Scholar] [CrossRef] [Green Version]
- Barbot, S.; Fialko, Y. A unified continuum representation of post-seismic relaxation mechanisms: Semi-analytic models of afterslip, poroelastic rebound and viscoelastic flow. Geophys. J. Int. 2010, 182, 1124–1140. [Google Scholar] [CrossRef] [Green Version]
- Wang, H.; Xu, C.; Ge, L. Coseismic deformation and slip distribution of the 1997 Mw7.5 Manyi, Tibet, earthquake from InSAR measurements. J. Geodyn. 2007, 44, 200–212. [Google Scholar] [CrossRef]
- Laske, G.; Masters, G.; Ma, Z.; Pasyanos, M. Update on CRUST1.0—A 1-Degree Global Model of Earth’s Crust; EGU General Assembly: Vienna, Austria, 2013; p. 2658. [Google Scholar]
- Bagnardi, M.; Hooper, A. Inversion of Surface Deformation Data for Rapid Estimates of Source Parameters and Uncertainties: A Bayesian Approach. Geochem. Geophys. Geosyst. 2018, 19, 2194–2211. [Google Scholar] [CrossRef]
- Bürgmann, R.; Dresen, G. Rheology of the Lower Crust and Upper Mantle: Evidence from Rock Mechanics, Geodesy, and Field Observations. Annu. Rev. Earth Planet. Sci. 2008, 36, 531–567. [Google Scholar] [CrossRef] [Green Version]
- Freed, A.M.; Bürgmann, R.; Calais, E.; Freymueller, J. Stress-dependent power-law flow in the upper mantle following the 2002 Denali, Alaska, earthquake. Earth Planet. Sci. Lett. 2006, 252, 481–489. [Google Scholar] [CrossRef]


| Path | Time Period | Number of Images |
|---|---|---|
| AT12 | 2014/11–2021/07 | 165 |
| AT114 | 2014/11–2021/05 | 159 |
| AT41 | 2014/11–2021/07 | 163 |
| AT143 | 2014/11–2021/05 | 155 |
| AT70 | 2014/11–2021/07 | 158 |
| AT172 | 2014/11–2021/07 | 161 |
| DT19 | 2014/11–2021/07 | 161 |
| DT121 | 2014/11–2021/07 | 158 |
| DT48 | 2014/11–2021/03 | 151 |
| DT150 | 2014/11–2021/05 | 154 |
| DT77 | 2014/11–2021/07 | 143 |
| Fault | Length [km] | Locking Depth [km] | Average Slip Rate [mm/yr] |
|---|---|---|---|
| Alytn Tagh [71] | 2000 | 20 | 7 |
| Manyi [72] | 200 | 22 | 5 |
| Haiyuan [73] | 670 | 15 | 4.5 |
| Yushu-Ganzi [70] | 668 | 21 | 15 |
| Xianshuihe [74] | 379 | 20 | 9.2 |
| Fault Segment | Length [km] | Locking Depth [km] | Slip Rate [mm/yr] |
|---|---|---|---|
| Kusai Lake | 283 | 20 | 15 |
| Xidatan–Dongdatan | 135 | 20 | 17.4 |
| Alake Lake | 164 | 20 | 10.7 |
| Tuosuo Lake | 224 | 20 | 6.2 |
| Maqin Maqu | 359 | 20 | 6.1 |
| Length (km) | Width (km) | Depth (km) | Dip (°) | Strike (°) | Strike Slip (m/yr) | Dip Slip (m/yr) | Lat a | Lon a | |
|---|---|---|---|---|---|---|---|---|---|
| Lower | 20 | 980 | 20 | 90 | 100 | −0.1 | −0.1 | — | — |
| Upper | 1200 | Same as above | 0.1 | 0.1 | — | — | |||
| Optimal | 215.17 | — | — | — | — | 0.017 | −0.003 | 35.85 | 92.83 |
| 2.5% | 102.76 | — | — | — | — | 0.006 | −0.02 | — | — |
| 97.5% | 305.26 | — | — | — | — | 0.023 | 0.01 | — | — |
| Earthquake | Viscoelastic Body | Post-Seismic Deformation Data | Viscosity (Pas) | |
|---|---|---|---|---|
| 1. Zhang [40] | Kokoxili | SLS | GPS data from 0–1 year after the earthquake | |
| 2. Diao [81] | Maxwell | GPS data from 0–4 months after the earthquake | ||
| 3. Ryder [2] | Burgers | InSAR data from 2–5 years after the earthquake | ||
| 4. Wen [41] | Maxwell | InSAR data from 2–6 years after the earthquake | ||
| 5. He [3] | Burgers | GPS data from 0–6.5 years after the earthquake | ||
| 6. Shao * [42] | Maxwell | GPS data from 0–7 months after the earthquake | ||
| 7. This study | Maxwell | InSAR data from 14–19 years after the earthquake |
Publisher’s Note: MDPI stays neutral with regard to jurisdictional claims in published maps and institutional affiliations. |
© 2022 by the authors. Licensee MDPI, Basel, Switzerland. This article is an open access article distributed under the terms and conditions of the Creative Commons Attribution (CC BY) license (https://creativecommons.org/licenses/by/4.0/).
Share and Cite
Lv, X.; Shao, Y. Rheology of the Northern Tibetan Plateau Lithosphere Inferred from the Post-Seismic Deformation Resulting from the 2001 Mw 7.8 Kokoxili Earthquake. Remote Sens. 2022, 14, 1207. https://doi.org/10.3390/rs14051207
Lv X, Shao Y. Rheology of the Northern Tibetan Plateau Lithosphere Inferred from the Post-Seismic Deformation Resulting from the 2001 Mw 7.8 Kokoxili Earthquake. Remote Sensing. 2022; 14(5):1207. https://doi.org/10.3390/rs14051207
Chicago/Turabian StyleLv, Xiaoran, and Yun Shao. 2022. "Rheology of the Northern Tibetan Plateau Lithosphere Inferred from the Post-Seismic Deformation Resulting from the 2001 Mw 7.8 Kokoxili Earthquake" Remote Sensing 14, no. 5: 1207. https://doi.org/10.3390/rs14051207