
The Impact of Climate Change on Hydrological Processes of the Glacierized Watershed and Projections


 , ,
, ,  ,
,
Abstract
:1. Introduction
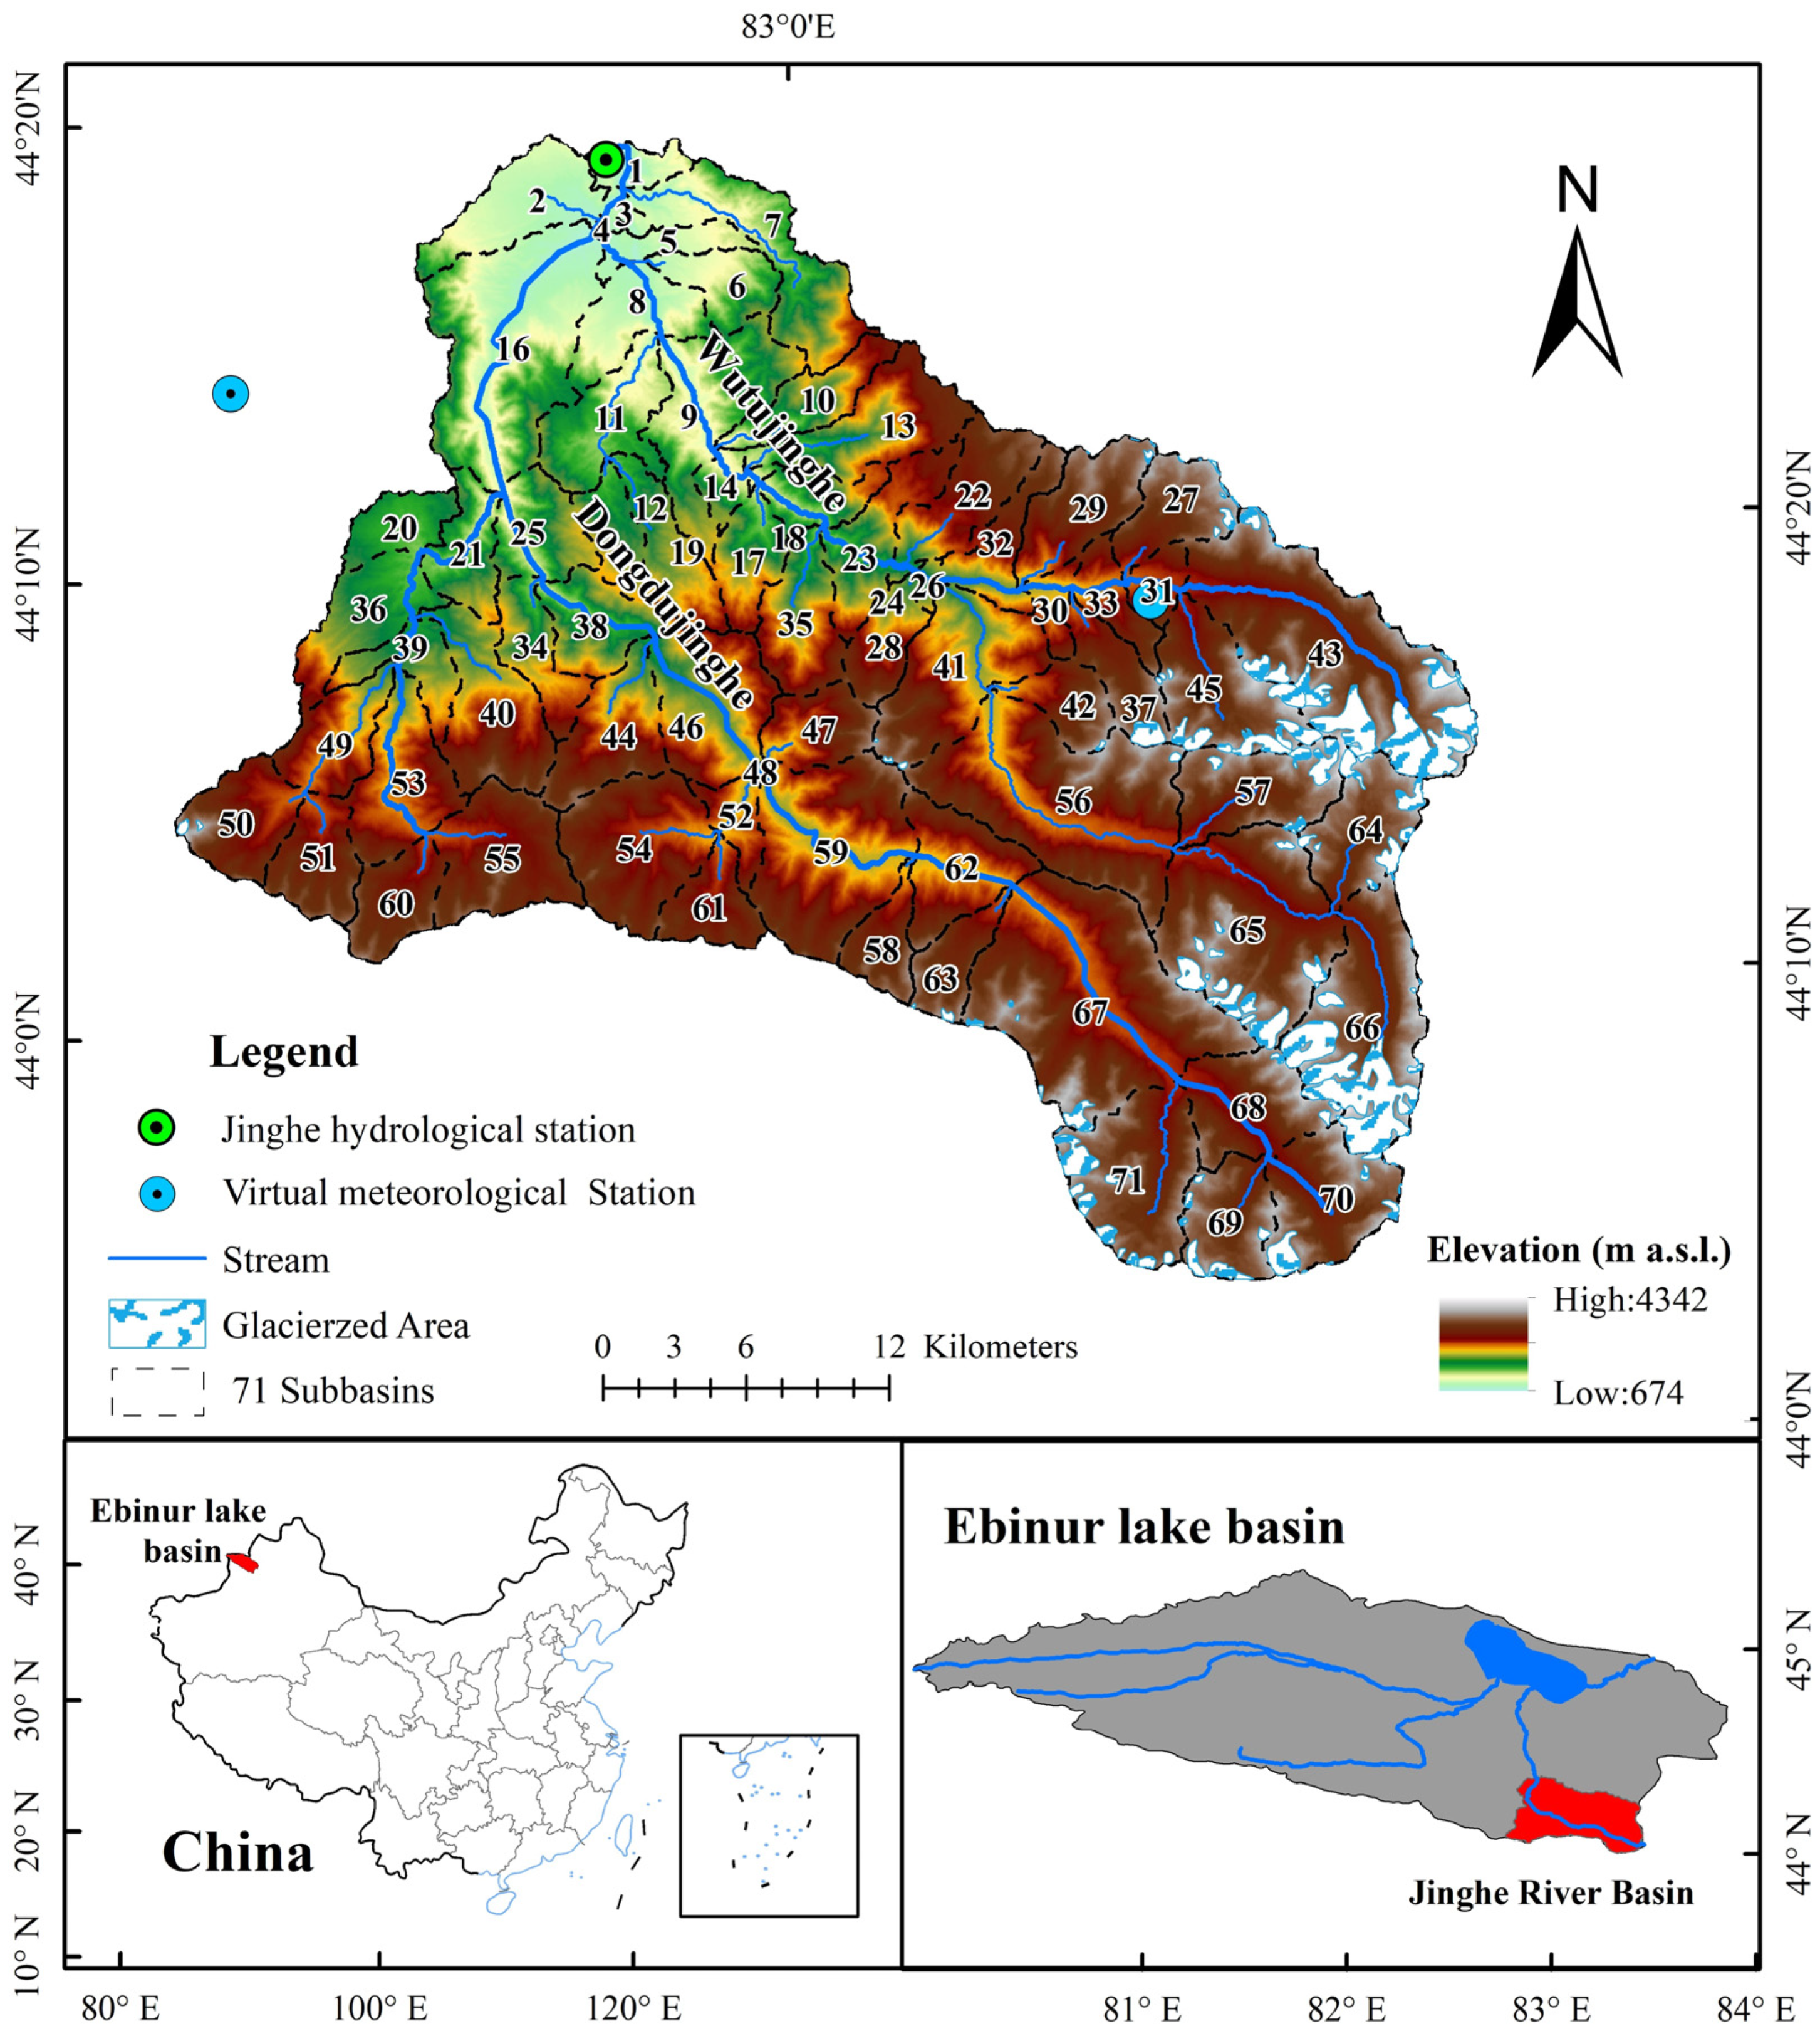
2. Study Area
3. Data and Methodology
3.1. Data Description
3.1.1. Underlying GIS-Referenced Data
3.1.2. Streamflow Monitoring and Meteorological Data
3.1.3. RCM Data and Bias Correction
3.2. GE-SWAT Model Description
3.2.1. Brief Description of the SWAT Model
3.2.2. Glacier Module
3.3. Model Performance Evaluation
3.4. Attribution Analysis for Runoff Change
4. Results
4.1. GE-SWAT Model Performance
4.1.1. Model Parameterization
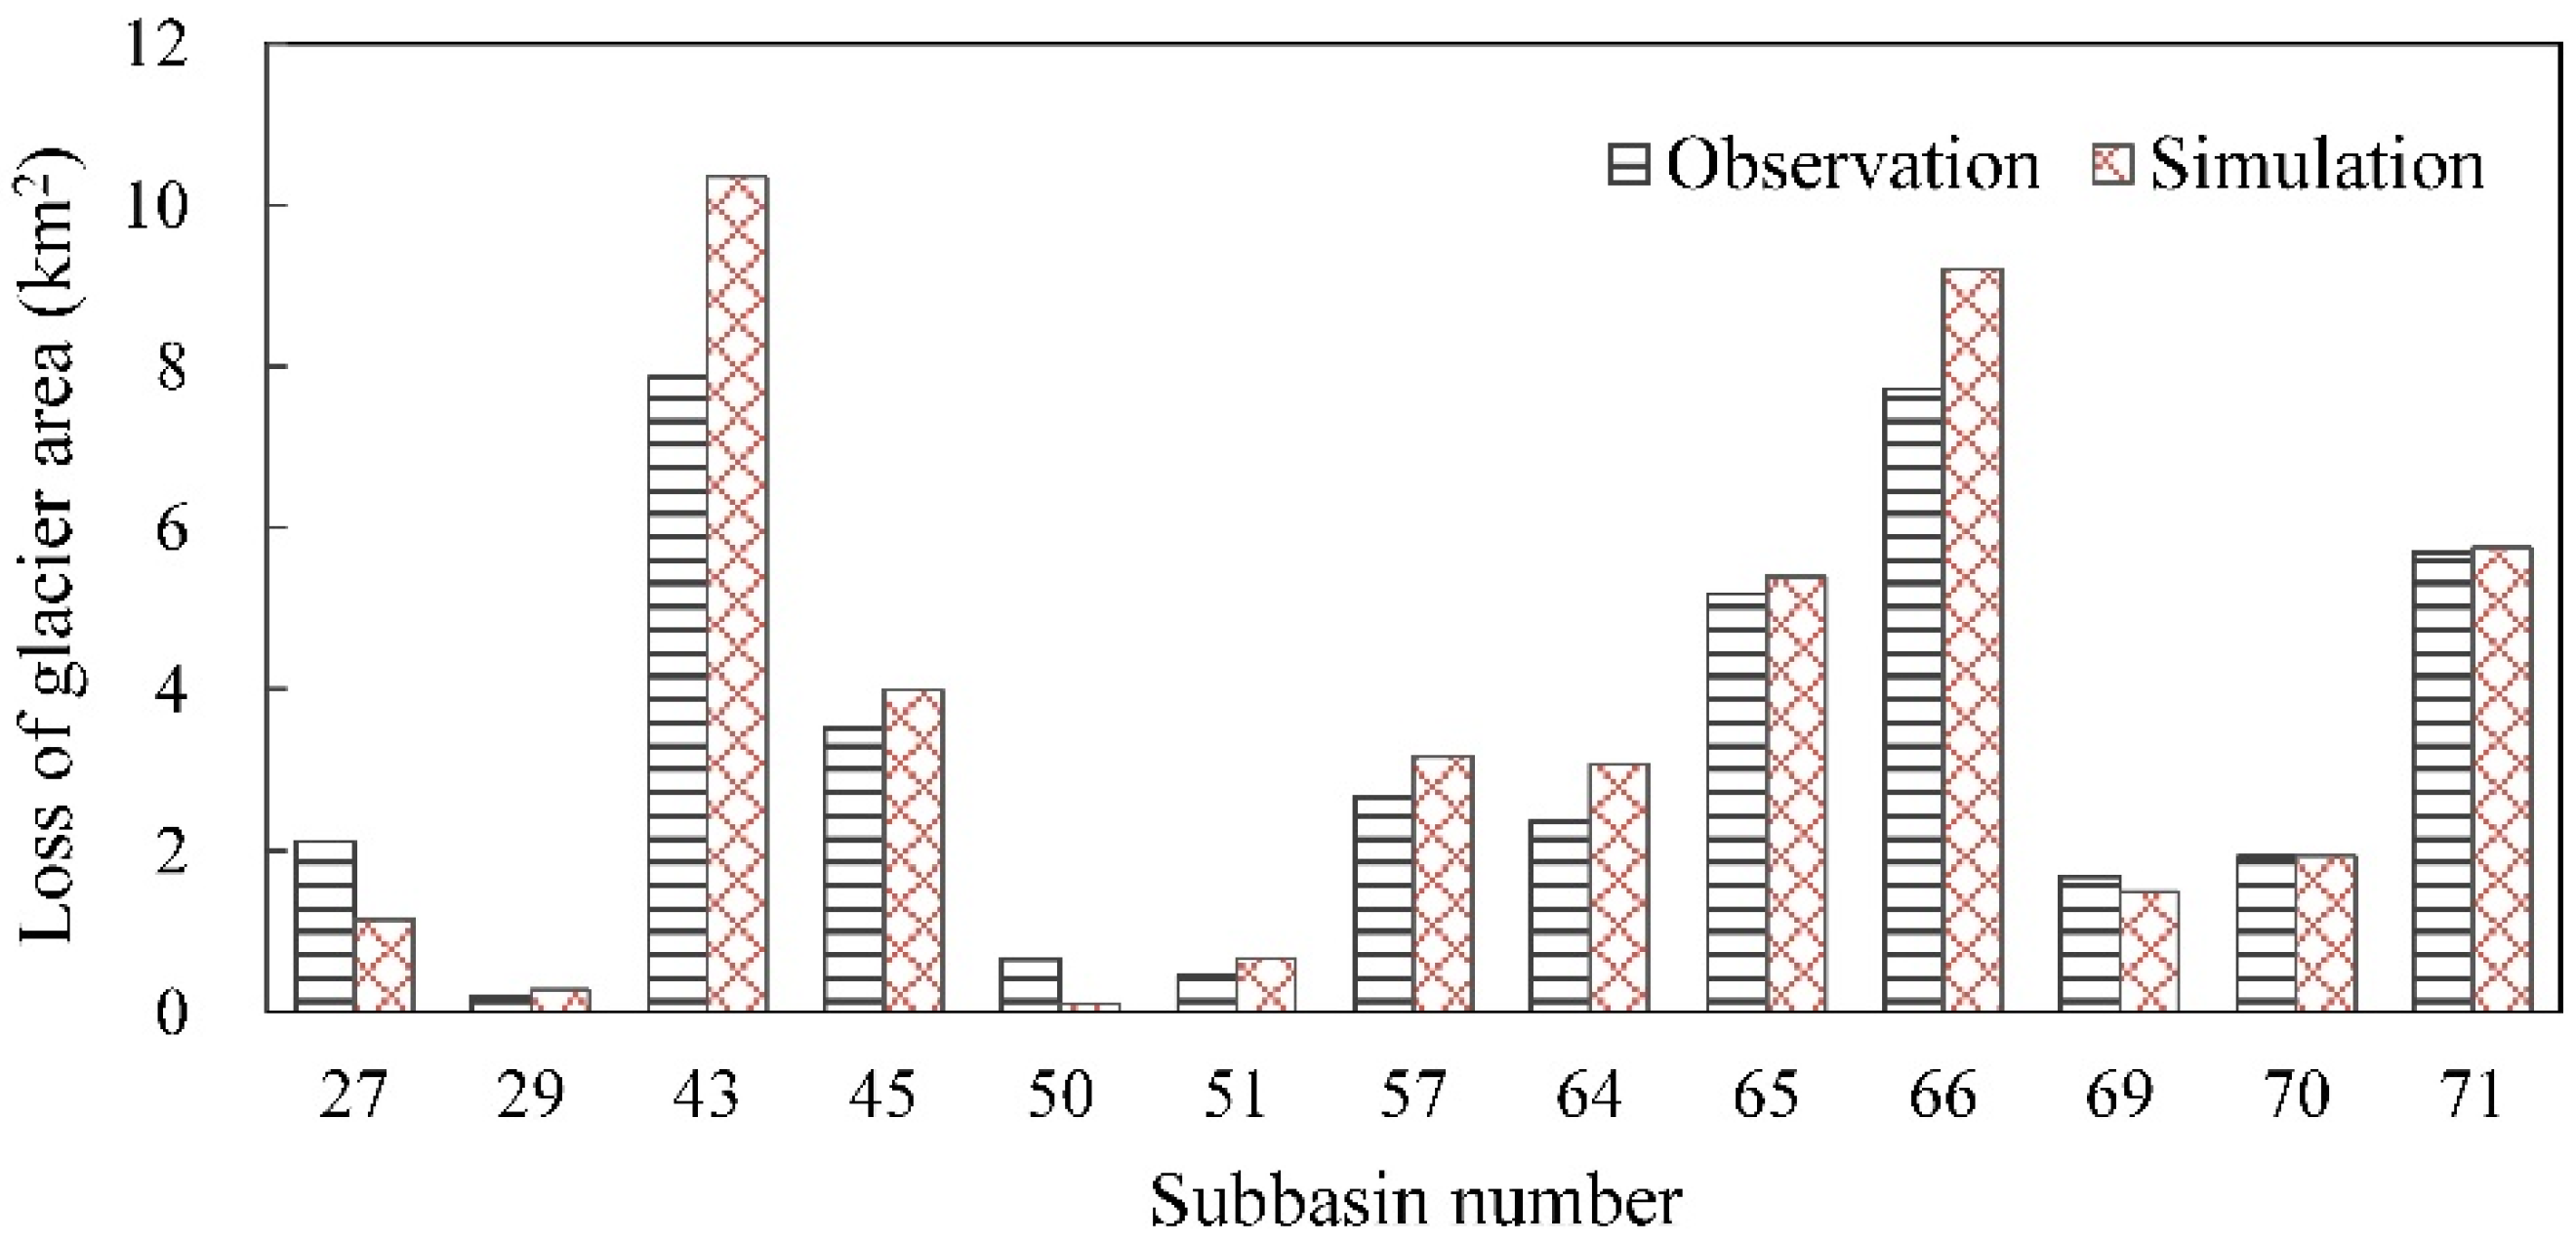
4.1.2. Glacier Area Validation
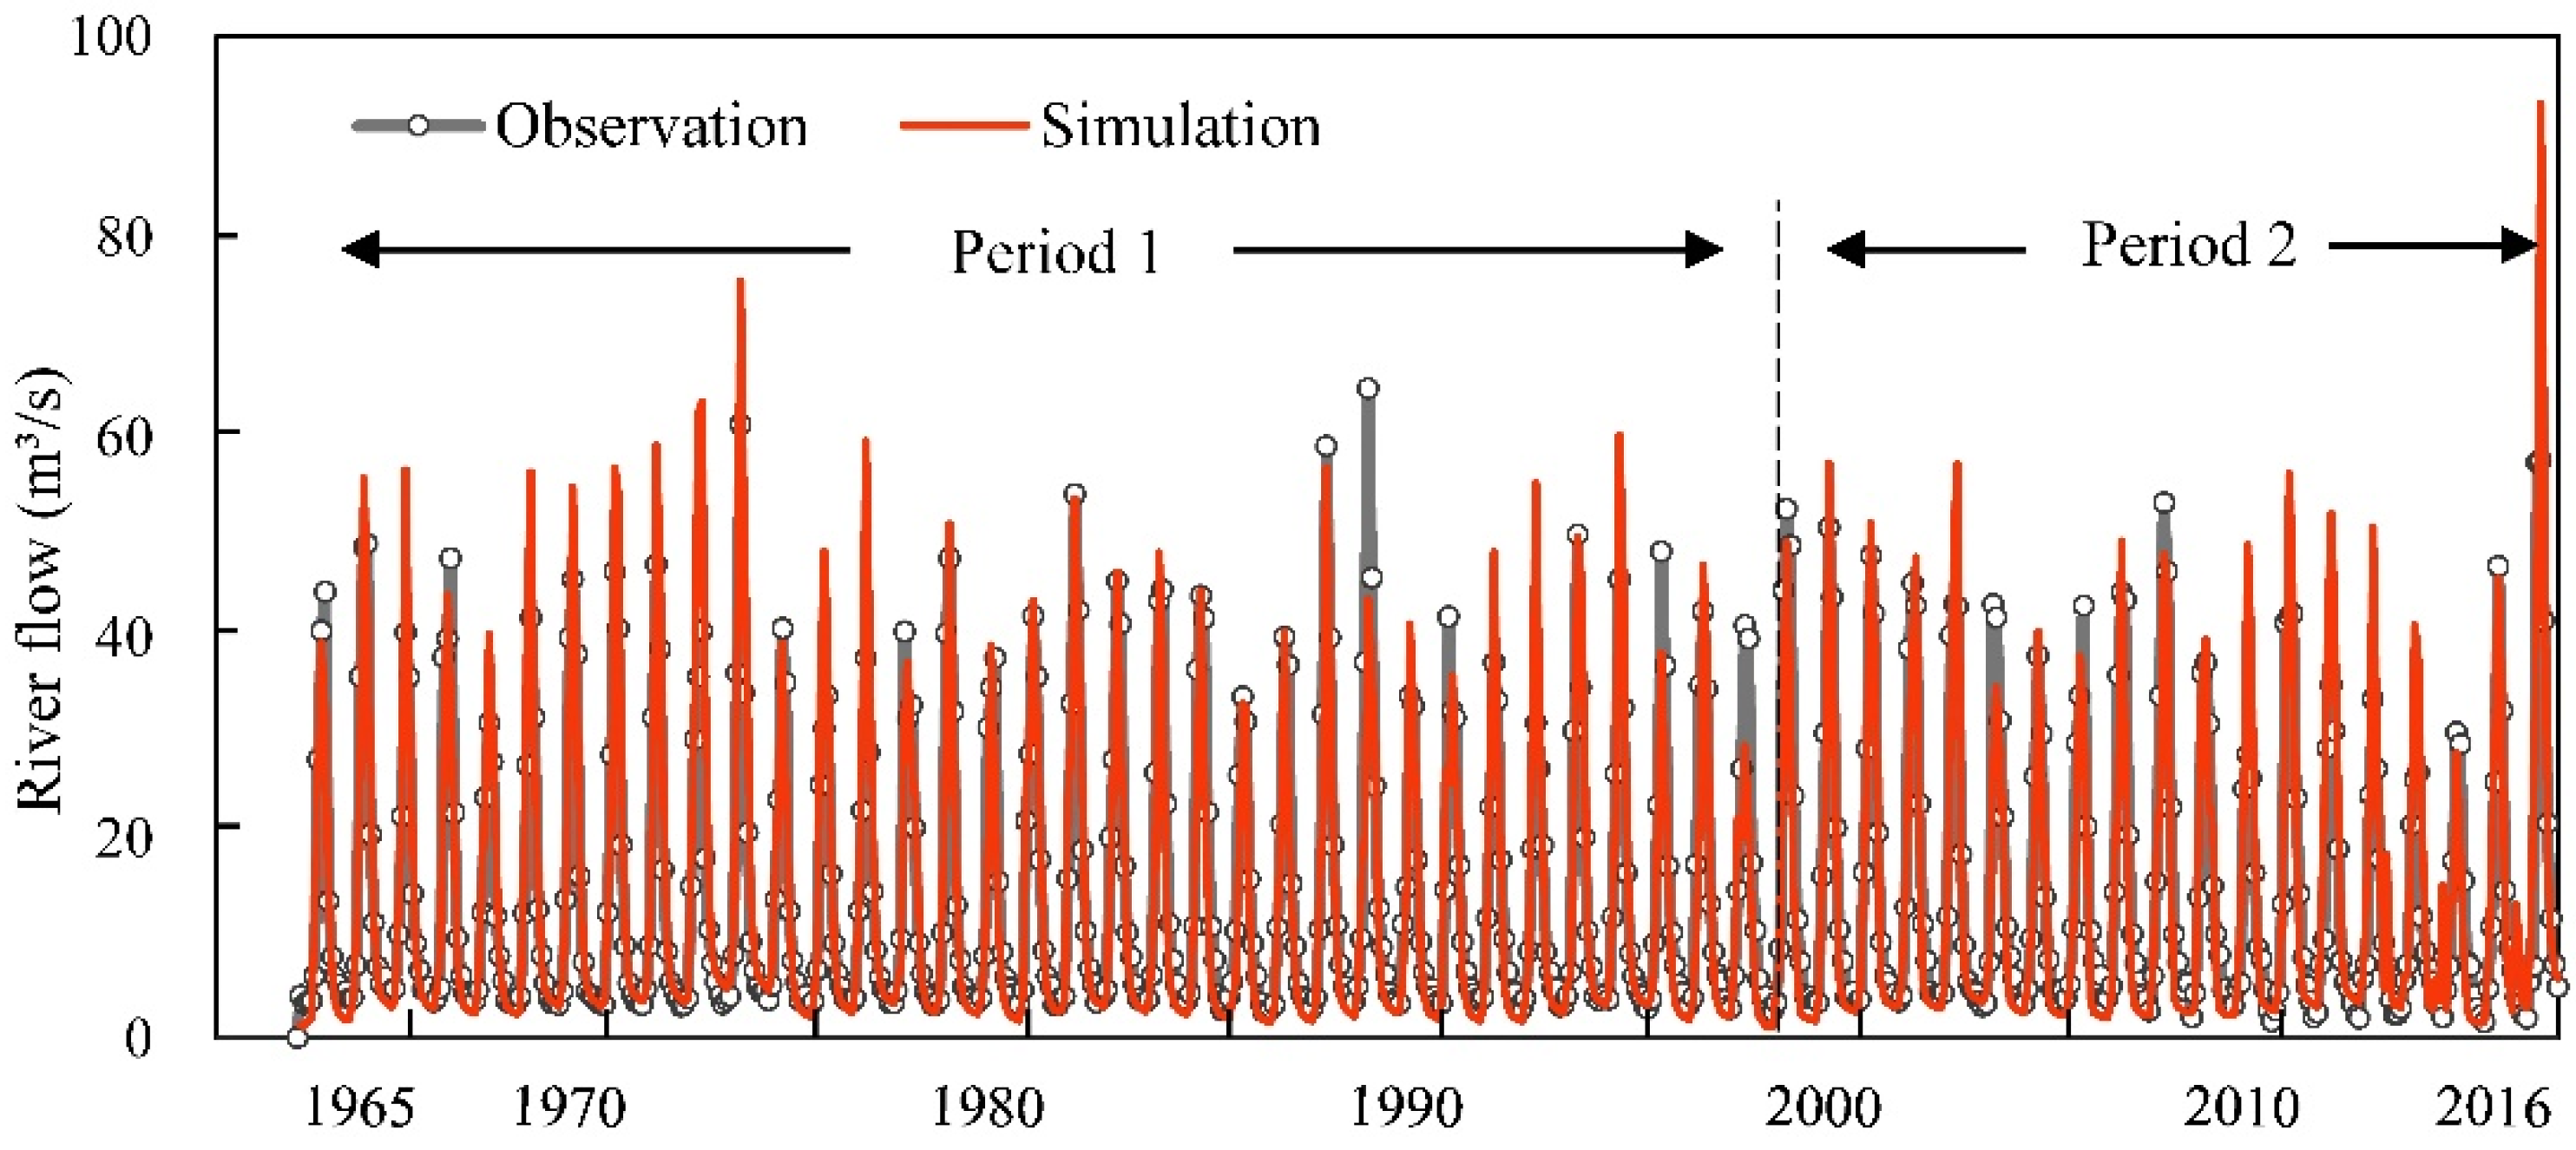
4.1.3. Simulation Runoff Validation
4.2. Attribution of Streamflow Changes
4.2.1. Characteristic of Streamflow Changes
4.2.2. Attribution of the Effect of Temperature Changes on Runoff
4.2.3. Attribution of the Effect of Precipitation Changes on Runoff
4.3. Prediction of Runoff Changes
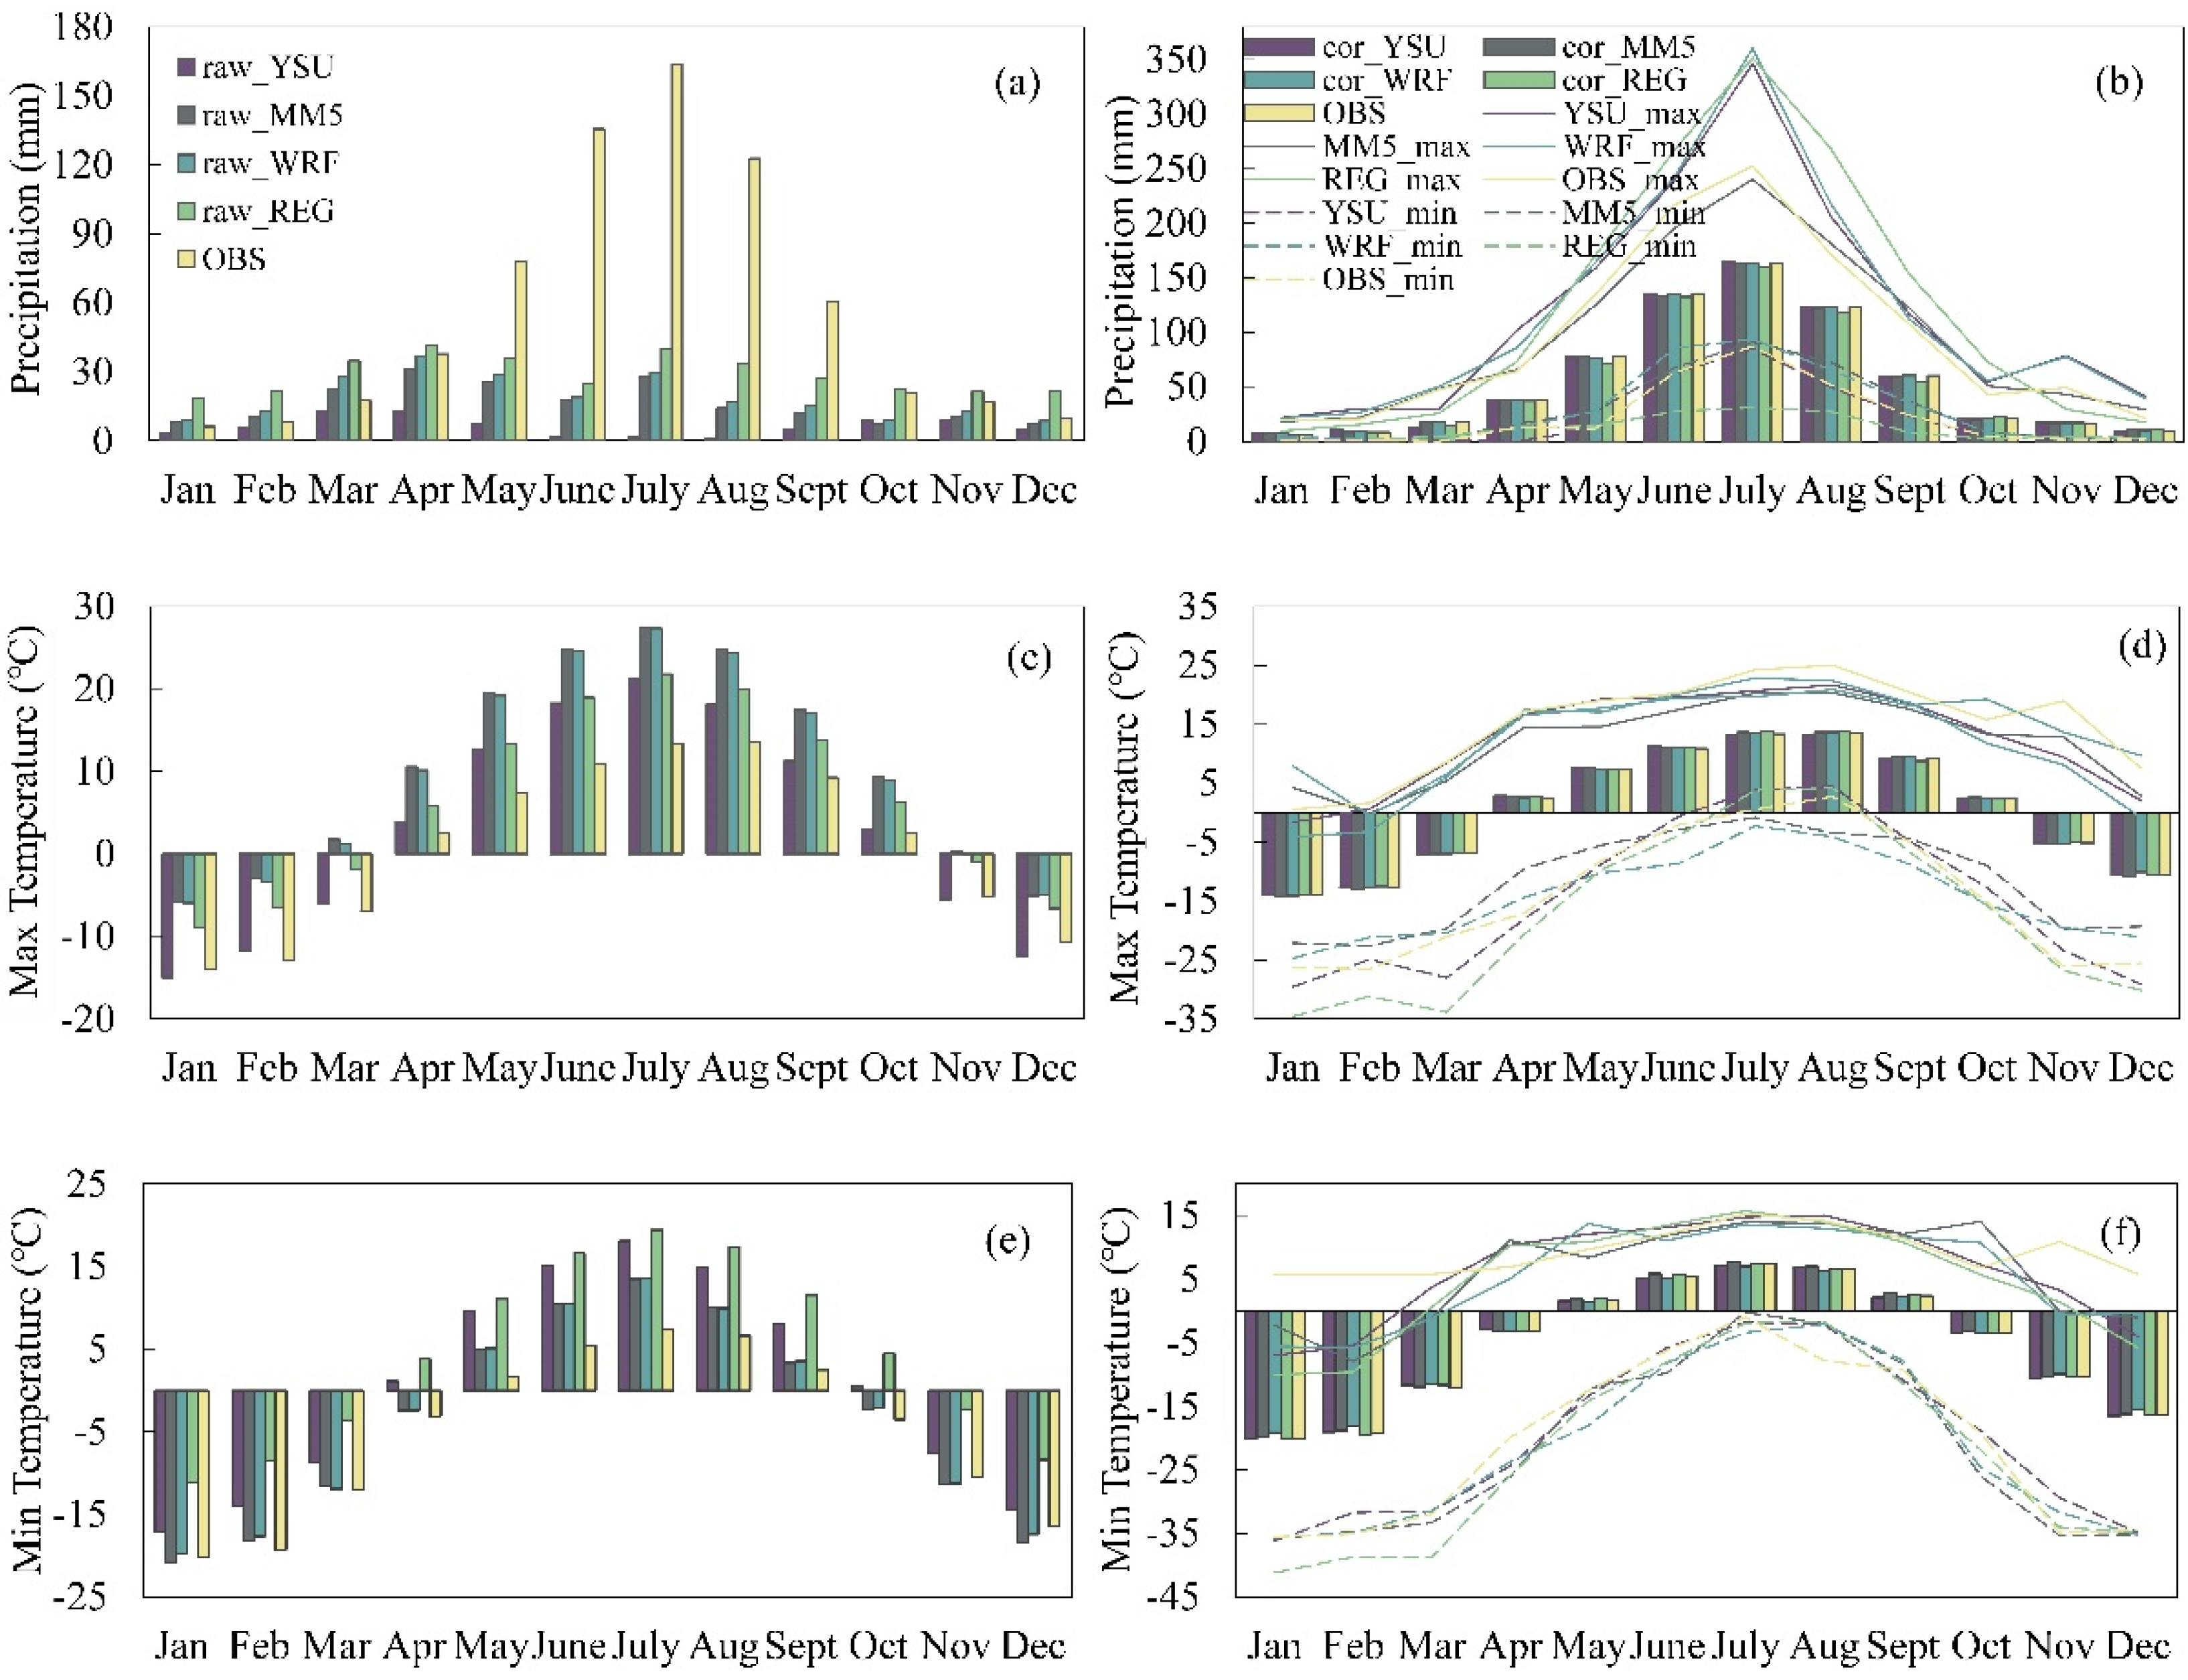
4.3.1. RCM Bias Correction
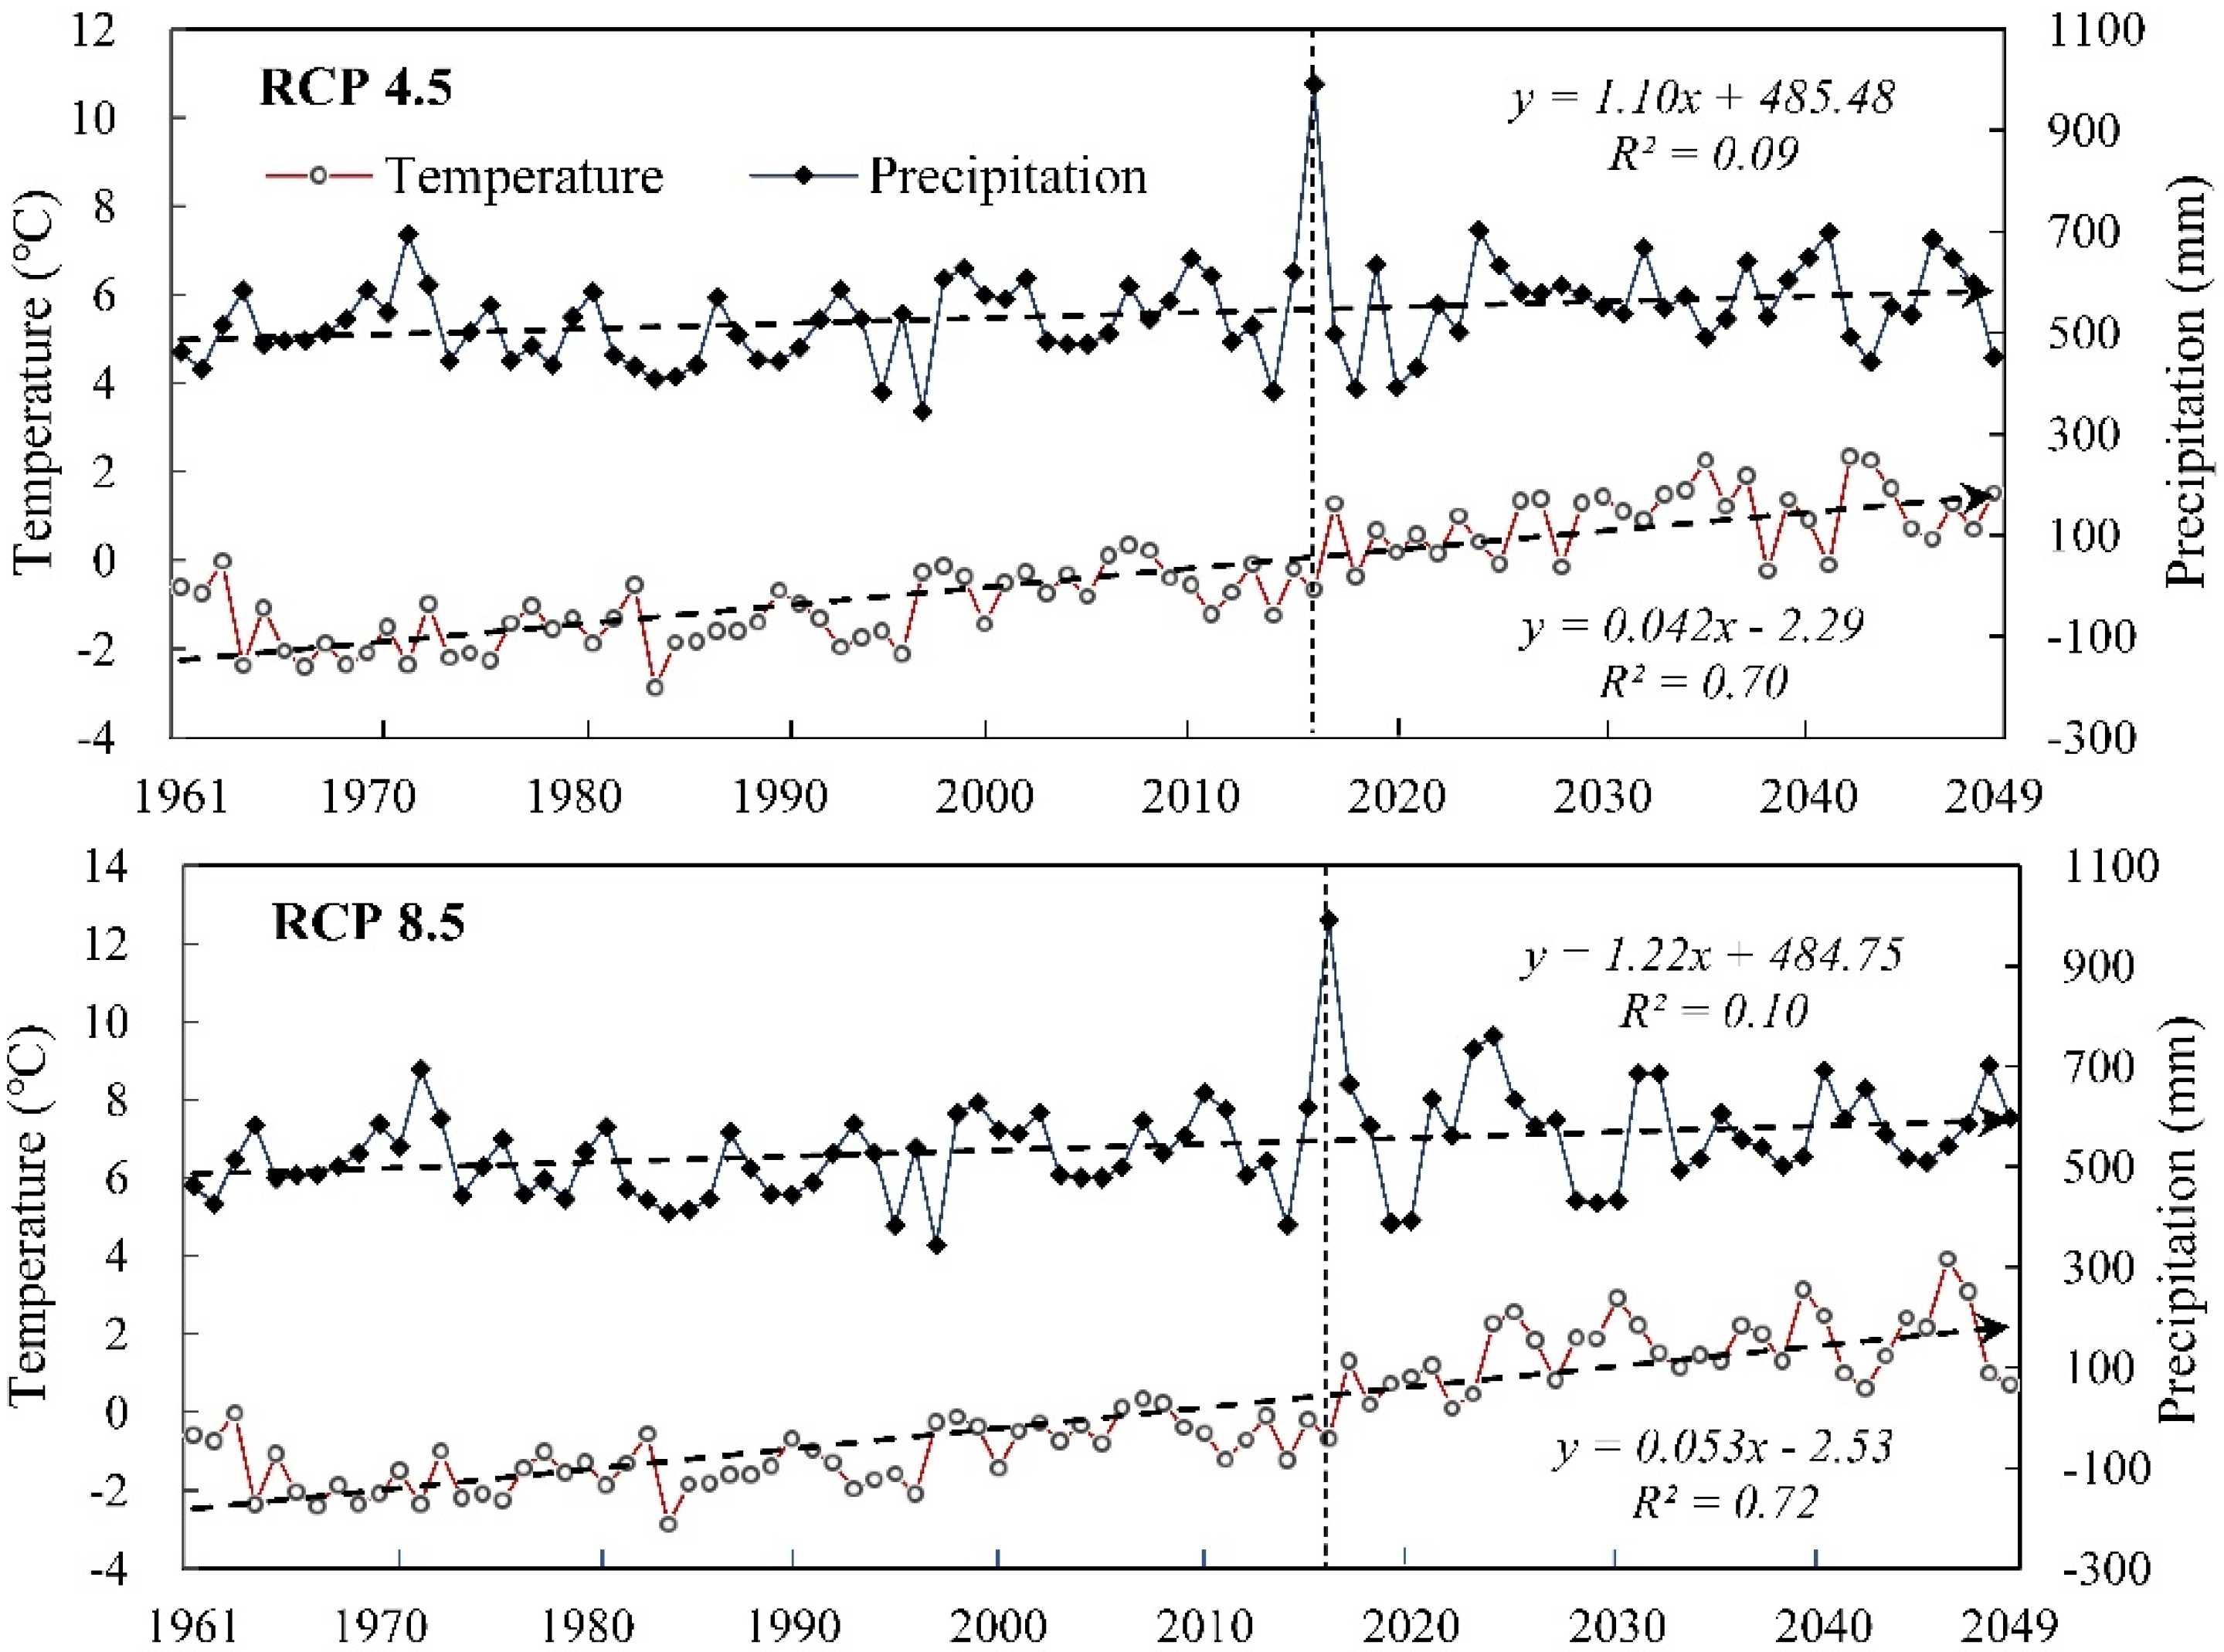
4.3.2. Projected Climate Change
4.3.3. Future Hydrology
5. Discussion
5.1. Uncertainty of Input Data
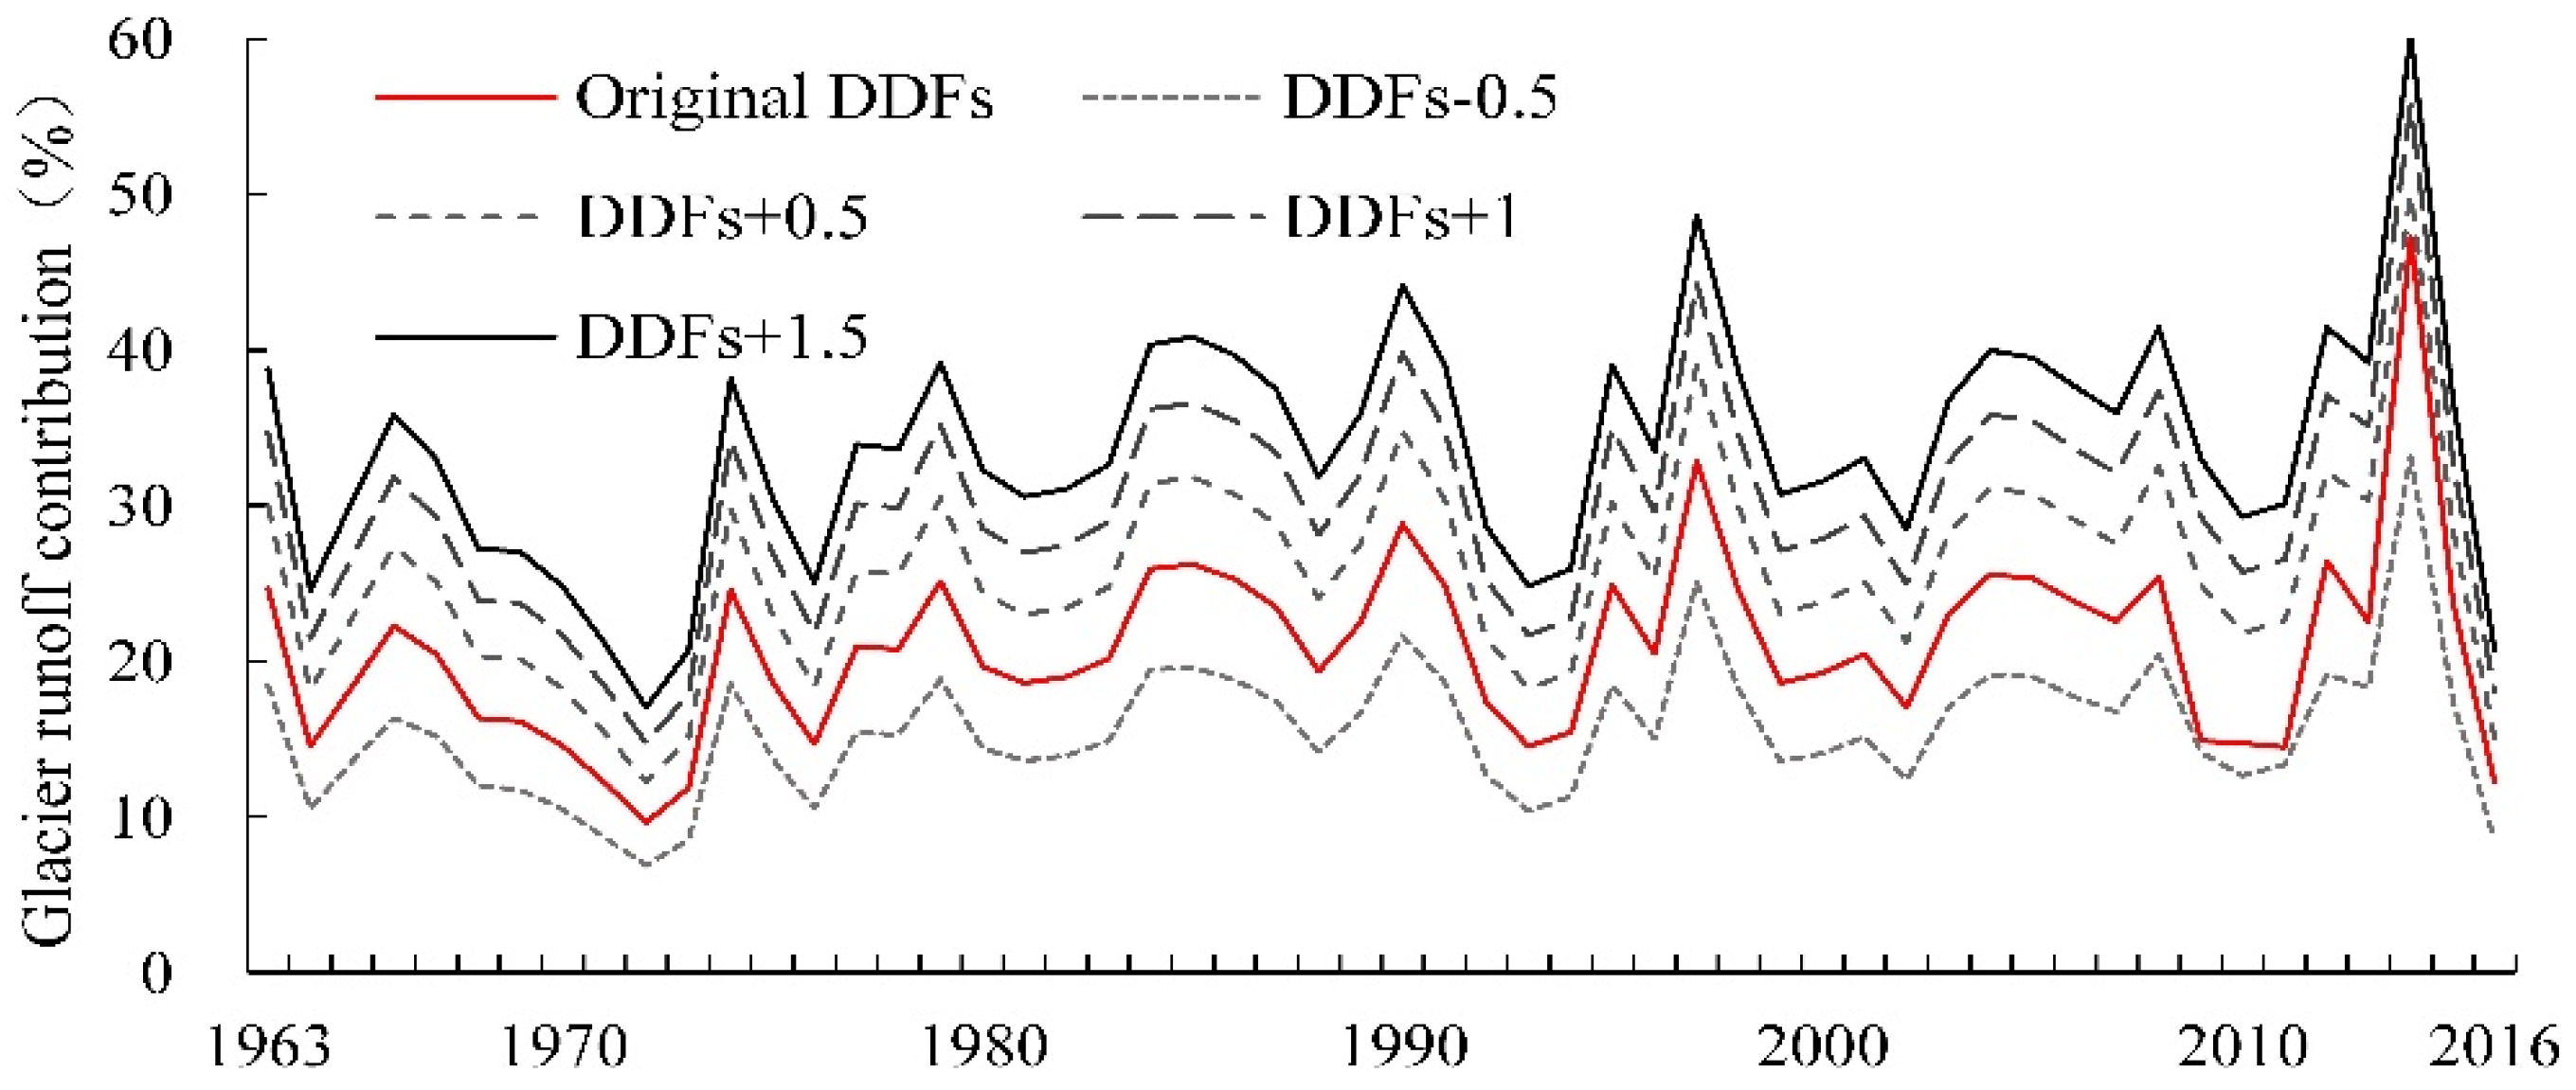
5.2. Uncertainty of DDF Factors
5.3. Potential Risks and Responses of Runoff Change
6. Conclusions
- (1)
- A two-stage calibration method was applied to improve the performance of the glacier-enhanced SWAT model, which allowed it to have the ability to capture the change process of the runoff in the basin with a moderate glacier cover.
- (2)
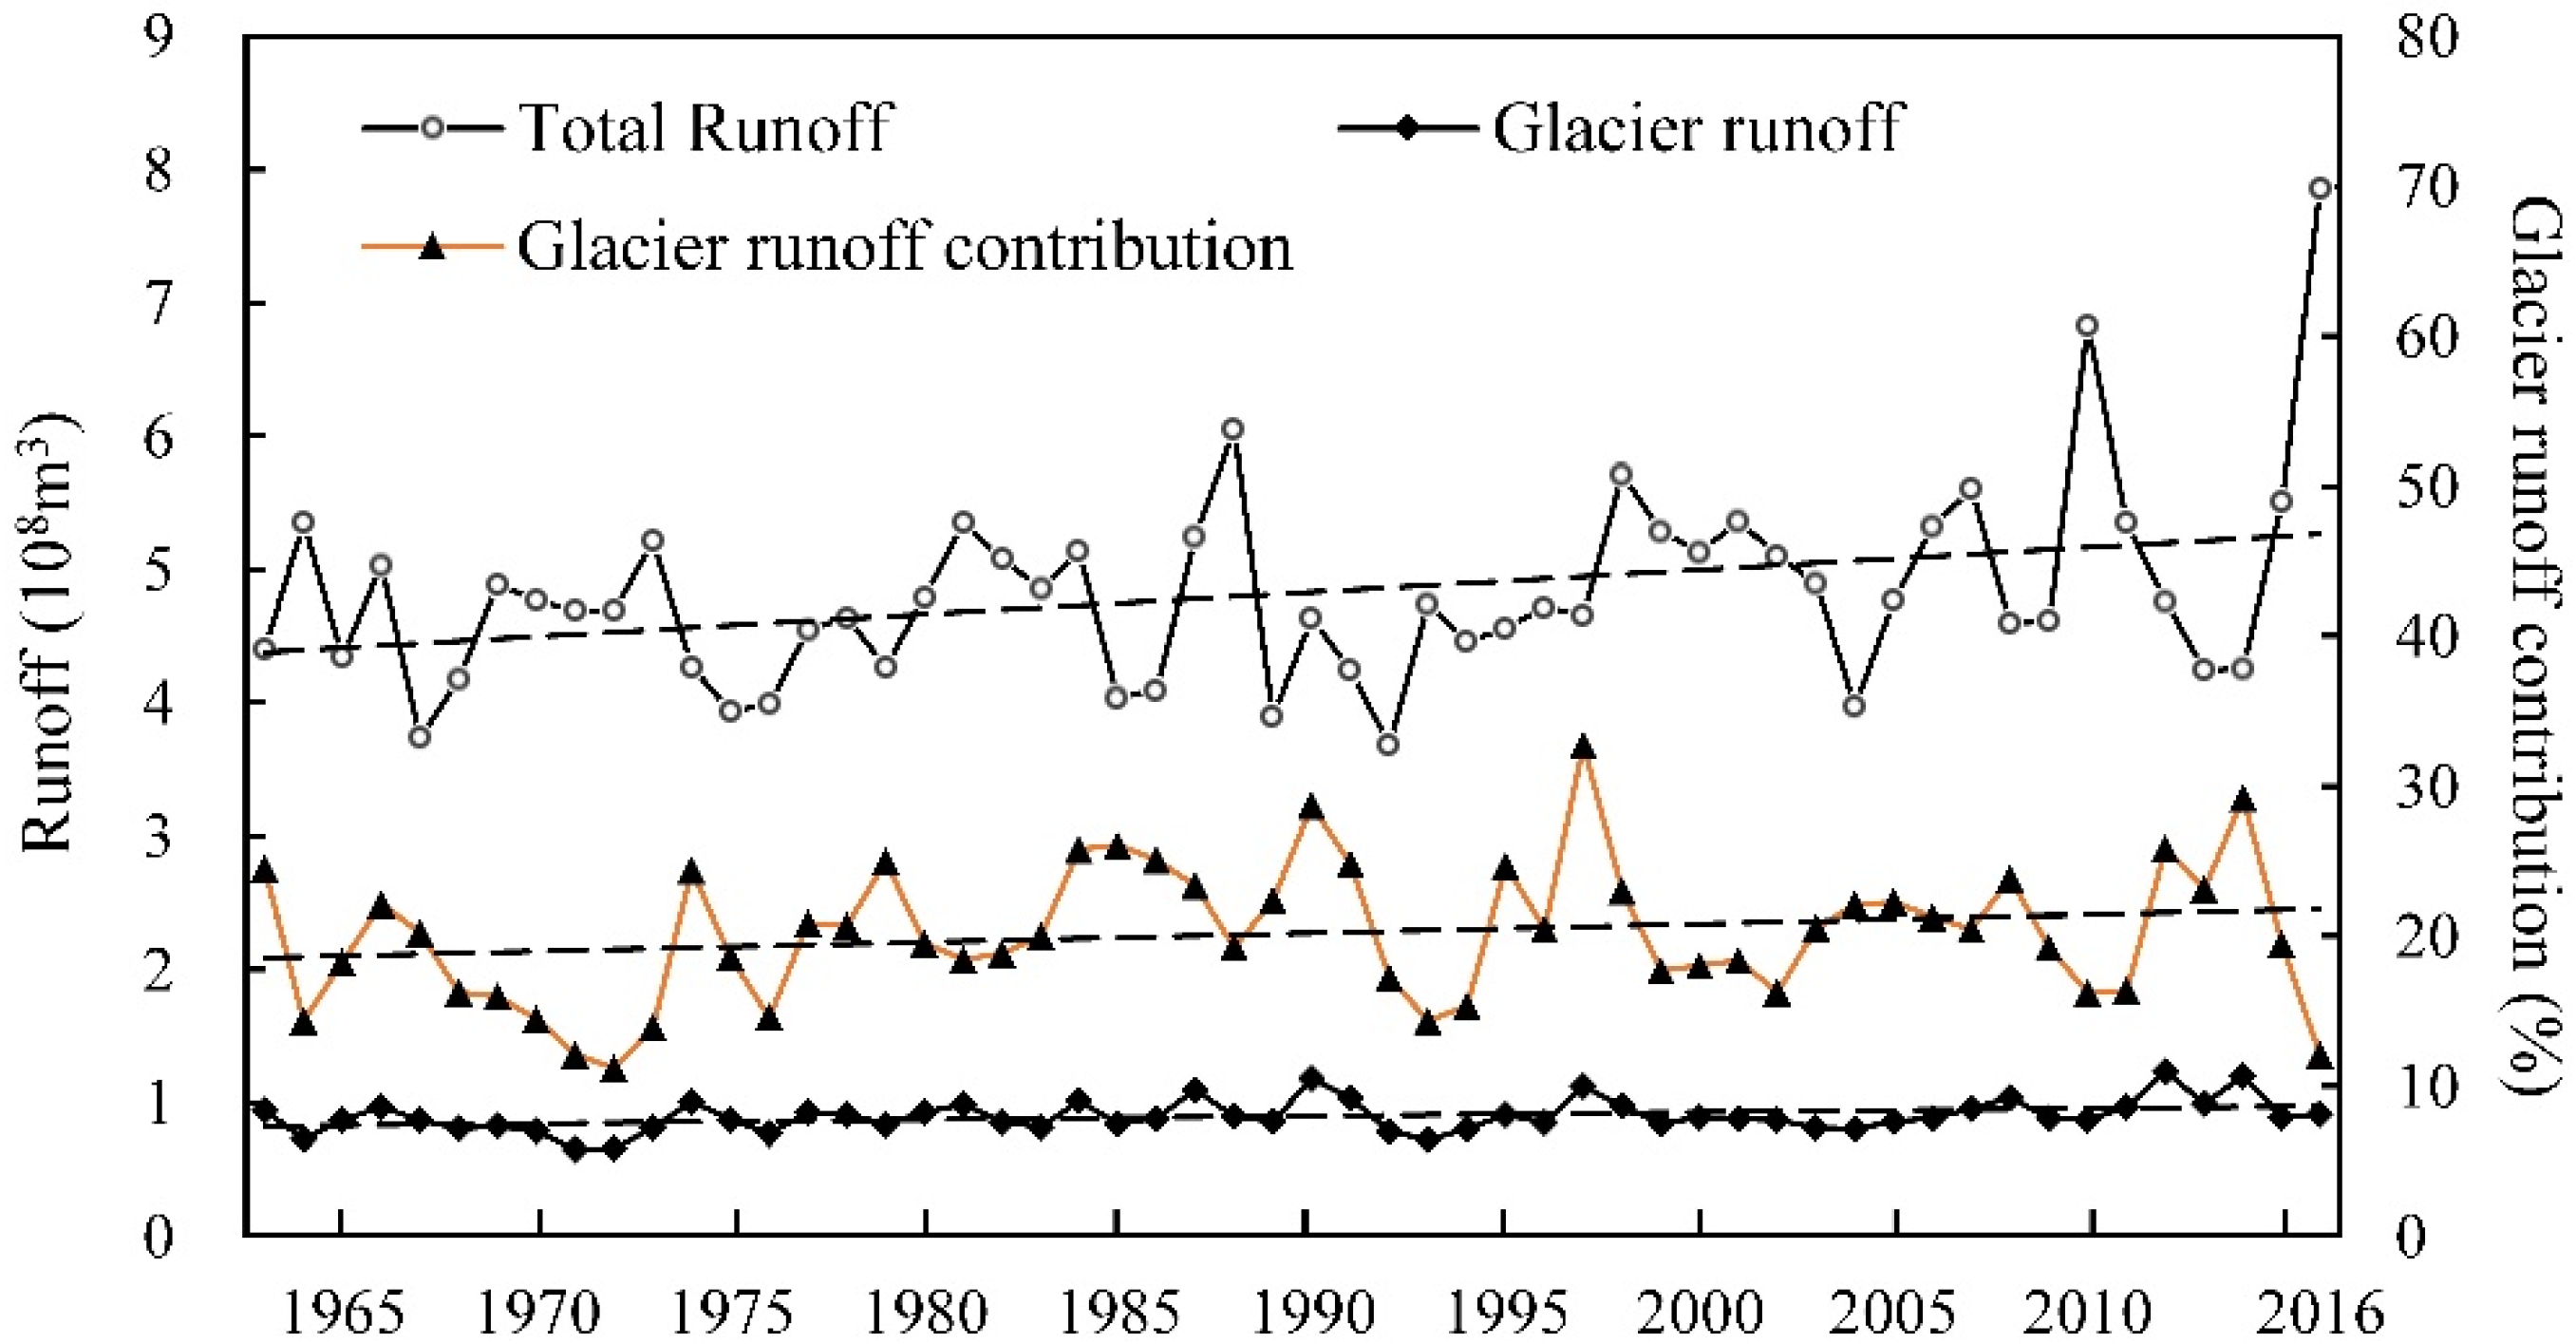
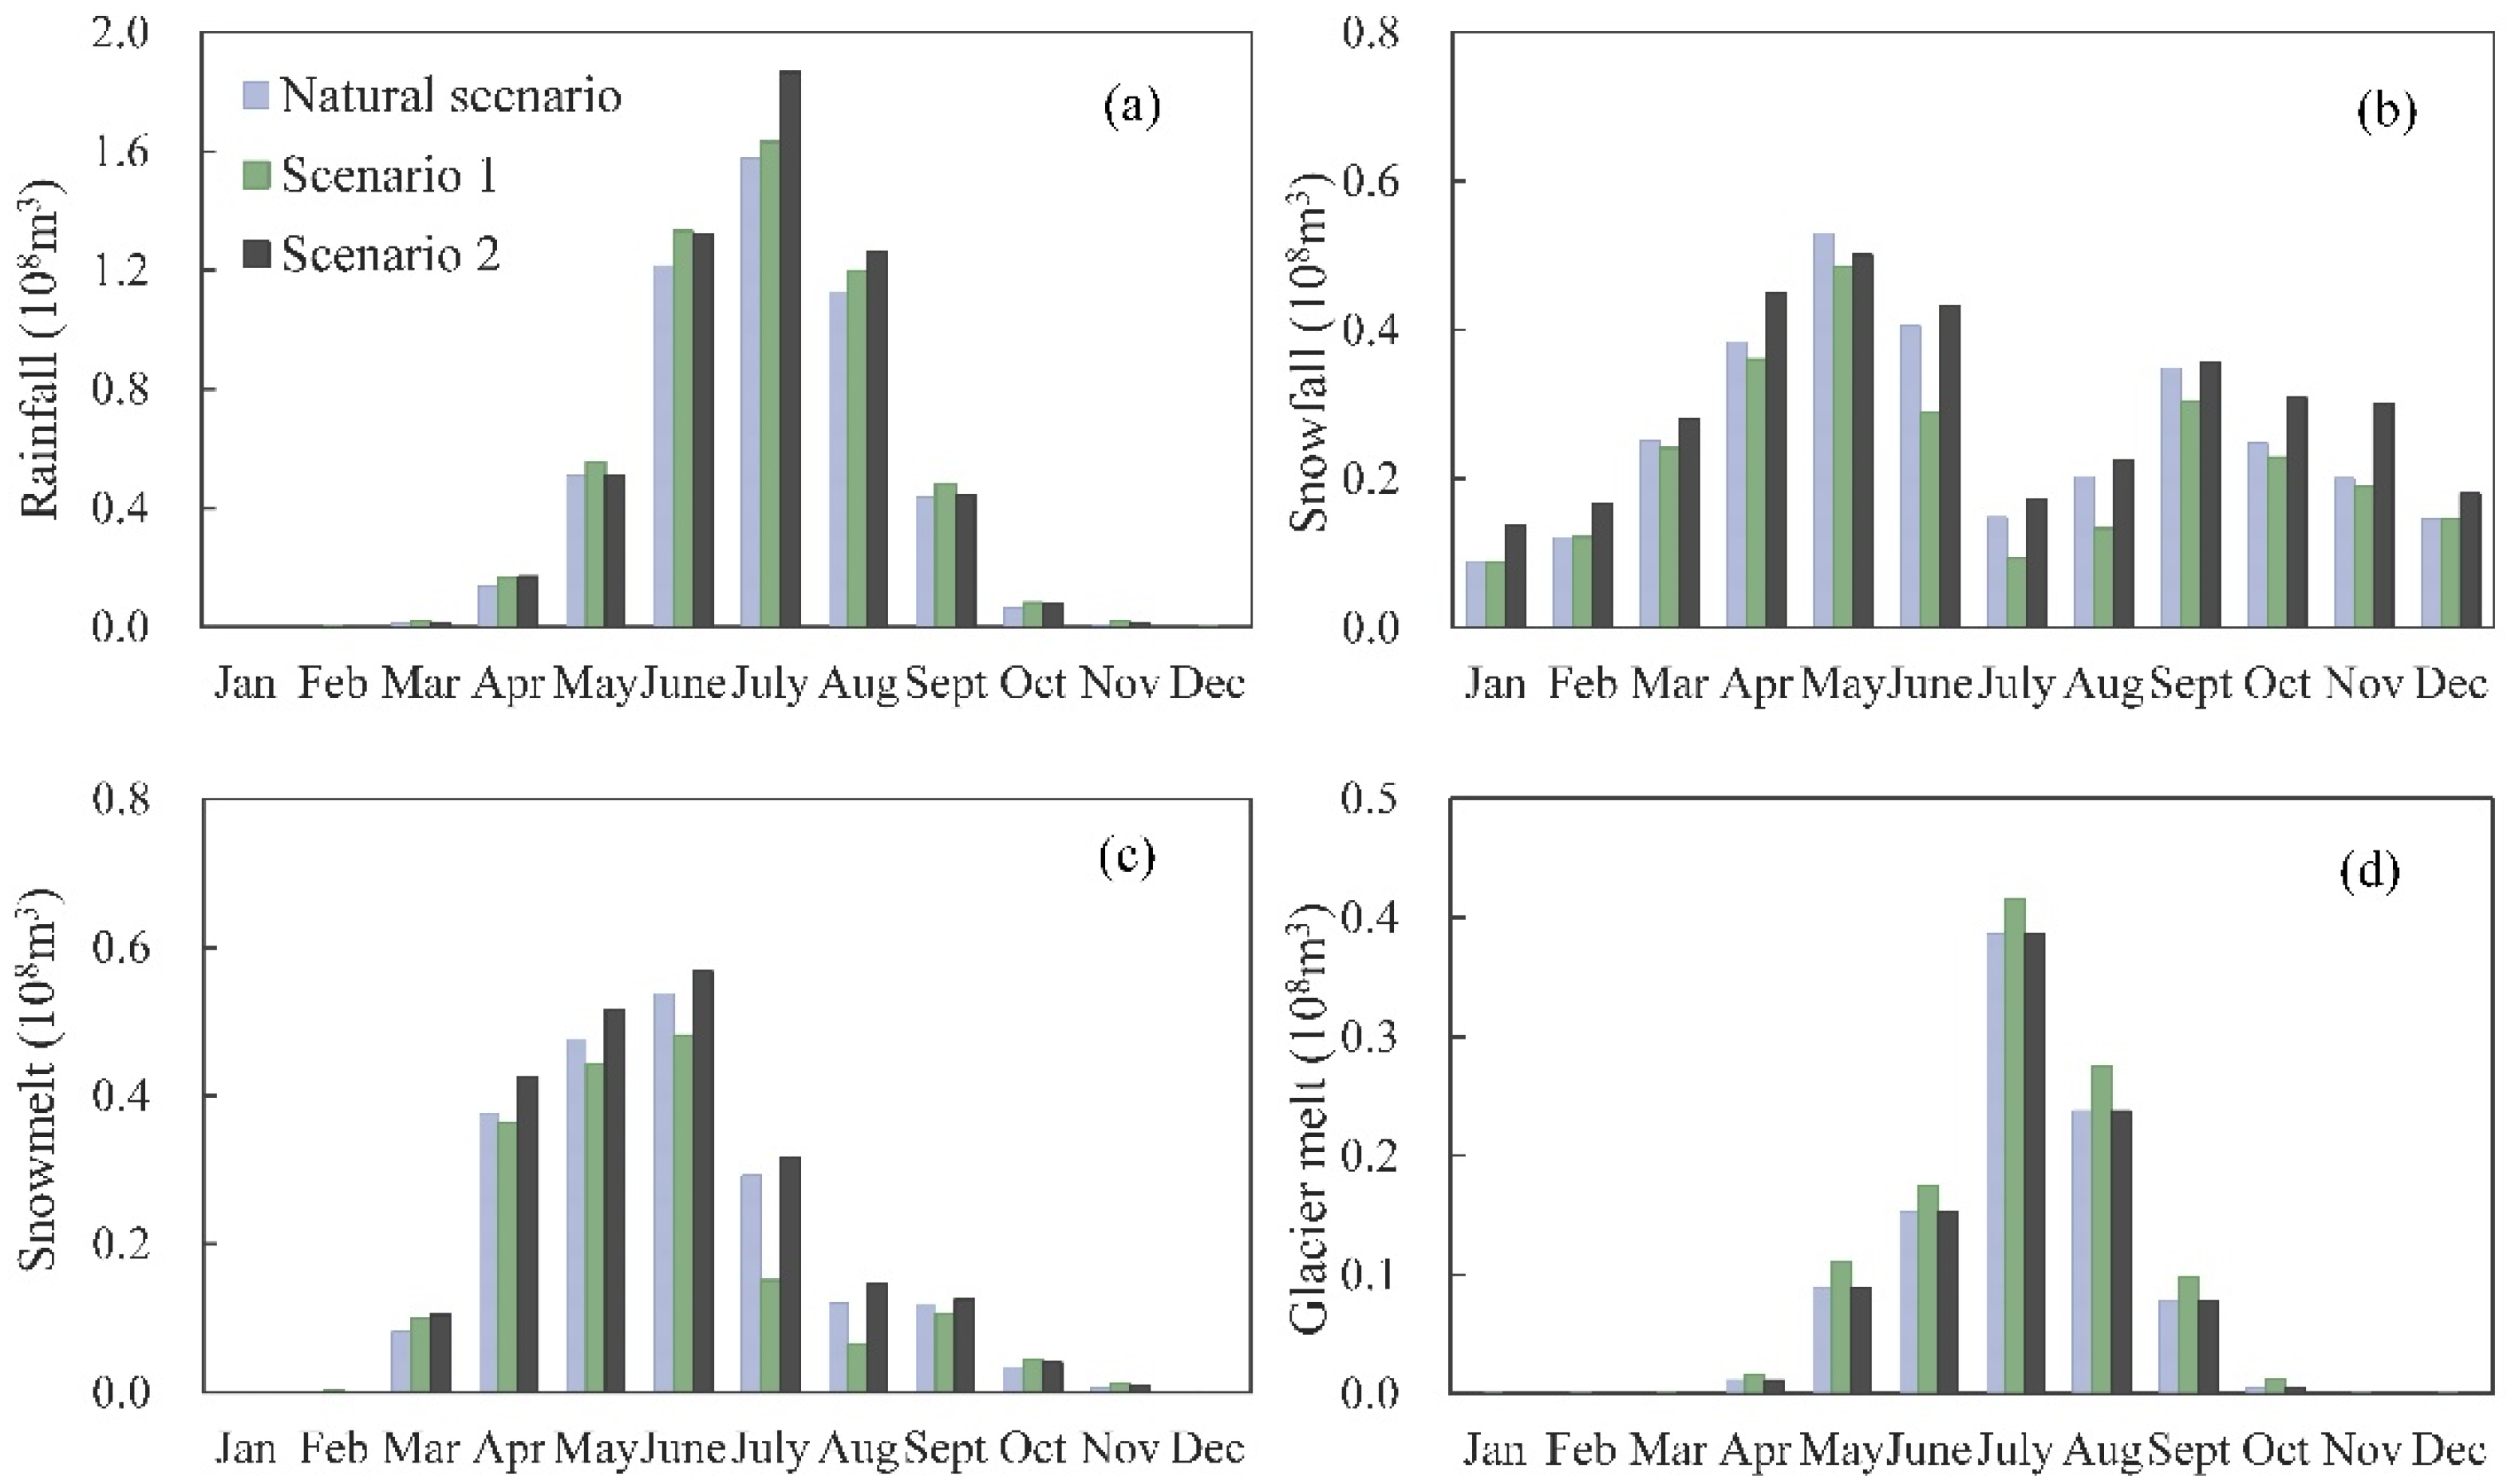
- From 1963 to 2016, the mountain river showed an increasing trend; in particular, a significant increase in runoff of 13.3% was seen in the last 20 years, −1.8% of which was caused by temperature rises and 17.7% by an increase in precipitation. Specifically, with temperatures rising, glacier runoff increased by 14.6%, and snowmelt decreased by 13.5%. Increased precipitation had a negligible effect on glacier melt but provided a larger snow water equivalent, resulting in a 10.1% increase in snowmelt from April to August.
- (3)
- The RCM projections indicated that the warming and humidification phenomenon in the JRB will continue at least through to the mid-21st century. Under the RCP4.5 (RCP8.5) scenario, the annual mean temperature is projected to increase by 0.42 (0.53) °C/10a, precipitation by 11.0 (12.2) mm/10a, total runoff by 13.96 (23.82) mm/10a, and glacier runoff by 2.55 (6.22) mm/10a.
- (4)
- The glacier runoff contributed 20.2% of streamflow to only 6.2% of the catchment area. The glacier area retreat rate (0.57%/year) in the JRB was higher than that of other catchments in the Tianshan Mountains. There is a need for glacier water resources change adaptation measures to be discussed and implemented, even in catchments with a moderate glacier cover.
Author Contributions
Funding
Acknowledgments
Conflicts of Interest
References
- Chen, Y.N.; Li, Z.; Fang, G.H.; Deng, H.J. Impact of climate change on water resources in the Tianshan Mountians. Cent. Asia Acta Geogr. Sin. 2017, 72, 18–26. [Google Scholar]
- Pritchard, H.D. Asia’s glaciers are a regionally important bufer against drought. Nature 2017, 545, 169–174. [Google Scholar] [CrossRef]
- Jones, P.D.; Lister, D.H.; Osborn, T.J.; Harpham, C.; Salmon, M.; Morice, C.P. Hemispheric and large-scale land-surface air temperature variations: An extensive revision and an update to 2010. J. Geophys. Res. 2012, 117, D05127. [Google Scholar] [CrossRef] [Green Version]
- Li, Z.; Chen, Y.; Li, W.; Deng, H.; Fang, G. Potential impacts of climate change on vegetation dynamics in Central Asia. J. Geophys. Res. Atmos. 2015, 120, 12345–12356. [Google Scholar] [CrossRef]
- Kang, S.C.; Xu, Y.W.; You, Q.L.; Flügel, W.A.; Pepin, N.; Yao, T.D. Review of climate and cryospheric change in the Tibetan Plateau. Environ. Res. Lett. 2010, 5, 015101. [Google Scholar] [CrossRef]
- Shen, Y.P.; Su, H.C.; Wang, G.Y.; Mao, W.Y.; Wang, S.D.; Han, P.; Wang, N.L.; Li, Z.Q. The responses of glaciers and snow cover to climate change in Xinjiang (I): Hydrological effects. Glaciol. Geocryol. 2013, 35, 513–527. [Google Scholar]
- Liu, J.; Long, A.H.; Li, J.; Yu, J.W.; Zhang, J. Analysis on runoff evolution laws and trends of three source-streams of Tarim River in recent 60 years. Water Resour. Hydropower Eng. 2019, 50, 10–17. [Google Scholar]
- Wang, X.; Luo, Y.; Sun, L.; Zhang, Y. Assessing the effects of precipitation and temperature changes on hydrological processes in a glacier-dominated catchment. Hydrol. Process. 2015, 29, 4830–4845. [Google Scholar] [CrossRef]
- Zhao, Q.D.; Ding, Y.J.; Wang, J.; Gao, H.K.; Zhang, S.Q.; Zhao, C.C.; Xu, J.L.; Han, H.D.; Shangguan, D.H. Projecting climate change impacts on hydrological processes on the Tibetan Plateau with model calibration against the glacier inventory data and observed streamflow. J. Hydrol. 2019, 573, 60–81. [Google Scholar] [CrossRef]
- Unger-Shayesteh, K.; Vorogushyn, S.; Farinotti, D.; Gafurov, A.; Duethmann, D.; Mandychev, A.; Merz, B. What do we know about past changes in the water cycle of Central Asian headwaters? A review. Glob. Planet. Chang. 2013, 110, 4–25. [Google Scholar] [CrossRef]
- Li, Z.; Li, K.; Wang, L. Study on recent glacier changes and their impact on water resources in Xinjiang, North western China. Quat. Sci. 2010, 30, 96–106. [Google Scholar]
- Li, Z.H.; Shi, X.G.; Tang, Q.H.; Zhang, Y.Q.; Gao, H.L.; Pan, X.C.; Déry, S.J.; Zhou, P. Partitioning the contributions of glacier melt and precipitation to the 1971-2010 runoff increases in a headwater basin of the Tarim River. J. Hydrol. 2020, 583, 124579. [Google Scholar] [CrossRef]
- Luo, Y.; Arnold, J.; Liu, S.Y.; Wang, X.Y.; Chen, X. Inclusion of glacier processes for distributed hydrological modeling at basin scale with application to a watershed in Tianshan Mountains, Northwest China. J. Hydrol. 2013, 477, 72–85. [Google Scholar] [CrossRef]
- Zhao, Q.D.; Zhao, C.C.; Qin, Y.; Chang, Y.P.; Wang, J. Response of the hydrological processes to climate change in the Muzati River basin with high glacierization, southern slope of Tianshan Mountains. Glaciol. Geocryol. 2020, 42, 1285–1298. [Google Scholar]
- Liu, Y.; Liu, Y.C.; Jiao, K.Q.; Bian, X.H.; Ding, Q.Q. Advances on water resources research in upper reaches of the Urumqi River since 1990. Glaciol. Geocryol. 2019, 41, 958–967. [Google Scholar]
- Stahl, K.; Moore, R. Influence of watershed glacier coverage on summer streamflow in British Columbia, Canada. Water Resour. Res. 2006, 42, W02422. [Google Scholar] [CrossRef]
- Yin, Z.L.; Feng, Q.; Liu, S.Y.; Zou, S.B.; Li, J.; Yang, L.S.; Deo, R.C. The spatial and temporal contribution of glacier runoff to watershed discharge in the Yarkant River Basin, Northwest China. Water 2017, 9, 159. [Google Scholar] [CrossRef] [Green Version]
- Ding, Y.J.; Zhang, S.Q.; Wu, J.K.; Zhao, Q.D.; Li, X.Y.; Qin, J. Recent progress on studies on cryospheric hydrological processes changes in China. Adv. Water Sci. 2020, 31, 690–702. [Google Scholar]
- Yin, Z.L.; Feng, Q.; Liu, S.Y.; Zou, S.B. The application progress of hydrological model in quantifying the contribution of glacier runoff to total watershed runoff. Glaciol. Geocryol. 2016, 38, 248–358. [Google Scholar]
- Gao, X.; Ye, B.S.; Zhang, S.Q.; Qiao, C.J.; Zhang, X.W. Glacier runoff variation and its influence on river runoff during 1961-2006 in the Tarim River Basin, China. Sci. China Earth Sci. 2010, 53, 880–891. [Google Scholar] [CrossRef]
- Marzeion, B.; Jarosch, A.H.; Hofer, M. Past and future sea-level change from the surface mass balance of glaciers. Cryosphere 2012, 6, 1295–1322. [Google Scholar] [CrossRef] [Green Version]
- Schaefli, B.; Hingray, B.; Musy, A. Climate change and hydropower production in the Swiss Alps: Quantification of potential impacts and related modelling uncertainties. Hydrol. Earth Syst. Sci. 2007, 11, 1191–1205. [Google Scholar] [CrossRef]
- Huss, M.; Hock, R. Global-scale hydrological response to future glacier mass loss. Nat. Clim. Chang. 2018, 8, 135–140. [Google Scholar] [CrossRef] [Green Version]
- Stahl, K.; Moore, R.D.; Shea, J.M.; Hutchinson, D.; Cannon, A.J. Coupled modelling of glacier and streamflow response to future climate scenarios. Water Resour. Res. 2008, 44, W06201. [Google Scholar] [CrossRef] [Green Version]
- Jost, G.; Moore, R.D.; Menounos, B.; Wheate, R. Quantifying the contribution of glacier runoff to streamflow in the upper Columbia River Basin, Canada. Hydrol. Earth Syst. Sci. 2012, 16, 849–860. [Google Scholar] [CrossRef] [Green Version]
- Huss, M. Present and future contribution of glacier storage change to runoff from macroscale drainage basins in Europe. Water Resour. Res. 2011, 47, W07511. [Google Scholar] [CrossRef] [Green Version]
- Huss, M.; Zemp, M.; Joerg, P.C.; Salzmann, N. High uncertainty in 21st century runoff projections from glacierized basins. J. Hydrol. 2014, 510, 35–48. [Google Scholar] [CrossRef] [Green Version]
- Immerzeel, W.W.; van Beek, L.P.H.; Konz, M.; Shrestha, A.B.; Bierkens, M.F.P. Hydrological response to climate change in a glacierized catchment in the Himalayas. Clim. Chang. 2011, 110, 721–736. [Google Scholar] [CrossRef] [Green Version]
- Khadka, D.; Babel, M.S.; Shrestha, S.; Tripathi, N.K. Climate change impact on glacier and snow melt and runoff in Tamakoshi basin in the Hindu Kush Himalayan (HKH) region. J. Hydrol. 2014, 511, 49–60. [Google Scholar] [CrossRef]
- Jiao, K.Q.; Ye, B.S.; Han, T.D.; Jing, Z.F.; Yang, H.A. Response of Runoff to Climate Change in the Glacier No.1 at the Headwater of Urumqi River, Tianshan Mountains during 1980–2006. Glaciol. Geocryol. 2011, 33, 606–611. [Google Scholar]
- Kan, B.Y. Study on the Meteorology-Glacier Observations and Hydrological Processes Simulations for the Upstream of Yarkant River Basin; Institute of Tibetan Plateau Research, Chinese Academy of Sciences: Beijing, China, 2017. [Google Scholar]
- Zhao, Q.D.; Ye, B.S.; Ding, Y.J.; Zhang, S.Q.; Yi, S.H.; Wang, J.; Shangguan, D.H.; Zhao, C.C.; Han, H.D. Coupling a glacier melt model to the Variable Infiltration Capacity (VIC) model for hydrological modeling in north-western China. Environ. Earth Sci. 2013, 68, 87–101. [Google Scholar] [CrossRef]
- Grinsted, A. An estimate of global glacier volume. Cryosphere 2013, 7, 141–151. [Google Scholar] [CrossRef] [Green Version]
- Dong, W.; Cui, B.S.; Liu, Z.H.; Zhang, K.J. Relative effects of human activities and climate change on the river runoff in an arid basin in Northwest China. Hydrol. Process. 2014, 28, 4854–4864. [Google Scholar] [CrossRef]
- Zhao, Y.F.; Zhu, J. Assessing Quality of Grid Daily Precipitation Datasets in China in Recent 50 Years. Plateau Meteorol. 2015, 34, 50–58. [Google Scholar]
- Liu, W.F.; Xu, Z.X.; Li, F.P.; Zhang, L.Y.; Zhao, J.; Yang, H. Impacts of climate change on hydrological processes in the Tibetan Plateau: A case study in the Lhasa River basin. Stoch. Environ. Res. Risk Assess. 2015, 29, 1809–1822. [Google Scholar] [CrossRef]
- Ndhlovu, G.Z.; Woyessa, Y.E. Modelling impact of climate change on catchment water balance, Kabompo River in Zambezi River Basin. J. Hydrol.-Reg. Stud. 2020, 27, 100650. [Google Scholar] [CrossRef]
- Yin, Z.L.; Feng, Q.; Yang, L.S.; Deo, R.C.; Adamowski, J.F.; Wen, X.H.; Jia, B.; Si, J.H. Projected spatial patterns in precipitation and air temperature for China’s northwest region derived from high-resolution regional climate models. Int. J. Climatol. 2020, 40, 3922–3941. [Google Scholar] [CrossRef]
- Hong, S.; Park, H.; Cheong, H.; Kim, J.; Koo, M.; Jang, J.; Ham, S.; Hwang, S.; Park, B.; Chang, E.; et al. The Global/Regional Integrated Model System (GRIMs). Asia-Pac. J. Atmos. Sci. 2013, 49, 219–243. [Google Scholar] [CrossRef]
- Cha, D.-H.; Lee, D.-K. Reduction of systematic errors in regional climate simulations of the summer monsoon over East Asia and the western North Pacific by applying the spectral nudging technique. J. Geophys. Res. 2009, 114, D14. [Google Scholar] [CrossRef] [Green Version]
- Skamarock, W.C.; Klemp, J.B.; Dudhia, J.; Gill, D.O.; Barker, D.; Wang, W.; Powers, J.G. A Description of the Advanced Research WRF Version 3. 2008. Available online: https://doi.org/10.13140/RG.2.1.2310.6645 (accessed on 1 September 2021).
- Giorgi, F.; Coppola, E.; Solmon, F.; Giorgi, F.; Coppola, E.; Solmon, F.; Mariotti, L.; Sylla, M.; Bi, X.; Elguindi, N.; et al. RegCM4: Model description and preliminary tests over multiple CORDEX domains. Clim. Res. 2012, 52, 7–29. [Google Scholar] [CrossRef] [Green Version]
- Choi, H. Application of a Land Surface Model Using Remote Sensing Data for High Resolution Simulations of Terrestrial Processes. Remote Sens. 2013, 5, 6838–6856. [Google Scholar] [CrossRef] [Green Version]
- Mehrotra, R.; Sharma, A. Correcting for systematic biases in multiple raw GCM variables across a range of timescales. J. Hydrol. 2015, 520, 214–223. [Google Scholar] [CrossRef]
- Mehrotra, R.; Sharma, A. A multivariate quantile-matching bias correction approach with auto- and cross-dependence across multiple time scales: Implications for downscaling. J. Clim. 2016, 29, 3519–3539. [Google Scholar] [CrossRef]
- Mehrotra, R.; Johnson, F.; Sharma, A. A software toolkit for correcting systematic biases in climate model simulations. Environ. Model. Softw. 2018, 104, 130–152. [Google Scholar] [CrossRef]
- Nyeko, M. Hydrologic Modelling of Data Scarce Basin with SWAT Model: Capabilities and Limitations. Water Resour. Manag. 2015, 29, 81–94. [Google Scholar] [CrossRef]
- Tan, M.L.; Ibrahim, A.L.; Yusop, Z.; Chua, V.P.; Chan, N.W. Climate change impacts under CMIP5 RCP scenarios on water resources of the Kelantan River Basin, Malaysia. Atmos. Res. 2017, 189, 1–10. [Google Scholar] [CrossRef]
- Hock, R. Temperature index melt modelling in mountain areas. J. Hydrol. 2003, 282, 104–115. [Google Scholar] [CrossRef]
- Hock, R.; Jansson, P.; Braun, L.N. Modelling the Response of Mountain Glacier Discharge to Climate Warming. Glob. Chang. Mt. Reg. 2005, 23, 243–252. [Google Scholar]
- Garnier, B.J.; Ohmura, A. A Method of Calculating the Direct Shortwave Radiation Income of Slopes. J. Appl. Meteorol. 1968, 7, 796–800. [Google Scholar] [CrossRef] [Green Version]
- Zhang, Y.; Liu, S.Y.; Xu, J.L.; Shangguan, D.H. Glacier change and glacier runoff variation in the Tuotuo River basin, the source region of Yangtze River in western China. Environ. Geol. 2008, 56, 59–68. [Google Scholar] [CrossRef]
- Chen, J.; Ohmura, A. Estimation of Alpine glacier water resources and their change since the 1870s. IAHS Publ. 1990, 193, 127–135. [Google Scholar]
- Liu, S.Y.; Sun, W.X.; Shen, Y.P.; Li, G. Glacier changes since the Little Ice Age maximum in the western Qilian Shan, Northwest China, and consequences of glacier runoff for water supply. J. Glaciol. 2003, 49, 117–124. [Google Scholar]
- Jimeno-Sáez, P.; Senent-Aparicio, J.; Pérez-Sánchez, J.; Pulido-Velazquez, D. A comparison of SWAT and ANN models for daily runoff simulation in different climatic zones of Peninsular Spain. Water 2018, 10, 192. [Google Scholar] [CrossRef] [Green Version]
- Moriasi, D.N.; Arnold, J.G.; Van Liew, M.W.; Bingner, R.L.; Harmel, R.D.; Veith, T.L. Model evaluation guidelines for systematic quantification of accuracy in watershed simulations. Trans. ASABE 2007, 50, 885–900. [Google Scholar] [CrossRef]
- Lutz, A.F.; Immerzeel, W.W.; Shrestha, A.B.; Bierkens, M.F.P. Consistent increase in High Asia’s runoff due to increasing glacier melt and precipitation. Nat. Clim. Chang. 2014, 4, 587–592. [Google Scholar] [CrossRef] [Green Version]
- Wang, L.; Li, Z.Q.; Wang, F.T.; Edwards, R. Glacier shrinkage in the Ebinur lake basin, Tien Shan, China, during the past 40 years. J. Glaciol. 2014, 60, 245–254. [Google Scholar] [CrossRef] [Green Version]
- Yao, J.Q.; Liu, Z.H.; Yang, Q.; Meng, X.Y.; Li, C.Z. Responses of runoff to climate change and human activities in the Ebinur Lake Catchment, western China. Water Resour. 2014, 41, 738–747. [Google Scholar] [CrossRef]
- Zhang, L.M.; Zhao, G.J.; Mu, X.M.; Gao, P.; Sun, W.Y. Attribution of runoff variation in the Wei River basin based on the Budyko hypothesis. Acta Ecol. Sin. 2018, 38, 7607–7617. [Google Scholar]
- Wilby, R.L.; Dawson, C.W.; Barrow, E.M. SDSM-a decision support tool for the assessment of regional climate change impacts. Environ. Model. Softw. 2002, 17, 147–159. [Google Scholar] [CrossRef]
- Tarnavsky, E.; Mulligan, M.; Ouessar, M.; Faye, A.; Black, E. Dynamic Hydrological Modeling in Drylands with TRMM Based Rainfall. Remote Sens. 2013, 5, 6691–6716. [Google Scholar] [CrossRef] [Green Version]
- Wang, X.; Luo, Y.; Sun, L.; Shafeeque, M. Different climate factors contributing for runoff increases in the high glacierized tributaries of Tarim River Basin, China. J. Hydrol.-Reg. Stud. 2021, 36, 100845. [Google Scholar] [CrossRef]
- Kan, B.Y.; Su, F.G.; Xu, B.Q.; Xie, Y.; Li, J.L.; Zhang, H.B. Generation of High Mountain Precipitation and Temperature Data for a Quantitative Assessment of Flow Regime in the Upper Yarkant Basin in the Karakoram. J. Geophys. Res.-Atmos. 2018, 123, 8462–8486. [Google Scholar] [CrossRef]
- Teng, J.; Vaze, J.; Chiew, F.H.S.; Wang, B.; Perraud, J. Estimating the Relative Uncertainties Sourced from GCMs and Hydrological Models in Modeling Climate Change Impact on Runoff. J. Hydrometeorol. 2012, 13, 122–139. [Google Scholar] [CrossRef]
- Chiew, F.H.S.; Teng, J.; Vaze, J.; Post, D.A.; Perraud, J.M.; Kirono, D.G.C.; Viney, N.R. Estimating climate change impact on runoff across southeast Australia: Method, results, and implications of the modeling method. Water Resour. Res. 2009, 45, W10414. [Google Scholar] [CrossRef]
- Gan, R.; Luo, Y.; Zuo, Q.T.; Sun, L. Effects of projected climate change on the glacier and runoff generation in the Naryn River Basin, Central Asia. J. Hydrol. 2015, 523, 240–251. [Google Scholar] [CrossRef]
- Prasch, M.; Mauser, W.; Weber, M. Quantifying present and future glacier melt-water contribution to runoff in a central Himalayan river basin. Cryosphere 2013, 7, 889–904. [Google Scholar] [CrossRef] [Green Version]
- Immerzeel, W.W.; van Beek, L.P.H.; Bierkens, M.F.P. Climate change will affect the Asian water towers. Science 2010, 328, 1382–1385. [Google Scholar] [CrossRef]
- Su, F.; Zhang, L.; Qu, T.; Chen, D.; Yao, T.; Tong, K.; Qi, Y. Hydrological response to future climate changes for the major upstream river basins in the Tibetan Plateau. Glob. Planet. Chang. 2016, 136, 82–95. [Google Scholar] [CrossRef]
- Rees, H.G.; Collins, D.N. Regional differences in response of flow in glacier-fed Himalayan rivers to climatic warming. Hydrol. Process. 2006, 20, 2157–2169. [Google Scholar] [CrossRef]
- Su, X.M. Effect of Water Supply and Demand Changes in Ebinur Lake Basin to the Lake Area; Xinjiang University: Xinjiang, China, 2016. [Google Scholar]
- Liu, W.J.; Zhang, P.; Li, L.H.; Feng, Z.M. Analysis on the Factors Affecting the Change of the Ebinur Lake Area. Arid Zone Res. 2010, 27, 64–68. [Google Scholar] [CrossRef]
- Wang, Y.J.; Qin, D.H. Influence of Climate Change and Human Activity on Water Resources in Arid Region of Northwest China: An Overview. Adv. Clim. Chang. Res. 2017, 13, 483–493. [Google Scholar] [CrossRef]
- Gao, H.K.; Feng, Z.J.; Zhang, T.; Wang, Y.Z.; He, X.; Li, H.; Pan, X.C.; Ren, Z.; Chen, X.; Zhang, W.X.; et al. Assessing glacier retreat and its impact on water resources in a headwater of Yangtze River based on CMIP6 projections. Sci. Total Environ. 2021, 765, 142774. [Google Scholar] [CrossRef] [PubMed]
- Chen, Y.N.; Li, Z.; Fan, Y.T.; Wang, H.J.; Fang, G.H. Research progress on the impact of climate change on water resources in the arid region of Northwest China. Acta Geogr. Sin. 2014, 69, 1295–1304. [Google Scholar]


| Model Name | Spatial Resolution | Time Series | Institute | Published Time |
|---|---|---|---|---|
| YSU-RCM [39] | 50 km | 1980–2050 | Yonsei University | 2013 |
| SNU-MM5 [40] | 50 km | 1979–2049 | Seoul National University | 2009 |
| SNU-WRF [41] | 50 km | 1979–2049 | Seoul National University | 2008 |
| RegCM4 [42] | 50 km | 1979–2050 | Kongju National University | 2012 |
| Parameters | Units | Chosen Value | Definitions |
|---|---|---|---|
| ALPHA_BF | days | 0.01 | Baseflow alpha factor |
| CN2 | — | 40.00 | Initial SCS runoff curve number for moisture condition II |
| LAT_TIME | days | 22.00 | Lateral flow travel time |
| ESCO | — | 0.10 | Soil evaporation compensation factor |
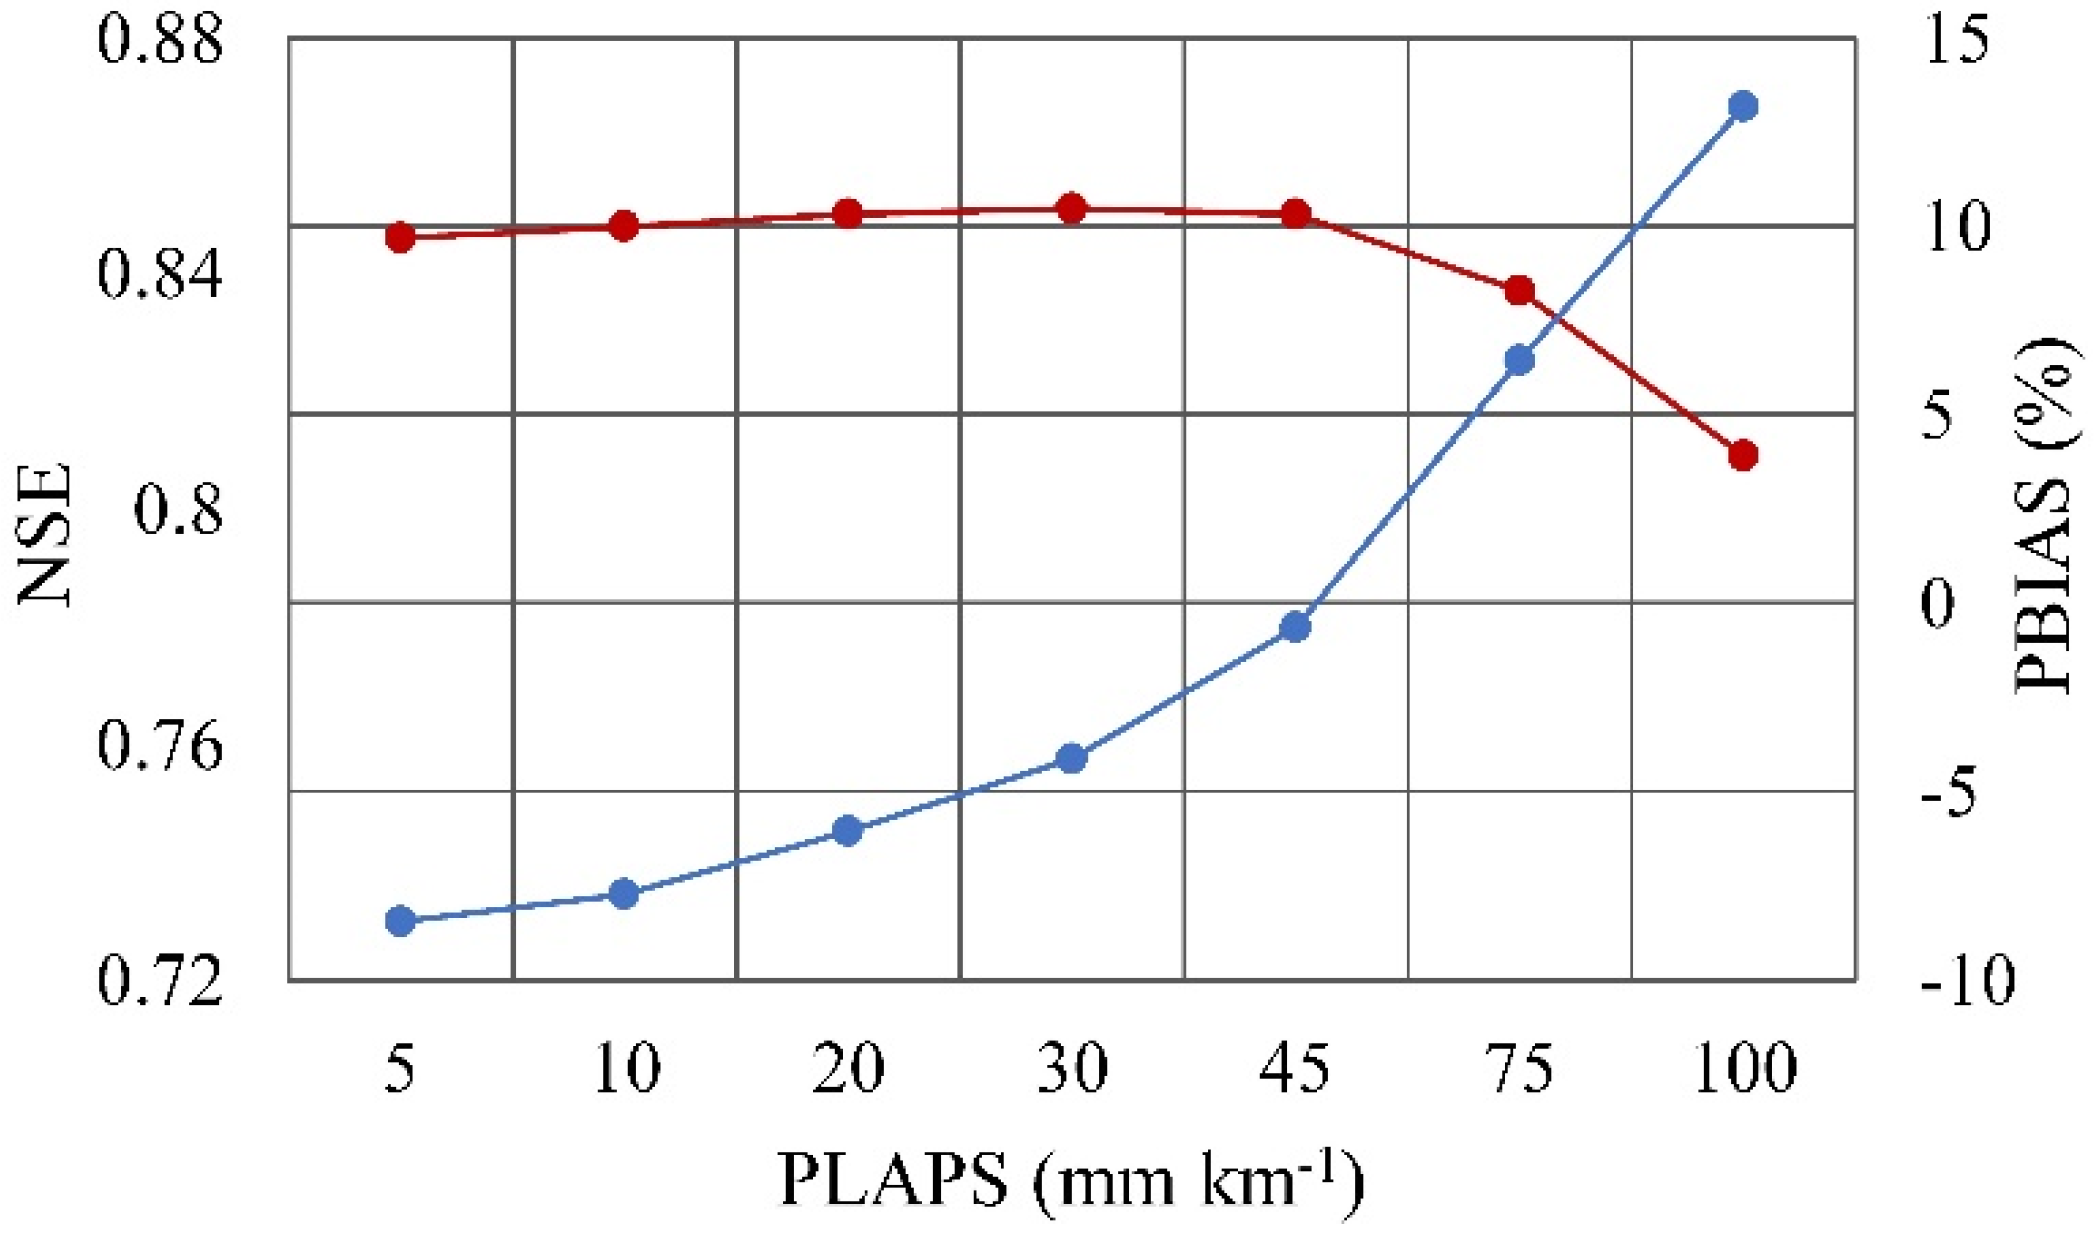
| PLAPS | mm km−1 | 44.50 | Precipitation lapse rate |
| TLAPS | °C km−1 | −4.10 | Temperature lapse rate |
| SMFMX | mm °C−1 d−1 | 2.00 | Melt factor for snow, 21 June |
| SMFMN | mm °C−1 d−1 | 1.00 | Melt factor for snow, 21 December |
| SFTMP | °C | 2.00 | Snowfall temperature |
| SMTMP | °C | 1.50 | Snowmelt base temperature |
| Bgmlt,12 | mm °C−1 d−1 | 12.00 | Glacier melt degree-day factor, 21 December |
| Bgmlt,6 | mm °C−1 d−1 | 5.50 | Glacier melt degree-day factor, 21 June |
| gmlt_tmp | °C | 0.50 | Glacier melt base temperature |
| Calibration Period | Validation Period | Period 1 | |||||||
|---|---|---|---|---|---|---|---|---|---|
| NSE | PBIAS | R2 | NSE | PBIAS | R2 | NSE | PBIAS | R2 | |
| The GE-SWAT model | 0.84 | 7.6% | 0.89 | 0.84 | −3.7% | 0.86 | 0.85 | −0.7% | 0.87 |
| Traditional SWAT model | 0.83 | −11.1% | 0.84 | 0.72 | −23.7% | 0.81 | 0.77 | −19.7% | 0.81 |
| Season | Runoff (mm/10a) | Glacier Runoff (mm/10a) | Precipitation (mm/10a) | Temperature (°C /10a) |
|---|---|---|---|---|
| Spring | 0.30 | 0.00 | 3.21 * | 0.27 |
| Summer | 4.33 * | 1.48 | 1.76 | 0.24 * |
| Autumn | 4.56 | 2.50 | 5.06 | 0.30 * |
| Winter | 2.37 * | 0.31 * | 5.33 * | 0.26 * |
| Year | 11.56 * | 4.29 * | 15.36 * | 0.27 * |
| Factor Contribution | Qtot | Qlucc | Qcl | Qt | Qp |
|---|---|---|---|---|---|
| in mm | 41.75 | −9.86 | 51.61 | −5.72 | 57.33 |
| in % | 13.3 | −2.6 | 15.9 | −1.8 | 17.7 |
| Temperature (°C) | Precipitation (%) | |||||
|---|---|---|---|---|---|---|
| 2020s | 2030s | 2040s | 2020s | 2030s | 2040s | |
| RCP4.5 | 1.80 | 2.49 | 2.36 | 6.45 | 8.88 | 10.43 |
| RCP8.5 | 2.59 | 3.11 | 3.07 | 10.49 | 6.23 | 14.48 |
Publisher’s Note: MDPI stays neutral with regard to jurisdictional claims in published maps and institutional affiliations. |
© 2022 by the authors. Licensee MDPI, Basel, Switzerland. This article is an open access article distributed under the terms and conditions of the Creative Commons Attribution (CC BY) license (https://creativecommons.org/licenses/by/4.0/).
Share and Cite
Liu, J.; Long, A.; Deng, X.; Yin, Z.; Deng, M.; An, Q.; Gu, X.; Li, S.; Liu, G. The Impact of Climate Change on Hydrological Processes of the Glacierized Watershed and Projections. Remote Sens. 2022, 14, 1314. https://doi.org/10.3390/rs14061314
Liu J, Long A, Deng X, Yin Z, Deng M, An Q, Gu X, Li S, Liu G. The Impact of Climate Change on Hydrological Processes of the Glacierized Watershed and Projections. Remote Sensing. 2022; 14(6):1314. https://doi.org/10.3390/rs14061314
Chicago/Turabian StyleLiu, Jing, Aihua Long, Xiaoya Deng, Zhenliang Yin, Mingjiang Deng, Qiang An, Xinchen Gu, Shuoyang Li, and Guihua Liu. 2022. "The Impact of Climate Change on Hydrological Processes of the Glacierized Watershed and Projections" Remote Sensing 14, no. 6: 1314. https://doi.org/10.3390/rs14061314
APA StyleLiu, J., Long, A., Deng, X., Yin, Z., Deng, M., An, Q., Gu, X., Li, S., & Liu, G. (2022). The Impact of Climate Change on Hydrological Processes of the Glacierized Watershed and Projections. Remote Sensing, 14(6), 1314. https://doi.org/10.3390/rs14061314