Article

Long-Term Trends and Interannual Variability of Wind Forcing, Surface Circulation, and Temperature around the Sub-Antarctic Prince Edward Islands

1
Marine Research Institute, Department of Oceanography, University of Cape Town, Private Bag X3, Rondebosch, Cape Town 7701, South Africa
2
Nansen-Tutu Centre for Marine Environmental Research, University of Cape Town, Private Bag X3, Rondebosch, Cape Town 7701, South Africa
3
Oceans & Coasts Research, Department of Forestry, Fisheries, and the Environment, P.O. Box 52126, V&A Waterfront, Cape Town 8000, South Africa
4
Bayworld Centre for Research and Education, 5 Riesling Road, Constantia, Cape Town 7806, South Africa
*
Author to whom correspondence should be addressed.
Remote Sens. 2022, 14(6), 1318; https://doi.org/10.3390/rs14061318
Submission received: 31 January 2022 / Revised: 2 March 2022 / Accepted: 4 March 2022 / Published: 9 March 2022
(This article belongs to the Special Issue Remote Sensing Application in Coastal Geomorphology and Processes)

Abstract

:
In the Southern Ocean, the sub-Antarctic Prince Edward Islands (PEIs) play a significant ecological role by hosting large populations of seasonally breeding marine mammals and seabirds, which are particularly sensitive to changes in the surrounding ocean environment. In order to better understand climate variability at the PEIs, this study used satellite and reanalysis data to examine the interannual variability and longer-term trends of Sea Surface Temperature (SST), wind forcing, and surface circulation. Long-term trends were mostly weak and statistically insignificant, possibly due to the restricted length of the data products. While seasonal fluctuations accounted for a substantial portion (50–70%) of SST variability, the strongest variance in wind speed, wind stress curl (WSC), and currents occurred at intra-annual time scales. At a period of about 1 year, SST and geostrophic current variability suggested some influence of the Southern Annular Mode, but correlations were weak and insignificant. Similarly, correlations with El Niño Southern Oscillation variability were also weak and mostly insignificant, probably due to strong local and regional modification of SST, wind, and current anomalies. Significant interannual and decadal-scale variability in SST, WSC, and geostrophic currents, strongest at periods of 3–4 and 7–8 years, corresponded with the variability of the Antarctic Circumpolar Wave. At decadal time scales, there was a strong inverse relationship between SST and geostrophic currents and between SST and wind speed. Warmer-than-usual SST between 1990–2001 and 2009–2020 was related to weaker currents and wind, while cooler-than-usual periods during 1982–1990 and 2001–2009 were associated with relatively stronger winds and currents. Positioned directly in the path of passing atmospheric low-pressure systems and the Antarctic Circumpolar Current, the PEIs experience substantial local and regional atmospheric and oceanic variability at shorter temporal scales, which likely mutes longer-term variations that have been observed elsewhere in the Southern Ocean.

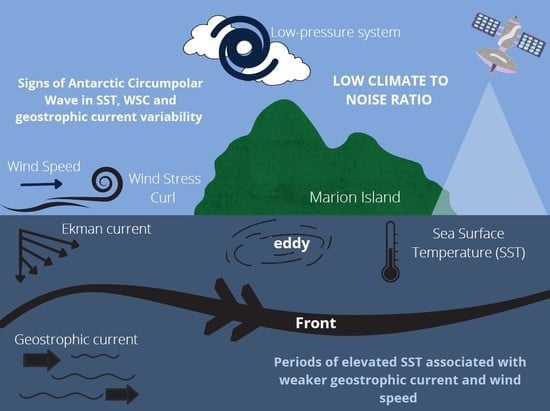
Graphical Abstract

1. Introduction

With the increase in anthropogenic greenhouse gases in the atmosphere, the world’s ocean, especially the cold Southern Ocean, has been experiencing some major variations in physical conditions [1]. The most commonly known impact of the rise in greenhouse gases is the depletion of the ozone layer above the Southern Ocean, which has led to the poleward shift and strengthening of the westerly winds, reflected by the positive trend of the Southern Annular Mode (SAM) [2,3,4,5]. Another impact of the rise in anthropogenic greenhouse gases is the gradual warming of the Southern Ocean due to its effective heat uptake ability [6]. North of the sub-Antarctic Front (SAF; 45°S–55°S), a gradual warming (~0.1 to 0.2 °C/decade) of the surface waters has been recorded, while south of the SAF (55°S–65°S), a more delayed warming of ~0.1 °C/decade has been documented [6]. The delayed warming in the south is related to the poleward strengthening of the westerly wind belt, which has been shown to amplify the Ekman-driven upwelling of the North Atlantic Deep Water along 70°S [7]. Anthropogenic and natural changes, thus, vary regionally across the Southern Ocean causing substantial ecosystem changes, which are particularly striking at sub-Antarctic islands [8,9].
The Prince Edward Islands (PEIs) are a sub-Antarctic island ecosystem situated in the Indian Ocean segment of the Southern Ocean, about 2000 km south-east of South Africa (46°50′S; 37°50′E, Figure 1). The archipelago is located in the Polar Frontal Zone, between the SAF and the Antarctic Polar Front (APF) (Figure 1) [10]. Marion Island (290 km2), and the smaller Prince Edward Island (44 km2), were annexed by South Africa in 1948 and were established as a Special Nature Reserve in 1995, and declared a Marine Protected Area in 2013 [9]. To the southwest of the islands, the South West Indian Ridge (SWIR) forces the SAF and APF to converge through the Andrew Bain Fracture Zone (ABFZ), resulting in an increase in current speed, frontal meandering, and eddy occurrence downstream of the SWIR (Figure 1) [10,11]. These eddies have been shown to travel toward the PEI region [10,11], and although very few interact directly with the island shelf [12,13], they do contribute to creating ideal foraging grounds for the top predators that seasonally breed on the PEIs [14,15]. This means that biological communities residing on the islands are likely to be highly sensitive to any changes taking place in the neighboring ocean environment.
The PEI ecosystem has experienced dramatic shifts due to climate change in the last few decades. It has been proposed that the long-term southward migration of the SAF in the region has induced a decline in phytoplankton blooms on the island shelf, eventually causing declines in the penguin population [16,17,18]. On the other hand, the albatross and seal populations, which feed along the fronts, are thought to have benefitted from their foraging environment being located closer to their breeding grounds [19]. Obtaining a clear understanding of the long-term impacts of climate change on the ocean regions surrounding the PEIs is thus critical to understanding and predicting the long-term variations in biological communities and ecosystem health of the islands.
Although valuable atmospheric and oceanographic data have been recorded on Marion Island since the 1950s, these data exist only as single point observations [20,21,22,23,24]. Studies using these observations have found a long-term increase in Sea Surface Temperature (SST) and air temperature, a decrease in rainfall and wind speed, and a rise in sunshine hours at the PEIs [20,22,23,24,25,26]. In comparison, data collections in the surrounding ocean region have been limited, both spatially and temporally, to specific research cruises during austral autumn or summer [27]. Since 2014, water column currents and bottom temperature have been observed daily at two locations on the inter-island shelf [28], but this record is still too short to clearly identify long-term trends.
In contrast, satellite and reanalysis products provide a more consistent and long-term data record with a broader spatial coverage that can be used to compare climate variability at the PEIs with that across the rest of the Southern Ocean. A recent investigation used satellite and reanalysis data to characterize the local scale seasonal variations in surface hydrography around the islands, providing a useful baseline against which interannual and long-term changes can be assessed [29]. Here, following on from the study by [30], we expand upon previous research [29] by using satellite and reanalysis data to investigate the long-term trends and interannual variability of the surface temperature, wind forcing, and circulation at the PEIs.

2. Materials and Methods

2.1. Data Product Information

Similar to [30], we used the National Centers for the Environmental Information (NCEI) global Level 4 SST product [31,32], produced by the Group for High Resolution Sea Surface Temperature (GHRSST), and distributed by the Physical Oceanography Distributed Active Archive Center (PO.DAAC, http://podaac.jpl.nasa.gov, accessed on 2 September 2021). This product was generated by the optimum interpolation of SST from different infra-red satellite sensors, as well as in situ observations, to produce a gridded and gap-free 0.25°Spatial resolution product [31]. Infra-red satellite SST measurements are more reliable in clear sky conditions as they are unable to penetrate through clouds. Since the Southern Ocean is an area of relatively high cloud coverage, the use of infra-red sensors can be quite limited, resulting in large data gaps that need to be filled by optimal interpolation. In contrast, the optimally interpolated Remote Sensing Systems (REMSS) SST product uses data from microwave satellite sensors, which are not impacted by cloud cover [33]. A strong correlation of 0.979 at the 99% confidence interval, between REMSS and GHRSST (Figure S1 from Supplementary Materials) gave confidence that the optimal interpolation of infra-red satellite data did not negatively impact the patterns observed from the GHRSST data. Since the REMSS SST is only available from 1998, and REMSS coverage extends south of 40°S only from June 2002 [33], we selected the GHRSST, available from 1982, for further analysis.
We also compared the performance of the GHRSST at the PEIs to the daily recorded South African Weather Service (SAWS) SST data at Marion Island. In agreement with [24], a strong, significant correlation of 0.954 was observed at the 99% confidence interval (Figure S2a), giving credence to the suitability of the reanalysis data at the PEIs. Thus, we used monthly averages, computed from daily reanalysis SST data between January 1982 and December 2020, to determine long-term trends and examine the interannual variations.
ERA5 reanalysis wind speed is produced by the European Centre for Medium-Range Weather Forecasts (ECMWF), at a spatial resolution of 0.25° [34]. The daily zonal (Uwind) and meridional (Vwind) wind speed components at a pressure level of 1000 hPa, between January 1979 and December 2020 were obtained from https://cds.climate.copernicus.eu/cdsapp#!/dataset/reanalysis-era5-pressurelevels?tab=overview (accessed on 5 September 2021). ERA5 wind speeds were compared against the daily in situ wind speed data from Marion Island (Figure S2b). There was good agreement between the two datasets, with a significant correlation of 0.514 at the 99% confidence interval (Figure S2b), in agreement with the findings of [24]. However, ERA5 wind speeds were generally larger than the in situ wind speeds. This is likely due to the in situ data, recorded on the lee side of Marion Island, being influenced by the island orography, which causes a reduction in wind speed. Nonetheless, the good correlation (Figure S2b) gives confidence that the coarser resolution ERA5 reanalysis wind speeds adequately represent the observed wind variability at the PEIs. Thus, the daily ERA5 data were used to compute wind stress curl (WSC) according to [35,36], and calculate monthly averages of wind speed for further analysis.
The surface ocean circulation was described using geostrophic and Ekman current speed data obtained from the 0.25°Spatial resolution multi-mission GlobCurrent v3.0 (http://globcurrent.ifremer.fr, accessed on 1 September 2021). While these data are available between 1 January 1993 and 15 May 2017, we opted to use only complete years between 1993 and 2016 for our analyses. Daily data were used to generate monthly averages. The zonal (Ugeos) and meridional (Vgeos) components of the geostrophic current are derived from the combination of altimetry sea-level anomalies and mean dynamic topography [37]. The zonal (Uekm) and meridional (Vekm) components of the wind-driven Ekman current at the surface were estimated using an empirical method applied to atmospheric circulation wind models, including data from Argo floats and surface drifters. A more detailed description of the derivation of these reanalysis data can be found in [37]. Given the relatively short length of the GlobCurrent dataset, we also examined the DUACS DT2018 geostrophic current speeds [38] from the Copernicus Marine Environment Monitoring Service (CMEMS; http://marine.copernicus.eu, accessed on 1 September 2021). These data are available over a longer period between 1 January 1993 and 31 December 2020 and were used to derive the long-term mean positions of the branches of the SAF and APF, from optimized sea surface height contours, similar to [28,29,30].

2.2. Data Analysis

Data analyses were performed using Python Software Foundation, Python Language Reference v3.7. Similar to [30], monthly means of SST, wind speed (Rwind), surface geostrophic currents (Rgeos), and surface Ekman currents (Rekm) were extracted and averaged within a 2° × 2° area centered over the PEIs (Figure 1). A linear fit was used to estimate the long-term trends of each parameter. Standardized anomalies of each parameter were calculated by dividing the anomalies (difference between the monthly climatological mean and individual monthly values) by the standard deviation of the respective months to remove the seasonal signal and the influence of any dispersion, similar to [39,40].
A wavelet analysis was applied to the standardized anomalies of each variable to identify low frequency time-dependent amplitudes in the time series. It is widely used in the study of climate signals in SST, air temperature, or precipitation, among other data [41,42]. To perform the Morlet continuous wavelet transforms, the Python software package known as PyWavelet [41] was used, which is based on the wavelet analysis described by [42]. A bias rectification was also included in the wavelet analysis to rectify any potential distortions that could occur if sine waves are present in the time series [43].
The wavelet coherence describes the significant coherence between two concurrent signals even if the common power is low [44]. It makes use of the Pearson correlation to establish the coherence between the continuous wavelet transform of two parameters in a frequency and time domain. The significance level of a wavelet coherence is calculated using the Monte Carlo method. The wavelet coherence also allows for the determination of the phase change between the two parameters. The PyWavelet package [41] was used to calculate the wavelet coherence as defined by [42]. Similar to previous studies [23,40,45,46], spatial maps of the Pearson correlation between the SST, wind speed, and geostrophic current averaged within the 2° × 2° PEI area and each pixel across the global ocean were generated to determine the spatial extent of variations in these parameters.

3. Results

3.1. Seasonal Variations

The seasonal cycle of SST, winds, and currents has been described in detail by [29], for a wider area around the PEIs, and thus here we only provide a brief description of the patterns observed within the averaged 2° × 2° area (Figure 1). The monthly climatology of SST showed a clear seasonality with a peak of 7.24 °C in February and a minimum of 4.67 °C in September (Figure 2a). Since the SST, wind, and geostrophic current products all spanned different lengths of time, we compared the seasonal cycles derived over the full time series (illustrated in black) against those derived over the period (1993–2016) common (illustrated in red) to each parameter (Figure 2). The seasonal SST cycle for a shorter period (1993–2016) showed no significant differences compared to the seasonal cycle derived over the full time period (1982–2020) (Figure 2a). Given the dominance of strong west-northwesterly winds in the PEI region [29,30], the zonal component of wind speed (Uwind) and the resultant wind speed (Rwind) showed very similar patterns (Figure 2b,c). Highest wind speed was observed in July (Rwind, 9.96 m s−1; Uwind, 9.62 m s−1) and lowest wind speed occurred in February (Rwind, 8.19 m s−1; Uwind, 7.55 m s−1). (Figure 2b,c). On the contrary, the strongest meridional wind speed (Vwind) was observed in February (−2.96 m s−1), and the weakest Vwind was detected in November (−1.08 m s−1) (Figure 2d). While some differences were evident between the seasonal cycles of Rwind and Uwind for the full time series (1979–2020) and the shorter period (1993–2016), especially during March and August, these differences did not substantially alter the seasonality. For Vwind, the differences between the seasonal cycles for the longer and shorter periods were less obvious (Figure 2b–d). While previous studies observed the strongest negative wind stress curl (WSC) at the PEIs in August (−2.30 × 10⁻⁸ N m−3), with the weakest during December (0 N m−3) [29,30], our study showed the 2° × 2° area averaged WSC for a longer period (1979–2020) was weakest in November (0.31 × 10⁻⁸ N m−3) and December (0.29 × 10⁻⁸ N m−3), and strongest in June (−2.05 × 10⁻⁸ N m−3), August (−2.00 × 10⁻⁸ N m−3), and September (−2.01 × 10⁻⁸ N m−3) (Figure S3a). These differences in the WSC climatology likely resulted from the differing time series lengths used, as illustrated in Figure S3a.
The geostrophic current (Rgeos) showed a peak in February (0.18 m s−1) and a minimum in September (0.16 m s−1) (Figure 2e). The seasonal pattern of Ugeos showed the strongest eastward current speed in May (0.11 m s−1) and the weakest in November (0.086 m s−1) (Figure 2f). On the other hand, Vgeos showed strongest northward current speed in December (0.038 m s−1), with the weakest speed observed in October (0.014 m s−1) (Figure 2g). The longer DUACS DT2018 geostrophic current speed time series showed similar seasonal patterns (results not shown). The wind-driven Ekman current (Rekm) showed great similarity to the seasonal cycle of Rwind, with highest Rekm in July (0.11 m s−1) and lowest in April and February (0.08 m s−1) (results not shown). These observations agreed well with the seasonal variations previously described at the PEIs [29,30], with only slight differences in the seasonal ranges, likely due to the spatial averages and longer period considered in this study (Figure 1, Figure 2 and Figure S3a).
Similar to [47], we calculated the percentage variance explained by the seasonality in SST, wind, and current speeds (Figure 3), to determine how reproducible the seasonal cycles were from one year to the next. About 50–70% of the SST variability was explained by its seasonal cycle, with the region to the south and southwest of the islands appearing to be more strongly influenced by shorter-term, as well as interannual and longer-term variations than the region to the north (Figure 3a). Indeed, the strong reproducibility of the seasonal SST cycle (Figure 3a) can also be seen in the monthly averaged time series (Figure 4a). For Rwind and Rekm, less than 30%, and for Rgeos less than 10%, of the variability was explained by the seasonal cycle, indicating more substantial intra- and interannual variability in these parameters at the PEIs (Figure 3b,c,d). Similar results were obtained for Rgeos from the longer DUACS DT2018 dataset (results not shown).

3.2. Long-Term Trends

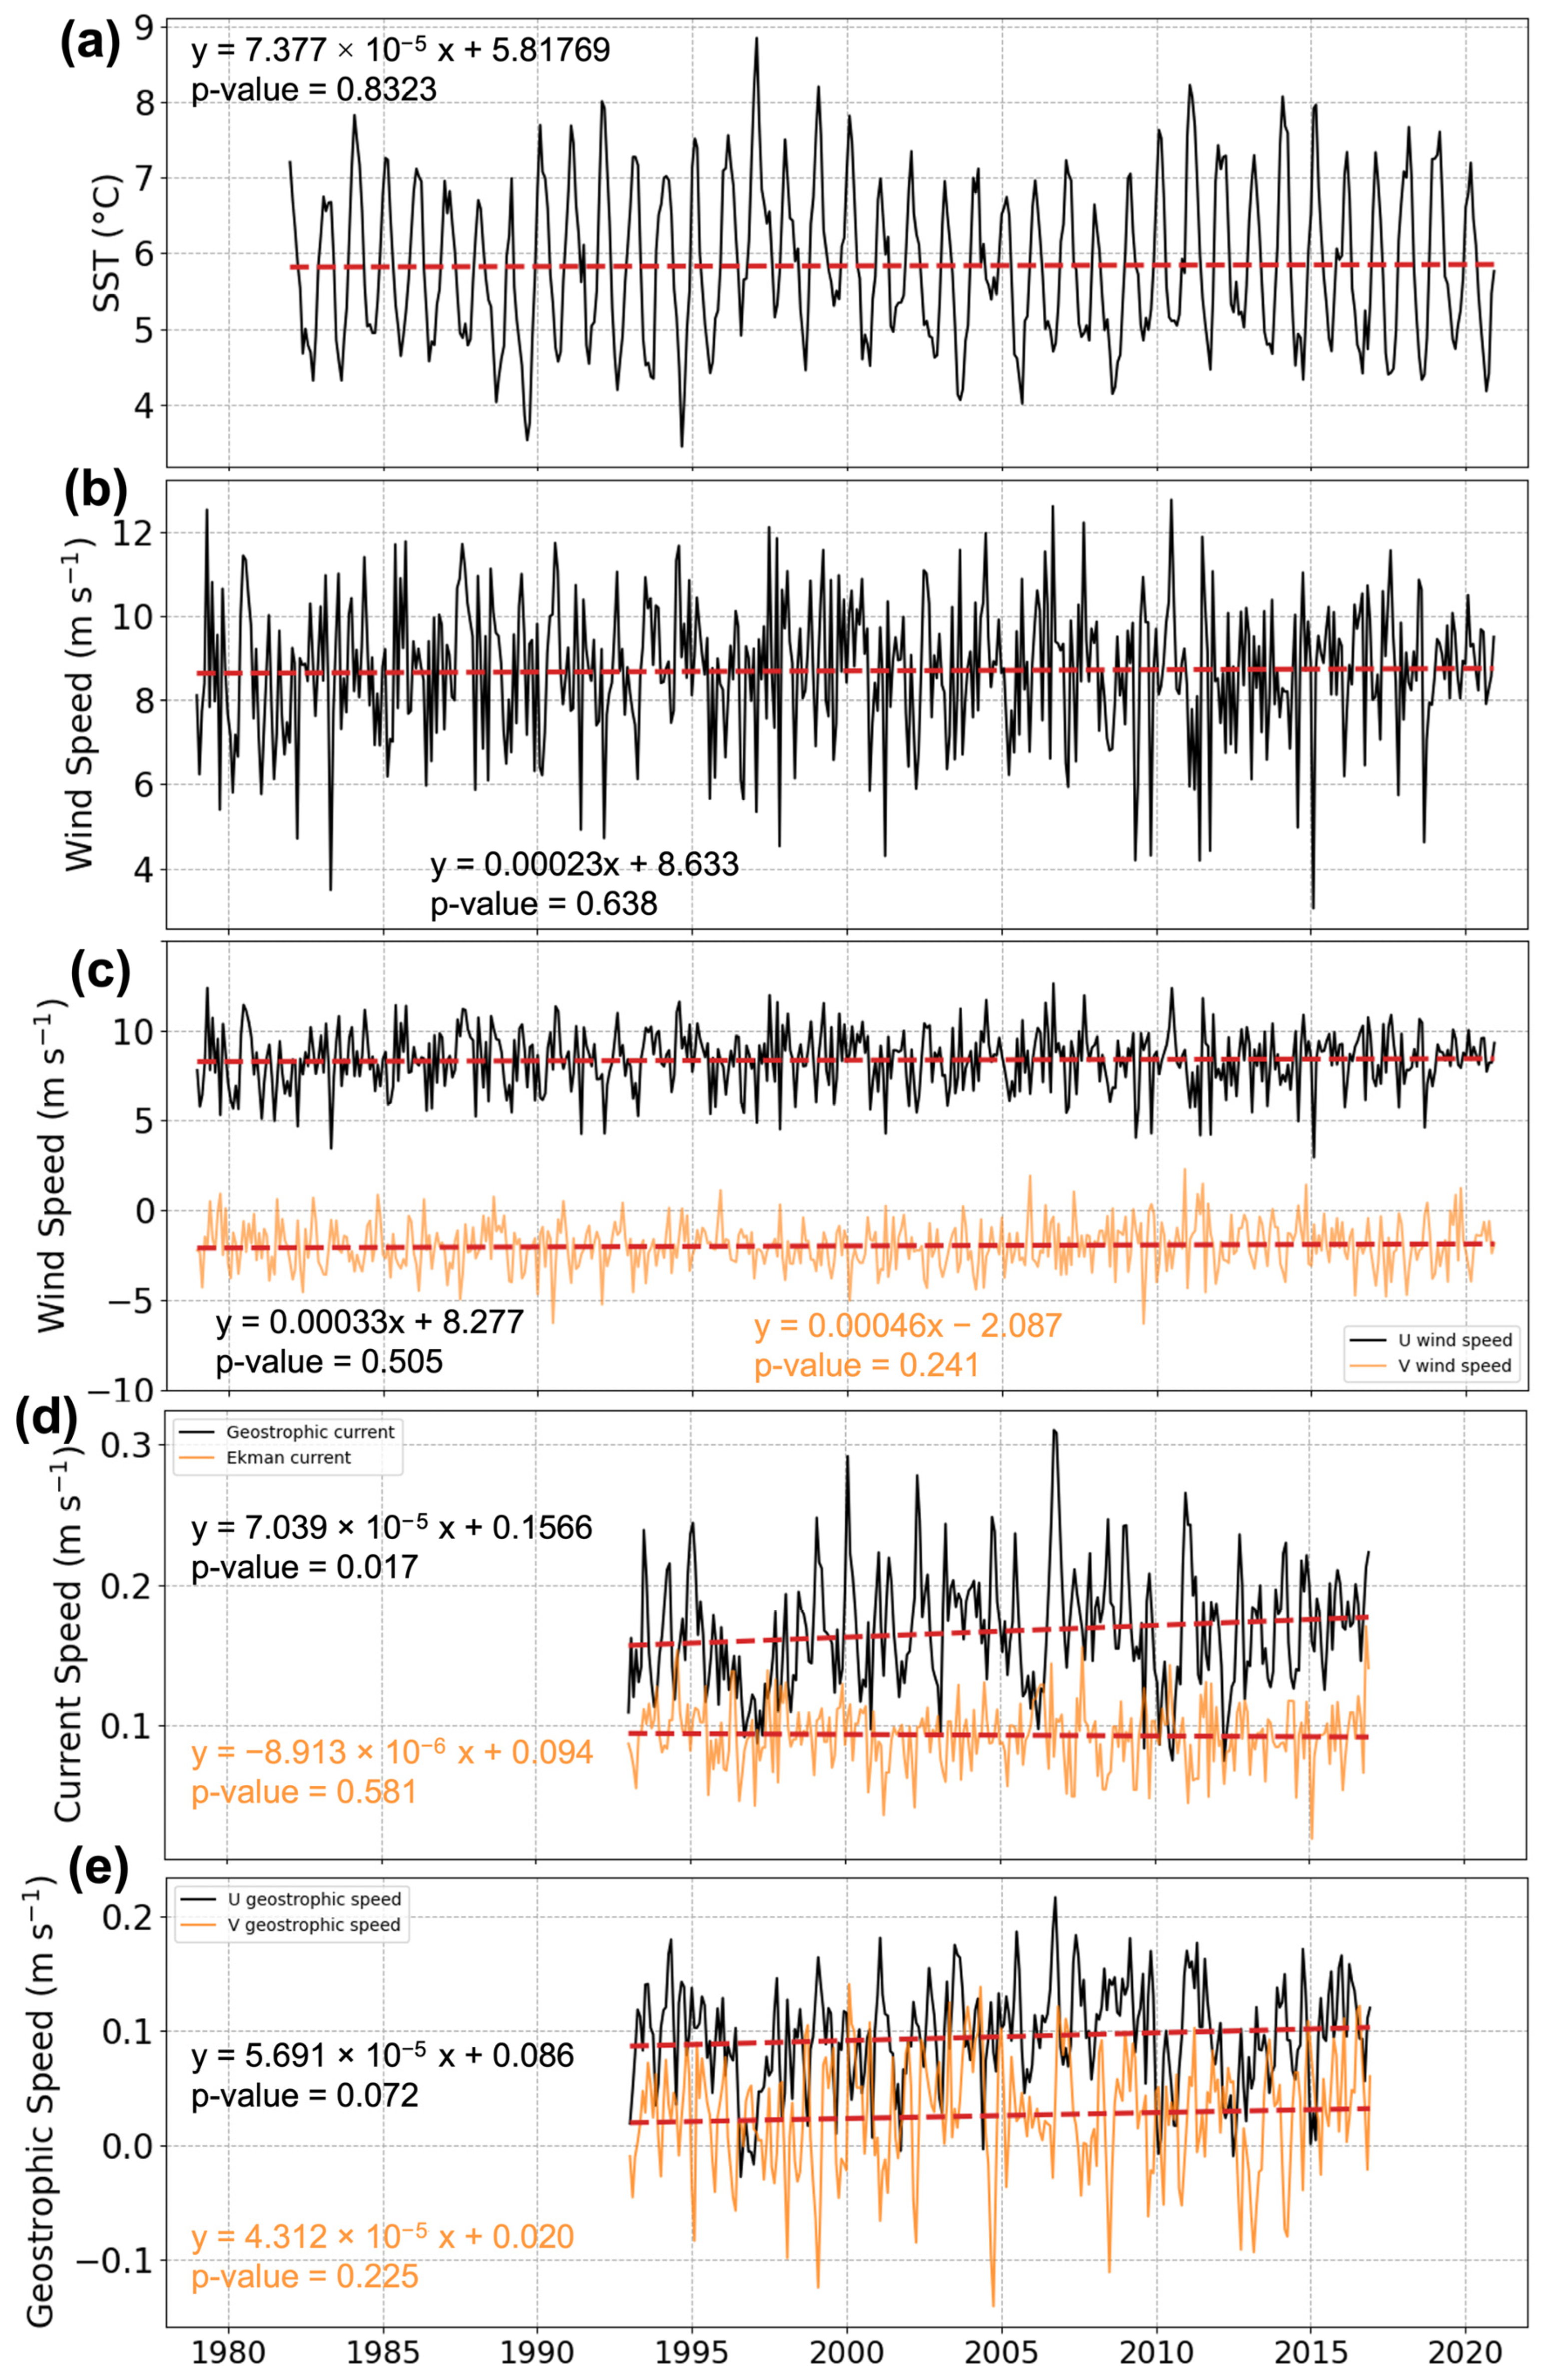
Overall, most of the long-term trends were very small and statistically insignificant, in agreement with [30]. Between 1982 and 2020, SST (0.0089 °C/decade; p > 0.05) showed a small but insignificant increase (Figure 4a). Similarly, the resultant wind speed (Rwind; 0.028 m s−1/decade; p > 0.05), as well as the zonal (Uwind; 0.040 m s−1/decade; p > 0.05) and meridional (Vwind; 0.055 m s−1/decade; p > 0.05) components, showed no statistically significant long-term changes (Figure 4b,c). There was a small positive, statistically significant WSC trend (2.587 × 10⁻⁹ N m−3/decade; p = 0.018) over the 1979 to 2020 period, indicating a change from more negative WSC to more positive WSC (Figure S3b). While Ekman current speed (Rekm; −0.0011 m s−1/decade; p > 0.05) showed no clear trend, the geostrophic current speed (Rgeos) showed a small yet statistically significant increase (0.0084 m s−1/decade; p = 0.017) over the 1993 to 2016 period (Figure 4d).
Despite the significant increase in Rgeos, the zonal (Ugeos; 0.0068 m s−1/decade; p > 0.05) and meridional (Vgeos; 0.0052 m s−1/decade; p > 0.05) current speed components showed no significant change, but a positive tendency was evident in both (Figure 4d,e), suggesting increased northeastward flow at the islands. Rgeos and Ugeos from the longer-period DUACS DT2018 dataset showed similar insignificant long-term trends (results not shown). The Vgeos from the DUACS DT2018 dataset however showed a small significant increase from 1993 to 2020 (0.0103 m s−1/decade; p < 0.05).

3.3. Interannual Variations

Clear interannual SST variability was evident, with the warmest summer occurring in February 1997 (8.85 °C) and the coolest winter in September 1994 (3.45 °C). Since the annual cycle was removed through the calculation of anomalies, the interannual and decadal-scale variations became more obvious (Figure 5a). Between 1982 to 1990, and 2001 to 2009, cooler-than-average SSTs were observed at the PEIs. In contrast, the surface ocean was warmer-than-average during 1990 to 2001 and between 2009 and 2020 (Figure 5a).
Both the seasonal cycle and interannual variations in Rwind (Figure 2b, Figure 3b and Figure 4b) and WSC (Figure S3a,b) were less evident compared to that of SST. Instead, Rwind and WSC showed rapid and dramatic fluctuations from one month to the next. The strongest Rwind was observed in July 2010 (12.75 m s−1) while the weakest Rwind occurred in May 1983 (3.44 m s−1) and February 2015 (3.05 m s−1) (Figure 4b). The zonal component (Uwind) was positive and much stronger than the negative meridional component (Vwind), indicating the persistence of northwesterly winds in the region (Figure 4c). There were no clear interannual or longer-term fluctuations observed for Uwind and Vwind. The largest positive Uwind anomaly, indicating stronger-than-average westerly winds, was observed in May 1979 (2.62 m s−1), while the largest negative Uwind anomalies occurred in May 1983 (−2.89 m s−1) and February 2015 (−2.85 m s−1), reflecting westerly winds that were much weaker than the climatological mean (Figure 5c). These large negative Uwind anomalies coincided with the weakest Rwind for the time series (Figure 4b and Figure 5b). In contrast, the largest negative Vwind anomaly was observed in August 2009 (−3.25 m s−1), showing stronger-than-average southward winds, while the largest positive Vwind anomaly (3.05 m s−1), showing stronger-than-average northward winds, occurred in December 2010 (Figure 5c).
The strongest positive WSC (0.95 × 10⁻⁷ N m−3) was observed in July 1994, coinciding with the largest positive WSC anomaly (18 N m−3). In September 2002, the strongest negative WSC (−0.95 × 10⁻⁷ N m−3), along with the largest negative WSC anomaly (−12 N m−3), was observed (Figure S3a,b). In the Southern Hemisphere, negative WSC is typically associated with lower SST due to the uplift of deeper waters to the surface [48], and as such, we expected SST anomalies at the PEIs to coincide with WSC anomalies. However, there was no clear correspondence between SST and WSC anomalies at a monthly scale (Figure 5a and Figure S3b). For example, the lowest mean SST and large SST anomaly (−1.40 °C) in September 1994 occurred two months after the strongest positive WSC (0.95 × 10⁻⁷ N m−3). In contrast, in June 1998, the large positive WSC (0.70 × 10⁻⁷ N m−3) and anomaly (12 N m−3) occurred three months before a 0.8 °C drop in the mean SST (Figure 5a and Figure S3b).
Throughout the analyzed period, Rgeos was stronger than Rekm with the exception of a few months (Figure 4d). Monthly anomalies of Rgeos and Rekm also showed that they varied differently and independently from each other, since most of the anomalies were not coincident in time and showed different patterns from one year to the next (Figure 5d). The largest positive Rgeos anomaly (3.47 m s−1), indicating stronger current flow, was observed in November 2006. In contrast, the largest positive Rekm anomaly (3.34 m s−1) occurred in November 2016 (Figure 5d). The largest negative Rgeos anomaly (−2.18 m s−1), reflecting much weaker eastward flow, was observed in April 2012, while the largest negative Rekm (−2.79 m s−1) anomaly occurred in February 2015 (Figure 5d). These same Rgeos anomalies were observed in the longer DUACS DT2018 dataset (results not shown).
Since the geostrophic current drives the bulk of the circulation variability around the PEIs [29], the zonal (Ugeos) and meridional (Vgeos) geostrophic current components were further investigated to examine the interannual variations in the direction of flow (Figure 5e). No apparent interannual patterns or long-term oscillations were evident in the Ugeos or Vgeos anomalies (Figure 5e). The largest positive Ugeos anomaly (2.71 m s−1) occurred in October 2006 demonstrating stronger eastward current flow during this time (Figure 5d,e). This is also reflected in the large Rgeos anomalies that occurred in October and November 2006 (Figure 5d). The largest negative Ugeos anomaly (−2.34 m s−1) was observed in January 1997, implying weaker-than-average eastward flow. In fact, during this month, Ugeos (Figure 4e) was negative, indicating flow directed toward the west, as a result of an anticyclonic eddy located directly south of the PEIs throughout the month (Figure S4). This is in agreement with [28], who demonstrated that individual mesoscale eddies could influence circulation patterns at the PEIs for periods of a month or longer, resulting in westward flow, and warming and cooling events of the order of 0.5–2 °C, depending on their orientation relative to the islands. The generally weaker-than-usual eastward geostrophic current flow between September 1996 to March 1997 (Figure 4d,e and Figure 5d,e) corresponded closely to above-average SST (Figure 4a and Figure 5a). However, such correspondence was not obvious for the rest of the monthly time series.
The largest positive Vgeos anomaly (2.45 m s−1) was observed in February 2000, indicating flow with a stronger northward current component during this month (Figure 5d,e). Greater-than-average southward current flow, reflected by the largest negative Vgeos anomaly (−3.11 m s−1), occurred in October 2004 (Figure 5e). The Ugeos and Vgeos anomalies of the DUACS DT2018 dataset (results not shown) showed some differences, with the largest positive Ugeos anomaly in March 2009 (2.57 m s−1) and the largest negative Ugeos in August 1996 (−3.15 m s−1). The largest positive DUACS DT2018 Vgeos anomaly was seen in February 2019 and the highest negative Vgeos anomaly in August 1996 (−3.14 m s−1) (results not shown).

3.4. Wavelet Analyses

The standardized anomalies of each parameter were further decomposed using a Morlet wavelet function (Figure 6). Each continuous wavelet power spectrum was generated with a cone of influence to identify periods affected by zero padding, which are artificially filled gaps at the borders of the wavelet transform resulting from the limited time series length (Figure 6). Observations within this cone of influence (hashed and shaded regions on Figure 6) were considered statistically insignificant [41,42,43].
For SST, the wavelet spectrum indicated statistically significant variability at periods of 0.75–1.1 years and 2–9 years, with the strongest power observed at 0.8 (0.47 °C2) and 2.8 (0.36 °C2) years, respectively (Figure 6a,b). The significant variability between 10 and 12 years, with peak power (0.36 °C2) at 7.5 years (Figure 6a,b), confirmed the decadal-scale changes between warmer and cooler conditions observed in Figure 4a. Compared to wavelet analysis over the shorter 1993–2016 period [30], common to all the datasets, our wavelet analysis over the full SST time series (1982–2020) showed no substantial differences in the signals identified. In contrast, Rwind, Uwind, and Vwind showed considerable short-term variability at periods less than 0.5 years throughout the time series (Figure 6c and Figure 7a,c), in agreement with the patterns shown in Figure 4b,c. There were also short portions of these time series that showed significant power at periods between 1 and 2 years. However, these were not significant on their respective global wavelet spectra (Figure 6d and Figure 7b,c). These same signals were observed from wavelet analysis over the common 1993–2016 period [30]. Similarly, Rekm also showed mostly short-term variability, with no statistically significant signals on its global wavelet spectrum (Figure 6g,h). WSC also displayed substantial short-term (1–3 months) and semi-annual (6–8 months) variability with only the interannual-scale variations at a period of 3–4 years and decadal-scale variations at a period of 7–8 years being considered statistically significant (Figure S3c,d).
Significant variability in Rgeos was observed at periods of 0.5–1.5 years and 3.7–5 years, with the strongest power observed at 1.2 years (1.44 (m s−1)2) and 3.9 years (0.70 (m s−1)2) on the global wavelet spectrum (Figure 6e,f). Ugeos showed similar variability to Rgeos, but unlike Rgeos, the Ugeos showed somewhat stronger variability after 2005 (Figure 6e and Figure 7e). During the latter part of the time series (2006 to 2014), there was significant Ugeos variability at periods of 0.3–1.5 and 2–4 years (Figure 7e). Only the Ugeos variability at periods of 2–4 years was significant on the global wavelet spectrum, with the strongest power at 2.5 years (1.19 (m s−1)2) (Figure 7f). In contrast, Vgeos appeared to have distinct semi-annual variability throughout the study period (Figure 7g,h). Similar to the zonal component, Vgeos also showed somewhat stronger variability at periods of 1–2 years during the latter part of the time series. However, the global wavelet spectrum indicated that none of the Vgeos variations were statistically significant (Figure 7h).
The wavelet power spectra of the longer DUACS DT2018 dataset showed similar patterns to those in Figure 6e and Figure 7e,g, but their global wavelet spectra differed slightly. The DUACS DT2018 Rgeos showed highest power at 0.8 years (2.16 (m s−1)2), 2.4 years (1.19 (m s−1)2) and 3.9 years (0.66 (m s−1)2) (Figure S5b). The signals shown by the global wavelet spectrum of DUACS DT2018 appeared to be stronger than that of the GlobCurrent dataset, likely due to the increased length of the time series (Figure S5d). The strongest peaks in Ugeos were observed at 2.5 years (1.62 (m s−1)2) and at 4.8 years (0.90 (m s−1)2) (Figure S5d). The DUACS DT2018 Vgeos variability showed significant power at periods of 1–1.4 years with strongest power at 1 year (1.75 (m s−1)2).

3.5. Wavelet Coherence

Wavelet coherence spectra illustrate the correlation between two time series as they evolve in a time–frequency domain. Figure 8 shows the wavelet coherence between the monthly standardized SST, Rwind, Rgeos, and Rekm anomalies, overlaid with the phase lags (indicated by black arrows) between the various parameters.
For most of the time series, the coherence between SST and Rwind was weak and statistically insignificant (Figure 8a). Only short periods of significant coherence were observed across various periods. The strongest coherence (>0.8) between SST and Rwind variability was observed between March 2014 and April 2015 at periods less than 0.5 years, where SST and Rwind appeared to be in-phase (i.e., both decreasing), with Rwind leading (arrows pointing to the right and downward) the SST change (Figure 4a,b and Figure 8a). Within the 0.5 to 1 year band, there were several occasions where relatively high coherence (0.6–0.8) was observed, with both in-phase and anti-phase relationships between the SST and Rwind (Figure 8a).
At periods of 2–3 years, an in-phase relationship between Rwind and SST, with changes occurring simultaneously in both parameters (phase angle of 0°), was only observed between March 1995 and April 1999 (Figure 8a). Similarly, short periods of strong coherence between WSC and SST occurred at periods between 0.5 and 2 years, with the strongest coherence observed during January 1993 and March 1996, when WSC and SST changes occurred simultaneously (Figure S6). At periods between 1 and 2 years, coherence between WSC and SST was anti-phase, with SST changes leading WSC. For the first half of the time series, significant anti-phase coherence between WSC and SST was also observed at periods of 6–8 years (Figure S6).
As a result of the strong zonal character of the wind speed at the PEIs, the wavelet coherence between SST and Uwind (Figure 9a) was very similar to that of SST and Rwind (Figure 8a). Vwind appeared to have a stronger in-phase semi-annual/annual relationship with SST throughout the time series, with changes in Vwind sometimes leading SST changes (e.g., at periods of 0.5–1 years between March 1998 and January 2000), and sometimes lagging SST changes (e.g., at periods of 0.3–0.5 years between August 1985 and September 1987) (Figure 9c). The strong dependence of Rekm on Rwind at the PEIs [29,30] can also be seen in their wavelet coherence spectra (Figure 8d). Very strong coherence (>0.8) was observed across most periods for the majority of the time series. As expected, changes in Rwind mainly led the changes in Rekm at a phase angle of 90°. As a result, the coherence between Rekm and SST (Figure 8c) was very similar to that between Rwind and SST (Figure 8a).
The wavelet coherence between SST and Rgeos was also weak and insignificant throughout most the time series (Figure 8b). Strong coherence (>0.7) occurred at periods less than 1 year. Within the 0.3- and 0.8-year band, an in-phase relationship was observed between Rgeos and SST from December 1997 to October 1998 and from June 2012 to October 2013 (Figure 8b). While Rgeos led the SST change between December 1997 and October 1998, it lagged behind the SST change between June 2012 and October 2013. The wavelet coherence between SST and the DUACS DT2018 Rgeos dataset showed the same pattern with the exception of the strong significant coherence observed at periods less than 0.4 years between March and June 1995 (Figure S7).
The relationship between the SST, Ugeos, and Vgeos variability was further explored (Figure 9b,d). Relatively strong in-phase, semi-annual coherence (>0.6) occurred between SST and Ugeos towards the end of the study period (August 2009 to August 2016) (Figure 9b). Within the 3 to 7 years band, a significant anti-phase coherence was observed between SST and Ugeos from August 1996 to September 2002 (Figure 9c). Compared to Ugeos, the Vgeos showed stronger coherence with SST throughout the study period. (Figure 9d). For the first half of the analyzed period (1993 to 2003), both in-phase and anti-phase coherence occurred between SST and Vgeos at periods less than 0.5 years (Figure 9d). After 2003, strong coherence occurred at longer periods of up to 1.8 years with both in-phase and anti-phase changes in SST and Vgeos (Figure 9d).
It is noteworthy that the wavelet coherence spectra suggested decadal-scale relationships between wind and SST, and between geostrophic currents and SST. Rwind, Uwind, Vwind, and WSC showed consistently strong coherence with SST throughout the time series at periods longer than 12 years (Figure 8a, Figure 9a,b and Figure S6). Similarly, throughout the time series, Rgeos, Ugeos, and Vgeos also all showed strong coherence with SST at periods longer than 8 years (Figure 8b, Figure 9c,d and Figure S7). Unfortunately, due to the relatively short length of the time series, these relationships were considered statistically insignificant on the wavelet coherence spectra. In order to further investigate these decadal variations, similar to previous studies [24,25], we computed the 5-year running means of SST, wind speed, geostrophic current speed (Figure 10), and WSC (Figure S8). Given the short length of the GlobCurrent dataset, we chose to illustrate the DUACS DT2018 geostrophic current data in Figure 10a.
Both geostrophic current speed and wind speed showed inverse relationships with SST, with stronger current and wind speeds associated with lower SST, while weaker current and wind speeds were related to elevated SST (Figure 10a,b). This relationship between current speed and SST was evident throughout the 1996–2020 period (Figure 10a) with a strong significant negative correlation (r = −0.89, p < 0.001) at a lag of zero years (Figure 10c), confirming the strong significant wavelet coherence observed between SST and geostrophic current speed at decadal time scales (Figure 8b and 9c,d). The relationship between wind speed and SST seemed to break down between 1991 and 2001, when increasing and elevated SST was observed during a period of higher wind speeds, in contrast to the rest of the time series (Figure 10b), resulting in a weak, but significant correlation (r = −0.18, p < 0.001) (Figure 10d). When excluding data between 1991 and 2001, the correlation between wind and SST improved substantially (r = −0.64, p < 0.001) (Figure 10d), but was still weaker than the correlation between geostrophic current and SST (Figure 10c). These results suggested that at a decadal-scale, geostrophic current variations were more strongly associated with SST changes, with wind fluctuations being of secondary importance.
Prior to 1992, a similar inverse relationship was evident between SST and WSC (Figure S8a), but from 1992 onwards, this relationship is not as clear, and WSC showed a more linear trend, tending toward more positive WSC at the end of the time series. This positive trend was also observed in the monthly WSC time series, albeit much weaker (Figure S3b). The changing WSC pattern resulted in a relatively weak correlation (r = −0.32, p < 0.001) between SST and WSC (Figure S8b). Although there has been no clear long-term increase in wind speed (Figure 4b,c and Figure 5b,c), the increasing WSC was associated with variations in meridional wind speeds (Figure S9), which reflected a long-term change in the predominant wind direction from northwesterly to more westerly winds. Previous studies [22,24] documented a similar change in wind direction at the PEIs. While the weakening negative WSC since 1992 was expected to contribute to increased SST, such warming was not clearly observed in response to the WSC (Figure S9).

3.6. Spatial Correlations

Similar to previous studies [23,40,45,46], we examined the correlations between SST, wind speed, and surface current speeds at the PEIs and that across the global ocean in order to investigate the connection between variability at the PEIs and that in the surrounding global ocean (Figure 11). There was a significant negative correlation between SST at the PEIs and SST over the South Atlantic Ocean, and significant positive correlation with SST over the southwestern Indian Ocean. SST at the PEIs was also negatively correlated with the SST south of 60°S across most of the Southern Ocean (Figure 11a). In the southwest Atlantic sector of the Southern Ocean, correlations were positive, which together with the negative correlations in the southeast Pacific sector, formed a pattern characteristic of the Antarctic dipole [49]. These correlations were however considered to be negligible (−0.3 < R > 0.3) [50].
When retaining only the stronger correlations (R > 0.3 and R < −0.3) [49], the SST variability within the averaged 2° × 2° area around the PEIs matched that across a larger area enclosed by the sub-Antarctic Front (SAF) and the Antarctic Polar Front (APF) between 10°E and 65°E (Figure 11b). As expected, these correlations were stronger closer to the islands and decreased with increasing distance from the islands (Figure 11b). Notably, at the location where the SAF and APF converge through the ABFZ (~ 50°S; 30°E) of the SWIR [10,51], there was a small northeastward-orientated band of negligible correlation, while stronger correlations were observed downstream of the SWIR (Figure 11b). This negligible correlation at the ABFZ of the SWIR is likely due to the strong mesoscale variability in the region [10,51].
Significantly correlated Rwind showed a well-defined regional pattern centered between the SAF and APF, similar to the SST (Figure 11c,d). Rwind at the PEIs was negatively correlated with Rwind in the lower latitudes of the South Atlantic Ocean, and positively correlated with Rwind between 20°S and 40°S along the west coast of South Africa and across the southern Indian Ocean, but most of these correlations were negligible (Figure 11c). Closer to Antarctica, alternating bands of positive and negative correlations were observed (Figure 11c,d). Between the SAF and APF, the spatial pattern of the significantly correlated Uwind region (Figure 12c,d) was similar to that observed for Rwind. However, Uwind, at the PEIs was negatively correlated with Uwind along the west coast of South Africa and close to Antarctica (Figure 12c,d), in contrast to the pattern observed for Rwind.
The spatial correlation of the Vwind anomalies (Figure 12a,b) showed a substantially different pattern compared to Rwind and Uwind. Dipole structures were evident in the Pacific, Atlantic, and Indian sectors of the Southern Ocean (Figure 12a), characteristic of the Antarctic Circumpolar Wave (ACW) signal [49,52]. A large circular region of positive correlation was observed around the PEIs, extending across most of the Southern Ocean between South Africa and Antarctica. In contrast, similarly large regions of negative correlation occurred in the Atlantic and Indian sectors of the Southern Ocean (Figure 12a,b). Interestingly, the core area of the negative correlation in the Atlantic sector was centered south of the APF, at about 55°S; 16°W, while the core region of negative correlation in the Indian sector was located north of the SAF, at about 40°S ;85°E (Figure 12a,b).
The spatial correlations of Rgeos, Ugeos, and Vgeos were very different to that of SST and Rwind, with very patchy negligible correlations across most of the global ocean (Figure 11e and Figure 13a,c). Only a smaller region directly upstream of the islands showed stronger correlation (R > 0.5), highlighting the localized influence of the surrounding current flow. While these positive correlations extended toward the northeast and southeast of the PEIs, there was no significant relationship directly in the lee of the islands (Figure 11f). The components of the geostrophic current, Ugeos and Vgeos, both showed stronger positive correlations toward the south and west of the PEIs (Figure 13). Similar to Rgeos, the positive Ugeos correlations also showed northeastward and southeastward extensions (Figure 13b) Negatively correlated regions of Ugeos occurred to the north and to the south of the islands (Figure 13b), while Vgeos showed strong negative correlations to the east and to the west of the islands (Figure 13d). These strongly localized spatial correlations (Figure 11e,f and Figure 13) reflected the interaction of the ACC with the island bathymetry.

4. Discussion

With increased habitat degradation in the sub-Antarctic regions and the amplified environmental variability caused by low frequency natural climate variability or anthropogenic changes, the ability of sub-Antarctic species to adapt to ecosystem shifts has considerably been reduced [16,53]. To be able to better understand and predict potential impacts on biological communities at the PEIs, which are heavily reliant on the surrounding ocean environment, a good understanding of the long-term trends and year-to-year variations in oceanographic conditions needs to be established. Expanding upon previous research [20,21,22,23,24,25,26,29,30], this study described the long-term (28 years and longer) trends and interannual variations in SST, wind forcing, and surface circulation, in the ocean environment surrounding the PEIs, using satellite and reanalysis products.

4.1. Seasonal Changes and Long-Term Trends

SST variability around the PEIs was dominated by seasonal changes (50–70%), with the highest SSTs typically occurring in February (7.24 °C) and the lowest in September (4.67°C) (Figure 2a and Figure 3a). This seasonal cycle was consistent with that previously described [29] for a larger area around the PEIs, and is also in agreement with in situ SST at Marion Island [20,21,22,23,24,25,26], as illustrated in Figure S1a. Interestingly, a recent study [24], which extended the data and analyses of [20,21,22] over a longer period (1949 to 2018), showed highest SST in March instead of February. This implies that there may have been some changes in SST seasonality at the PEIs, but more detailed investigations are needed to establish this with certainty.
In the northern section of the ACC, where the PEIs are located, the temperature of the upper 1000 m of the ocean has warmed by 0.1–0.2 °C per decade due to the Southern Ocean’s increased ability to absorb heat [6]. Indeed, similar warming has also been observed locally at the PEIs. Earlier studies documented an increase of up to 1.4 °C over the 1949–1998 period [20,22,25], and this warming appears to have persisted, with [24] reporting an increase of 1.54 °C over the 1949–2018 period. The coarse resolution and optimal interpolation used to substitute data gaps [54,55] was expected to be a limitation to the accuracy of the reanalysis SST, but the excellent correlations between in situ and GHRSST (Figures S1 and S2a) provided confidence in the patterns observed from GHRSST. As such, we expected to observe a similar long-term trend in GHRSST, but in fact, our study showed no statistically significant rise in SST (0.0089 °C/decade, p > 0.05) at the PEIs (Figure 4a).
The primary reason for this discrepancy is likely the substantial difference between our study period and that of [24]. While our study was conducted over a 39-year period (1982–2020), the [24] study was conducted over a 70-year period between 1949 and 2018. This suggests that the length of the GHRSST dataset is too short to accurately identify long-term trends in the PEI region, especially since the long-term trend was much smaller than the observed seasonal and interannual variations (Figure 2a, Figure 4a and Figure 5a). This is also evident from our wavelet analyses, which show that SST signals at periods longer than 14 years cannot be interpreted with confidence (Figure 6a,b). These findings are in agreement with previous studies, which have suggested that up to 50 years of data are required to adequately distinguish long-term climate-driven SST changes from natural variability, with substantially more years of data required in regions such as the PEIs where seasonal and interannual fluctuations are large [56,57].
Nevertheless, our findings support the suggestion of [24] that there has been a decrease in the SST warming rate in recent years. Such decreased warming has also been suggested by numerous other global studies (e.g., [58]). However, it is important to remember that the in situ SST measurements at Marion Island are made using a hand-held bucket and a thermometer [20,21,22,23,24]. Thus, they may be heavily influenced by the rise in surface air temperature that has been observed across most of the Southern Ocean and at the PEIs in the past few decades ([1,20,21,22,23,24,25,26,59] among others). As such, the trends identified from these in situ SST data may not necessarily reflect water temperature changes driven by oceanographic variations.
The annual cycle of Rwind (Figure 2b) followed a bi-annual pattern reflecting that of the Semi-annual Oscillation (SAO), with the exception of the summer months (December to March), in agreement with earlier studies [22,29]. The Southern Hemisphere has been experiencing a strengthening and a slight southward migration of its westerly wind belt in the last few decades [2,5,60]. Consequently, generally weaker wind speeds have been observed in the sub-Antarctic region and at the PEIs [4,22]. In contrast, our study showed that neither the ERA5 wind data (Figure 4b,c), nor the in situ wind data at Marion Island (Figure S2b) showed any significant long-term linear trends.
This implies that the long-term SAM-induced southward movement of the westerly wind belt was not clearly apparent at the PEIs during the study period. With only 30% of the variability in Rwind expressed through its seasonality, the remaining 70% was expected to be driven by significant interannual or decadal-scale variations (Figure 3b). However, the strongest variance in wind was in fact observed at sub-annual timescales (Figure 4b,c, Figure 5b,c, Figure 6c,d and Figure 7a–d), most likely due to the frequent and rapid movement of low-pressure systems across the PEI region [22]. This substantial short-term variability likely obscures the seasonal and longer-term changes in wind at the PEIs (Figure 6c,d and Figure 7a–d).
The surface current properties of the Antarctic Circumpolar Current (ACC) are mirrored around the PEIs due to the islands being located in the direct path of the ACC [28,29]. Any physical changes experienced by the ACC are thus expected to occur at the PEIs as well. On a seasonal scale, our study agreed with previously detailed surface current variations [29], but here we demonstrated that the seasonal cycle of Rgeos (Figure 2e) accounted for less than 10%, with that of Rekm explaining less than 25% of the total variability (Figure 3c,d), implying substantial intra-, interannual, and longer-term variations in surface circulation. With SAM causing a poleward intensification of the westerly wind belt, it is expected that the ACC would strengthen and move south as well, particularly in regions where the ACC is only weakly constrained by topography [6,51,61,62]. Our results seem to support this somewhat but show only a minimal increase in northeastward flow at the PEIs during the 1993–2016 period (Figure 4d,e). Southward movement of the ACC is, however, a subject of considerable debate, as other studies have contradicted this notion [63,64].
The PEIs are located directly downstream of the region where the topographic interaction between the ACC and the ABFZ results in substantial mesoscale variability and meandering of the ACC fronts [9,10,11,28,29,65]. While recent studies [12,13] have demonstrated no long-term increase in the number of mesoscale eddies in the region, the long-term increase in current speed (Figure 4d,e) may be associated with a localized southward movement of the ACC fronts in the PEI region [66]. The recurrent passing of cyclonic and anticyclonic eddies, as well as the frequent meandering of the southern branch of the SAF and the northern branch of the APF, promotes enhanced advection and mixing between colder and warmer waters around the PEIs [10,11,12,13,27]. The high variability associated with these shorter-term physical processes and events likely moderates the expected long-term increase in both SST and geostrophic current speeds at the PEIs to some extent.

4.2. Interannual and Decadal-scale Variations

It is well-known that the Southern Annular Mode (SAM) and Semi-Annual Oscillation (SAO) strongly influence oceanographic variability in the Southern Hemisphere. While some larger-scale studies [4,60] have shown cooling trends associated with the strengthening and southward migration of the westerly wind belt due to a more positive SAM, others (e.g., [67] have demonstrated persistent warming associated with a more positive SAM. Although both SAM and SAO are known to impact the strength of the westerly winds, the bi-annual nature of SAO has a stronger influence at seasonal timescales, rather than at interannual timescales such as SAM [68].
An earlier study [22] suggested that the SAM-influenced southward migration of the westerly wind belt resulted in a long-term decrease in wind speeds and a long-term increase in SST at the PEIs. More recently, [30] demonstrated that at lags between 0 months and 12 years, correlations of SST anomalies at the PEIs with SAM and SAO were all negligible (r < 0.2), indicating no strong direct impact of SAM or SAO on SST. Similarly, lagged correlations of wind speed, WSC, and geostrophic current speed anomalies with the SAM and SAO indices showed no significant correlations at lags between 0 months and 12 years [30]. In agreement with the findings of [30], our wavelet analyses showed no clear consistent or significant signals for wind, and currents at the timescales of the impacts SAM or SAO (Figure 6 and Figure 7). Our results also agreed with previous studies [6,62,63,64], which showed that the impacts of SAM are not uniform across the Southern Ocean. However, significant SST variability (Figure 6a,b), and strong, but statistically insignificant variability in geostrophic currents (Figure 6e,f and Figure 7e–h) around a period of 1 year suggested some influence of SAM. It is thus likely that longer time series are required to obtain significant correlations of SST and geostrophic currents at the PEIs with the SAM index.
Significant interannual and decadal-scale variations in SST, strongest at periods of 2.8 and 7.5 years were clear at the PEIs (Figure 6a,b). Previous studies have suggested that this interannual variability may be associated with that of the ACW [20,21]. The ACW is a teleconnection of the ENSO that propagates across the Southern Ocean within the ACC region. Four independent signals at periods of 2.9, 3.7, 7.1, and 17 years have been identified for the ACW [69,70,71]. This, in fact, coincided with the interannual periodicity of SST at 2.8 years, as well as the decadal-scale signal at 10–12 years that reflected warmer-than-usual SST between 1990–2001 and 2009–2020, and cooler-than-usual periods during 1982–1990 and 2001–2009 (Figure 5a and Figure 6a,b). The ACW signal also corresponded to the significant interannual and decadal WSC variations at periods of 3–4 years and 7–8 years (Figure S3d,e), as well as the Rgeos and Ugeos variations at periods of 2–4 years (Figure 6e,f and Figure 7e,f). In contrast, this was not the case for Rwind, Uwind, Vwind, and Rekm, since their wavelet spectra showed no statistically significant interannual or decadal-scale signals (Figure 6c,d,g,h and Figure 7a–d).
Previous studies have established a frequency of ENSO occurrence between 2 and 7 years (e.g., [72,73]). Indeed, it can be argued that the significant power observed at these periods for SST (Figure 6b), WSC (Figure S3c,d), and geostrophic currents (Figure 6e,f and Figure 7e,f), may be associated with ENSO variations. As expected, during the strong El Niño event from June 1997 to June 1998 [74], SST at the PEIs was generally above average (Figure 4a and Figure 5a), while geostrophic current speeds were much weaker than normal (Figure 4d,e and Figure 5d,e). Similarly, the strong La Niña of May 1988 to December 2000 [75] also generally corresponded with large negative SST anomalies (up to −1.17 °C in December 1988).
However, closer examination revealed that in fact, the highest SST (8.87 °C) was actually observed in February 1997 (Figure 4a and Figure 5a), a few months prior to the start of the strong El Niño event [74]. Similarly, during this period, the weakest eastward geostrophic current speeds also occurred before the El Niño event (Figure 4d,e and Figure 5d,e). As described earlier and illustrated in Figure S4, the SST and geostrophic current anomalies in January and February 1997 were attributed to the occurrence of an anticyclonic eddy south of the islands, in agreement with previous studies [28]. The correspondence of positive and negative SST and geostrophic current anomalies with El Niño and La Niña events, respectively, was also not consistent for the remainder of the monthly time series.
Moreover, the spatial correlation plots showed no strong correlation between SST and geostrophic currents at the PEIs and that in the equatorial and subtropical Pacific Ocean directly impacted by ENSO or its teleconnections at a lag of zero months (Figure 11a,b,e,f). Similar to the spatial pattern for SST, the correlation patterns of Rwind also showed a spatially coherent, distinct regional pattern around the PEIs (Figure 11c,d). Furthermore, [30] demonstrated that ENSO only had a negligible negative correlation (r = −0.18 to −0.12, p < 0.05) with Rwind anomalies at the PEIs at lags of 13 to 21 months, and a negligible positive correlation (r = 0.11–0.19, p < 0.05) with WSC anomalies at lags of 11–12 years.
Lagged correlations between the Oceanic Nino Index and SST anomalies at the PEIs were strongest (r = 0.36, p < 0.05) at a lag of 62 months [30], suggesting that ENSO had a weak effect on SST at a lag of about 5 years after the occurrence of an ENSO event. However, examination of spatial correlations for SST, wind, and geostrophic currents at lags of 1–5 years revealed no clear strong correlations with the regions directly impacted by ENSO (results not shown). This 5-year lag in fact corresponds to the nominal travel time of the ACW across the Southern Ocean, which varies between about 5 and 10 years [21]. In agreement, an earlier study [49] demonstrated that ENSO creates SST anomalies in southwest Pacific that are then advected eastward along the ACC by the ACW, during which the SST anomalies are locally modified through interactions between air, sea, and ice.
Alternating regions of negative correlation for Vwind anomalies at the PEIs and in the Atlantic and Indian sectors (Figure 12a,b) also corresponded closely to local sea level pressure and SST anomaly cores previously identified in these regions [76]. As previously described [49,52], and also suggested by Figure 12a,b, meridional winds play a crucial role in sustaining or modifying these SST anomalies as they transit across the Southern Ocean. The spatial pattern of wind and SST anomalies (Figure 11a–d and Figure 12) also suggests the potentially strong regional influence of the ACC fronts in this region on SST and wind patterns around the islands, likely through air–sea interactions [76,77]. It also provides further evidence that long-term trends observed elsewhere in the Southern Ocean might not necessarily be reflected at the PEIs [4,23,60]. Local and regional interactions between the atmosphere and ocean surface, and subsequent modification of the anomalies, likely explain the low correlations of climate indices with SST, geostrophic currents, and winds at the PEIs [30].
Patterns of SST variability can be driven simultaneously by several oceanic and atmospheric factors, including wind forcing on the surface ocean and the advection by currents [76]. The relationship between SST, wind, and geostrophic currents was, however, not clear at a monthly or seasonal scale (Figure 2, Figure 4 and Figure 5). Although the wavelet coherence spectra showed significant coherence of wind speeds, WSC, and geostrophic current speeds, with SST at periods longer than 12 years (Figure 8a,b, Figure 9, Figures S6 and S7), these signals were not considered statistically significant, due to the relatively short length of the time series. Nevertheless, 5-year running means of geostrophic current, wind speed, and WSC all showed significant inverse correlations with SST (Figure 10 and Figure S8), and provided further evidence of the decadal-scale influence of ACW on these parameters at the PEIs.
Our results indicated that in comparison to wind variations, geostrophic current fluctuations were more strongly related to SST changes (Figure 10). This is in agreement with recent larger-scale studies that demonstrated that the long-term acceleration of zonal flow in the ACC between 48°S and 58°S, associated with warming over the 2006–2019 period, resulted from amplified baroclinicity driven by changes in buoyancy forcing rather than variations in wind stress [61,78,79]. Similar to our findings, [78] also showed that to the north (where the PEIs are located) and south of the 48–58°S region, long-term geostrophic current and warming trends were insignificant and obscured by substantial decadal variability. Here, we posit that these decadal variations are driven by the ACW.
Importantly, while these studies [78,79] have associated increased current speeds with increased upper ocean temperatures, our study showed the opposite pattern, with stronger currents and winds related to cooler conditions at the PEIs. This suggests that variability in SST, winds, and currents at the PEIs is strongly localized, likely as a result of the interaction of the ACC with the island bathymetry, as well as the interaction of the wind field with the island orography. Periods of increased current speed likely drive stronger vertical exchange and cooling through enhanced isopycnal shoaling and turbulent mixing as the ACC interacts with the island bathymetry, while increased wind speeds would also induce cooling through enhanced mixing and by promoting stronger surface divergence and uplift through strengthened negative WSC.

5. Conclusions

Our study used a combination of satellite and reanalysis data to expand the knowledge on the long-term trends and interannual variability of SST, wind, and currents in the ocean region surrounding the PEIs. Importantly, despite their coarse spatial resolution, reanalysis SST and wind products agreed well with in situ observations, giving confidence in the suitability of these data products for the analysis of interannual and longer-term fluctuations. SST was strongly dominated (50–70% of the variance) by seasonal variations, and the lack of statistically significant long-term warming between 1982 and 2020 was likely due to the relatively short length of the time series. In contrast, seasonal fluctuations accounted for much less of the variability in wind (less than 30%) and geostrophic currents (less than 10%), with the strongest variability at intra-annual scales. Similar to SST, winds between 1979 and 2020, and currents (geostrophic and Ekman) between 1993 and 2016 also showed no large statistically significant long-term trends.
Interannual SST and geostrophic current variations at periods of about 1 year suggested some influence of SAM, in agreement with previous studies, but the weak insignificant correlations suggested that longer time series are required to adequately identify the influence of SAM at the PEIs. The influence of ENSO was weak and mostly insignificant, likely due to strong local and regional modification of SST, wind and current anomalies, and spatial correlations also suggested a substantial regional influence of the ACC fronts on SST and wind. Significant interannual and decadal-scale variations in SST, WSC, and geostrophic currents corresponded with ACW variability. Periods of elevated SST between 1990–2001 and 2009–2020 were associated with generally weaker geostrophic currents and winds, while the cooler-than-usual periods during 1982–1990 and 2001–2009 showed correspondingly stronger currents and winds. These decadal variations may have a stronger influence on biological communities than the long-term trends, which are by comparison much smaller, but detailed studies examining such impacts need to be conducted.
The PEIs are located in a region where substantial mesoscale eddy activity, meridional movement of the ACC fronts, and the frequent passage of atmospheric low-pressure systems, results in strong intra-annual variations that are much larger than the longer-term changes. Consequently, the climate signal-to-noise ratio in this region is low [23,80], providing a possible explanation for why the long-term physical changes that have been observed elsewhere in the Southern Ocean were not clearly observed at the PEIs. It also highlights the need for time series observations of sufficient length to be able to adequately discern longer-term variations.

Supplementary Materials

The following supporting information can be downloaded at: https://www.mdpi.com/article/10.3390/rs14061318/s1, Figure S1: Time series of the monthly mean GHRSST (in black) and Remote Sensing Systems Sea Surface Temperature (REMSS; in dashed red) from 1998 to 2020. Figure S2: Time series of the monthly mean (a) reanalysis SST (GHRSST; in black) and in situ SST (in red), and the (b) ERA5 (in black) and in situ (in red) wind speed. Note the different x-axes for SST and wind.; Figure S3: (a) Monthly climatology of 1979–2020 (black) and 1993–2016 (red) Wind Stress Curl (WSC; N m−3) averaged within the 2° × 2° area around the Prince Edward Islands. (b) Time series of the monthly mean WSC. The red dashed line represents the linear trend. (c) Time series of the standardized monthly anomalies of WSC. (d, e) wavelet power spectra of the standardized monthly anomalies of WSC. The 95% confidence level regions are highlighted in red and circled by a black contour. The cross-hatched region is considered insignificant due to the effect of zero padding. The dashed red line on the global wavelet spectrum (on the right) represents the 95% confidence level, and the grey shaded region is insignificant due to zero padding.; Figure S4: Sea level anomalies (m) around the PEIs for the (a) 1st January 1997 and (b) 31st January 1997, illustrating the passage of an anticyclonic eddy (in red) south of the islands. The vectors represent the direction of the geostrophic flow (m s−1). The dashed black line represents the position of the southern sub-Antarctic Front (S-SAF), the solid white line represents the northern Antarctic Polar Front (N-APF), and the dotted white line represents the middle APF (M-APF).; Figure S5: Wavelet power spectra of the standardized monthly anomalies of DUACS DT2018 (a, b) geostrophic current speed, (c, d) Zonal (U) geostrophic current speed component, and the (e, f) meridional (V) geostrophic current speed component. The 95% confidence level regions are highlighted in red and circled by a black contour. The cross-hatched regions are considered insignificant due to the effect of zero padding. The dashed red lines on the global wavelet spectra (on the right) represent the 95% confidence level, and the grey shaded regions are insignificant due to zero padding.; Figure S6: Wavelet coherence between the standardized monthly anomalies of SST and WSC. The relative phase relationships are shown as arrows (with in-phase pointing right, anti-phase pointing left). The 95% confidence level regions are highlighted in red and circled by a black contour. The cross-hatched regions are considered insignificant due to the effect of zero padding.; Figure S7: Wavelet coherence between the standardized monthly anomalies of SST and DUACS DT2018 geostrophic current speed. The relative phase relationships are shown as arrows (with in-phase pointing right, anti-phase pointing left). The 95% confidence level regions are highlighted in red and circled by a black contour. The cross-hatched regions are considered insignificant due to the effect of zero padding. Figure S8: (a) Time series of the 5-year running means of SST (in black) and WSC (in red). (b) The Pearson correlation between the 5-year running means of SST and WSC.; Figure S9: Time series of the 5-year running means of the (a) zonal (U) and (b) meridional (V) wind speed components.

Author Contributions

Conceptualization, T.L.; methodology, T.T. and T.L.; software, T.T. and T.L.; validation, T.T. and T.L.; formal analysis, T.T. and T.L.; investigation, T.T. and T.L.; resources, T.L.; data curation, T.T. and T.L.; writing—original draft preparation, T.T. and T.L.; writing—review and editing, T.T. and T.L.; visualization, T.T.; supervision, T.L.; project administration, T.L.; funding acquisition, T.L. All authors have read and agreed to the published version of the manuscript.

Funding

This research was funded by the Oceans & Coasts Research Branch of the South African Department of Forestry, Fisheries, and the Environment (DFFE), the Nansen–Tutu Centre for Marine Environmental Research, the Bayworld Centre for Research and Education (BCRE), and the South African National Research Foundation (NRF grant: 129229).

Data Availability Statement

The SST data were produced by the Group for High Resolution Sea Surface Temperature (GHRSST), and obtained from the National Centers for the Environmental Information (NCEI) at the Physical Oceanography Distributed Active Archive Center (PO.DAAC, http://podaac.jpl.nasa.gov, accessed on 3 September 2021). ERA5 reanalysis wind speeds were produced by the European Centre for Medium-Range Weather Forecasts (ECMWF), and obtained from https://cds.climate.copernicus.eu/cdsapp#!/dataset/reanalysis-era5-pressurelevels?tab=overview and accessed on 1 September 2021. In situ SST and wind speed observations are available from the South African Weather Services (SAWS). Globcurrent v3.0 geostrophic and Ekman current speeds were obtained from (http://globcurrent.ifremer.fr, accessed on 1 September 2021), and the DUACS DT2018 geostrophic current speeds were provided by the Copernicus Marine Environment Monitoring Service (CMEMS; http://marine.copernicus.eu, accessed on 1 September 2021).

Acknowledgments

The authors wish to thank the Oceans & Coasts Research Branch of the South African Department of Forestry, Fisheries, and the Environment (DFFE) and the Bayworld Centre for Research and Education (BCRE) for administrative and logistical assistance.

Conflicts of Interest

The authors declare no conflict of interest. The funders had no role in the design of the study; in the collection, analyses, or interpretation of data; in the writing of the manuscript, or in the decision to publish the results.

References

  1. Masson-Delmotte, Z.P.; Pirani, A.; Connors, S.L.; Péan, C.; Berger, S.; Caud, N.; Chen, Y.; Goldfarb, L.; Gomis, M.; Huang, M.; et al. IPCC, 2021: Climate Change 2021: The Physical Science Basis. Contribution of Working Group I to the Sixth Assessment Report of the Intergovernmental Panel on Climate Change; Cambridge University Press: Cambridge, UK, 2021; in press. [Google Scholar]
  2. Swart, N.C.; Gille, S.T.; Fyfe, J.C.; Gillett, N.P. Recent Southern Ocean warming and freshening driven by greenhouse gas emissions and ozone depletion. Nat. Geosci. 2018, 11, 836–841. [Google Scholar] [CrossRef]
  3. Fogt, R.L.; Marshall, G.J. The Southern Annular Mode: Variability, trends, and climate impacts across the Southern Hemisphere. WIREs Clim. Change 2020, 11, e652. [Google Scholar] [CrossRef]
  4. Perren, B.B.; Hodgson, D.A.; Roberts, S.J.; Sime, L.; Van Nieuwenhuyze, W.; Verleyen, E.; Vyverman, W. Southward migration of the Southern Hemisphere westerly winds corresponds with warming climate over centennial timescales. Commun. Earth Environ. 2020, 1, 58. [Google Scholar] [CrossRef]
  5. Zambri, B.; Solomon, S.; Thompson, D.W.J.; Fu, Q. Emergence of Southern Hemisphere stratospheric circulation changes in response to ozone recovery. Nat. Geosci. 2021, 14, 638–644. [Google Scholar] [CrossRef]
  6. Sallée, J.-B. Southern Ocean Warming. Oceanography 2018, 31, 52–62. [Google Scholar] [CrossRef] [Green Version]
  7. Kostov, Y.; Marshall, J.; Hausmann, U.; Armour, K.C.; Ferreira, D.; Holland, M.M. Fast and slow responses of Southern Ocean sea surface temperature to SAM in coupled climate models. Clim. Dyn. 2017, 48, 1595–1609. [Google Scholar] [CrossRef] [Green Version]
  8. Rogers, A.; Frinault, B.; Barnes, D.; Bindoff, N.; Downie, R.; Ducklow, H.; Friedlaender, A.; Hart, T.; Hill, S.; Hofmann, E.; et al. Antarctic Futures: An Assessment of Climate-Driven Changes in Ecosystem Structure, Function, and Service Provisioning in the Southern Ocean. Annu. Rev. Mar. Sci. 2020, 12, 87–120. [Google Scholar] [CrossRef] [PubMed] [Green Version]
  9. Ansorge, I.J.; Durgadoo, J.V.; Treasure, A.M. Sentinels to climate change. The need for monitoring at South Africa’s Subantarctic laboratory. South Afr. J. Sci. 2014, 110, 1–4. [Google Scholar] [CrossRef]
  10. Ansorge, I.J.; Lutjeharms, J.R.E. Direct observations of eddy turbulence at a ridge in the Southern Ocean. Geophys. Res. Lett. 2005, 32, 1–4. [Google Scholar] [CrossRef]
  11. Durgadoo, J.V.; Ansorge, I.J.; Lutjeharms, J.R. Oceanographic observations of eddies impacting the Prince Edward Islands, South Africa. Antarct. Sci. 2010, 22, 211–219. [Google Scholar] [CrossRef]
  12. Lamont, T.; van den Berg, M.A. Mesoscale eddies influencing the sub-Antarctic Prince Edward Islands Archipelago: Origin, pathways, and characteristics. Cont. Shelf Res. 2020, 210, 104257. [Google Scholar] [CrossRef]
  13. Lamont, T.; van den Berg, M.A. Mesoscale eddies influencing the sub-Antarctic Prince Edward Islands archipelago: Temporal variability and impact. Cont. Shelf Res. 2020, 212, 104309. [Google Scholar] [CrossRef]
  14. Bost, C.; Cotté, C.; Bailleul, F.; Cherel, Y.; Charrassin, J.; Guinet, C.; Ainley, D.; Weimerskirch, H. The importance of oceanographic fronts to marine birds and mammals of the southern oceans. J. Mar. Syst. 2009, 78, 363–376. [Google Scholar] [CrossRef]
  15. Stukel, M.R.; Aluwihare, L.I.; Barbeau, K.; Chekalyuk, A.M.; Goericke, R.; Miller, A.; Ohman, M.D.; Ruacho, A.; Song, H.; Stephens, B.; et al. Mesoscale ocean fronts enhance carbon export due to gravitational sinking and subduction. Proc. Natl. Acad. Sci. USA 2017, 114, 1252–1257. [Google Scholar] [CrossRef] [PubMed] [Green Version]
  16. Carpenter-Kling, T.; Reisinger, R.R.; Orgeret, F.; Connan, M.; Stevens, K.L.; Ryan, P.G.; Makhado, A.; Pistorius, P.A. Foraging in a dynamic environment: Response of four sympatric sub-Antarctic albatross species to interannual environmental variability. Ecol. Evol. 2020, 10, 11277–11295. [Google Scholar] [CrossRef]
  17. Ryan, P.G.; Bester, M.N. Pelagic predators. In The Prince Edward Islands. Land-Sea Interactions in a Changing Ecosystem; Chown, S.L., Froneman, P.W., Eds.; African Sun Media: Stellenbosch, South Africa, 2008; pp. 121–164. ISBN 978-1-920109-85-1. [Google Scholar]
  18. Allan, E.L.; Froneman, W.; Durgadoo, J.; McQuaid, C.; Ansorge, I.J.; Richoux, N. Critical indirect effects of climate change on sub-Antarctic ecosystem functioning. Ecol. Evol. 2013, 3, 2994–3004. [Google Scholar] [CrossRef] [Green Version]
  19. Hofmeyr, G.J.G.; Bester, M.N.; Makhado, A.B.; Pistorius, P.A. Population changes in Subantarctic and Antarctic fur seals at Marion Island: Research article. S. Afr. J. Wildl. Res. 2006, 36, 55–68. [Google Scholar]
  20. Mélice, J.-L.; Lutjeharms, J.R.E.; Rouault, M.; Ansorge, I.J. Sea-surface temperatures at the sub-Antarctic islands Marion and Gough during the past 50 years. S. Afr. J. Sci. 2003, 99, 363–366. [Google Scholar]
  21. Mélice, J.-L.; Lutjeharms, J.R.E.; Goosse, H.; Fichefet, T.; Reason, C.J.C. Evidence for the Antarctic circumpolar wave in the sub-Antarctic during the past 50 years. Geophys. Res. Lett. 2005, 32. [Google Scholar] [CrossRef]
  22. Rouault, M.; Mélice, J.; Reason, C.J.C.; Lutjeharms, J.R.E. Climate variability at Marion Island, Southern Ocean, since 1960. J. Geophys. Res. Earth Surf. 2005, 110. [Google Scholar] [CrossRef] [Green Version]
  23. Richard, Y.; Rouault, M.; Pohl, B.; Crétat, J.; Duclot, I.; Taboulot, S.; Reason, C.J.C.; Macron, C.; Buiron, D. Temperature changes in the mid- and high- latitudes of the Southern Hemisphere. Int. J. Clim. 2013, 33, 1948–1963. [Google Scholar] [CrossRef]
  24. Shangheta, A.L. Long Term Climate Variability at the Prince Edward Islands in the Southern Ocean. Master’s Thesis, University of Cape Town, Cape Town, South Africa, 2021. [Google Scholar]
  25. Smith, V.R. Climate Change in the Sub-Antarctic: An Illustration from Marion Island. Clim. Change 2002, 52, 345–357. [Google Scholar] [CrossRef]
  26. Le Roux, P.C.; McGeoch, M.A. Changes in climate extremes, variability and signature on sub-Antarctic Marion Island. Clim. Change 2008, 86, 309–329. [Google Scholar] [CrossRef]
  27. Lamont, T.; Tutt, G.; Barlow, R. Phytoplankton biomass and photophysiology at the sub-Antarctic Prince Edward Islands ecosystem in the Southern Ocean. J. Mar. Syst. 2022, 226, 103699. [Google Scholar] [CrossRef]
  28. Lamont, T.; van den Berg, M.A.; Tutt, G.C.O.; Ansorge, I.J. Impact of deep-ocean eddies and fronts on the shelf seas of a sub-Antarctic Archipelago: The Prince Edward Islands. Cont. Shelf Res. 2019, 177, 1–14. [Google Scholar] [CrossRef]
  29. Toolsee, T.; Lamont, T.; Rouault, M.; Ansorge, I. Characterising the seasonal cycle of wind forcing, surface circulation and temperature around the sub-Antarctic Prince Edward Islands. Afr. J. Mar. Sci. 2021, 43, 61–76. [Google Scholar] [CrossRef]
  30. Toolsee, T. Interannual Variability and Long-Term Trends of Surface Hydrography around the Prince Edward Island Archipelago, Southern Ocean. Master’s Thesis, University of Cape Town, Cape Town, South Africa, 2021, unpublished. [Google Scholar]
  31. NOAA National Centers for Environmental Information (NCEI); US National Climatic Data Center (NCDC). GHRSST Level 4 AVHRR_OI Global Blended Sea Surface Temperature Analysis from NCEI (GDS versions 1 and 2). NOAA National Centers for Environmental Information. Dataset. 2007. Available online: https://www.ncei.noaa.gov/archive/accession/GHRSST-AVHRR_OI-NCEI-L4-GLOB (accessed on 3 September 2021).
  32. Reynolds, R.W.; Smith, T.M.; Liu, C.; Chelton, D.B.; Casey, K.S.; Schlax, M.G. Daily High-Resolution-Blended Analyses for Sea Surface Temperature. J. Clim. 2007, 20, 5473–5496. [Google Scholar] [CrossRef]
  33. Wentz, F.J.; Gentemann, C.; Smith, D.; Chelton, D. Satellite Measurements of Sea Surface Temperature Through Clouds. Science 2000, 288, 847–850. [Google Scholar] [CrossRef] [Green Version]
  34. Hersbach, H.; Bell, B.; Berrisford, P.; Hirahara, S.; Horanyi, A.; Muñoz-Sabater, J.; Nicolas, J.; Peubey, C.; Radu, R.; Schepers, D.; et al. The ERA5 global reanalysis. Q. J. R. Meteorol. Soc. 2020, 146, 1999–2049. [Google Scholar] [CrossRef]
  35. O’Neill, L.W.; Chelton, D.B.; Esbensen, S.K. Observations of SST-Induced Perturbations of the Wind Stress Field over the Southern Ocean on Seasonal Timescales. J. Clim. 2003, 16, 2340–2354. [Google Scholar] [CrossRef] [Green Version]
  36. Risien, C.M.; Chelton, D.B. A Global Climatology of Surface Wind and Wind Stress Fields from Eight Years of QuikSCAT Scatterometer Data. J. Phys. Oceanogr. 2008, 38, 2379–2413. [Google Scholar] [CrossRef]
  37. Rio, M.-H.; Mulet, S.; Picot, N. Beyond GOCE for the ocean circulation estimate: Synergetic use of altimetry, gravimetry, and in situ data provides new insight into geostrophic and Ekman currents. Geophys. Res. Lett. 2014, 41, 8918–8925. [Google Scholar] [CrossRef]
  38. Taburet, G.; Sanchez-Roman, A.; Ballarotta, M.; Pujol, M.-I.; Legeais, J.-F.; Fournier, F.; Faugere, Y.; Dibarboure, G. DUACS DT2018: 25 years of reprocessed sea level altimetry products. Ocean Sci. 2019, 15, 1207–1224. [Google Scholar] [CrossRef] [Green Version]
  39. Oh, J.; Jung, Y. Local climate impacts of dipole-like sea surface temperature oscillations in the Southern Hemisphere. J. Water Clim. Change 2021, 12, 311–324. [Google Scholar] [CrossRef] [Green Version]
  40. Ferster, B.S.; Subrahmanyam, B.; Macdonald, A.M. Confirmation of ENSO-Southern Ocean Teleconnections Using Satellite-Derived SST. Remote Sens. 2018, 10, 331. [Google Scholar] [CrossRef] [Green Version]
  41. Lee, G.; Gommers, R.; Waselewski, F.; Wohlfahrt, K.; O’Leary, A. PyWavelets: A Python package for wavelet analysis. J. Open Source Softw. 2019, 4, 1237. [Google Scholar] [CrossRef]
  42. Torrence, C.; Compo, G.P. A practical guide to wavelet analysis. Bull. Amer. Meteor. Soc. 1998, 79, 61–78. [Google Scholar] [CrossRef] [Green Version]
  43. Liu, Y.; Liang, X.S.; Weisberg, R.H. Rectification of the Bias in the Wavelet Power Spectrum. J. Atmospheric Ocean. Technol. 2007, 24, 2093–2102. [Google Scholar] [CrossRef]
  44. Grinsted, A.; Moore, J.C.; Jevrejeva, S. Application of the cross wavelet transform and wavelet coherence to geophysical time series. Nonlinear Process. Geophys. 2004, 11, 561–566. [Google Scholar] [CrossRef]
  45. Sinha, M.; Jha, S.; Chakraborty, P. Indian Ocean wind speed variability and global teleconnection patterns. Oceanologia 2020, 62, 126–138. [Google Scholar] [CrossRef]
  46. Murphy, E.J.; Trathan, P.N.; Watkins, J.L.; Reid, K.; Meredith, M.P.; Forcada, J.; Thorpe, S.; Johnston, N.M.; Rothery, P. Climatically driven fluctuations in Southern Ocean ecosystems. Proc. R. Soc. B Boil. Sci. 2007, 274, 3057–3067. [Google Scholar] [CrossRef] [PubMed] [Green Version]
  47. Thomalla, S.J.; Fauchereau, N.; Swart, S.; Monteiro, P.M.S. Regional scale characteristics of the seasonal cycle of chlorophyll in the Southern Ocean. Biogeosciences 2011, 8, 2849–2866. [Google Scholar] [CrossRef] [Green Version]
  48. Luis, A.J.; Pandey, P.C. Seasonal variability of QSCAT-derived wind stress over the Southern Ocean. Geophys. Res. Lett. 2004, 31, L13304. [Google Scholar] [CrossRef]
  49. Meredith, M.P.; Murphy, E.J.; Hawker, E.J.; King, J.C.; Wallace, M.I. On the interannual variability of ocean temperatures around South Georgia, Southern Ocean: Forcing by El Niño/Southern Oscillation and the Southern Annular Mode. Deep Sea Res. Part II Top. Stud. Oceanogr. 2008, 55, 2007–2022. [Google Scholar] [CrossRef] [Green Version]
  50. Hogg, R.V.; McKean, J.; Craig, A.T. Introduction to Mathematical Statistics, 7th ed.; Pearson Education: Harlow, UK, 2014; ISBN 978-1-292-02499-8. [Google Scholar]
  51. Sokolov, S.; Rintoul, S. Circumpolar structure and distribution of the Antarctic Circumpolar Current fronts: 1. Mean circumpolar paths. J. Geophys. Res. Earth Surf. 2009, 114, 1–15. [Google Scholar] [CrossRef]
  52. Wang, X.; Giannakis, D.; Slawinska, J. The Antarctic circumpolar wave and its seasonality: Intrinsic travelling modes and El Niño-Southern Oscillation teleconnections. Int. J. Clim. 2018, 39, 1026–1040. [Google Scholar] [CrossRef]
  53. Cooke, R.S.C.; Eigenbrod, F.; Bates, A.E. Projected losses of global mammal and bird ecological strategies. Nat. Commun. 2019, 10, 1–8. [Google Scholar] [CrossRef] [Green Version]
  54. Martin, M.; Dash, P.; Ignatov, A.; Banzon, V.; Beggs, H.; Brasnett, B.; Cayula, J.-F.; Cummings, J.; Donlon, C.; Gentemann, C.; et al. Group for High Resolution Sea Surface temperature (GHRSST) analysis fields inter-comparisons. Part 1: A GHRSST multi-product ensemble (GMPE). Deep Sea Res. Part II Top. Stud. Oceanogr. 2012, 77, 21–30. [Google Scholar] [CrossRef]
  55. Dash, P.; Ignatov, A.; Martin, M.; Donlon, C.; Brasnett, B.; Reynolds, R.W.; Banzon, V.; Beggs, H.; Cayula, J.-F.; Chao, Y.; et al. Group for High Resolution Sea Surface Temperature (GHRSST) analysis fields inter-comparisons—Part 2: Near real time web-based level 4 SST Quality Monitor (L4-SQUAM). Deep Sea Res. Part II Top. Stud. Oceanogr. 2012, 77-80, 31–43. [Google Scholar] [CrossRef] [Green Version]
  56. Henson, S.A.; Beaulieu, C.; Lampitt, R.S. Observing climate change trends in ocean biogeochemistry: When and where. Glob. Change Biol. 2016, 22, 1561–1571. [Google Scholar] [CrossRef] [Green Version]
  57. Auger, M.; Morrow, R.; Kestenare, E.; Sallée, J.-B.; Cowley, R. Southern Ocean in-situ temperature trends over 25 years emerge from interannual variability. Nat. Commun. 2021, 12, 514. [Google Scholar] [CrossRef] [PubMed]
  58. Liu, W.; University of California Riverside; Xie, S.-P. An Ocean View of the Global Surface Warming Hiat. Oceanography 2018, 31, 72–79. [Google Scholar] [CrossRef] [Green Version]
  59. Jacka, T.H.; Budd, W.F.; Holder, A. A further assessment of surface temperature changes at stations in the Antarctic and Southern Ocean, 1949–2002. Ann. Glaciol. 2004, 39, 331–338. [Google Scholar] [CrossRef] [Green Version]
  60. Thomas, J.L.; Waugh, D.W.; Gnanadesikan, A. Southern Hemisphere extratropical circulation: Recent trends and natural variability. Geophys. Res. Lett. 2015, 42, 5508–5515. [Google Scholar] [CrossRef]
  61. Liau, J.-R.; Chao, B.F. Variation of Antarctic circumpolar current and its intensification in relation to the southern annular mode detected in the time-variable gravity signals by GRACE satellite. Earth Planets Space 2017, 69, 93. [Google Scholar] [CrossRef]
  62. Kim, Y.S.; Orsi, A.H. On the Variability of Antarctic Circumpolar Current Fronts Inferred from 1992–2011 Altimetry*. J. Phys. Oceanogr. 2014, 44, 3054–3071. [Google Scholar] [CrossRef]
  63. Shao, A.E.; Gille, S.T.; Mecking, S.; Thompson, L. Properties of the Subantarctic Front and Polar Front from the skewness of sea level anomaly. J. Geophys. Res. Oceans 2015, 120, 5179–5193. [Google Scholar] [CrossRef] [Green Version]
  64. Chapman, C.C. New Perspectives on Frontal Variability in the Southern Ocean. J. Phys. Oceanogr. 2017, 47, 1151–1168. [Google Scholar] [CrossRef]
  65. Ansorge, I.; Durgadoo, J.; Pakhomov, E. Dynamics of physical and biological systems of the Prince Edward Islands in a changing climate. Pap. Proc. R. Soc. Tasman. 2009, 143, 15–18. [Google Scholar] [CrossRef]
  66. Asdar, S. Climate Change Impact on Ecosystems of Prince Edward Islands: Role of Oceanic Mesoscale Processes. Ph.D. Thesis, University of Cape Town, Cape Town, South Africa, 2019, unpublished. [Google Scholar]
  67. Bitz, C.M.; Polvani, L.M. Antarctic climate response to stratospheric ozone depletion in a fine resolution ocean climate model. Geophys. Res. Lett. 2012, 39, L20705. [Google Scholar] [CrossRef] [Green Version]
  68. Meehl, G.A.; Hurrell, J.W.; Van Loon, H. A modulation of the mechanism of the semiannual oscillation in the Southern Hemisphere. Tellus A Dyn. Meteorol. Oceanogr. 1998, 50, 442–450. [Google Scholar] [CrossRef]
  69. White, W.B.; Peterson, R.G. An Antarctic circumpolar wave in surface pressure, wind, temperature and sea-ice extent. Nature 1996, 380, 699–702. [Google Scholar] [CrossRef]
  70. Cerrone, D.; Fusco, G.; Cotroneo, Y.; Simmonds, I.; Budillon, G. The Antarctic Circumpolar Wave: Its Presence and Interdecadal Changes during the Last 142 Years. J. Clim. 2017, 30, 6371–6389. [Google Scholar] [CrossRef]
  71. White, W.B. Comments on “Synchronous Variability in the Southern Hemisphere Atmosphere, Sea Ice, and Ocean Resulting from the Annular Mode”. J. Clim. 2004, 17, 2249–2254. [Google Scholar] [CrossRef]
  72. Hu, S.; Zhang, W.; Turner, A.G.; Sun, J. How does El Niño-Southern Oscillation affect winter fog frequency over eastern China? Clim. Dyn. 2020, 54, 1043–1056. [Google Scholar] [CrossRef]
  73. Lu, Z.; Liu, Z.; Zhu, J.; Cobb, K.M. A Review of Paleo El Niño-Southern Oscillation. Atmosphere 2018, 9, 130. [Google Scholar] [CrossRef] [Green Version]
  74. McPhaden, M.J. Genesis and Evolution of the 1997-98 El Niño. Science 1999, 283, 950–954. [Google Scholar] [CrossRef] [Green Version]
  75. Shabbar, A.; Yu, B. The 1998–2000 La Niña in the context of historically strong La Niña events. J. Geophys. Res. Earth Surf. 2009, 114, 13105. [Google Scholar] [CrossRef] [Green Version]
  76. Deser, C.; Phillips, A.S. Atmospheric Circulation Trends, 1950–2000: The Relative Roles of Sea Surface Temperature Forcing and Direct Atmospheric Radiative Forcing. J. Clim. 2009, 22, 396–413. [Google Scholar] [CrossRef] [Green Version]
  77. Fauchereau, N.; Trzaska, S.; Richard, Y.; Roucou, P.; Camberlin, P. Sea-surface temperature co-variability in the Southern Atlantic and Indian Oceans and its connections with the atmospheric circulation in the Southern Hemisphere. Int. J. Clim. 2003, 23, 663–677. [Google Scholar] [CrossRef]
  78. Shi, J.-R.; Talley, L.D.; Xie, S.-P.; Peng, Q.; Liu, W. Ocean warming and accelerating Southern Ocean zonal flow. Nat. Clim. Change 2021, 11, 1–8. [Google Scholar] [CrossRef]
  79. Roemmich, D.; Church, A.J.; Gilson, J.; Monselesan, D.; Sutton, P.; Wijffels, S. Unabated planetary warming and its ocean structure since 2006. Nat. Clim. Change 2015, 5, 240–245. [Google Scholar] [CrossRef]
  80. Hawkins, E.; Frame, D.; Harrington, L.; Joshi, M.; King, A.; Rojas, M.; Sutton, R. Observed Emergence of the Climate Change Signal: From the Familiar to the Unknown. Geophys. Res. Lett. 2020, 47, e2019GL086259. [Google Scholar] [CrossRef] [Green Version]
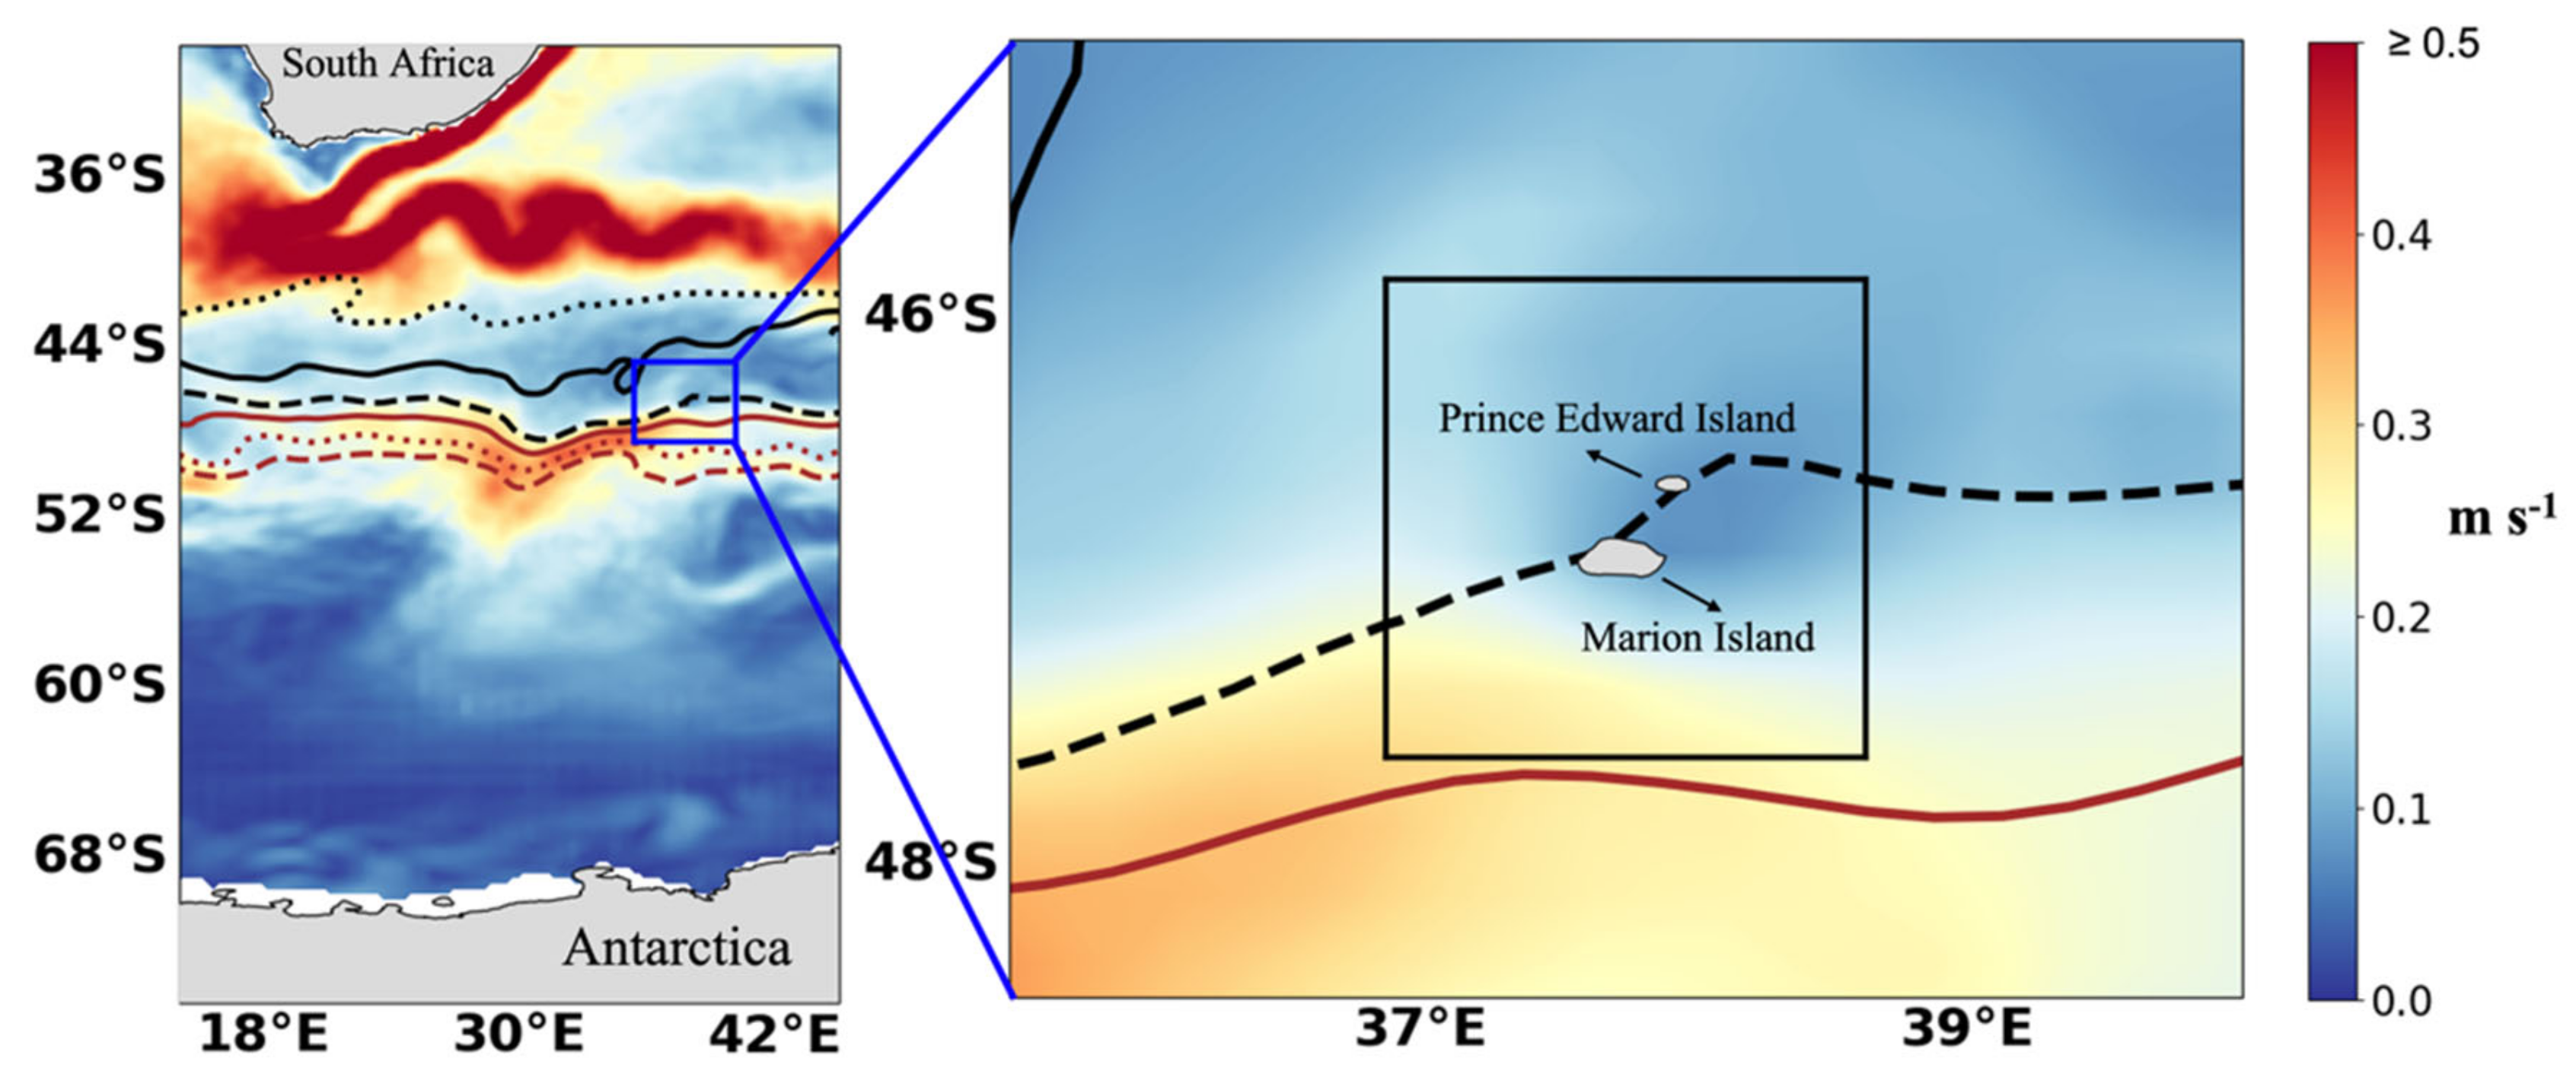
Figure 1. Long-term mean surface geostrophic current speed (m s−1) between South Africa and Antarctica showing the position of the Prince Edward Islands. The northern, middle, and southern branches of the sub-Antarctic Front are shown as black dotted (N-SAF), solid (M-SAF) and dashed (S-SAF) lines, respectively. The northern, middle, and southern branches of the Antarctic Polar Front are shown as brown solid (N-APF), dotted (M-APF), and dashed (S-APF) lines, respectively. The black box indicates the 2° × 2° area over which data were averaged to determine long-term trends and interannual variations.
Remotesensing 14 01318 g001
Figure 2. The monthly climatology of the (a) 1982–2020 (black) and 1993–2016 (red) Sea Surface Temperature (SST); (b) 1979–2020 (black) and 1993–2016 (red) wind speed; (c) 1979–2020 (black) and 1993–2016 (red) zonal (U) wind speed component; (d) 1979–2020 (black) and 1993–2016 (red) meridional (V) wind speed component; (e) 1993–2016 geostrophic current speed; (f) 1993–2016 zonal (U) geostrophic current speed component; and (g) 1993–2016 meridional (V) geostrophic current speed component, averaged within the 2° × 2° area around the Prince Edward Islands.
Remotesensing 14 01318 g002
Figure 3. The percentage (%) variance explained by the seasonal cycle of (a) Sea Surface Temperature, (b) wind speed, (c) geostrophic current speed, and (d) Ekman current speed.
Remotesensing 14 01318 g003
Figure 4. Time series of the monthly mean (a) Sea Surface Temperature (SST), (b) Wind speed (c) Zonal (in black) and meridional (in orange) wind speed components, (d) Geostrophic (in black) and Ekman (in orange) current speeds, and (e) Zonal (in black) and meridional (in orange) geostrophic current speed components. The red dashed lines represent the linear trends of each time series.
Remotesensing 14 01318 g004
Figure 5. Time series of the standardized monthly anomalies of (a) Sea Surface Temperature (SST), (b) Wind speed, (c) Zonal (in black) and meridional (in orange) wind speed components, (d) Geostrophic (in black) and Ekman (in orange) current speeds, and (e) Zonal (in black) and meridional (in orange) geostrophic current speed components.
Remotesensing 14 01318 g005
Figure 6. Wavelet power spectra of the standardized monthly anomalies of (a,b) Sea Surface Temperature (SST), (c,d) Wind speed, (e,f) Geostrophic current speed and (g,h) Ekman current speed. The 95% confidence level regions are highlighted in red and circled by a black contour. The cross-hatched regions are considered insignificant due to the effect of zero padding. The dashed red lines on the global wavelet spectra (on the right) represent the 95% confidence level, and the grey shaded regions are insignificant due to zero padding.
Remotesensing 14 01318 g006
Figure 7. Wavelet power spectra of the standardized monthly anomalies of (a,b) Zonal (U) wind speed, (c,d) Meridional (V) wind speed, (e,f) Zonal (U) geostrophic current speed and (g,h) Meridional (V) geostrophic current speed. The 95% confidence level regions are highlighted in red and circled by a black contour. The cross-hatched regions are considered insignificant due to the effect of zero padding. The dashed red lines on the global wavelet spectra (on the right) represent the 95% confidence level, and the grey shaded regions are insignificant due to zero padding.
Remotesensing 14 01318 g007
Figure 8. The wavelet coherence between standardized monthly anomalies of (a) Sea Surface Temperature (SST) and wind speed, (b) SST and geostrophic current speed, (c) SST and Ekman current speed, and (d) Wind speed and Ekman current speed. Note the different time series lengths. The relative phase relationships are shown as arrows (with in-phase pointing right, anti-phase pointing left). The 95% confidence level regions are highlighted in red and circled by a black contour. The cross-hatched regions are insignificant due to the effect of zero padding.
Remotesensing 14 01318 g008
Figure 9. The wavelet coherence between standardized monthly anomalies of (a) Sea Surface Temperature (SST) and zonal (U) wind speed, (b) SST and meridional (V) wind speed, (c) SST and zonal (U) geostrophic current speed, and (d) SST and meridional (V) geostrophic current. Note the different time series lengths. The relative phase relationships are shown as arrows (with in-phase pointing right, anti-phase pointing left). The 95% confidence level regions are highlighted in red and circled by a black contour. The cross-hatched regions are insignificant due to the effect of zero padding.
Remotesensing 14 01318 g009
Figure 10. Time series of the 5-year running means of Sea Surface Temperature (SST) (in black) and (a) geostrophic speed (in red), and (b) wind speed (in red). The Pearson Correlation between the 5-year running means of (c) SST and geostrophic current, and (d) SST and wind speed (in black), excluding the years 1991 to 2001 (in green). Note the different x-axes for panels (a) and (b).
Remotesensing 14 01318 g010
Figure 11. Maps of the significant correlation (p-value < 0.05) between (a) Sea Surface Temperature (SST) anomalies at the Prince Edward Islands (PEIs) and the SST anomalies across the global ocean, (c) wind speed anomalies at the PEIs and across the global ocean, (e) geostrophic current speed anomalies at the PEIs and across the global ocean. The black box indicates the zoomed regions in panels b, d, and f. The zoomed maps show the regions of strong correlation (−0.3 < R > 0.3) for (b) SST anomalies, (d) wind speed anomalies, and (f) geostrophic current anomalies around the PEIs. The yellow box indicates the 2° × 2° area around the PEIs within which data were averaged for time series analysis.
Remotesensing 14 01318 g011
Figure 12. Maps of the significant correlation (p-value < 0.05) between (a) meridional wind speed anomalies at the Prince Edward Islands (PEIs) and the meridional wind speed anomalies across the global ocean, (c) zonal wind speed anomalies at the PEIs and across the global ocean. The black box indicates the zoomed region in panels b and d. The zoomed maps show the regions of strong correlation (−0.3 < R > 0.3) for (b) meridional wind speed anomalies, and (d) zonal wind speed anomalies around the PEIs. The yellow box indicates the 2° × 2° area around the PEIs within which data were averaged for time series analysis.
Remotesensing 14 01318 g012
Figure 13. Maps of the significant correlation (p-value < 0.05) between (a) zonal geostrophic current anomalies at the Prince Edward Islands (PEIs) and the zonal geostrophic current anomalies across the global ocean, (c) meridional geostrophic current anomalies at the PEIs and across the global ocean. The zoomed maps show the regions of strong correlation (−0.3 < R > 0.3) region for (b) zonal geostrophic current anomalies, and (d) meridional geostrophic current anomalies around the PEIs. The yellow box indicates the 2° × 2° area around the PEIs within which data were averaged for time series analysis.
Remotesensing 14 01318 g013
Publisher’s Note: MDPI stays neutral with regard to jurisdictional claims in published maps and institutional affiliations.