Machine Learning-Based Approaches for Predicting SPAD Values of Maize Using Multi-Spectral Images
Abstract
1. Introduction
2. Materials and Methods
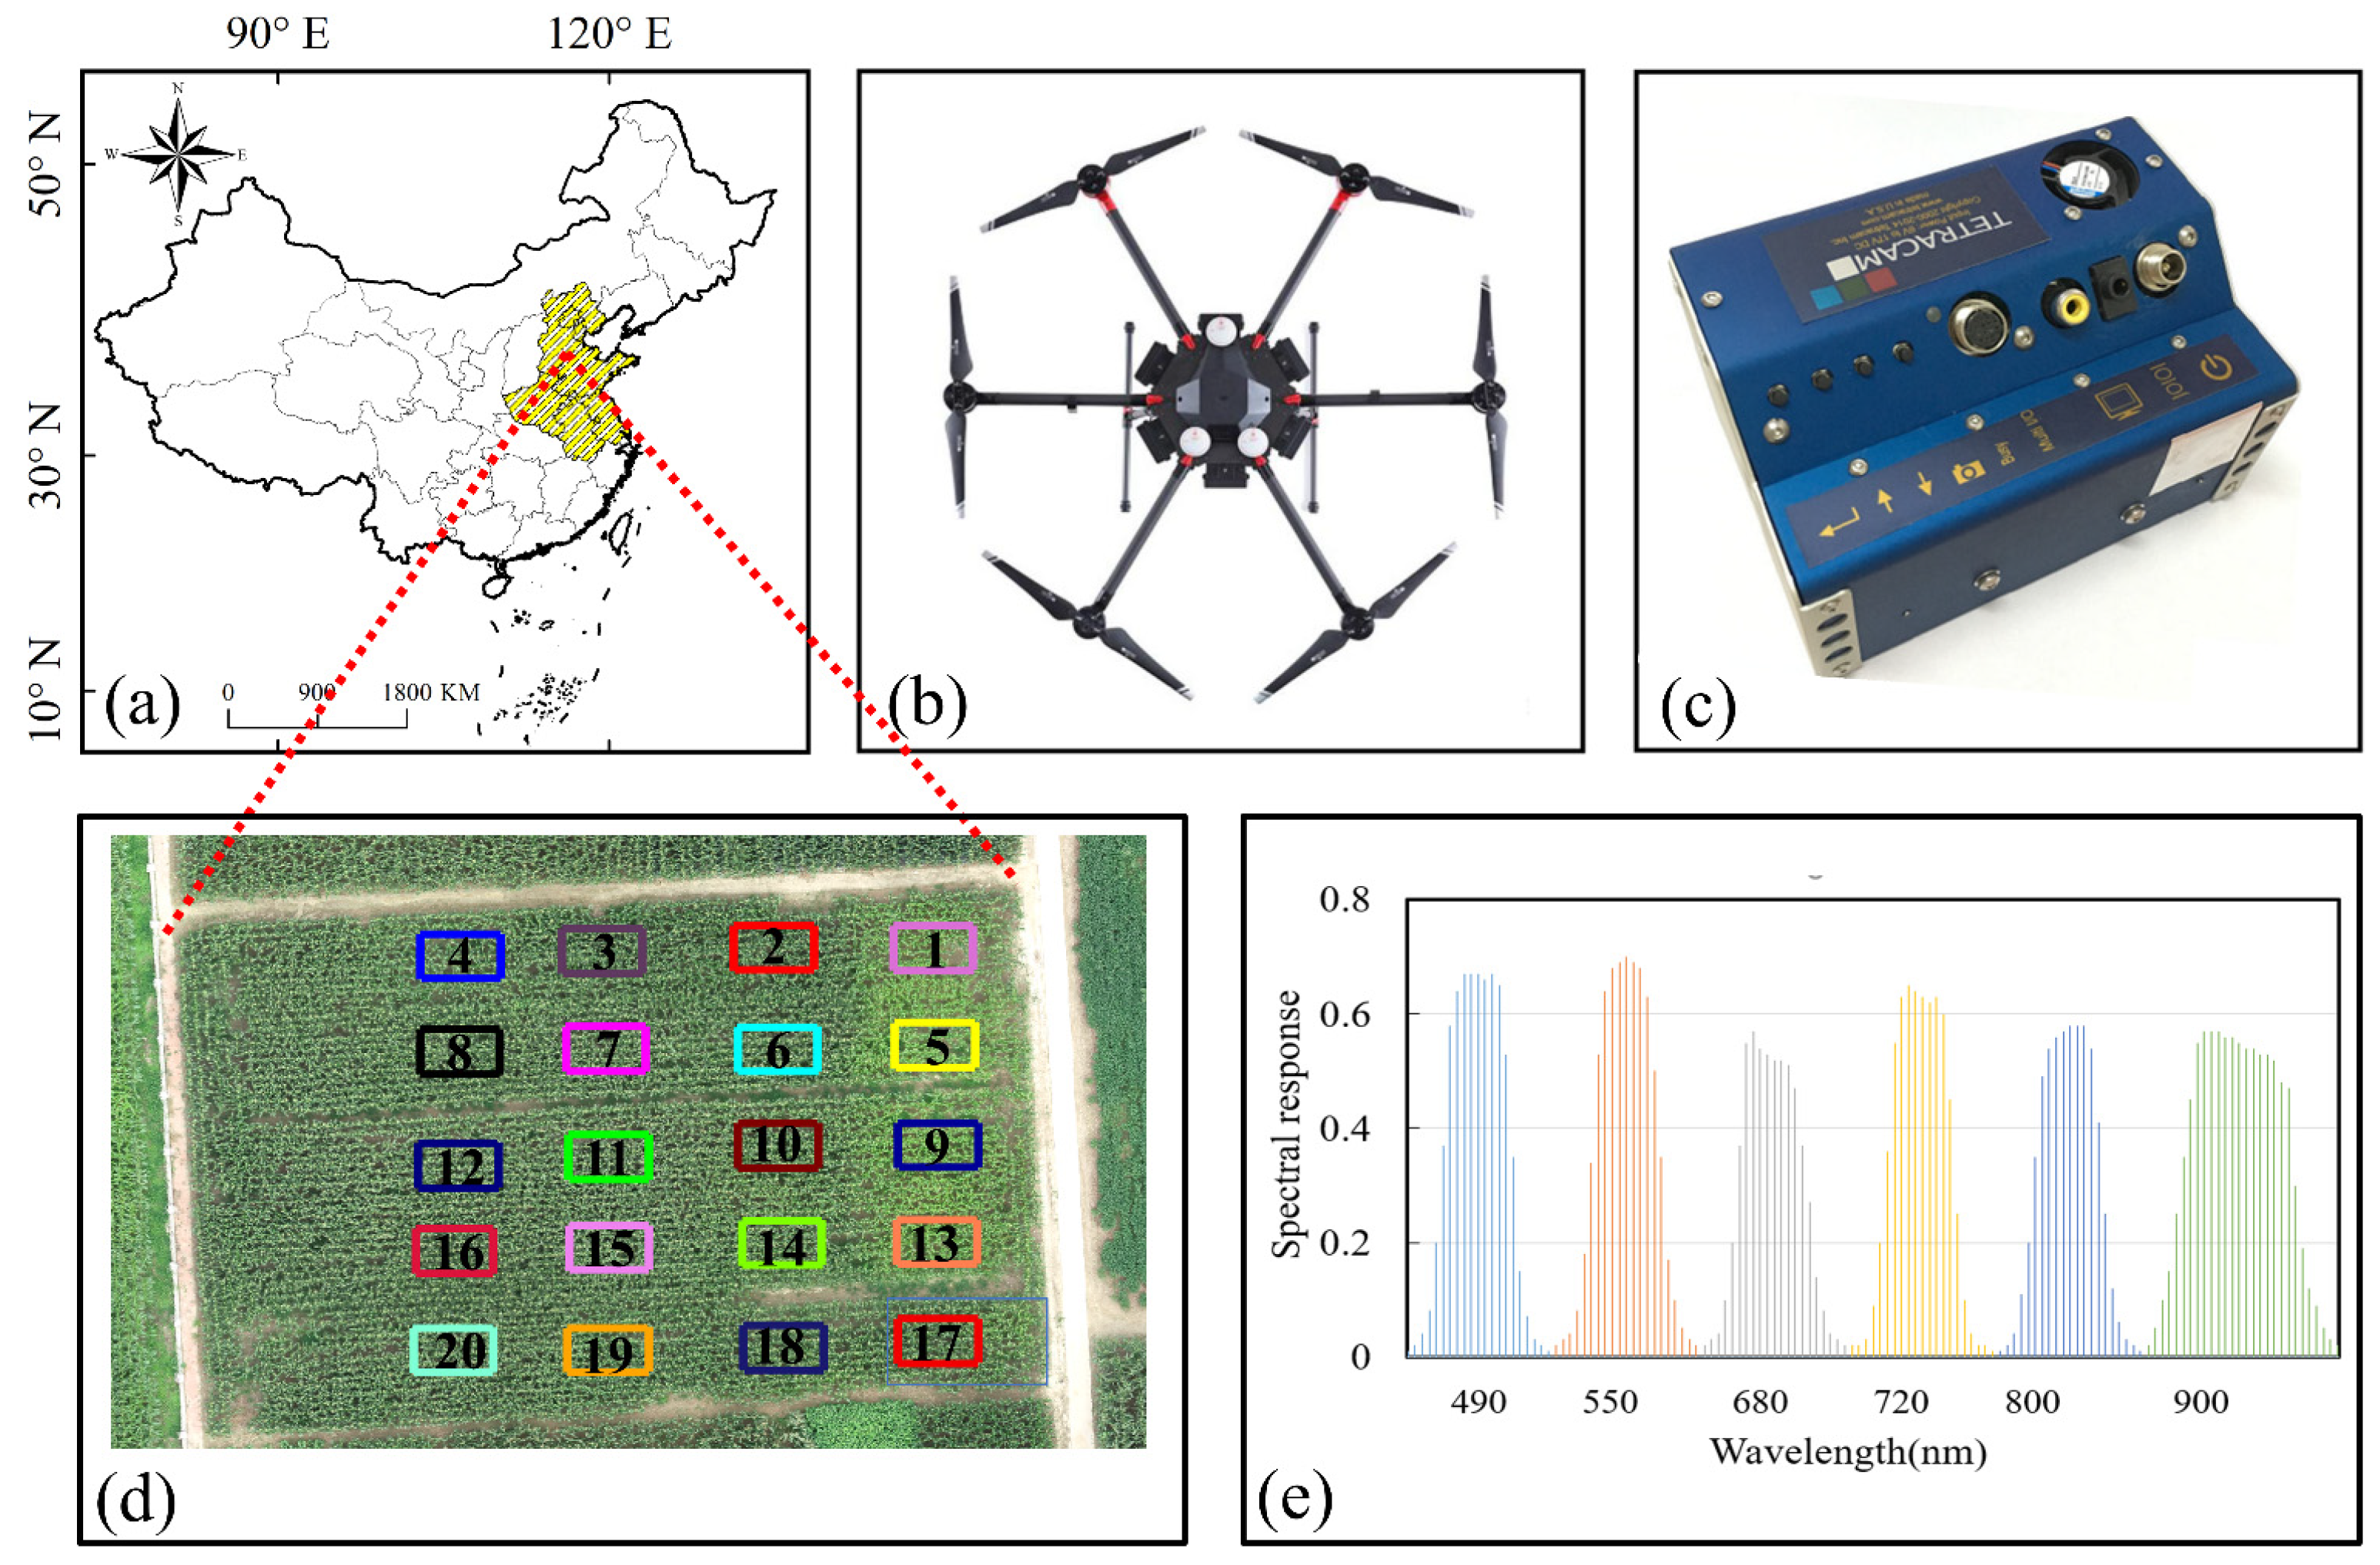
2.1. Study Area
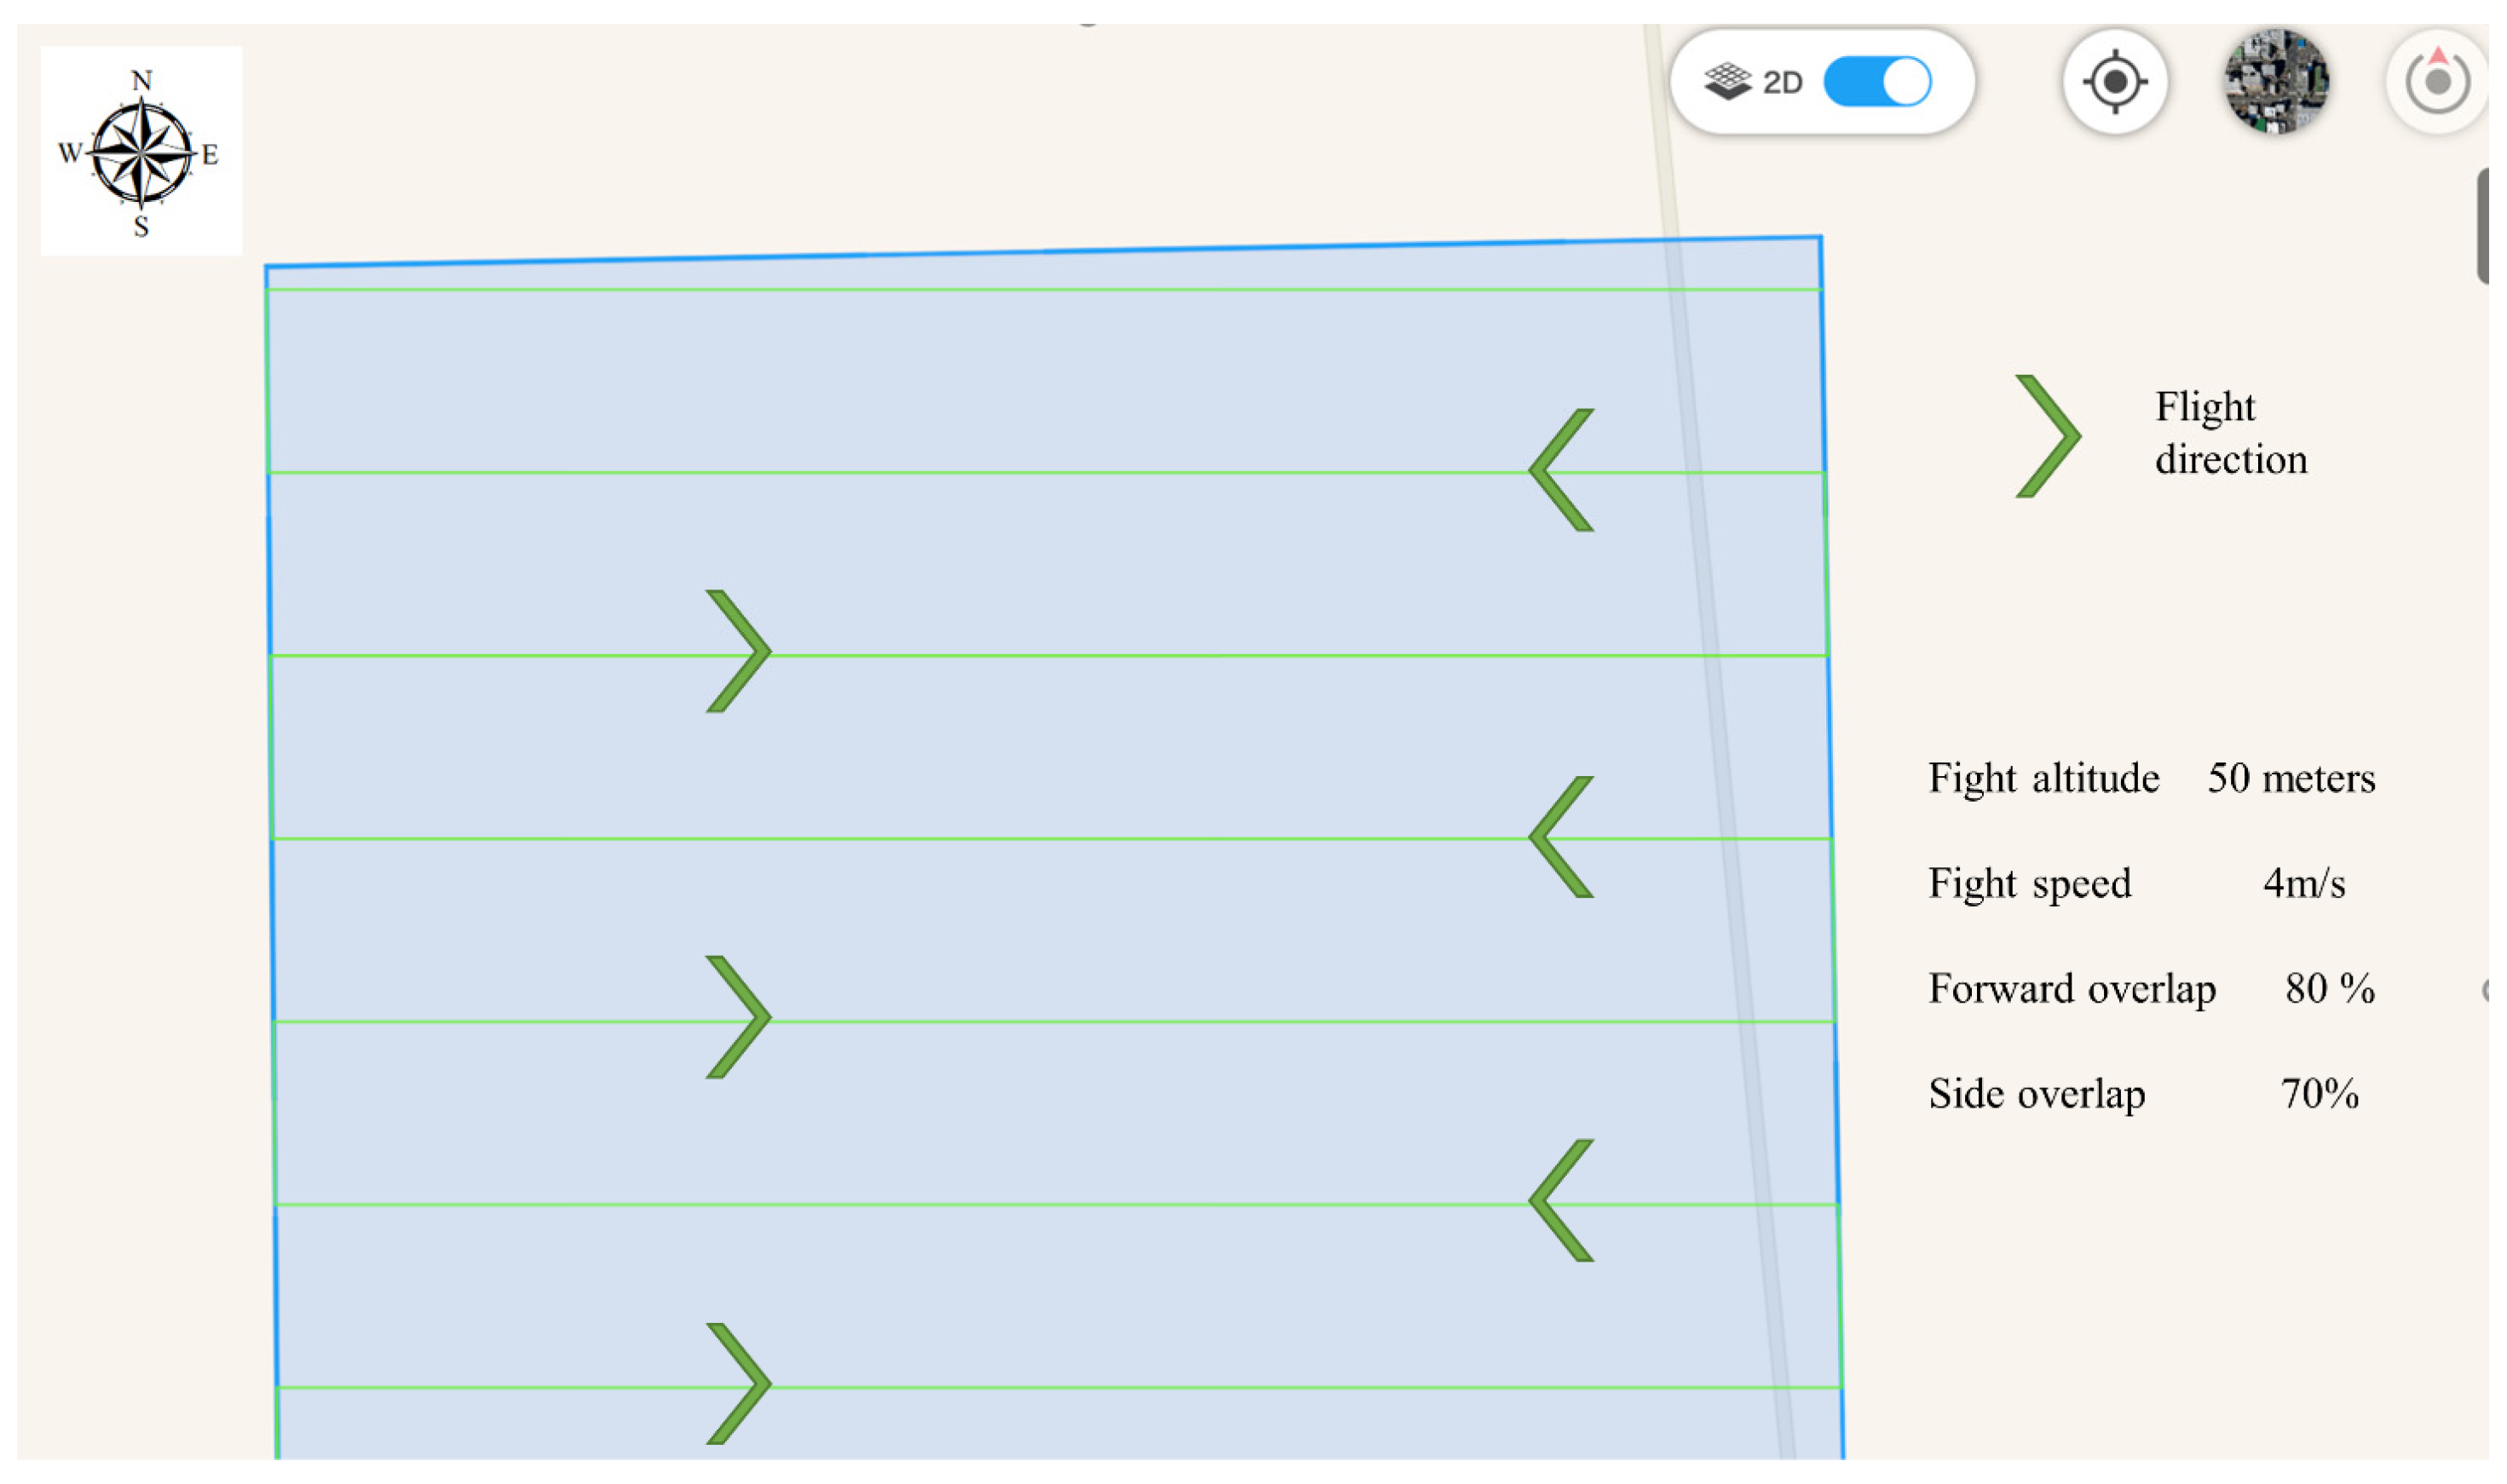
2.2. Data Collection
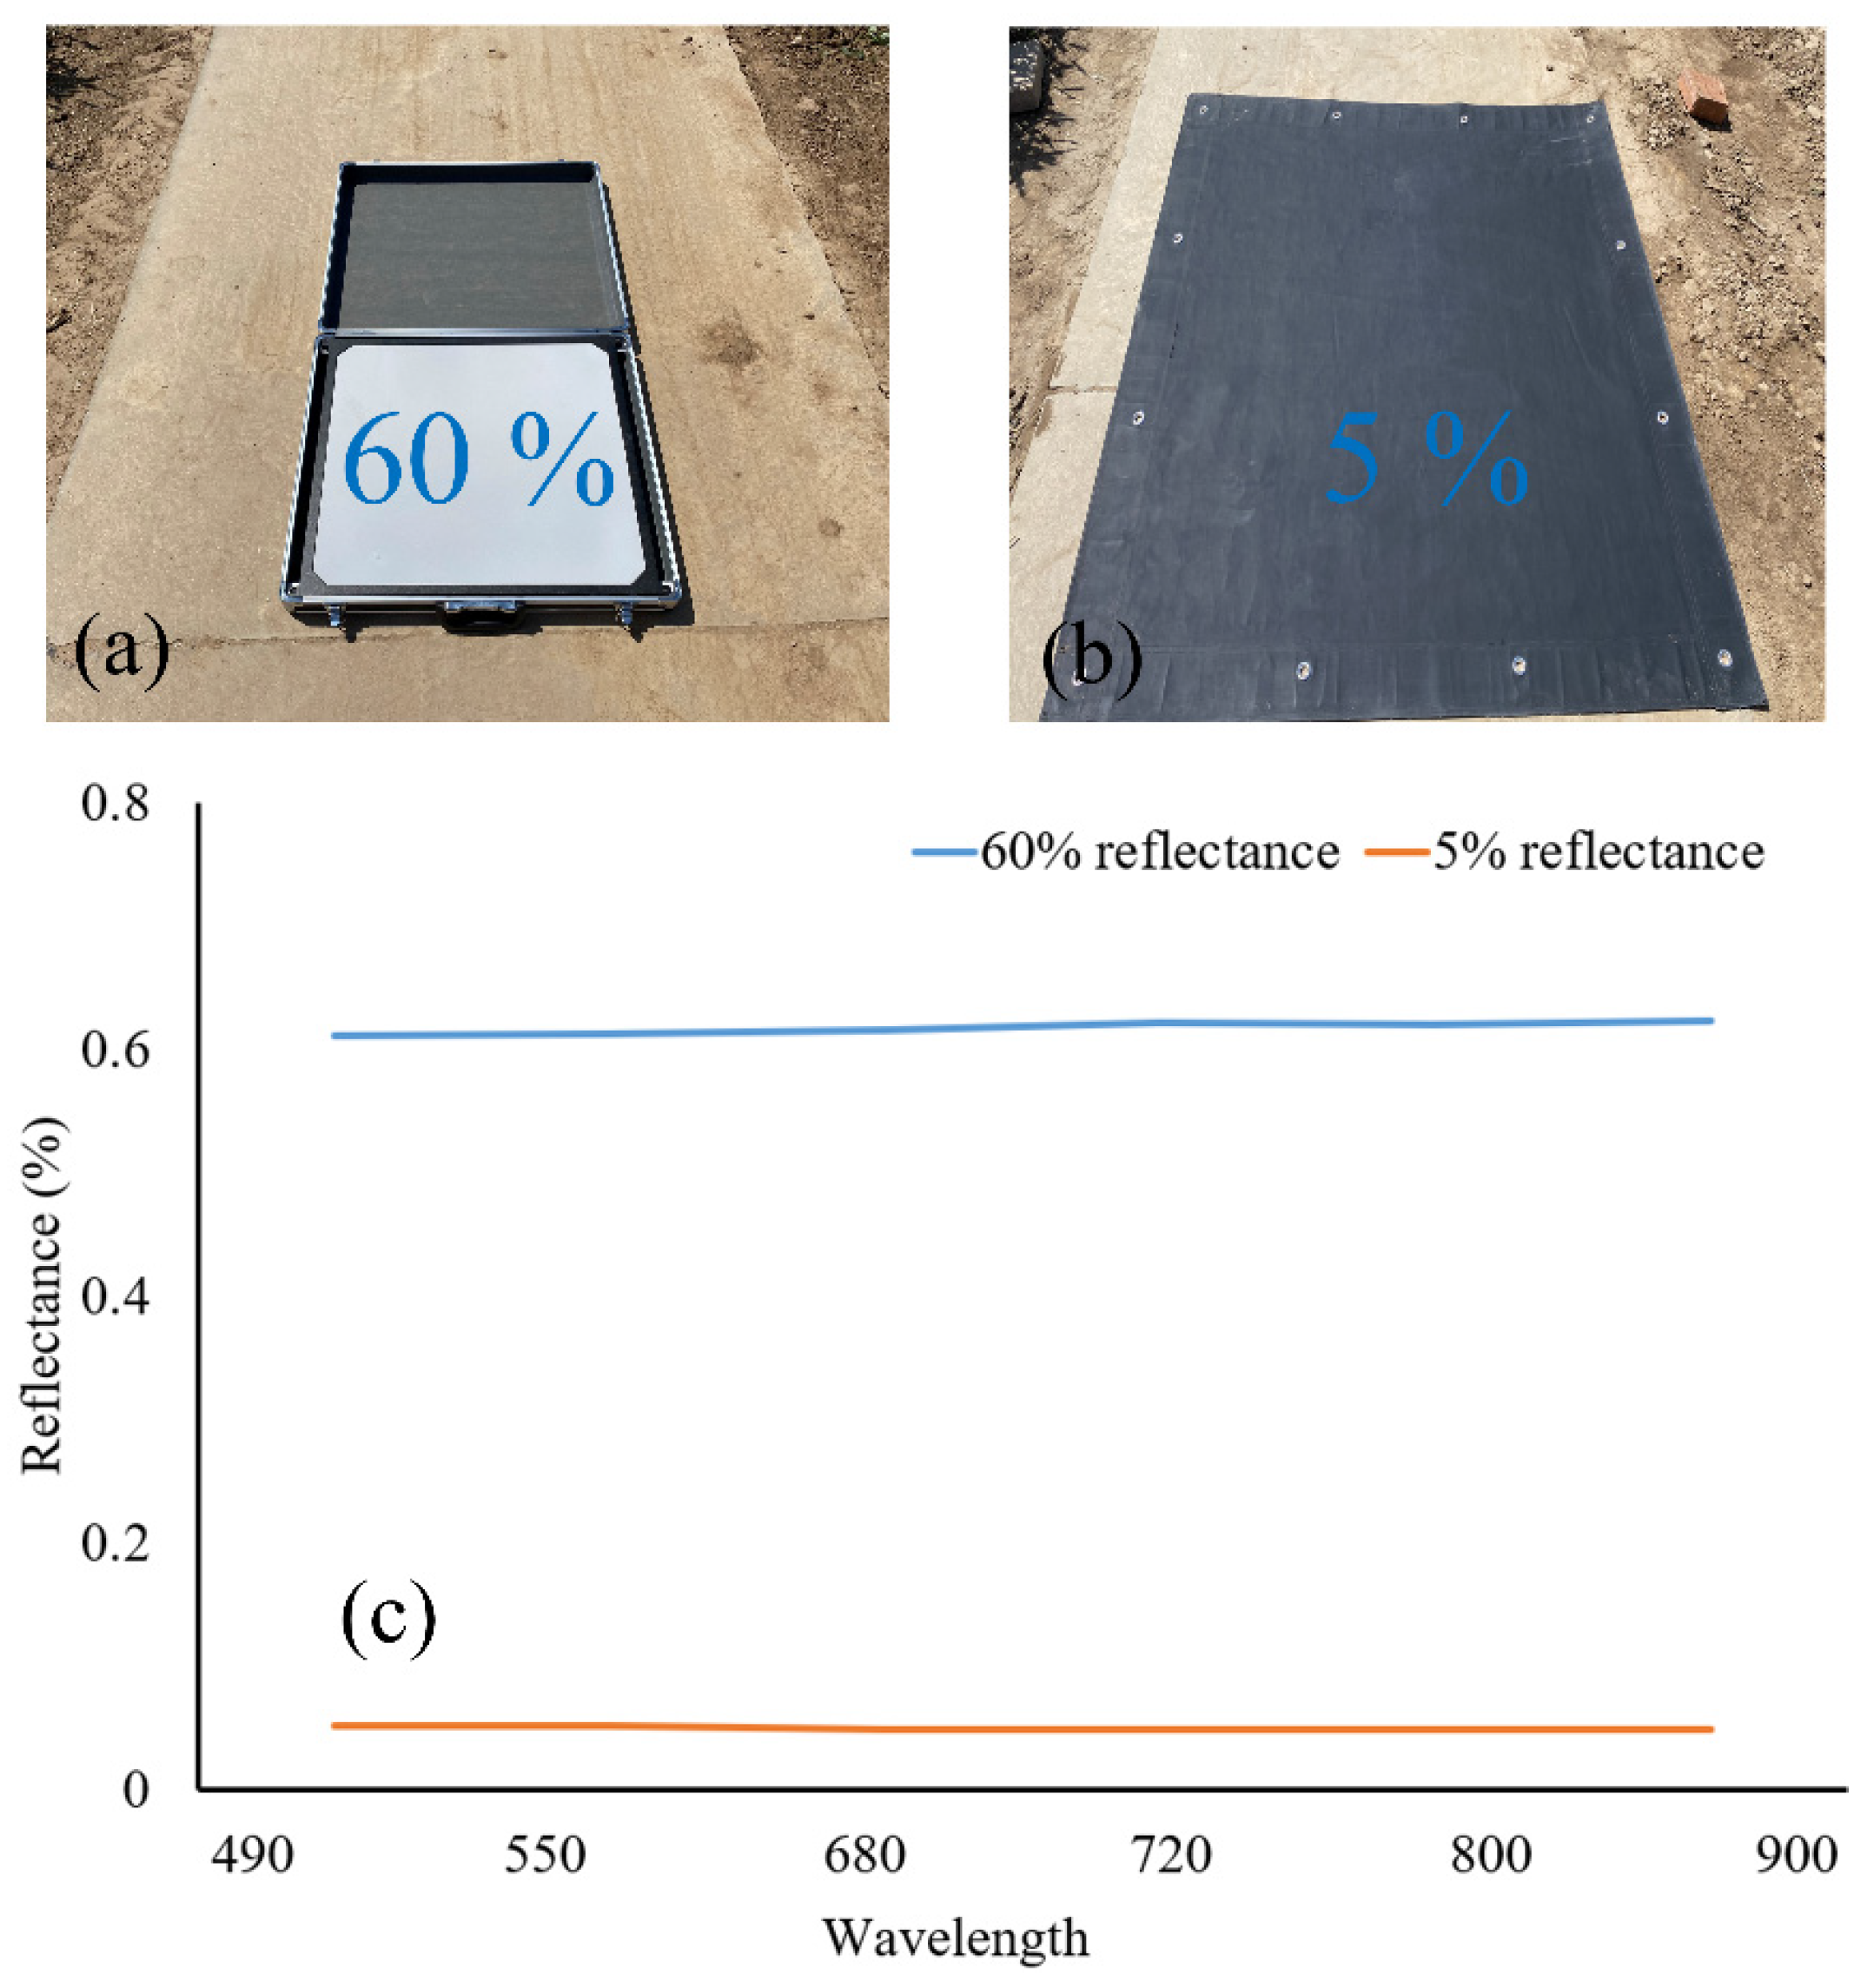
2.3. Radiometric Calibration of Multi-Spectral Images
2.4. Extractions of Spectral and Textural Indices and Optimal Combinations
2.5. Machine Learning Methods for Modeling the SPAD Values
3. Results
3.1. The Calibration and Validation of MMC
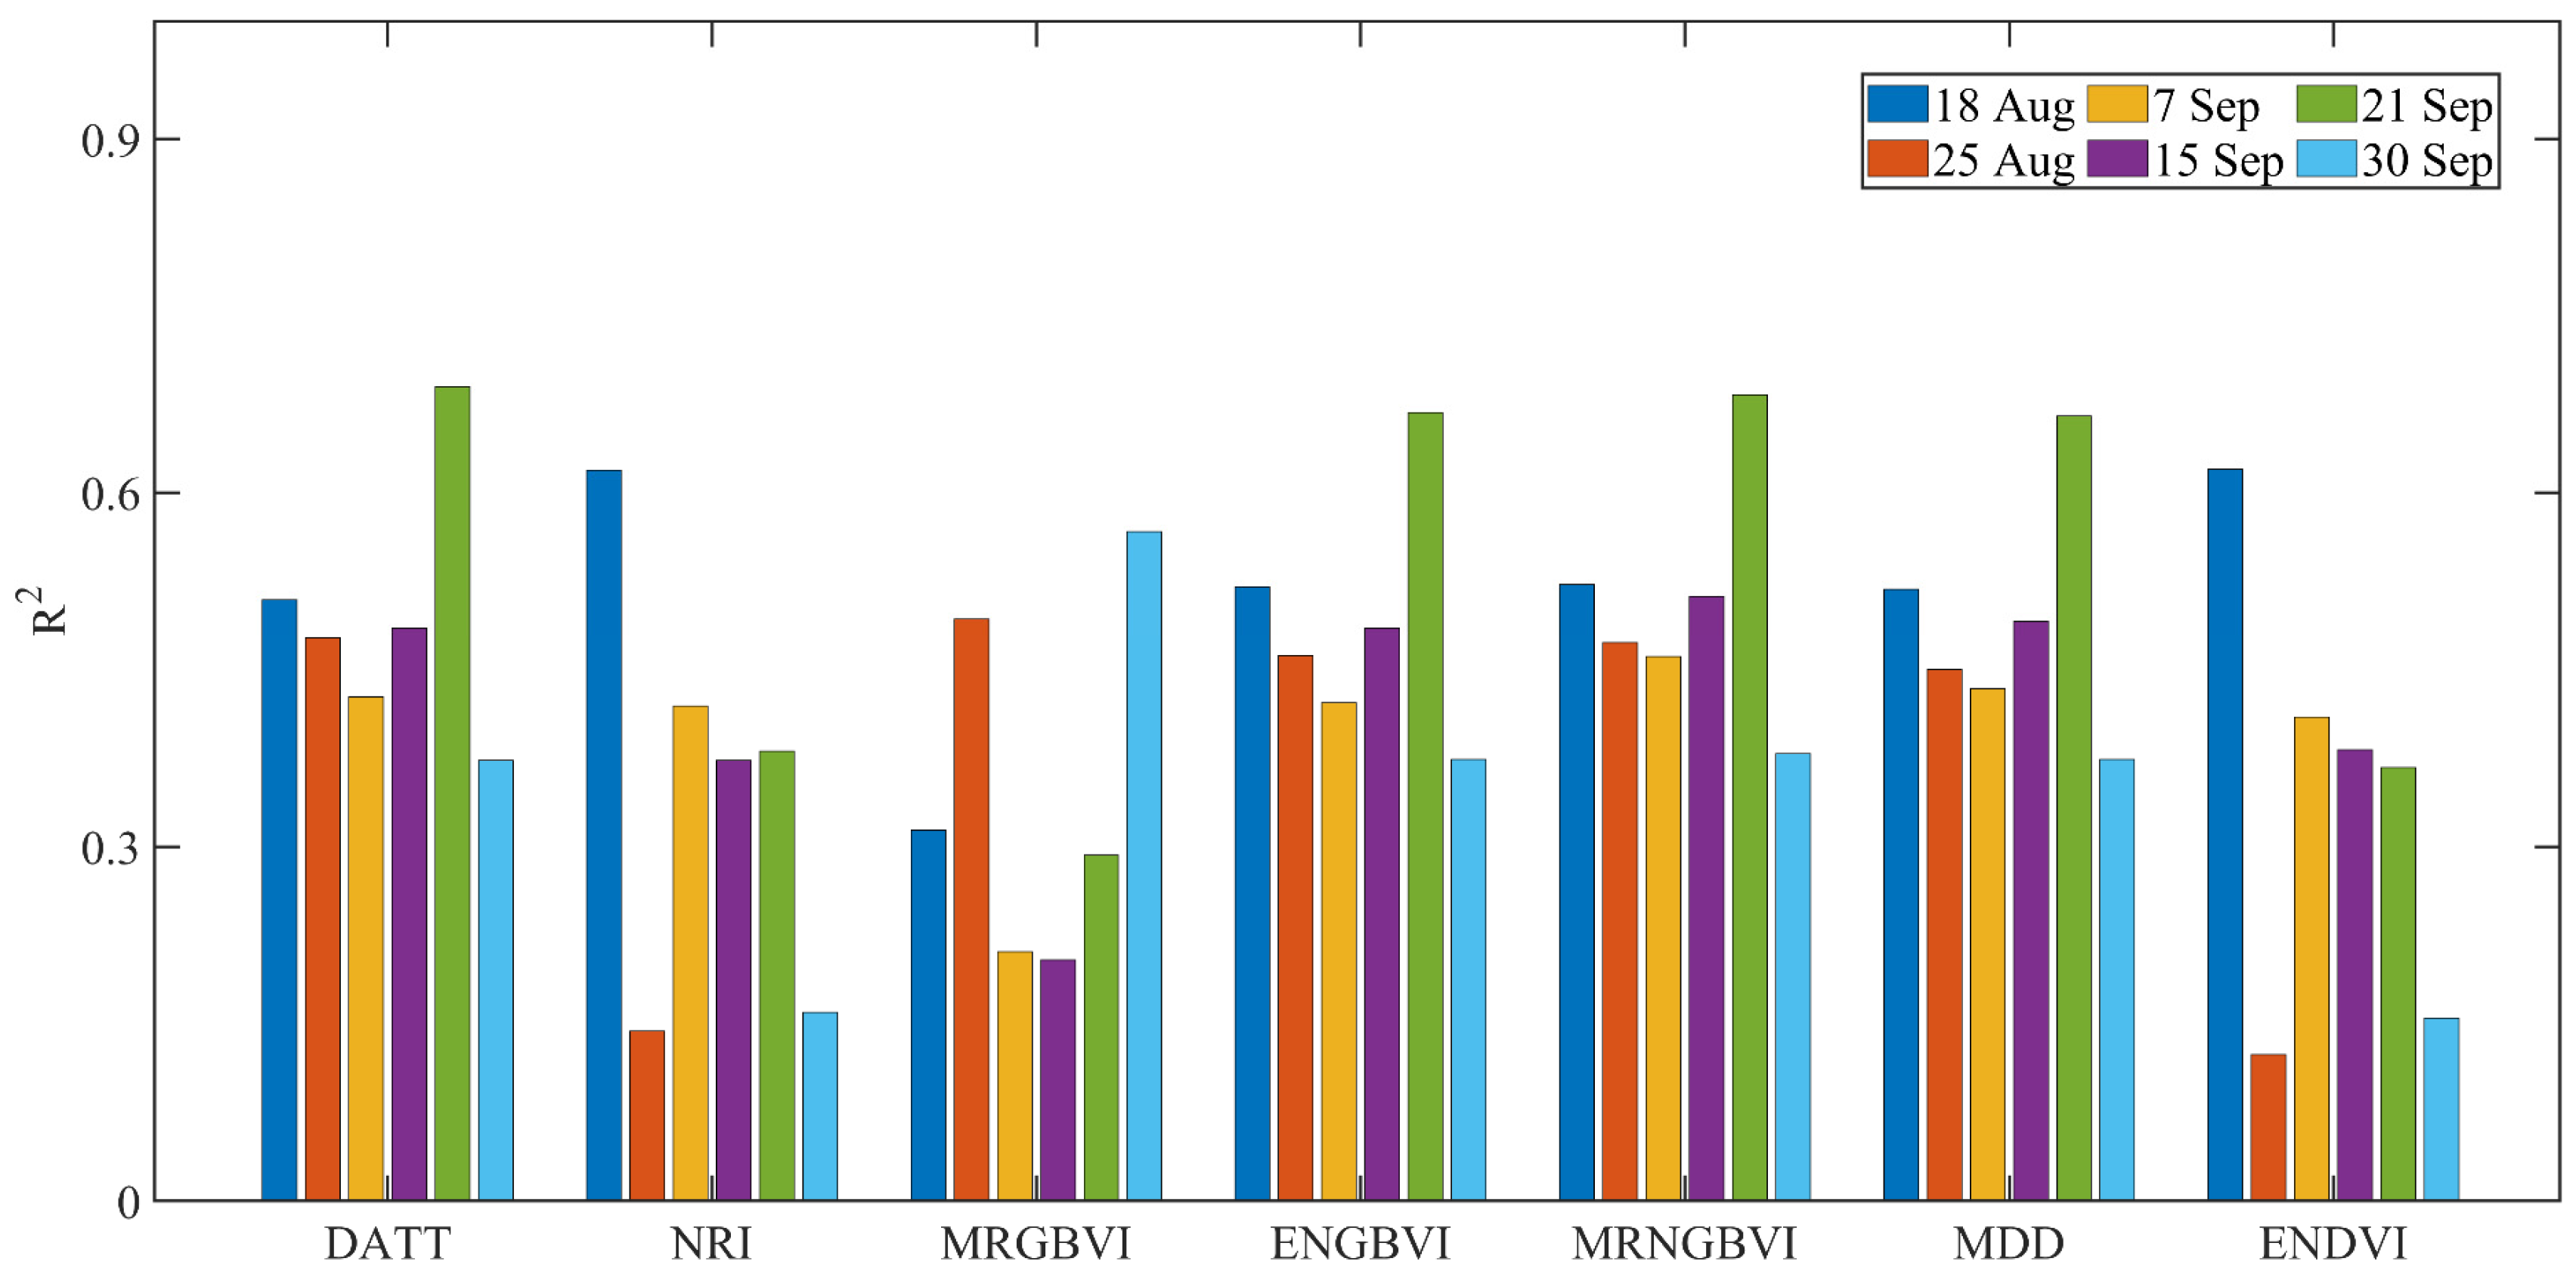
3.2. Linear Regression Analysis between Indices and SPAD Values
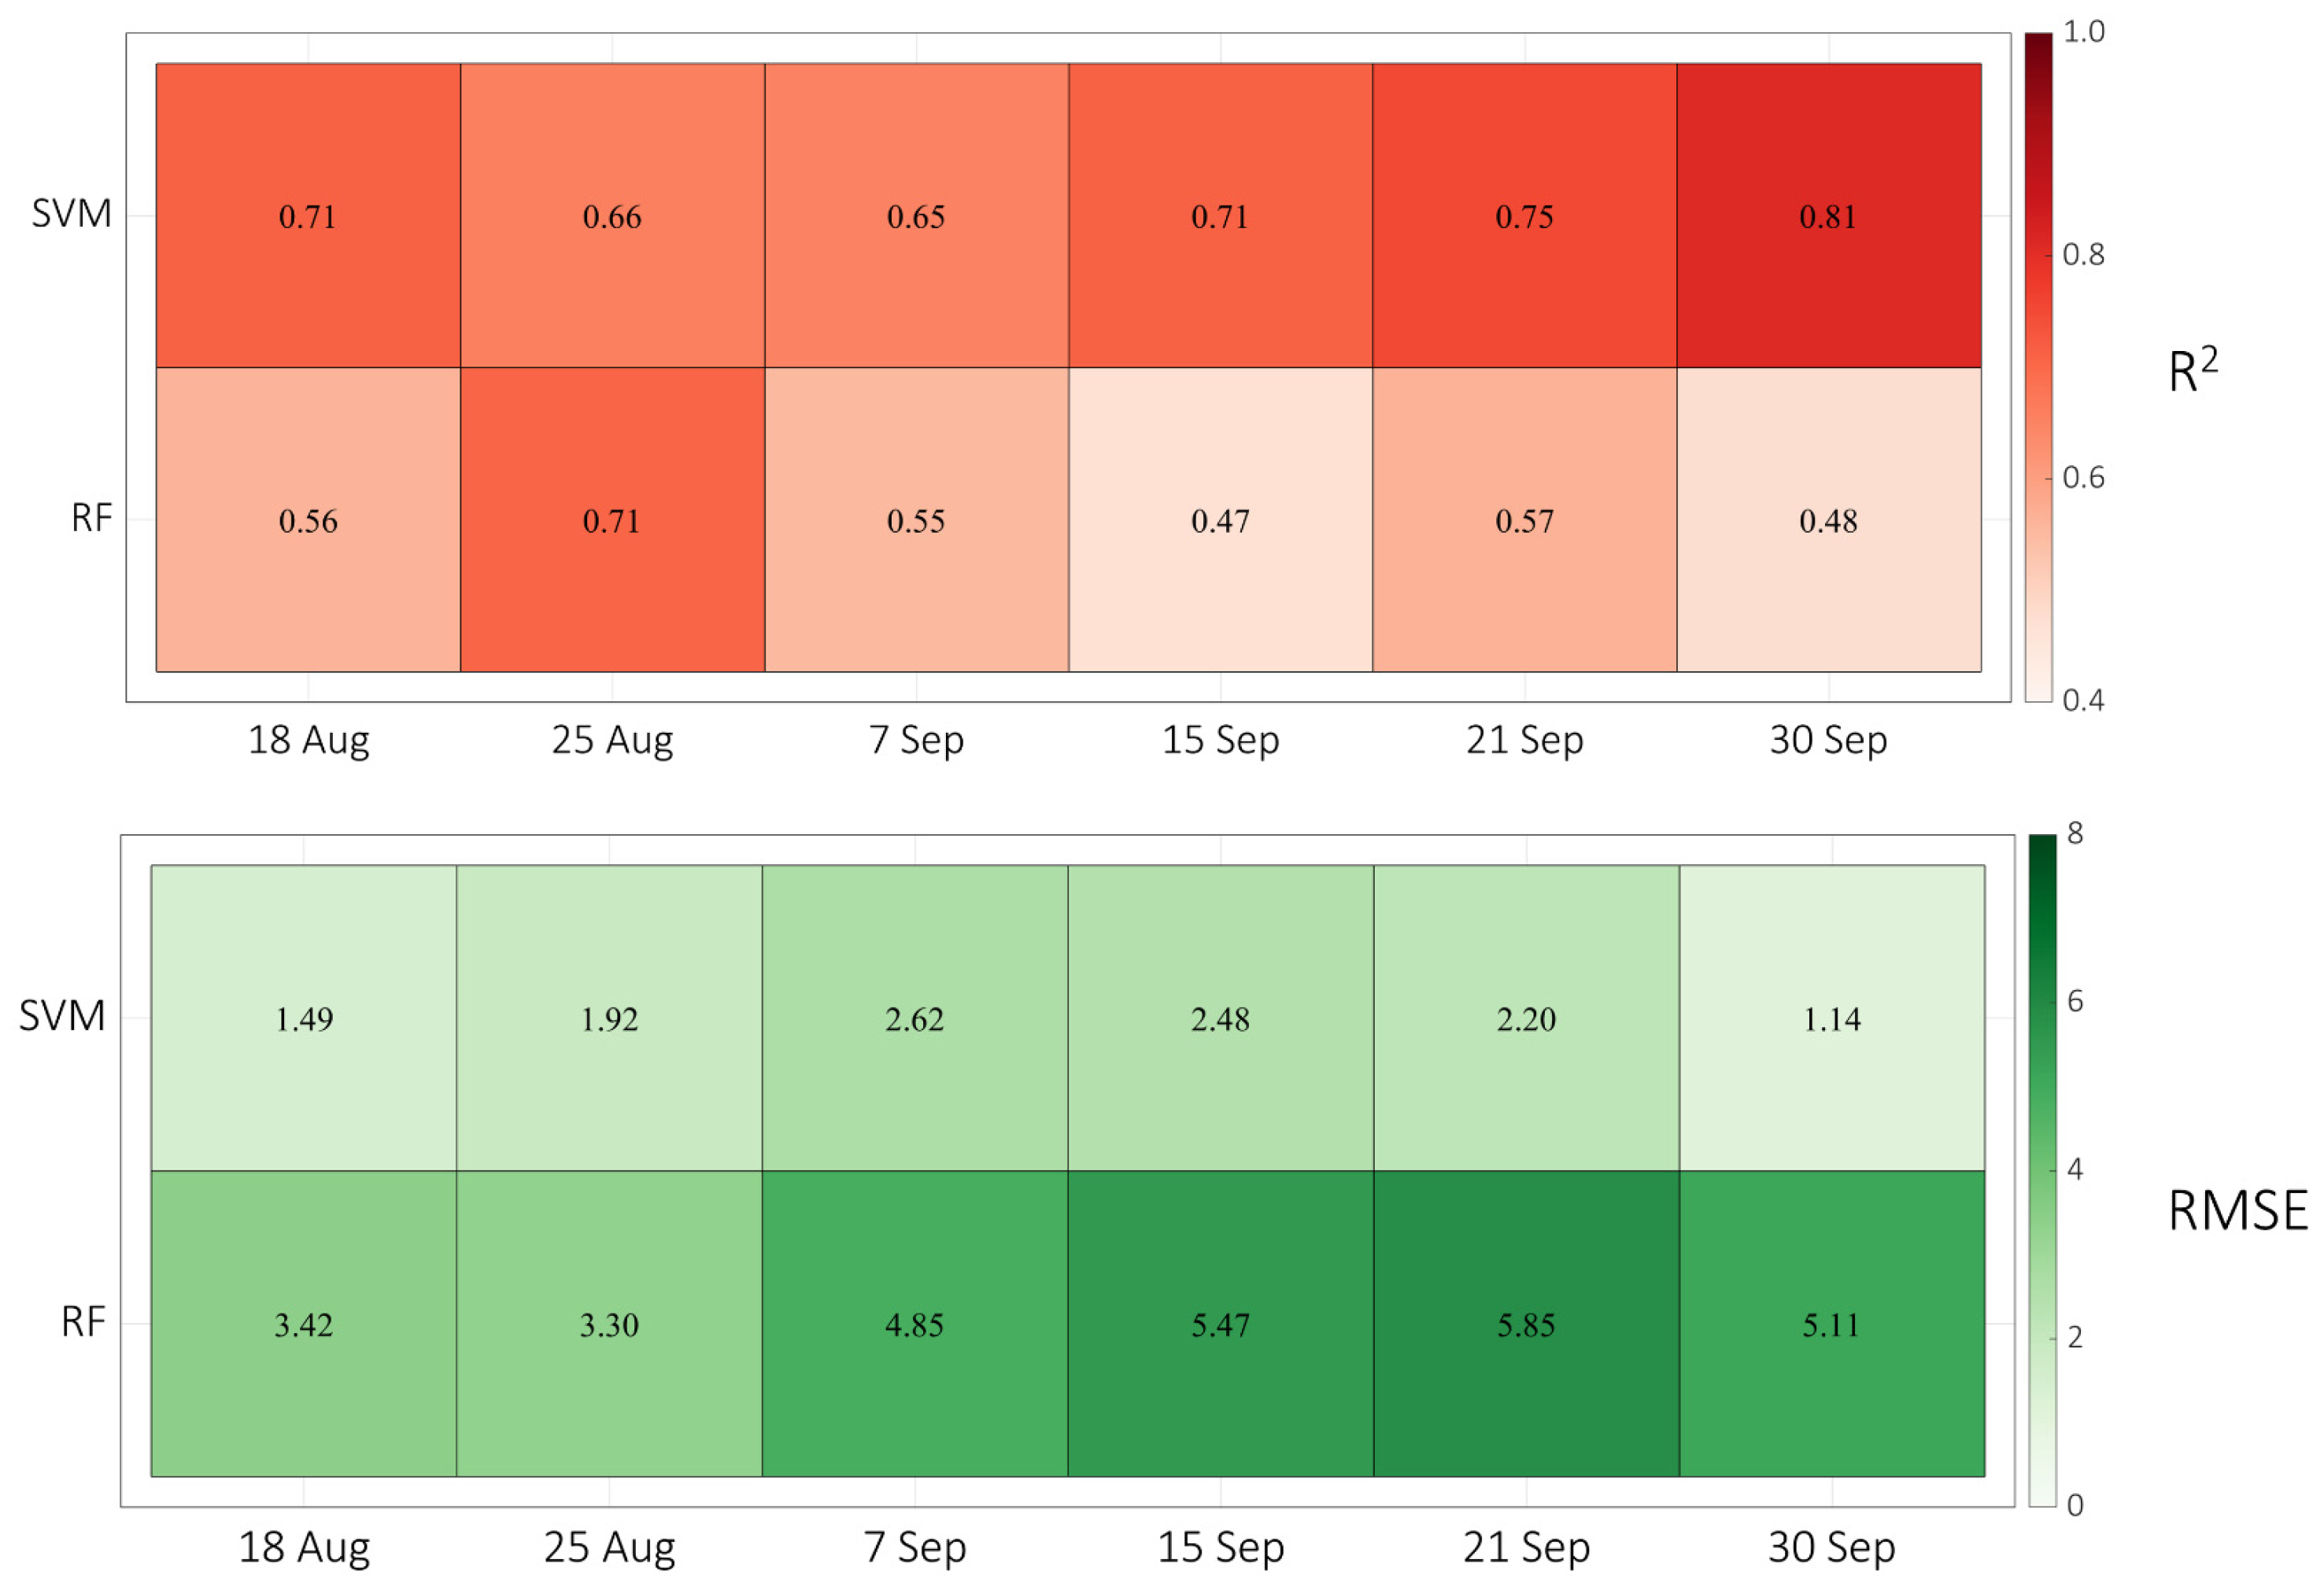
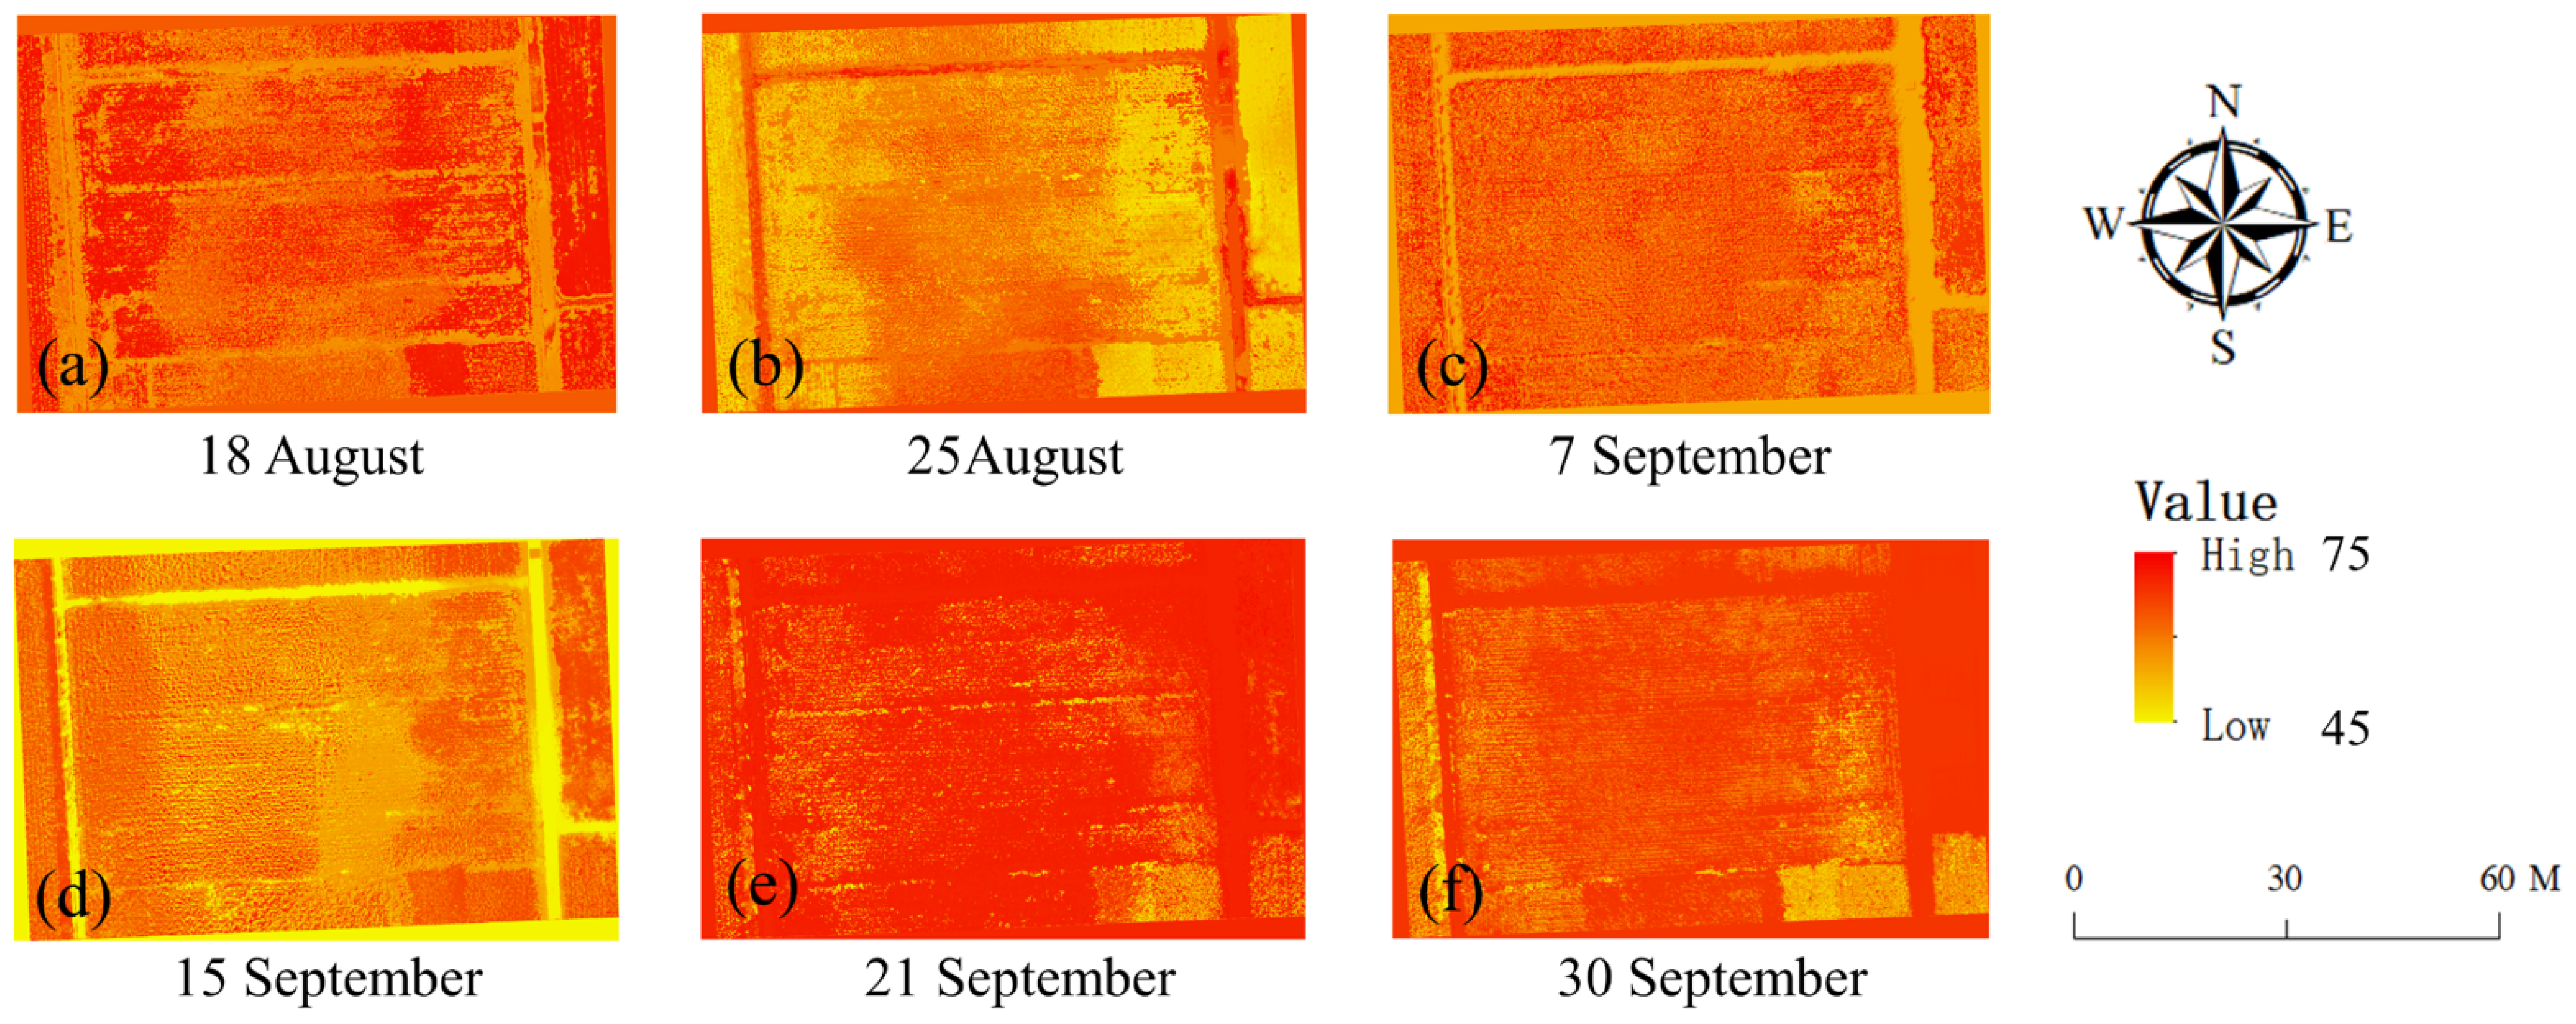
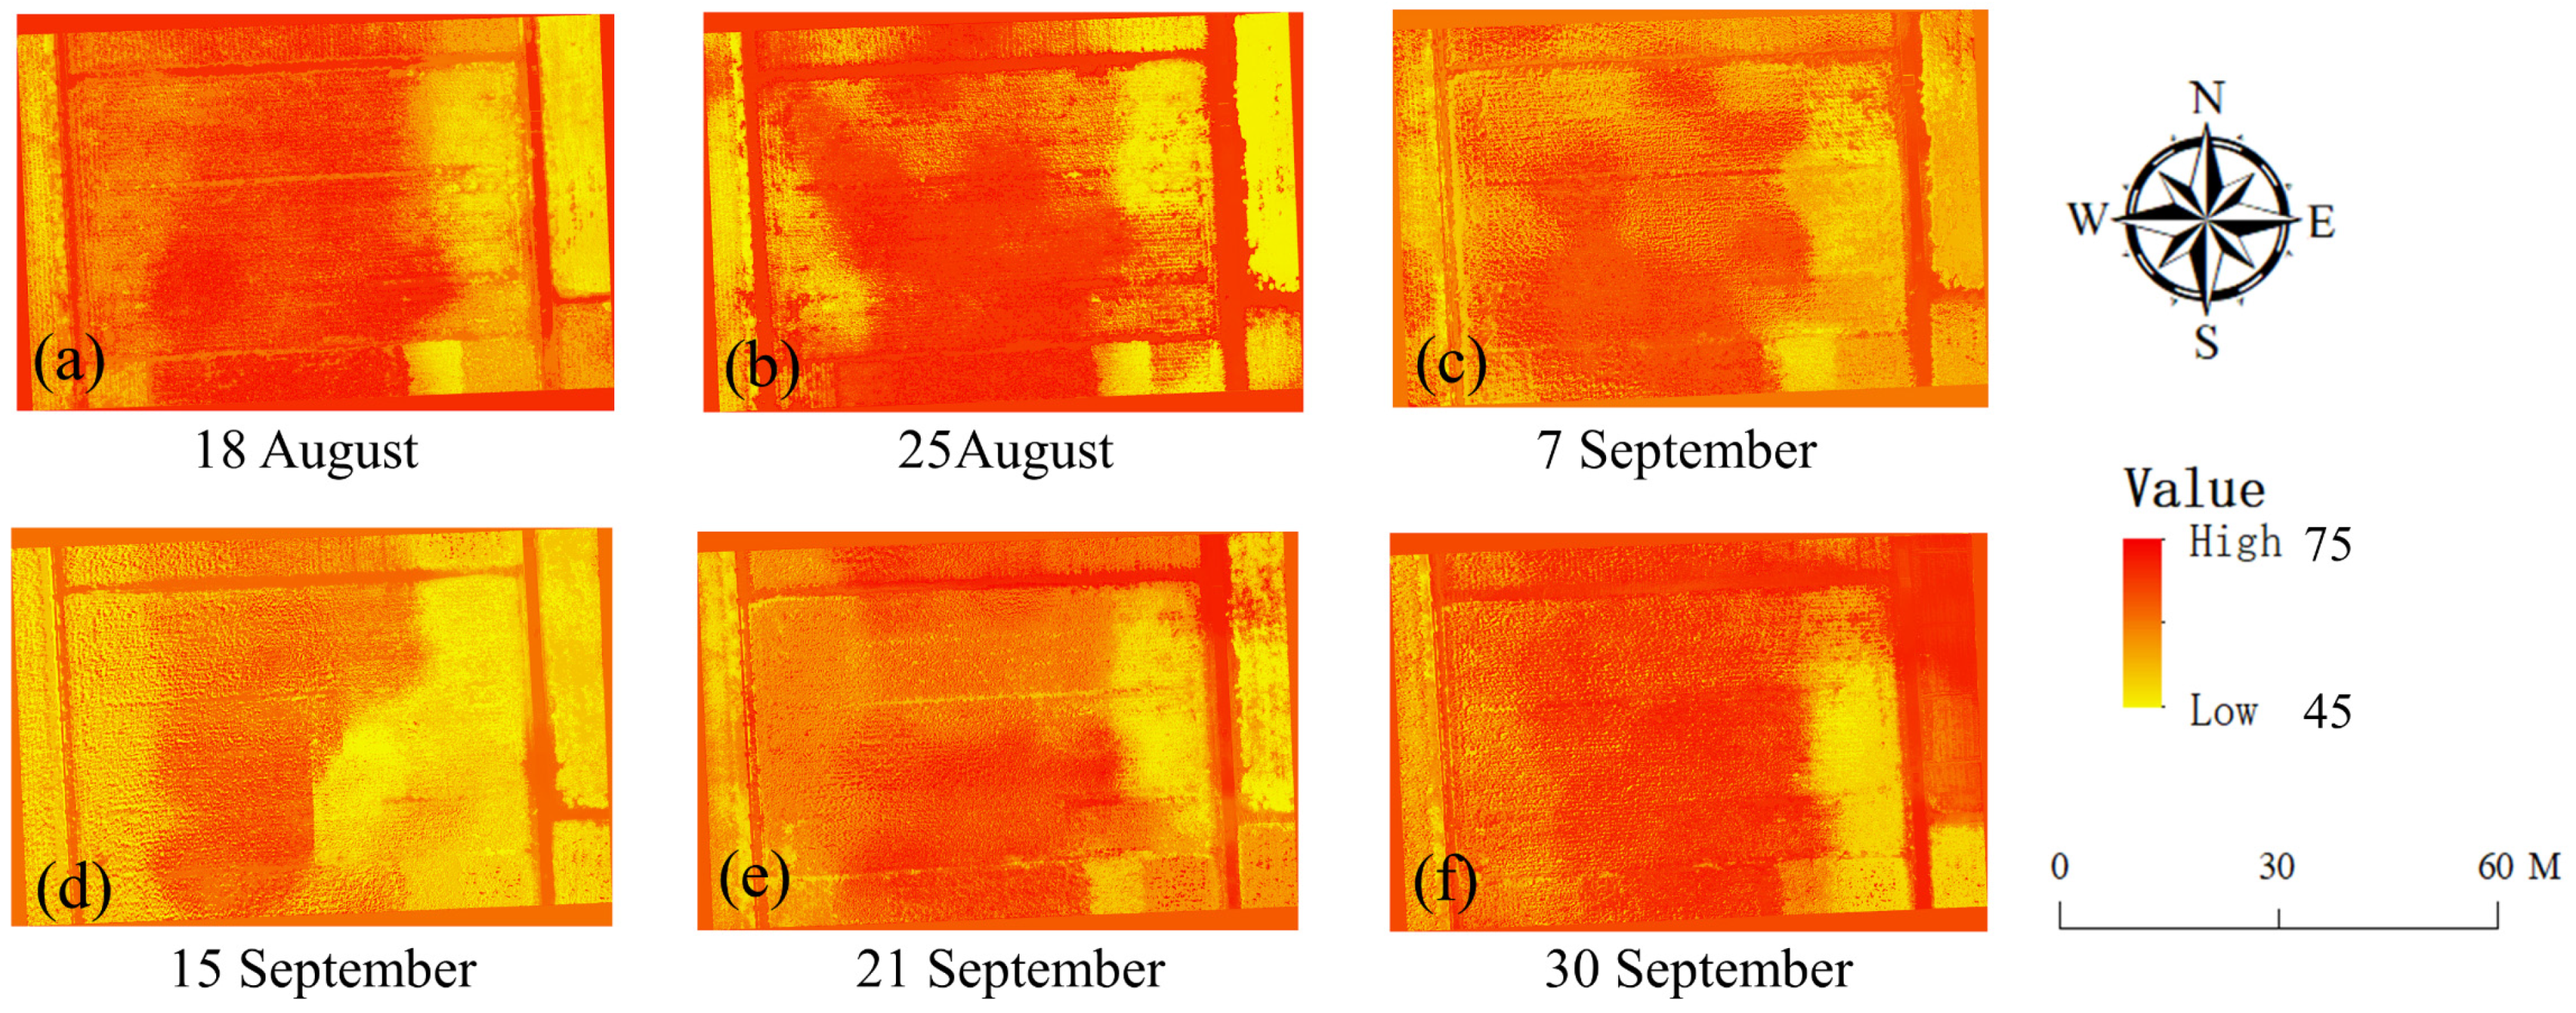
3.3. Predicting SPAD Values of Maize Using Machine Learning Methods
4. Discussion
4.1. The Radiometric Calibration of the Multi-Spectral Images Using ELCM
4.2. The Predictions of the SPAD Values of Maize
5. Conclusions
Author Contributions
Funding
Institutional Review Board Statement
Informed Consent Statement
Acknowledgments
Conflicts of Interest
Appendix A

| Plots | Fertilizers | Plots | Fertilizers | Plots | Fertilizers | Plots | Fertilizers |
|---|---|---|---|---|---|---|---|
| 1 | N1P1K2 | 2 | N3P1K1 | 3 | N3P3K1 | 4 | N2 + wheat + straw |
| 5 | N1P1K1 | 6 | N3P3K2 | 7 | N3P2K1 | 8 | N2 + Organic material |
| 9 | N1P2K1 | 10 | N2P2K2 | 11 | N4P3K1 | 12 | N3 + wheat-straw |
| 13 | N1P3K1 | 14 | N2P1K1 | 15 | N4P2K1 | 16 | N3 + Organic material |
| 17 | N2P3K1 | 18 | N2P2K1 | 19 | N4P1K1 | 20 | N4P2K2 |
| Spectral Indices | Stages | Equations | R2 | p | Stages | Equations | R2 | p |
|---|---|---|---|---|---|---|---|---|
| ENDVI | 1 | Y = −19.4X + 67.44 | 0.509 | p <0.001 | 2 | Y = −12.6X + 59.88 | 0.477 | p < 0.001 |
| 3 | Y = −15.92X + 60.23 | 0.485 | p < 0.001 | 4 | Y = −12.44X + 59.36 | 0.427 | p = 0.002 | |
| 5 | Y = −24.88X + 62.32 | 0.690 | p < 0.001 | 6 | Y = −13.13X + 53.32 | 0.373 | p = 0.004 | |
| DATT | 1 | Y = 42.23X + 31.65 | 0.144 | p = 0.099 | 2 | Y = 26.33X + 40.57 | 0.373 | p = 0.002 |
| 3 | Y = 52.42X + 26.01 | 0.582 | p = 0.004 | 4 | Y = 55.61X + 21.48 | 0.381 | p = 0.004 | |
| 5 | Y = 75.03X + 11.66 | 0.160 | p = 0.008 | 6 | Y = 36.43X + 29.99 | 0.464 | p < 0.001 | |
| NRI | 1 | Y = 404.58X + 40.71 | 0.314 | p = 0.001 | 2 | Y = 420.27X + 38.92 | 0.493 | p < 0.001 |
| 3 | Y = −885.74X + 84.08 | 0.211 | p = 0.042 | 4 | Y = 517.44X + 34.17 | 0.204 | p = 0.045 | |
| 5 | Y = −1211.04X + 99.23 | 0.293 | p = 0.014 | 6 | Y = −131.92X + 104.61 | 0.567 | p < 0.001 | |
| MRGBVI | 1 | Y = −24.85X + 72.75 | 0.520 | p < 0.001 | 2 | Y = −14.19X + 61.84 | 0.462 | p < 0.001 |
| 3 | Y = −17.16X + 61.82 | 0.422 | p < 0.001 | 4 | Y = −13.3X + 60.47 | 0.485 | p < 0.001 | |
| 5 | Y = −27.72X + 65.87 | 0.668 | p < 0.001 | 6 | Y = −14.31X + 54.83 | 0.374 | p = 0.004 | |
| ENGBVI | 1 | Y = −20.64X + 68.26 | 0.522 | p < 0.001 | 2 | Y = −12.37X + 59.44 | 0.473 | p = 0.002 |
| 3 | Y = −15.12X + 58.24 | 0.461 | p < 0.001 | 4 | Y = −11.32X + 57.99 | 0.512 | p < 0.001 | |
| 5 | Y = −22.97X + 60.23 | 0.683 | p < 0.001 | 6 | Y = −11.03X + 51.37 | 0.379 | p = 0.004 | |
| MRNGBVI | 1 | Y = −24.57X + 72.52 | 0.518 | p < 0.001 | 2 | Y = −13.62X + 61.54 | 0.450 | p = 0.002 |
| 3 | Y = −17.24X + 61.71 | 0.434 | p < 0.001 | 4 | Y = −13.78X + 60.84 | 0.491 | p < 0.001 | |
| 5 | Y = −26.74X + 64.89 | 0.665 | p < 0.001 | 6 | Y = −13.52X + 54.04 | 0.374 | p = 0.004 | |
| MDD | 1 | Y = 45.81X + 52.76 | 0.620 | p < 0.001 | 2 | Y = 26.79X + 53.91 | 0.124 | p = 0.128 |
| 3 | Y = 56.37X + 52.43 | 0.410 | p = 0.002 | 4 | Y = 60.72X + 49.19 | 0.382 | p = 0.004 | |
| 5 | Y = 86.66X + 49.29 | 0.367 | p = 0.005 | 6 | Y = 45.13X + 48.22 | 0.155 | p = 0.086 |
| Textural Indices | Stages | Equations | R2 | p | Stages | Equations | R2 | p |
|---|---|---|---|---|---|---|---|---|
| Contrast | 1 | Y = 34.80X + 51.21 | 0.185 | p < 0.001 | 2 | Y = 45.12X + 48.23 | 0.478 | p < 0.001 |
| 3 | Y = −42.39X + 61.80 | 0.151 | p < 0.001 | 4 | Y = 51.20X + 47.13 | 0.122 | p < 0.001 | |
| 5 | Y = 44.6X + 43.02 | 0.014 | p < 0.001 | 6 | Y = 50.76X + 35.01 | 0.381 | p = 0.004 | |
| Correlation | 1 | Y = −50.46X + 84.27 | 0.255 | p < 0.001 | 2 | Y = −26.49X + 69.76 | 0.088 | p = 0.002 |
| 3 | Y = −56.10X + 81.05 | 0.358 | p < 0.001 | 4 | Y = −23.57X + 67.19 | 0.147 | p < 0.001 | |
| 5 | Y = −102.57X + 103.22 | 0.545 | p < 0.001 | 6 | Y = −1.95X + 48.92 | 0.228 | p = 0.004 | |
| Energy | 1 | Y = −9.83X + 61.59 | 0.129 | p < 0.001 | 2 | Y = −17.87X + 65.01 | 0.511 | p = 0.002 |
| 3 | Y = 38.99X + 33.21 | 0.284 | p < 0.001 | 4 | Y = −17.77X + 64.48 | 0.116 | p < 0.001 | |
| 5 | Y = 68.31X + 23.33 | 0.289 | p < 0.001 | 6 | Y = −29.41X + 58.77 | 0.566 | p = 0.004 | |
| Homogeneity | 1 | Y = −69.60X + 120.81 | 0.185 | p < 0.001 | 2 | Y = −90.25X + 138.49 | 0.478 | p = 0.128 |
| 3 | Y = 84.79X − 22.98 | 0.051 | p = 0.002 | 4 | Y = −102.40X + 149.54 | 0.122 | p = 0.004 | |
| 5 | Y = −89.32X + 132.35 | 0.014 | p = 0.005 | 6 | Y = −101.52X + 136.53 | 0.381 | p = 0.086 |
References
- Guo, Y.; Yin, G.; Sun, H.; Wang, H.; Chen, S.; Senthilnath, J.; Wang, J.; Fu, Y. Scaling effects on chlorophyll content estimations with RGB camera mounted on a UAV platform using machine-learning methods. Sensors 2020, 20, 5130. [Google Scholar] [CrossRef] [PubMed]
- Li, S.; Yuan, F.; Ata-UI-Karim, S.T.; Zheng, H.; Cheng, T.; Liu, X.; Tian, Y.; Zhu, Y.; Cao, W.; Cao, Q. Combining color indices and textures of UAV-based digital imagery for rice LAI estimation. Remote Sens. 2019, 11, 1763. [Google Scholar] [CrossRef]
- Li, X.; Li, X.; Liu, W.; Wei, B.; Xu, X. A UAV-based framework for crop lodging assessment. Eur. J. Agron. 2021, 123, 126201. [Google Scholar] [CrossRef]
- Nowak, M.M.; Dziób, K.; Bogawski, P. Unmanned Aerial Vehicles (UAVs) in environmental biology: A review. Eur. J. Ecol. 2018, 4, 56–74. [Google Scholar] [CrossRef]
- Aasen, H.; Burkart, A.; Bolten, A.; Bareth, G. Generating 3D hyperspectral information with lightweight UAV snapshot cameras for vegetation monitoring: From camera calibration to quality assurance. ISPRS J. Photogramm. Remote Sens. 2015, 108, 245–259. [Google Scholar] [CrossRef]
- Alsalam, B.H.Y.; Morton, K.; Campbell, D.; Gonzalez, F. Autonomous UAV with vision based on-board decision making for remote sensing and precision agriculture. In Proceedings of the 2017 IEEE Aerospace Conference, Big Sky, MT, USA, 4–11 March 2017; pp. 1–12. [Google Scholar]
- Xiang, H.; Tian, L. Development of a low-cost agricultural remote sensing system based on an autonomous unmanned aerial vehicle (UAV). Biosyst. Eng. 2011, 108, 174–190. [Google Scholar] [CrossRef]
- Vickers, N.J. Animal communication: When i’m calling you, will you answer too? Curr. Biol. 2017, 27, R713–R715. [Google Scholar] [CrossRef]
- Fu, Y.; Yang, G.; Song, X.; Li, Z.; Xu, X.; Feng, H.; Zhao, C. Improved estimation of winter wheat aboveground biomass using multiscale textures extracted from UAV-based digital images and hyperspectral feature analysis. Remote Sens. 2021, 13, 581. [Google Scholar] [CrossRef]
- Guo, Y.; Chen, S.; Wu, Z.; Wang, S.; Robin Bryant, C.; Senthilnath, J.; Cunha, M.; Fu, Y.H. Integrating Spectral and Textural Information for Monitoring the Growth of Pear Trees Using Optical Images from the UAV Platform. Remote Sens. 2021, 13, 1795. [Google Scholar] [CrossRef]
- Guo, Y.; Wang, H.; Wu, Z.; Wang, S.; Sun, H.; Senthilnath, J.; Wang, J.; Robin Bryant, C.; Fu, Y. Modified red blue vegetation index for chlorophyll estimation and yield prediction of maize from visible images captured by UAV. Sensors 2020, 20, 5055. [Google Scholar] [CrossRef]
- Kestur, R.; Angural, A.; Bashir, B.; Omkar, S.; Anand, G.; Meenavathi, M. Tree crown detection, delineation and counting in uav remote sensed images: A neural network based spectral–spatial method. J. Indian Soc. Remote Sens. 2018, 46, 991–1004. [Google Scholar] [CrossRef]
- Senthilnath, J.; Dokania, A.; Kandukuri, M.; Ramesh, K.; Anand, G.; Omkar, S. Detection of tomatoes using spectral-spatial methods in remotely sensed RGB images captured by UAV. Biosyst. Eng. 2016, 146, 16–32. [Google Scholar] [CrossRef]
- Ammoniaci, M.; Kartsiotis, S.-P.; Perria, R.; Storchi, P. State of the Art of Monitoring Technologies and Data Processing for Precision Viticulture. Agriculture 2021, 11, 201. [Google Scholar] [CrossRef]
- Pallottino, F.; Figorilli, S.; Cecchini, C.; Costa, C. Light Drones for Basic In-Field Phenotyping and Precision Farming Applications: RGB Tools Based on Image Analysis. In Crop Breeding; Springer: New York, NY, USA, 2021; pp. 269–278. [Google Scholar]
- Yang, G.; Liu, J.; Zhao, C.; Li, Z.; Huang, Y.; Yu, H.; Xu, B.; Yang, X.; Zhu, D.; Zhang, X. Unmanned aerial vehicle remote sensing for field-based crop phenotyping: Current status and perspectives. Front. Plant Sci. 2017, 8, 1111. [Google Scholar] [CrossRef]
- Lang, Q.; Zhiyong, Z.; Longsheng, C.; Hong, S.; Minzan, L.; Li, L.; Junyong, M. Detection of chlorophyll content in Maize Canopy from UAV Imagery. IFAC Pap. 2019, 52, 330–335. [Google Scholar] [CrossRef]
- Damayanti, R.; Nainggolan, R.; Al Riza, D.; Hendrawan, Y. Application of RGB-CCM and GLCM texture analysis to predict chlorophyll content in Vernonia amygdalina. In Proceedings of the Fourth International Seminar on Photonics, Optics, and Its Applications (ISPhOA 2020), Sanur, Indonesia, 12 March 2021; p. 1178907. [Google Scholar]
- Adão, T.; Hruška, J.; Pádua, L.; Bessa, J.; Peres, E.; Morais, R.; Sousa, J.J. Hyperspectral imaging: A review on UAV-based sensors, data processing and applications for agriculture and forestry. Remote Sens. 2017, 9, 1110. [Google Scholar] [CrossRef]
- Gago, J.; Douthe, C.; Coopman, R.E.; Gallego, P.P.; Ribas-Carbo, M.; Flexas, J.; Escalona, J.; Medrano, H. UAVs challenge to assess water stress for sustainable agriculture. Agric. Water Manag. 2015, 153, 9–19. [Google Scholar] [CrossRef]
- Senthilnath, J.; Kumar, A.; Jain, A.; Harikumar, K.; Thapa, M.; Suresh, S.; Anand, G.; Benediktsson, J.A. BS-McL: Bilevel Segmentation Framework with Metacognitive Learning for Detection of the Power Lines in UAV Imagery. IEEE Trans. Geosci. Remote Sens. 2021, 60, 1–12. [Google Scholar] [CrossRef]
- Guo, Y.; Fu, Y.H.; Chen, S.; Bryant, C.R.; Li, X.; Senthilnath, J.; Sun, H.; Wang, S.; Wu, Z.; de Beurs, K. Integrating spectral and textural information for identifying the tasseling date of summer maize using UAV based RGB images. Int. J. Appl. Earth Obs. Geoinf. 2021, 102, 102435. [Google Scholar] [CrossRef]
- Guo, Y.; Senthilnath, J.; Wu, W.; Zhang, X.; Zeng, Z.; Huang, H. Radiometric calibration for multispectral camera of different imaging conditions mounted on a UAV platform. Sustainability 2019, 11, 978. [Google Scholar] [CrossRef]
- Turner, D.; Lucieer, A.; Malenovský, Z.; King, D.H.; Robinson, S.A. Spatial co-registration of ultra-high resolution visible, multispectral and thermal images acquired with a micro-UAV over Antarctic moss beds. Remote Sens. 2014, 6, 4003–4024. [Google Scholar] [CrossRef]
- Guanter, L.; Zhang, Y.; Jung, M.; Joiner, J.; Voigt, M.; Berry, J.A.; Frankenberg, C.; Huete, A.R.; Zarco-Tejada, P.; Lee, J.-E. Global and time-resolved monitoring of crop photosynthesis with chlorophyll fluorescence. Proc. Natl. Acad. Sci. USA 2014, 111, E1327–E1333. [Google Scholar] [CrossRef] [PubMed]
- Ghrefat, H.A.; Goodell, P.C. Land cover mapping at Alkali Flat and Lake Lucero, White Sands, New Mexico, USA using multi-temporal and multi-spectral remote sensing data. Int. J. Appl. Earth Obs. Geoinf. 2011, 13, 616–625. [Google Scholar] [CrossRef]
- Yubin, L.; Xiaoling, D.; Guoliang, Z. Advances in diagnosis of crop diseases, pests and weeds by UAV remote sensing. Smart Agric. 2019, 1, 1. [Google Scholar]
- Wang, C.; Myint, S.W. A simplified empirical line method of radiometric calibration for small unmanned aircraft systems-based remote sensing. IEEE J. Sel. Top. Appl. Earth Obs. Remote Sens. 2015, 8, 1876–1885. [Google Scholar] [CrossRef]
- Laliberte, A.S.; Goforth, M.A.; Steele, C.M.; Rango, A. Multispectral remote sensing from unmanned aircraft: Image processing workflows and applications for rangeland environments. Remote Sens. 2011, 3, 2529–2551. [Google Scholar] [CrossRef]
- Iqbal, F.; Lucieer, A.; Barry, K. Simplified radiometric calibration for UAS-mounted multispectral sensor. Eur. J. Remote Sens. 2018, 51, 301–313. [Google Scholar] [CrossRef]
- Del Pozo, S.; Rodríguez-Gonzálvez, P.; Hernández-López, D.; Felipe-García, B. Vicarious radiometric calibration of a multispectral camera on board an unmanned aerial system. Remote Sens. 2014, 6, 1918–1937. [Google Scholar] [CrossRef]
- Badgley, G.; Anderegg, L.D.; Berry, J.A.; Field, C.B. Terrestrial gross primary production: Using NIRV to scale from site to globe. Glob. Change Biol. 2019, 25, 3731–3740. [Google Scholar] [CrossRef]
- Robinson, N.P.; Allred, B.W.; Jones, M.O.; Moreno, A.; Kimball, J.S.; Naugle, D.E.; Erickson, T.A.; Richardson, A.D. A dynamic Landsat derived normalized difference vegetation index (NDVI) product for the conterminous United States. Remote Sens. 2017, 9, 863. [Google Scholar] [CrossRef]
- Wu, C.; Niu, Z.; Tang, Q.; Huang, W.; Rivard, B.; Feng, J. Remote estimation of gross primary production in wheat using chlorophyll-related vegetation indices. Agric. For. Meteorol. 2009, 149, 1015–1021. [Google Scholar] [CrossRef]
- Chen, P.; Feng, H.; Li, C.; Yang, G.; Yang, J.; Yang, W.; Liu, S. Estimation of chlorophyll content in potato using fusion of texture and spectral features derived from UAV multispectral image. Trans. Chin. Soc. Agric. Eng. 2019, 35, 63–74. [Google Scholar]
- Bhatta, B. Analysis of urban growth pattern using remote sensing and GIS: A case study of Kolkata, India. Int. J. Remote Sens. 2009, 30, 4733–4746. [Google Scholar] [CrossRef]
- Franch, B.; Vermote, E.F.; Skakun, S.; Roger, J.-C.; Becker-Reshef, I.; Murphy, E.; Justice, C. Remote sensing based yield monitoring: Application to winter wheat in United States and Ukraine. Int. J. Appl. Earth Obs. Geoinf. 2019, 76, 112–127. [Google Scholar] [CrossRef]
- Sahurkar, S.; Chilke, B. Assessment of chlorophyll and nitrogen contents of leaves using image processing technique. Int. Res. J. Eng. Technol. 2017, 4, 2243–2247. [Google Scholar]
- Hussain, M.; Chen, D.; Cheng, A.; Wei, H.; Stanley, D. Change detection from remotely sensed images: From pixel-based to object-based approaches. ISPRS J. Photogramm. Remote Sens. 2013, 80, 91–106. [Google Scholar] [CrossRef]
- Shackelford, A.K.; Davis, C.H. A combined fuzzy pixel-based and object-based approach for classification of high-resolution multispectral data over urban areas. IEEE Trans. Geosci. Remote Sens. 2003, 41, 2354–2363. [Google Scholar] [CrossRef]
- Yang, K.; Gong, Y.; Fang, S.; Duan, B.; Yuan, N.; Peng, Y.; Wu, X.; Zhu, R. Combining spectral and texture features of UAV images for the remote estimation of rice LAI throughout the entire growing season. Remote Sens. 2021, 13, 3001. [Google Scholar] [CrossRef]
- Peña-Barragán, J.M.; Ngugi, M.K.; Plant, R.E.; Six, J. Object-based crop identification using multiple vegetation indices, textural features and crop phenology. Remote Sens. Environ. 2011, 115, 1301–1316. [Google Scholar] [CrossRef]
- Shah, S.H.; Houborg, R.; McCabe, M.F. Response of chlorophyll, carotenoid and SPAD-502 measurement to salinity and nutrient stress in wheat (Triticum aestivum L.). Agronomy 2017, 7, 61. [Google Scholar] [CrossRef]
- Hawkins, T.S.; Gardiner, E.S.; Comer, G.S. Modeling the relationship between extractable chlorophyll and SPAD-502 readings for endangered plant species research. J. Nat. Conserv. 2009, 17, 123–127. [Google Scholar] [CrossRef]
- Loh, F.C.; Grabosky, J.C.; Bassuk, N.L. Using the SPAD 502 meter to assess chlorophyll and nitrogen content of benjamin fig and cottonwood leaves. HortTechnology 2002, 12, 682–686. [Google Scholar] [CrossRef]
- Coste, S.; Baraloto, C.; Leroy, C.; Marcon, É.; Renaud, A.; Richardson, A.D.; Roggy, J.-C.; Schimann, H.; Uddling, J.; Hérault, B. Assessing foliar chlorophyll contents with the SPAD-502 chlorophyll meter: A calibration test with thirteen tree species of tropical rainforest in French Guiana. Ann. For. Sci. 2010, 67, 607. [Google Scholar] [CrossRef]
- Zhang, S.; Zhao, G.; Lang, K.; Su, B.; Chen, X.; Xi, X.; Zhang, H. Integrated satellite, unmanned aerial vehicle (UAV) and ground inversion of the SPAD of winter wheat in the reviving stage. Sensors 2019, 19, 1485. [Google Scholar] [CrossRef]
- Duan, B.; Fang, S.; Zhu, R.; Wu, X.; Wang, S.; Gong, Y.; Peng, Y. Remote estimation of rice yield with unmanned aerial vehicle (UAV) data and spectral mixture analysis. Front. Plant Sci. 2019, 10, 204. [Google Scholar] [CrossRef]
- Shu, M.; Zuo, J.; Shen, M.; Yin, P.; Wang, M.; Yang, X.; Tang, J.; Li, B.; Ma, Y. Improving the estimation accuracy of SPAD values for maize leaves by removing UAV hyperspectral image backgrounds. Int. J. Remote Sens. 2021, 42, 5862–5881. [Google Scholar] [CrossRef]
- Yang, X.; Yang, R.; Ye, Y.; Yuan, Z.; Wang, D.; Hua, K. Winter wheat SPAD estimation from UAV hyperspectral data using cluster-regression methods. Int. J. Appl. Earth Obs. Geoinf. 2021, 105, 102618. [Google Scholar] [CrossRef]
- Liu, Y.; Hatou, K.; Aihara, T.; Kurose, S.; Akiyama, T.; Kohno, Y.; Lu, S.; Omasa, K. A robust vegetation index based on different UAV RGB images to estimate SPAD values of naked barley leaves. Remote Sens. 2021, 13, 686. [Google Scholar] [CrossRef]
- Wan, L.; Cen, H.; Zhu, J.; Zhang, J.; Zhu, Y.; Sun, D.; Du, X.; Zhai, L.; Weng, H.; Li, Y. Grain yield prediction of rice using multi-temporal UAV-based RGB and multispectral images and model transfer–A case study of small farmlands in the South of China. Agric. For. Meteorol. 2020, 291, 108096. [Google Scholar] [CrossRef]
- Shendryk, Y.; Sofonia, J.; Garrard, R.; Rist, Y.; Skocaj, D.; Thorburn, P. Fine-scale prediction of biomass and leaf nitrogen content in sugarcane using UAV LiDAR and multispectral imaging. Int. J. Appl. Earth Obs. Geoinf. 2020, 92, 102177. [Google Scholar] [CrossRef]
- Meng, R.; Lv, Z.; Yan, J.; Chen, G.; Zhao, F.; Zeng, L.; Xu, B. Development of Spectral Disease Indices for Southern Corn Rust Detection and Severity Classification. Remote Sens. 2020, 12, 3233. [Google Scholar] [CrossRef]
- Berni, J.A.; Zarco-Tejada, P.J.; Suárez, L.; Fereres, E. Thermal and narrowband multispectral remote sensing for vegetation monitoring from an unmanned aerial vehicle. IEEE Trans. Geosci. Remote Sens. 2009, 47, 722–738. [Google Scholar] [CrossRef]
- Stagakis, S.; González-Dugo, V.; Cid, P.; Guillén-Climent, M.L.; Zarco-Tejada, P.J. Monitoring water stress and fruit quality in an orange orchard under regulated deficit irrigation using narrow-band structural and physiological remote sensing indices. ISPRS J. Photogramm. Remote Sens. 2012, 71, 47–61. [Google Scholar] [CrossRef]
- Deng, L.; Mao, Z.; Li, X.; Hu, Z.; Duan, F.; Yan, Y. UAV-based multispectral remote sensing for precision agriculture: A comparison between different cameras. ISPRS J. Photogramm. Remote Sens. 2018, 146, 124–136. [Google Scholar] [CrossRef]
- Canty, M.J. Image Analysis, Classification and Change Detection in Remote Sensing: With Algorithms for ENVI/IDL and Python; CRC Press: Boca Raton, FL, USA, 2014. [Google Scholar]
- Salata, F.; Golasi, I.; de Lieto Vollaro, R.; de Lieto Vollaro, A. Urban microclimate and outdoor thermal comfort. A proper procedure to fit ENVI-met simulation outputs to experimental data. Sustain. Cities Soc. 2016, 26, 318–343. [Google Scholar] [CrossRef]
- Hassan, M.A.; Yang, M.; Rasheed, A.; Jin, X.; Xia, X.; Xiao, Y.; He, Z. Time-series multispectral indices from unmanned aerial vehicle imagery reveal senescence rate in bread wheat. Remote Sens. 2018, 10, 809. [Google Scholar] [CrossRef]
- Oniga, V.-E.; Breaban, A.-I.; Statescu, F. Determining the optimum number of ground control points for obtaining high precision results based on UAS images. In Proceedings of the Multidisciplinary Digital Publishing Institute Proceedings, online conference, 22 March–5 April 2018; p. 352. [Google Scholar]
- Chen, W.; Yan, L.; Li, Z.; Jing, X.; Duan, Y.; Xiong, X. In-flight absolute calibration of an airborne wide-view multispectral imager using a reflectance-based method and its validation. Int. J. Remote Sens. 2013, 34, 1995–2005. [Google Scholar] [CrossRef]
- Bielinis, E.; Jozwiak, W.; Robakowski, P. Modelling of the relationship between the SPAD values and photosynthetic pigments content in Quercus petraea and Prunus serotina leaves. Dendrobiology 2015, 73, 125–134. [Google Scholar] [CrossRef]
- Kumar, P.; Sharma, R. Development of SPAD value-based linear models for non-destructive estimation of photosynthetic pigments in wheat (Triticum aestivum L.). Indian J. Genet. 2019, 79, 96–99. [Google Scholar] [CrossRef]
- Smith, G.M.; Milton, E.J. The use of the empirical line method to calibrate remotely sensed data to reflectance. Int. J. Remote Sens. 1999, 20, 2653–2662. [Google Scholar] [CrossRef]
- Tucker, C.J. Red and photographic infrared linear combinations for monitoring vegetation. Remote Sens. Environ. 1979, 8, 127–150. [Google Scholar] [CrossRef]
- Zheng, H.; Cheng, T.; Li, D.; Zhou, X.; Yao, X.; Tian, Y.; Cao, W.; Zhu, Y. Evaluation of RGB, color-infrared and multispectral images acquired from unmanned aerial systems for the estimation of nitrogen accumulation in rice. Remote Sens. 2018, 10, 824. [Google Scholar] [CrossRef]
- Brovkina, O.; Cienciala, E.; Surový, P.; Janata, P. Unmanned aerial vehicles (UAV) for assessment of qualitative classification of Norway spruce in temperate forest stands. Geo-Spat. Inf. Sci. 2018, 21, 12–20. [Google Scholar] [CrossRef]
- Huang, W.; Yang, Q.; Pu, R.; Yang, S. Estimation of nitrogen vertical distribution by bi-directional canopy reflectance in winter wheat. Sensors 2014, 14, 20347–20359. [Google Scholar] [CrossRef] [PubMed]
- Tahir, M.N.; Naqvi, S.Z.A.; Lan, Y.; Zhang, Y.; Wang, Y.; Afzal, M.; Cheema, M.J.M.; Amir, S. Real time estimation of chlorophyll content based on vegetation indices derived from multispectral UAV in the kinnow orchard. Int. J. Precis. Agric. Aviat. 2018, 1. [Google Scholar]
- Dash, J.; Curran, P. Evaluation of the MERIS terrestrial chlorophyll index (MTCI). Adv. Space Res. 2007, 39, 100–104. [Google Scholar] [CrossRef]
- Dash, J.; Curran, P.J.; Tallis, M.J.; Llewellyn, G.M.; Taylor, G.; Snoeij, P. Validating the MERIS Terrestrial Chlorophyll Index (MTCI) with ground chlorophyll content data at MERIS spatial resolution. Int. J. Remote Sens. 2010, 31, 5513–5532. [Google Scholar] [CrossRef]
- Cao, Q.; Miao, Y.; Feng, G.; Gao, X.; Li, F.; Liu, B.; Yue, S.; Cheng, S.; Ustin, S.L.; Khosla, R. Active canopy sensing of winter wheat nitrogen status: An evaluation of two sensor systems. Comput. Electron. Agric. 2015, 112, 54–67. [Google Scholar] [CrossRef]
- Duque, A.; Vázquez, C. Double attention bias for positive and negative emotional faces in clinical depression: Evidence from an eye-tracking study. J. Behav. Ther. Exp. Psychiatry 2015, 46, 107–114. [Google Scholar] [CrossRef]
- Gitelson, A.; Merzlyak, M.N. Quantitative estimation of chlorophyll-a using reflectance spectra: Experiments with autumn chestnut and maple leaves. J. Photochem. Photobiol. B Biol. 1994, 22, 247–252. [Google Scholar] [CrossRef]
- Virnodkar, S.S.; Pachghare, V.K.; Patil, V.C.; Jha, S.K. Remote sensing and machine learning for crop water stress determination in various crops: A critical review. Precis. Agric. 2020, 21, 1121–1155. [Google Scholar] [CrossRef]
- Datt, B. Visible/near infrared reflectance and chlorophyll content in Eucalyptus leaves. Int. J. Remote Sens. 1999, 20, 2741–2759. [Google Scholar] [CrossRef]
- Cao, Q.; Miao, Y.; Wang, H.; Huang, S.; Cheng, S.; Khosla, R.; Jiang, R. Non-destructive estimation of rice plant nitrogen status with Crop Circle multispectral active canopy sensor. Field Crops Res. 2013, 154, 133–144. [Google Scholar] [CrossRef]
- Xiao, Y.; Zhao, W.; Zhou, D.; Gong, H. Sensitivity analysis of vegetation reflectance to biochemical and biophysical variables at leaf, canopy, and regional scales. IEEE Trans. Geosci. Remote Sens. 2013, 52, 4014–4024. [Google Scholar] [CrossRef]
- Dall’Olmo, G.; Gitelson, A.A.; Rundquist, D.C.; Leavitt, B.; Barrow, T.; Holz, J.C. Assessing the potential of SeaWiFS and MODIS for estimating chlorophyll concentration in turbid productive waters using red and near-infrared bands. Remote Sens. Environ. 2005, 96, 176–187. [Google Scholar] [CrossRef]
- Ferwerda, J.G.; Skidmore, A.K.; Mutanga, O. Nitrogen detection with hyperspectral normalized ratio indices across multiple plant species. Int. J. Remote Sens. 2005, 26, 4083–4095. [Google Scholar] [CrossRef]
- Law, B.E.; Waring, R.H. Remote sensing of leaf area index and radiation intercepted by understory vegetation. Ecol. Appl. 1994, 4, 272–279. [Google Scholar] [CrossRef]
- Shen, Z.; Fu, G.; Yu, C.; Sun, W.; Zhang, X. Relationship between the growing season maximum enhanced vegetation index and climatic factors on the Tibetan Plateau. Remote Sens. 2014, 6, 6765–6789. [Google Scholar] [CrossRef]
- Peñuelas, J.; Gamon, J.; Fredeen, A.; Merino, J.; Field, C. Reflectance indices associated with physiological changes in nitrogen-and water-limited sunflower leaves. Remote Sens. Environ. 1994, 48, 135–146. [Google Scholar] [CrossRef]
- Filella, I.; Serrano, L.; Serra, J.; Penuelas, J. Evaluating wheat nitrogen status with canopy reflectance indices and discriminant analysis. Crop Sci. 1995, 35, 1400–1405. [Google Scholar] [CrossRef]
- Penuelas, J.; Gamon, J.A.; Griffin, K.L.; Field, C.B. Assessing community type, plant biomass, pigment composition, and photosynthetic efficiency of aquatic vegetation from spectral reflectance. Remote Sens. Environ. 1993, 46, 110–118. [Google Scholar] [CrossRef]
- Wang, F.; Yi, Q.; Hu, J.; Xie, L.; Yao, X.; Xu, T.; Zheng, J. Combining spectral and textural information in UAV hyperspectral images to estimate rice grain yield. Int. J. Appl. Earth Obs. Geoinf. 2021, 102, 102397. [Google Scholar] [CrossRef]
- Haralick, R.M.; Shanmugam, K.; Dinstein, I. Textural Features for Image Classification. Stud. Media Commun. 1973, SMC-3, 610–621. [Google Scholar] [CrossRef]
- Thompson, B. Stepwise regression and stepwise discriminant analysis need not apply here: A guidelines editorial. Educ. Psychol. Measur. 1995, 55, 525–534. [Google Scholar] [CrossRef]
- Bendel, R.B.; Afifi, A.A. Comparison of stopping rules in forward “stepwise” regression. J. Am. Stat. Assoc. 1977, 72, 46–53. [Google Scholar]
- Liu, B.; Zhao, Q.; Jin, Y.; Shen, J.; Li, C. Application of combined model of stepwise regression analysis and artificial neural network in data calibration of miniature air quality detector. Sci. Rep. 2021, 11, 1–12. [Google Scholar] [CrossRef]
- Jin, X.-L.; Wang, K.-R.; Xiao, C.-H.; Diao, W.-Y.; Wang, F.-Y.; Chen, B.; Li, S.-K. Comparison of two methods for estimation of leaf total chlorophyll content using remote sensing in wheat. Field Crops Res. 2012, 135, 24–29. [Google Scholar] [CrossRef]
- Maulik, U.; Chakraborty, D. Remote Sensing Image Classification: A survey of support-vector-machine-based advanced techniques. IEEE Geosci. Remote Sens. Mag. 2017, 5, 33–52. [Google Scholar] [CrossRef]
- Wang, M.; Wan, Y.; Ye, Z.; Lai, X. Remote sensing image classification based on the optimal support vector machine and modified binary coded ant colony optimization algorithm. Inf. Sci. 2017, 402, 50–68. [Google Scholar] [CrossRef]
- Jiang, H.; Rusuli, Y.; Amuti, T.; He, Q. Quantitative assessment of soil salinity using multi-source remote sensing data based on the support vector machine and artificial neural network. Int. J. Remote Sens. 2019, 40, 284–306. [Google Scholar] [CrossRef]
- Chang, C.-C.; Lin, C.-J. LIBSVM: A library for support vector machines. ACM Trans. Intell. Syst. Technol. 2011, 2, 1–27. [Google Scholar] [CrossRef]
- Belgiu, M.; Drăguţ, L. Random forest in remote sensing: A review of applications and future directions. ISPRS J. Photogramm. Remote Sens. 2016, 114, 24–31. [Google Scholar] [CrossRef]
- Rodriguez-Galiano, V.F.; Ghimire, B.; Rogan, J.; Chica-Olmo, M.; Rigol-Sanchez, J.P. An assessment of the effectiveness of a random forest classifier for land-cover classification. ISPRS J. Photogramm. Remote Sens. 2012, 67, 93–104. [Google Scholar] [CrossRef]
- Pal, M. Random forest classifier for remote sensing classification. Int. J. Remote Sens. 2005, 26, 217–222. [Google Scholar] [CrossRef]
- Caruana, R.; Karampatziakis, N.; Yessenalina, A. An empirical evaluation of supervised learning in high dimensions. In Proceedings of the 25th International Conference on Machine Learning, Helsinki, Finland, 5–9 July 2008; pp. 96–103. [Google Scholar]
- Hothorn, T.; Bühlmann, P. Model-based boosting in high dimensions. Bioinformatics 2006, 22, 2828–2829. [Google Scholar] [CrossRef][Green Version]
- Guo, Y.; Fu, Y.; Hao, F.; Zhang, X.; Wu, W.; Jin, X.; Bryant, C.R.; Senthilnath, J. Integrated phenology and climate in rice yields prediction using machine learning methods. Ecol. Indic. 2021, 120, 106935. [Google Scholar] [CrossRef]
- Mafanya, M.; Tsele, P.; Botai, J.O.; Manyama, P.; Chirima, G.J.; Monate, T. Radiometric calibration framework for ultra-high-resolution UAV-derived orthomosaics for large-scale mapping of invasive alien plants in semi-arid woodlands: Harrisia pomanensis as a case study. Int. J. Remote Sens. 2018, 39, 5119–5140. [Google Scholar] [CrossRef]
- dos Santos, R.A.; Filgueiras, R.; Mantovani, E.C.; Fernandes-Filho, E.I.; Almeida, T.S.; Venancio, L.P.; da Silva, A.C.B. Surface reflectance calculation and predictive models of biophysical parameters of maize crop from RG-NIR sensor on board a UAV. Precis. Agric. 2021, 22, 1535–1558. [Google Scholar] [CrossRef]
- Wierzbicki, D.; Kedzierski, M.; Fryskowska, A.; Jasinski, J. Quality assessment of the bidirectional reflectance distribution function for NIR imagery sequences from UAV. Remote Sens. 2018, 10, 1348. [Google Scholar] [CrossRef]
- Zheng, H.; Cheng, T.; Zhou, M.; Li, D.; Yao, X.; Tian, Y.; Cao, W.; Zhu, Y. Improved estimation of rice aboveground biomass combining textural and spectral analysis of UAV imagery. Precis. Agric. 2019, 20, 611–629. [Google Scholar] [CrossRef]
- Schuldt, C.; Laptev, I.; Caputo, B. Recognizing human actions: A local SVM approach. In Proceedings of the 17th International Conference on Pattern Recognition, 2004, ICPR, Cambridge, UK, 26 August 2004; pp. 32–36. [Google Scholar]
- Wang, H.; Hu, D. Comparison of SVM and LS-SVM for regression. In Proceedings of the 2005 International Conference on Neural Networks and Brain, Beijing, China, 13–15 October 2005; pp. 279–283. [Google Scholar]
- Suykens, J.A.; De Brabanter, J.; Lukas, L.; Vandewalle, J. Weighted least squares support vector machines: Robustness and sparse approximation. Neurocomputing 2002, 48, 85–105. [Google Scholar] [CrossRef]



| Latitude (°) | Longitude (°) | Height (m) | Fixed Solution | |
|---|---|---|---|---|
| GCP 1 | 38.0156966331 | 116.6801892261 | 1.434 | yes |
| GCP 2 | 38.0155875386 | 116.6794440042 | 1.530 | yes |
| GCP 3 | 38.0149917169 | 116.6794959572 | 1.487 | yes |
| GCP 4 | 38.0149398778 | 116.6802395461 | 1.316 | yes |
| Spectral Indices | Formulations | Reference |
|---|---|---|
| Normalized Difference Vegetation Index (NDVI) | (NIR − R)/(NIR + R) | [66] |
| Enhanced Normalized Difference Vegetation index (ENDVI) | (RE + G − 2 × B)/(RE + G + 2 × B) | [67] |
| Infrared Percentage Vegetation Index (IPVI) | NIR/(NIR + R) | [68] |
| Normalized Red Index (NRI) | R/(RE + NIR + R) | [69] |
| Transformed Normalized Difference Vegetation Index (TNDVI) | [70] | |
| MERIS Terrestrial Chlorophyll Index (MTCI) | (NIR − RE)/(RE − R) | [71,72] |
| Modified Double Difference Index (MDD) | (NIR − RE) − (NIR − R) | [73,74] |
| Normalized Difference Red Edge (NDRE) | (NIR − RE)/(NIR + RE) | [75,76] |
| Red Edge Chlorophyll Index (RECI) | (NIR/RE) − 1 | [67] |
| Green Soil Adjusted Vegetation Index (GSAVI) | 1.5 × (NIR − G)/(NIR + G+0.5) | [73] |
| Red Edge Chlorophyll Index (CI Red Edge) | NIR/RE − 1 | [67] |
| DATT | (NIR − RE)/(NIR − R) | [77] |
| Normalized Red Edge Index (NREI) | RE/(RE + NIR + G) | [78] |
| Modified Chlorophyll Absorption In Reflectance Index (MCARI) | (NIR − RE) − 0.2 × (NIR − R) ×NIR/RE | [79] |
| Blue Ratio Vegetation Index (GRVI) | NIR/B | [80] |
| Normalized Red Vegetation Index (NRI) | R/(RE + NIR + R) | [81,82] |
| Modified Enhanced Vegetation Index (MEVI) | 2.5 × (NIR − RE)/(NIR + 6 × RE − 7.5 × G + 1) | [78,83] |
| Transformed Normalized Difference Vegetation Index (TNDVI) | [70] | |
| Normalized pigment chlorophyll ratio Index (NPCI) | (R − B)/(R + B) | [84,85,86] |
| Modified Red Edge Green Blue Difference Vegetation Index (MRGBVI) | (RE + 2 × G − 2 × B)/(edge + 2 × G + 2 × B) | Commonly applied |
| Enhanced NIR Green Blue Difference Vegetation Index (ENGBVI) | (RE × NIR + 2 × G − 2 × B)/(RE × NIR +2 × G + 2 × B) | Commonly applied |
| Modified Red Edge NIR Green Blue Difference Vegetation Index (MRNGBVI) | (RE × NIR + G − B)/(RE × NIR + G + B) | Commonly applied |
| Textural Indices | Formula | Value |
|---|---|---|
| Contrast | 0 to the square of the gray level minus one | |
| Correlation | −1 to 1 | |
| Energy | 0 to 1 | |
| Homogeneity | 0 to 1 |
| Spectral Indices | Linear Regression Equations | R2 | p |
|---|---|---|---|
| NDRE | Y = 31.07X + 62.76 | 0.412 | p < 0.001 |
| RECI | Y = 38.74X + 12.60 | 0.389 | p < 0.001 |
| ENDVI | Y = 59.29X − 14.00 | 0.352 | p < 0.001 |
| DATT | Y = 24.16X + 53.00 | 0.411 | p < 0.001 |
| NGI | Y = 90.11X − 127.24 | 0.332 | p < 0.001 |
| MCARI | Y = 42.40X + 30.29 | 0.381 | p < 0.001 |
| MRGBVI | Y = 60.76X – 14.77 | 0.328 | p < 0.001 |
| MRNRVI | Y = 30.01X + 9.92 | 0.376 | p < 0.001 |
| MTCI | Y = 39.96X + 9.74 | 0.375 | p < 0.001 |
| MDD | Y = 50.67X + 58.37 | 0.399 | p < 0.001 |
| Dates | Phenology | Spectral Indices | Textural Indices |
|---|---|---|---|
| 18 August | tasseling date | ENDVI, DATT, NRI, MRGBVI, ENGBVI, MRNGBVI | Contrast, Correlation, Energy, Homogeneity |
| 25 August | silking | ENDVI, DATT, NRI, MRGBVI, ENGBVI, MRNGBVI | Contrast, Correlation, Homogeneity |
| 7 September | blister | ENDVI, NRI, MRGBVI, MRNGBVI, MDD | Contrast, Correlation, Energy, Homogeneity |
| 15 September | milk | ENDVI, NRI, MRGBVI, ENGBVI, MRNGBVI | Contrast, Correlation, Energy, Homogeneity |
| 21 September | physiological maturity | ENDVI, NRI, MRGBVI, ENGBVI, MRNGBVI, MDD | Contrast, Energy, Homogeneity |
| 30 September | maturity | ENDVI, NRI, MRGBVI, ENGBVI, MRNGBVI, MDD | Contrast, Energy, Homogeneity |
Publisher’s Note: MDPI stays neutral with regard to jurisdictional claims in published maps and institutional affiliations. |
© 2022 by the authors. Licensee MDPI, Basel, Switzerland. This article is an open access article distributed under the terms and conditions of the Creative Commons Attribution (CC BY) license (https://creativecommons.org/licenses/by/4.0/).
Share and Cite
Guo, Y.; Chen, S.; Li, X.; Cunha, M.; Jayavelu, S.; Cammarano, D.; Fu, Y. Machine Learning-Based Approaches for Predicting SPAD Values of Maize Using Multi-Spectral Images. Remote Sens. 2022, 14, 1337. https://doi.org/10.3390/rs14061337
Guo Y, Chen S, Li X, Cunha M, Jayavelu S, Cammarano D, Fu Y. Machine Learning-Based Approaches for Predicting SPAD Values of Maize Using Multi-Spectral Images. Remote Sensing. 2022; 14(6):1337. https://doi.org/10.3390/rs14061337
Chicago/Turabian StyleGuo, Yahui, Shouzhi Chen, Xinxi Li, Mario Cunha, Senthilnath Jayavelu, Davide Cammarano, and Yongshuo Fu. 2022. "Machine Learning-Based Approaches for Predicting SPAD Values of Maize Using Multi-Spectral Images" Remote Sensing 14, no. 6: 1337. https://doi.org/10.3390/rs14061337
APA StyleGuo, Y., Chen, S., Li, X., Cunha, M., Jayavelu, S., Cammarano, D., & Fu, Y. (2022). Machine Learning-Based Approaches for Predicting SPAD Values of Maize Using Multi-Spectral Images. Remote Sensing, 14(6), 1337. https://doi.org/10.3390/rs14061337


