Abstract
The 30 m resolution Landsat data have been used for high resolution aerosol optical depth (AOD) retrieval based on radiative transfer models. In this paper, a Landsat-8 AOD retrieval algorithm is proposed based on the deep neural network (DNN). A total of 6390 samples were obtained for model training and validation by collocating 8 years of Landsat-8 top of atmosphere (TOA) data and aerosol robotic network (AERONET) AOD data acquired from 329 AERONET stations over 30°W–160°E and 60°N–60°S. The Google Earth Engine (GEE) cloud-computing platform is used for the collocation to avoid a large download volume of Landsat data. Seventeen predictor variables were used to estimate AOD at 500 nm, including the seven bands TOA reflectance, two bands TOA brightness (BT), solar and viewing zenith and azimuth angles, scattering angle, digital elevation model (DEM), and the meteorological reanalysis total columnar water vapor and ozone concentration. The leave-one-station-out cross-validation showed that the estimated AOD agreed well with AERONET AOD with a correlation coefficient of 0.83, root-mean-square error of 0.15, and approximately 61% AOD retrievals within 0.05 + 20% of the AERONET AOD. Theoretical comparisons with the physical-based methods and the adaptation of the developed DNN method to Sentinel-2 TOA data with a different spectral band configuration are discussed.
1. Introduction
Aerosols play an important role in the Earth’s radiation balance and are considered to be one of the largest sources of uncertainty in global radiative forcing estimation [1]. Aerosol optical depth (AOD) is one of the most important parameters for aerosol research. Over the past several decades, numerous satellite/sensor observations have been used to obtain spatially explicit and frequent AOD, such as MODerate-resolution Imaging Spectroradiometer (MODIS) [2,3,4], Multi-angle Imaging SpectroRadiometer (MISR) [5], Advanced Along Track Scanning Radiometer (AATSR) [6], MEdium Resolution Imaging Spectrometer (MERIS) [7] and Himawari-8 Advanced Himawari Imager (AHI) [8]. The observed top of atmosphere (TOA) signal is often a result of the interactions between the reflection of the Earth surface and the scattering and absorption of the pristine atmosphere and aerosol. The interactions are complicated, but they can be simulated using radiative transfer models. Since both aerosol and surface optical properties are unknown, in the classical AOD retrieval algorithms, some a priori assumptions are made on surface reflectance. The dark target (DT) [9,10] method assumes fixed ratios between the visible and 2.1 μm shortwave infrared (SWIR) band surface reflectance over dense dark vegetation. The deep blue (DB) [11,12] method uses a pre-calculated static surface reflectance [12] for AOD retrieval over bright surface. In addition, the multiangle implementation of the atmospheric correction (MAIAC) algorithm [4,13] uses multiple temporal observations to jointly retrieve AOD and surface reflectance using an established three-parameter surface reflection anisotropy model to model reflectance at any Sun/viewing angle [14]. The DT, DB and MAIAC algorithms were originally developed for MODIS AOD product and have been adapted to many other sensors. For example, the DT has been applied to the Visible Infrared Imaging Radiometer Suite (VIIRS) [15] and Himawari-8 AHI data [16], the DB to the Advanced Very High Resolution Radiometer (AVHRR) [17] and the Himawari-8 AHI data [18], and the MAIAC to the Himawari-8 AHI data [19].
The AOD products derived from AVHRR, MODIS, MISR and Himawari-8 sensors have a low spatial resolution (≥1 km), which limits their applications in regional air pollution research especially in urban regions with spatially heterogonous pollution sources [20,21,22]. Many recent studies focused on obtaining high spatial resolution AOD (<1 km) using Gaofen (GF, meaning high-resolution in Chinese) and Landsat data [23,24,25]. Landsat AOD can be retrieved using atmospheric correction software, such as the Landsat Ecosystem Disturbance Adaptive Processing System (LEDAPS) for Landsat-5 and -7 [26] and the Land Surface Reflectance Code (LaSRC) for Landsat-8 [27]. The two software are based on DT for AOD retrieval and are operationally used by the United States Geological Survey (USGS) to generate Landsat surface reflectance products [28]. However, the AOD output is not accessible to users and their application for AOD retrieval is thus only limited to experts who have the capability to run these complicated software that are developed for the USGS computer environment [29,30]. Consequently, users have to develop their own Landsat AOD retrieval algorithms [25,31,32,33]. Sun et al. [24] and Wei et al. [25] used a pre-calculated surface reflectance database based on MODIS (MOD09) and Landsat surface reflectance data, respectively. Ou et al. [34] retrieved AOD from Landsat data using a DT-based method.
These physical model-based Landsat-8 AOD retrieval methods are often used for a few cities mainly because it is difficult to determine the appropriate aerosol models and surface reflectance assumptions across all the world urban locations. An alternative way is to use machine learning methods to approximate the complicated physical relationship between AOD and satellite TOA observations without any a priori assumption on aerosol model and surface reflectance. The ground based AOD observation data (such as AERONET) provide large volume training data for machine learning tasks. Machine learning methods have been used for AOD retrieval and showed promising performance, e.g., recently developed deep neural networks (DNNs) for Himawari-8 AHI AOD retrieval [35,36,37]. There are also studies using a deep belief network for Landsat AOD retrieval [38,39]. The deep belief network is not a fully supervised training approach as it requires an unsupervised process in initial parameterizations and the later training process serves only for fine-tuning network parameters. In this study, we explore a fully supervised DNN method to estimate high spatial resolution AOD from Landsat-8 data by leveraging a cloud computing platform to handle large volume data for an area covering 60°S–60°N and 30°W–160°E. The DNN predictors include the TOA reflectance, TOA brightness temperature (BT), sun-sensor geometry, digital elevation, total columnar water vapor and total columnar ozone. The Landsat-8 data acquired in the period of 2013–2020 are collocated in space and time with AERONET AOD for training and validation.
2. Data
2.1. AERONET Data
AERONET consists of a global ground-based network of sun–sky photometers [40] that provides near continuous (typically every three minutes) daytime measurements of spectral solar irradiance, spectral AOD, water vapor, and inversion aerosol products. AERONET stations provide long-term spectral AOD ranging from visible to near-infrared (NIR) channels (340–1020 nm). The AERONET AOD has a low positive bias of 0.02 (in AOD, unitless) and one sigma uncertainty of 0.02 [41] and is commonly used as a reference dataset for satellite AOD product validation. The AERONET data are categorized into three different quality levels: L1.0 (unscreened), L1.5 (cloud-screened), and L2.0 (cloud-screened and quality-assured). In this study, AOD data at 500 nm with quality Level 2.0 from the latest Version 3.0 [41] were used. All the version 3.0 AERONET data over the 329 AERONET stations between 30°W–160°E and 60°N–60°S during 2013–2020 were used for training and validation. The area covers most of Asia, Europe, Africa and Australia.
2.2. Collection-1 and -2 Landsat-8 Data
Landsat-8, operated by the U. S. Geological Survey (USGS), was launched on 11 February 2013 and carries the optical wavelength Operational Land Imager (OLI) and the thermal wavelength Thermal Infrared Sensor (TIRS) in a circular sun-synchronous orbit with an equatorial crossing time of 10:00 a.m. The OLI providing nine reflective band observations with one panchromatic band at 15 m resolution and the other eight bands at the Landsat heritage 30 m resolution (Table 1). The TIRS provides observations at two thermal infrared bands and at 100 m spatial resolution. The thermal band data products are usually resampled to 30 m resolution by the USGS. The revisit cycle of Landsat-8 is 16 days, thus there are 22 or 23 observations per year with 44 to 46 observations at the swath overlapping areas [42]. The Landsat-8 has a field of view of 15° and has the off-nadir pointing capability for emergency response. Most of the time, it is operated in nadir mode (e.g., maximum viewing angle about 7.5° without consideration of Earth surface curvature). The Landsat-8 data are publicly and freely available and are defined in Worldwide Reference System (WRS-2) in Universal Transverse Mercator (UTM) projection.

Table 1.
Bandwidth and spatial resolution of the 11 bands of the Landsat-8 OLI/TIRS data.
In 2017, USGS started to use ‘Collection’ to manage the data, software and algorithm updates, and reprocessed all the Landsat archive, including Landsat-8 data into Collection-1 format [28]. The Collection-1 data include the TOA reflectance and BT bands, a quality assessment band indicating for each 30 m the presence of cloud, cloud shadow, water and snow/ice, and scene level metadata, including acquisition time. In December 2020, the USGS reprocessed all the Landsat archive into Collection-2 format. In addition to including the Collection-1 data content, the Collection-2 also includes the atmospherically corrected reflectance (i.e., surface surface), per-pixel solar and viewing geometries (zeniths and azimuths) and the quality assessment band with improved accuracy. The Collection-2 data also has a better geolocation accuracy [43]. In recognition of the wide application of Landsat data, the Google Earth Engine (GEE) also holds a copy of the whole archive of the Collection-1 data and at the time of writing this paper, the Collection-2 data was not yet copied over. The GEE is an online cloud-computing platform that holds massive satellite images, including Landsat, Sentinel, and MODIS data.
In this study, the Landsat-8 data acquired over the AERONET stations between 30°W–160°E and 60°N–60°S during 2013–2020 were used. The data includes the Collection-1 TOA reflectance from bands 1–7 and TOA BT from the two TIRS bands and the Collection-2 per-pixel quality assessment band, and solar and viewing geometry and scene metadata (Table 1). The panchromatic band is not used as its information is contained in its spectrally overlapping blue, green, and red bands. The cirrus band is not used as it is designed to detect the cirrus cloud and has little information about land surface and aerosols. The TOA reflectance and BT data used the Collection-1 data available on the GEE to avoid the massive volume data download. The corresponding Collection-2 sun-sensor geometry data as well as the quality assessment (QA) band data were downloaded using the USGS Machine-to-Machine (M2M) Application Programing Interface (API) as these data have much smaller volume (<20 MB/scene) and they (Collection-2 data) are not yet available on GEE platform at the time of the paper’s writing.
2.3. Auxiliary Data: Atmospheric Reanalysis and Digital Elevation Data
The effect of gas absorption must be considered in aerosol estimation as the absorption by water vapor and columnar ozone affects the visible band TOA reflectance. The total columnar water vapor (kg m−2) and total columnar ozone (kg m−2) from the ERA5 hourly data were used. The ERA5 (ECMWF Reanalysis v5) is the fifth generation European Centre for Medium-Range Weather Forecasts (ECMWF) atmospheric reanalysis of the global climate. ERA5 provides estimates of atmosphere variables for each hour with a spatial resolution of 0.25° × 0.25° (~27 km at Equator). In addition, digital elevation is related to the scattering and absorption of sunlight by atmospheric molecules. The digital elevation data from the Shuttle Radar Topography Mission (SRTM) digital elevation model (DEM) with a 90 m spatial resolution were used in this study.
3. Method
3.1. Training and Validation Sample Collection by Collocating Landsat-8 and AERONET Observations
A total of 6390 training and validation samples were extracted from the collocated Landsat-8 TOA and the AERONET observations. Spatially, the observations from the Landsat-8 30 m pixel closest to the AERONET station were used. Temporally, the AERONET 500 nm AOD measurements around the Landsat-8 acquisition time (±30 min) were averaged as the AOD value. At least 3 AERONET observations were required to obtain a robust average value, and only AERONET data with a positive 500 nm AOD were used. In addition, Landsat-8 observations identified as cloud, cloud shadow, cirrus, dilated cloud or fill data were discarded based on the QA band of Landsat data. In addition, observations with blue band TOA reflectance >0.4 were discarded to further exclude cloudy pixels that may be missed by the Landsat-8 cloud mask. The AERONET measurements and Landsat-8 observations between 30°W–160°E and 60°N–60°S during 2013–2020 were used.
Each sample contains a temporally averaged AERONET AOD and seventeen predictor variables derived from the Landsat observations and auxiliary data. The seventeen predictor variables include the seven band (bands 1–7) OLI TOA reflectance, the two band TIRS TOA BT, the solar and viewing zenith, the solar and viewing azimuth, the scattering angle, SRTM DEM, and ERA5 hourly total columnar water vapor and total columnar ozone. The Collection-1 TOA reflectance and BT without any QA layer filtering were first collocated with the AERONET AOD using the GEE platform to avoid a large volume Landsat image download. The collocated results were saved in a two-dimensional table with rows storing collocated samples and columns storing the AEROENT AOD, latitude, longitude, Landsat-8 acquisition time, TOA reflectance, and TOA BT and the Landsat-8 Scene ID. The Collection-2 Landsat-8 solar and viewing geometry and QA bands for the Landsat-8 scenes in the table were then downloaded and their pixel values added to the table columns. Finally, the atmospheric reanalysis and digital elevation data were added to the table columns by finding the nearest pixel location of each sample.
3.2. Deep Neural Network AOD Retrieval and Validation
The deep neural network (DNN) was constructed by advancing the three layer (one input, one hidden and one output layer) artificial neural network (ANN) with multiple hidden layers [44]. In this study, the 17 predictors were used as the input layer and the 500 nm AOD (one single value) as the output layer. It should be noted that the different DNN structures have small performance differences given sufficient training samples, despite that optimal DNN structure being usually unknown in deep learning applications [45]. This study used the same structure we developed for Himawari-8 AHI AOD retrieval [35]. Specifically, three hidden layers were used with 256, 512 and 512 neurons. Other deeper structures (with 6 layers and 8 layers) were tested with little improvement in performance. The state-of-the-art practices for DNN training were used. The mini-batch gradient descent search method was used [46] with a batch size of 256 and 200 epochs to ensure a stable and robust solution. The weight and bias were carefully initialized following He et al. [47]. To be specific, the bias was initialized as 0, while the weights were initialized with random values drawn from a normal distribution with 0 mean and with standard deviation determined by the neuron number of the previous layer. Batch normalization [48] was used as regularization to avoid over-fitting. A dynamic learning rate was used where the training starts with a large learning rate for fast coverage and then deceases the learning rate to avoid loss function oscillation around the minimum when the loss approaches the minimum. The learning rate was initialized as 0.1 and decreased to 0.01, 0.001 and 0.0001 at the 80, 120 and 160 epochs, respectively [49]. The DNN is implemented using the Google TensorFlow application programing interface (API) [50].
The DNN retrieved AOD was compared with the reference AERONET AOD at 500 nm using the correlation coefficient (R), root-mean-square error (RMSE), mean absolute error (MAE), linear regression slopes, and fraction within the uncertainty of ± (0.05 + 0.20 *AODAERONET) [12]. Two cross-validation methods were used following She et al. [35]: (i) k-fold cross-validation and (ii) leave-one-station-out cross-validation. Cross-validation is achieved by training and applying DNN multiple times, each with different training and validation samples. Consequently, each sample is used as a validation sample so that a total of 6390 samples are validated. The 6390 samples are randomly partitioned into k equally sized subsamples. A single subsample is used to validate the model trained by the other k − 1 subsamples. The training and validation process is repeated k times so that every single sample is used as an independent validation sample [51]. The k-fold cross-validation has been used in the validation of PM2.5 estimation using machine learning methods [52,53]. However, in the k-fold cross-validation, the training and validation samples may come from the same AERONET station for each DNN validation, which could overestimate the accuracy for machine learning models [35]. In this study, k was set at 329 so that the numbers of training samples in (i) and (ii) are comparable.
In the (ii) leave-one-station-out cross-validation, the 6390 samples were partitioned into 329 subsamples (there are 329 AERONET stations) and all samples in each subsample were from the same unique AERONET station. A single subsample was used to validate the model trained by the other 328 subsamples. The training and validation process was repeated 329 times so that every single sample was used as an independent testing sample and the validation samples came from different locations than the training samples. This corresponds to the real situation where the AERONET stations are distributed sparsely over the globe and the DNN model application locations usually does not have AERONET observations. This has been used in the validation of PM2.5 estimation using machine learning methods [54,55].
4. Results
4.1. Descriptive Statistics of the Collocted Training and Validation Samples
The mean, standard deviation, maximum, and minimum values of the AOD and the 17 predictor variables in the 6390 data records are presented in Table 2. The AOD ranges from 0.003 (occurred in station Albergue_UGR) to 2.735 (occurred in station Chiang_Mai_Met_Sta) with a mean value of 0.234, which is comparable to the global multi-year mean MODIS AOD value of 0.19 reported in Remer et al. [56]. As expected, the four visible bands (bands 1–4) have very similar TOA reflectance (0.143–0.164). The mean NIR band TOA reflectance (0.258) is higher than the visible band because of vegetation presence in the AERONET stations. The two mean SWIR bands reflectance (0.241 and 0.178) is lower than NIR band due to the water absorption in soil and vegetation. The BT covers a range of temperatures for the two thermal bands, e.g., the thermal band 10 BT ranges from 262.0 K (−11.1 °C) to 327.7 K (54.6 °C) with a mean value of 298.7 K (25.5 °C). The mean viewing zenith angle is 3.6°, which is expected considering that the viewing zenith angle ranges from 0° to ~8° for Landsat-8 image acquired in nadir operations [57]. The 17.48° maximum viewing angle was observed for an off-nadir pointing scene that was acquired on 13 May 2013 for WRS2 path 130 row 30. The minimal solar zenith angle is 20.2°, which is slightly higher than the global minimal Landsat-5 and 7 solar zenith angle 22.14° [58] because of its ~30 min later overpass time.
Table 2.
Descriptive statistics for AERONET AOD and 17 predictor variables. The AOD and TOA reflectance are unitless.
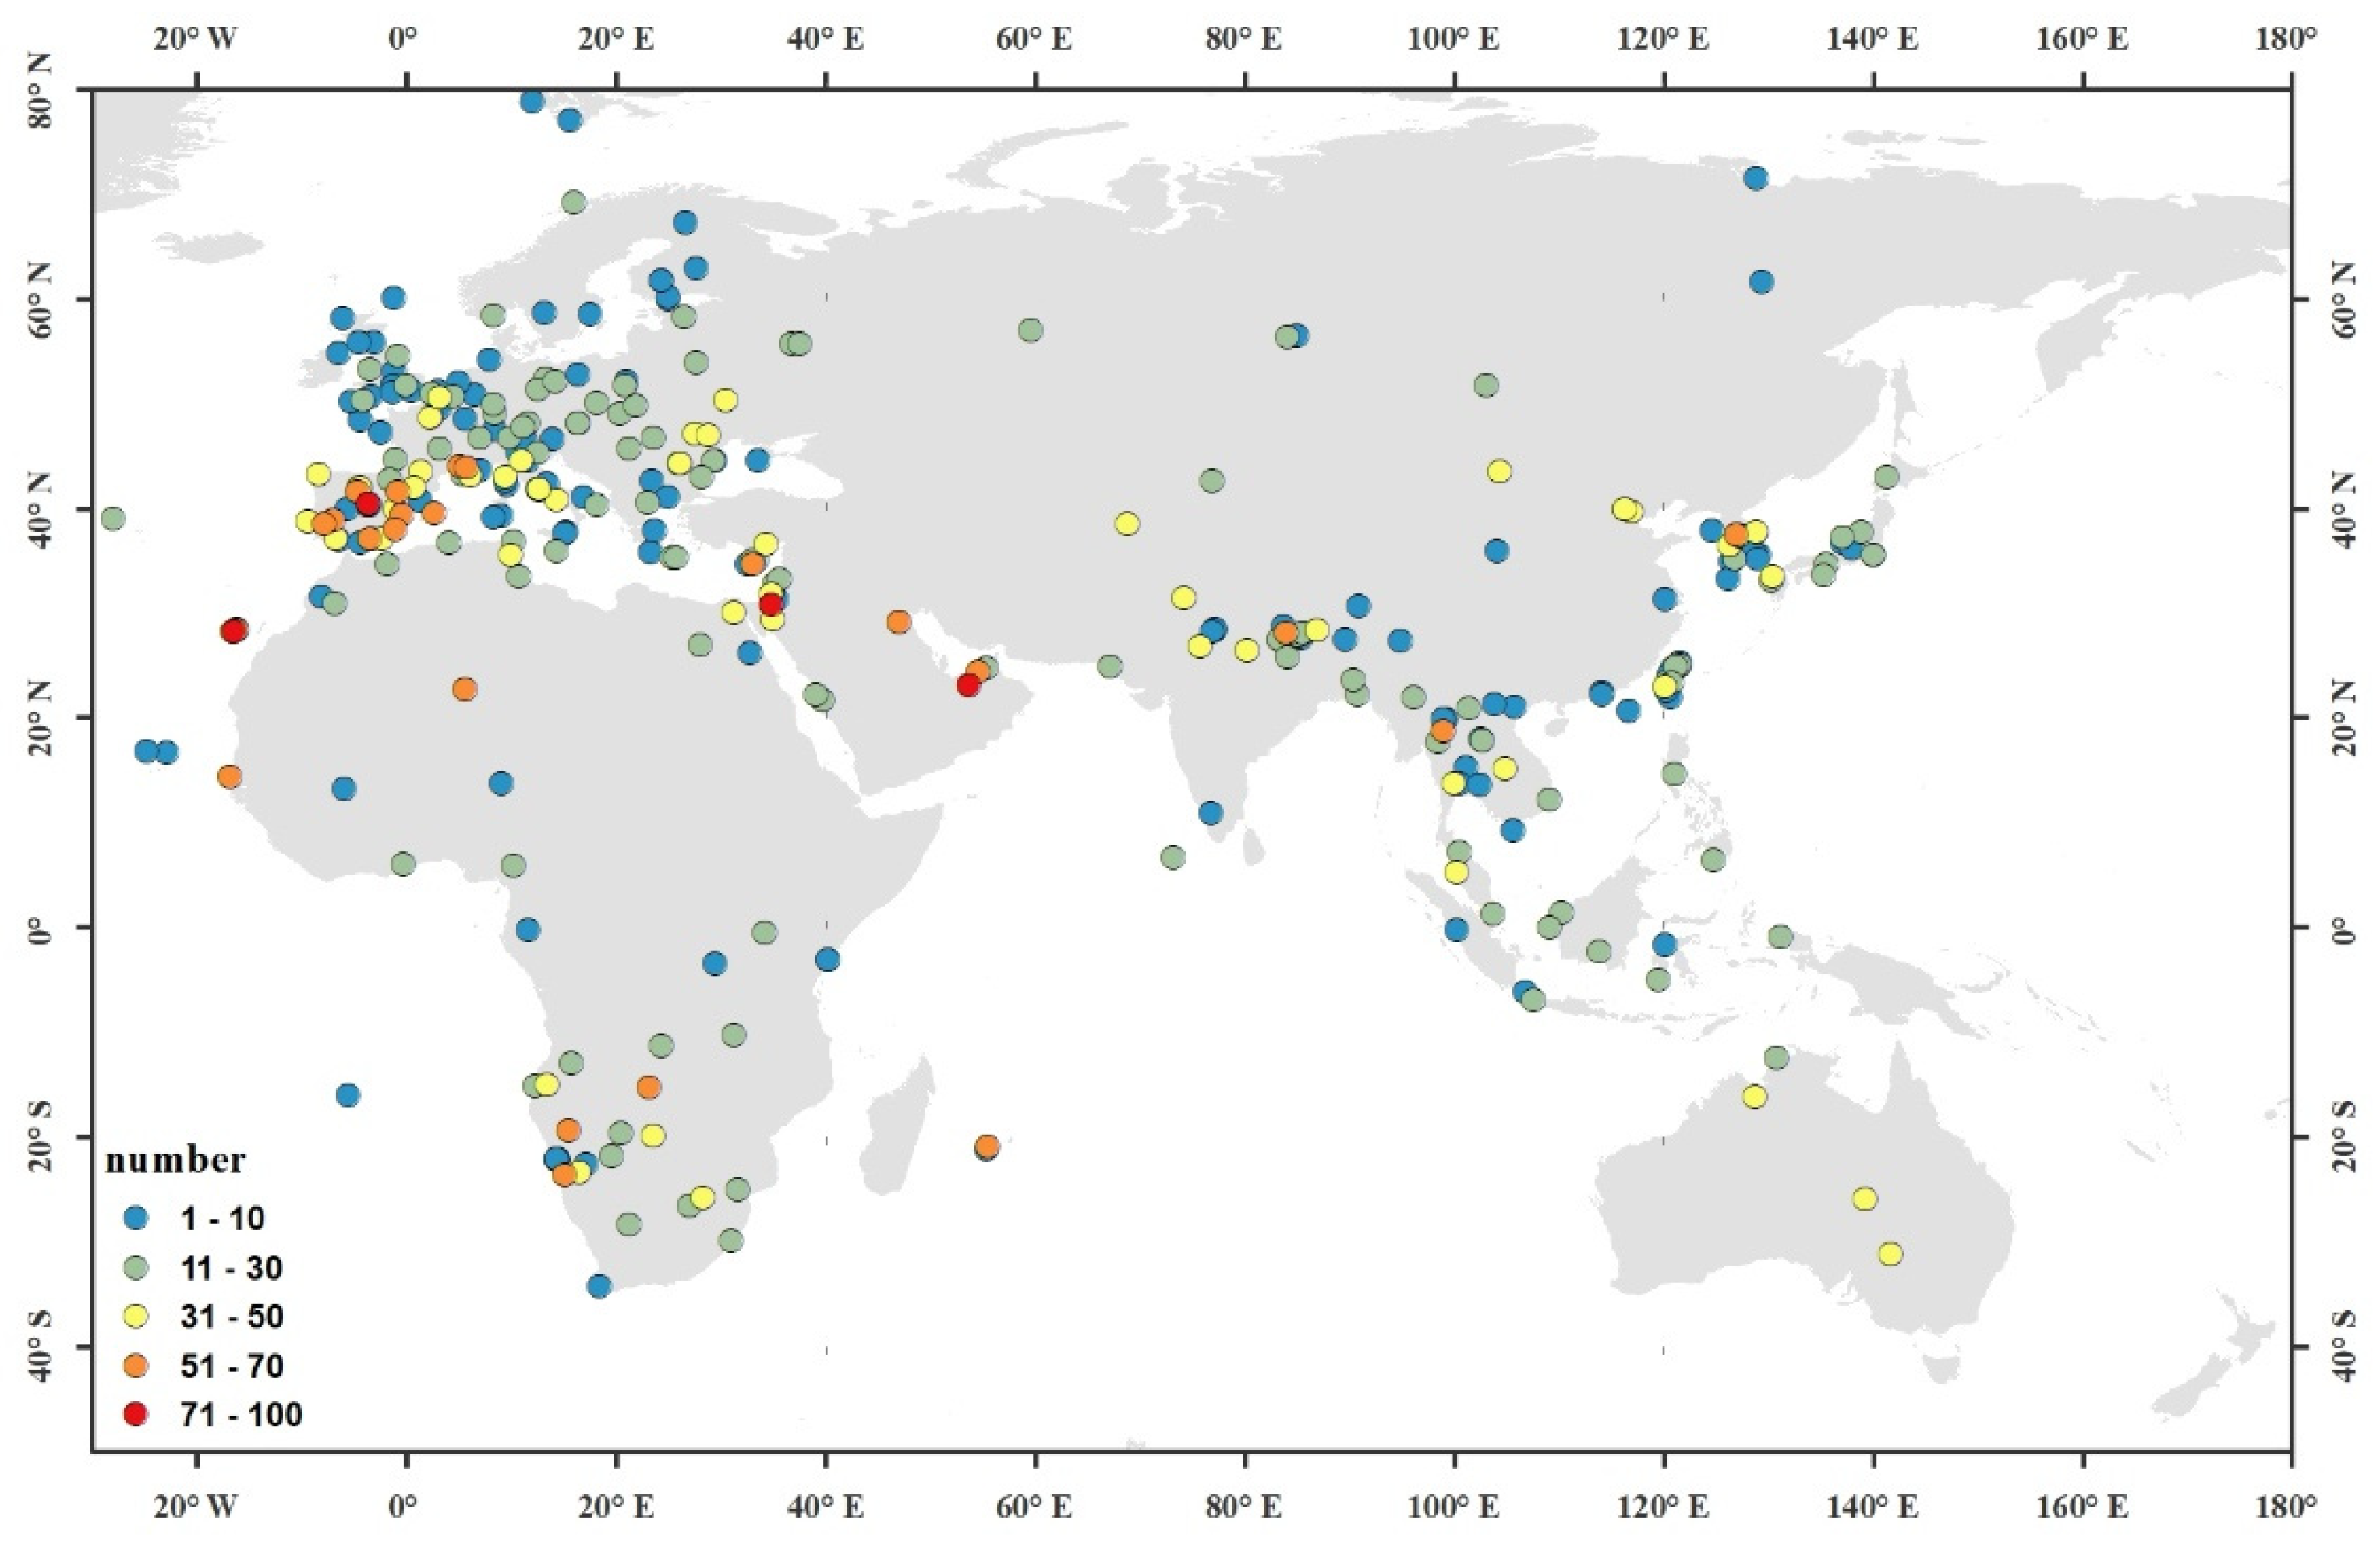
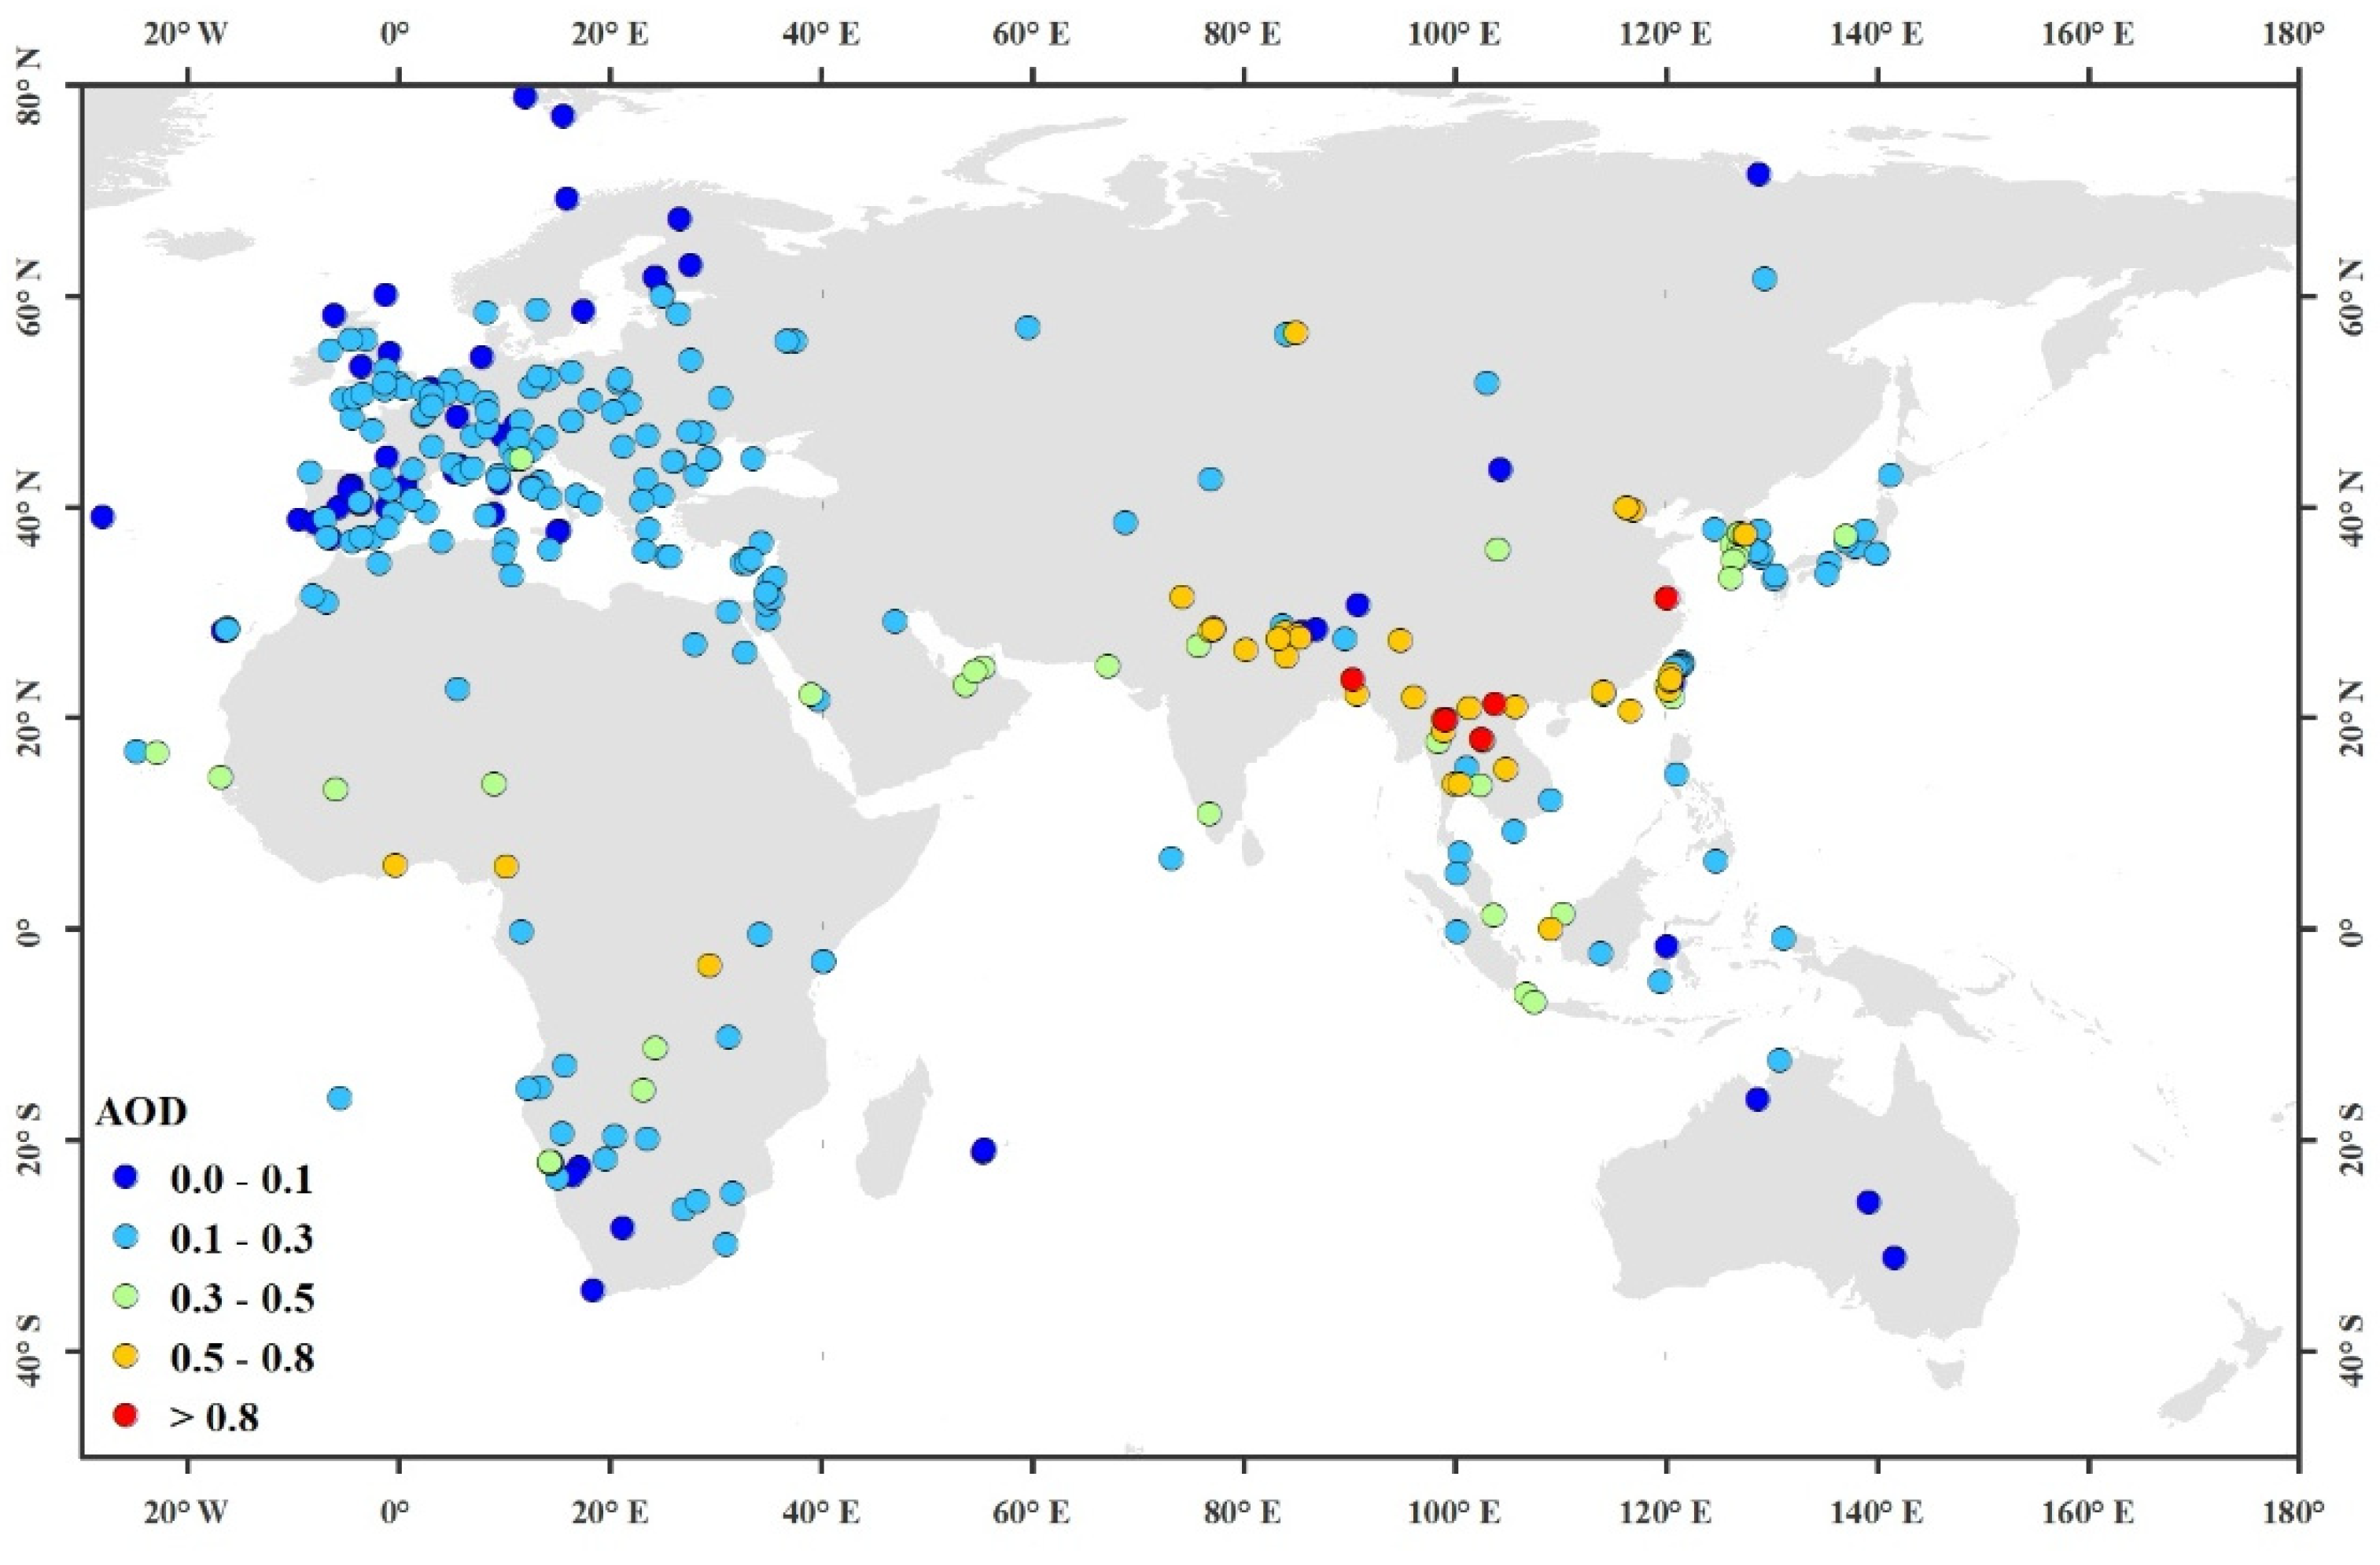
Figure 1 shows the number of collocated samples for each AERONET station. On average, each station has 19.4 samples extracted from the eight years (2013–2020) of Landsat-8 data. This small number of collocated samples compared to the total Landsat-8 observations in each station (>176 = 8 × 22) reflects the strict criteria to collocate samples (Section 3.1). The number variations across different stations reflect the different Landsat-8 cloud coverage and different AERONET station maintenance. The maximum number of the collated samples is 97 in SEDE_BOKER station (30.86°N, 34.78°E in Israel) and minimum number of the collated samples is 1 in 24 stations. Figure 2 shows the average AOD for the collocated samples for each AERONET station. The high AOD value stations are located mainly in Asian countries due to heavy pollution (e.g., the highest mean AOD value is 1.44 in the Maeson station (99.17°E, 19.83°N) in Thailand). Notably, there are some high AOD stations around the Sahara Desert in Africa due to the presence of dust aerosol.

Figure 1.
The number of collocated samples in each AERONET station.
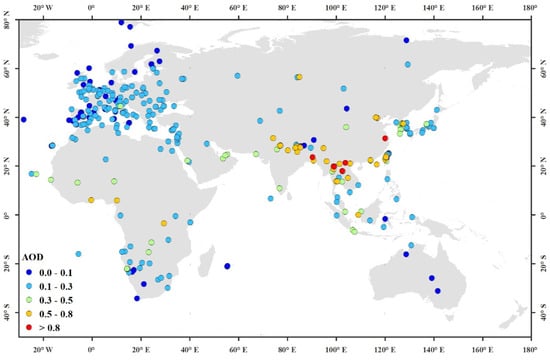
Figure 2.
The average AOD of the collocated samples for each station.
4.2. DNN AOD Validation
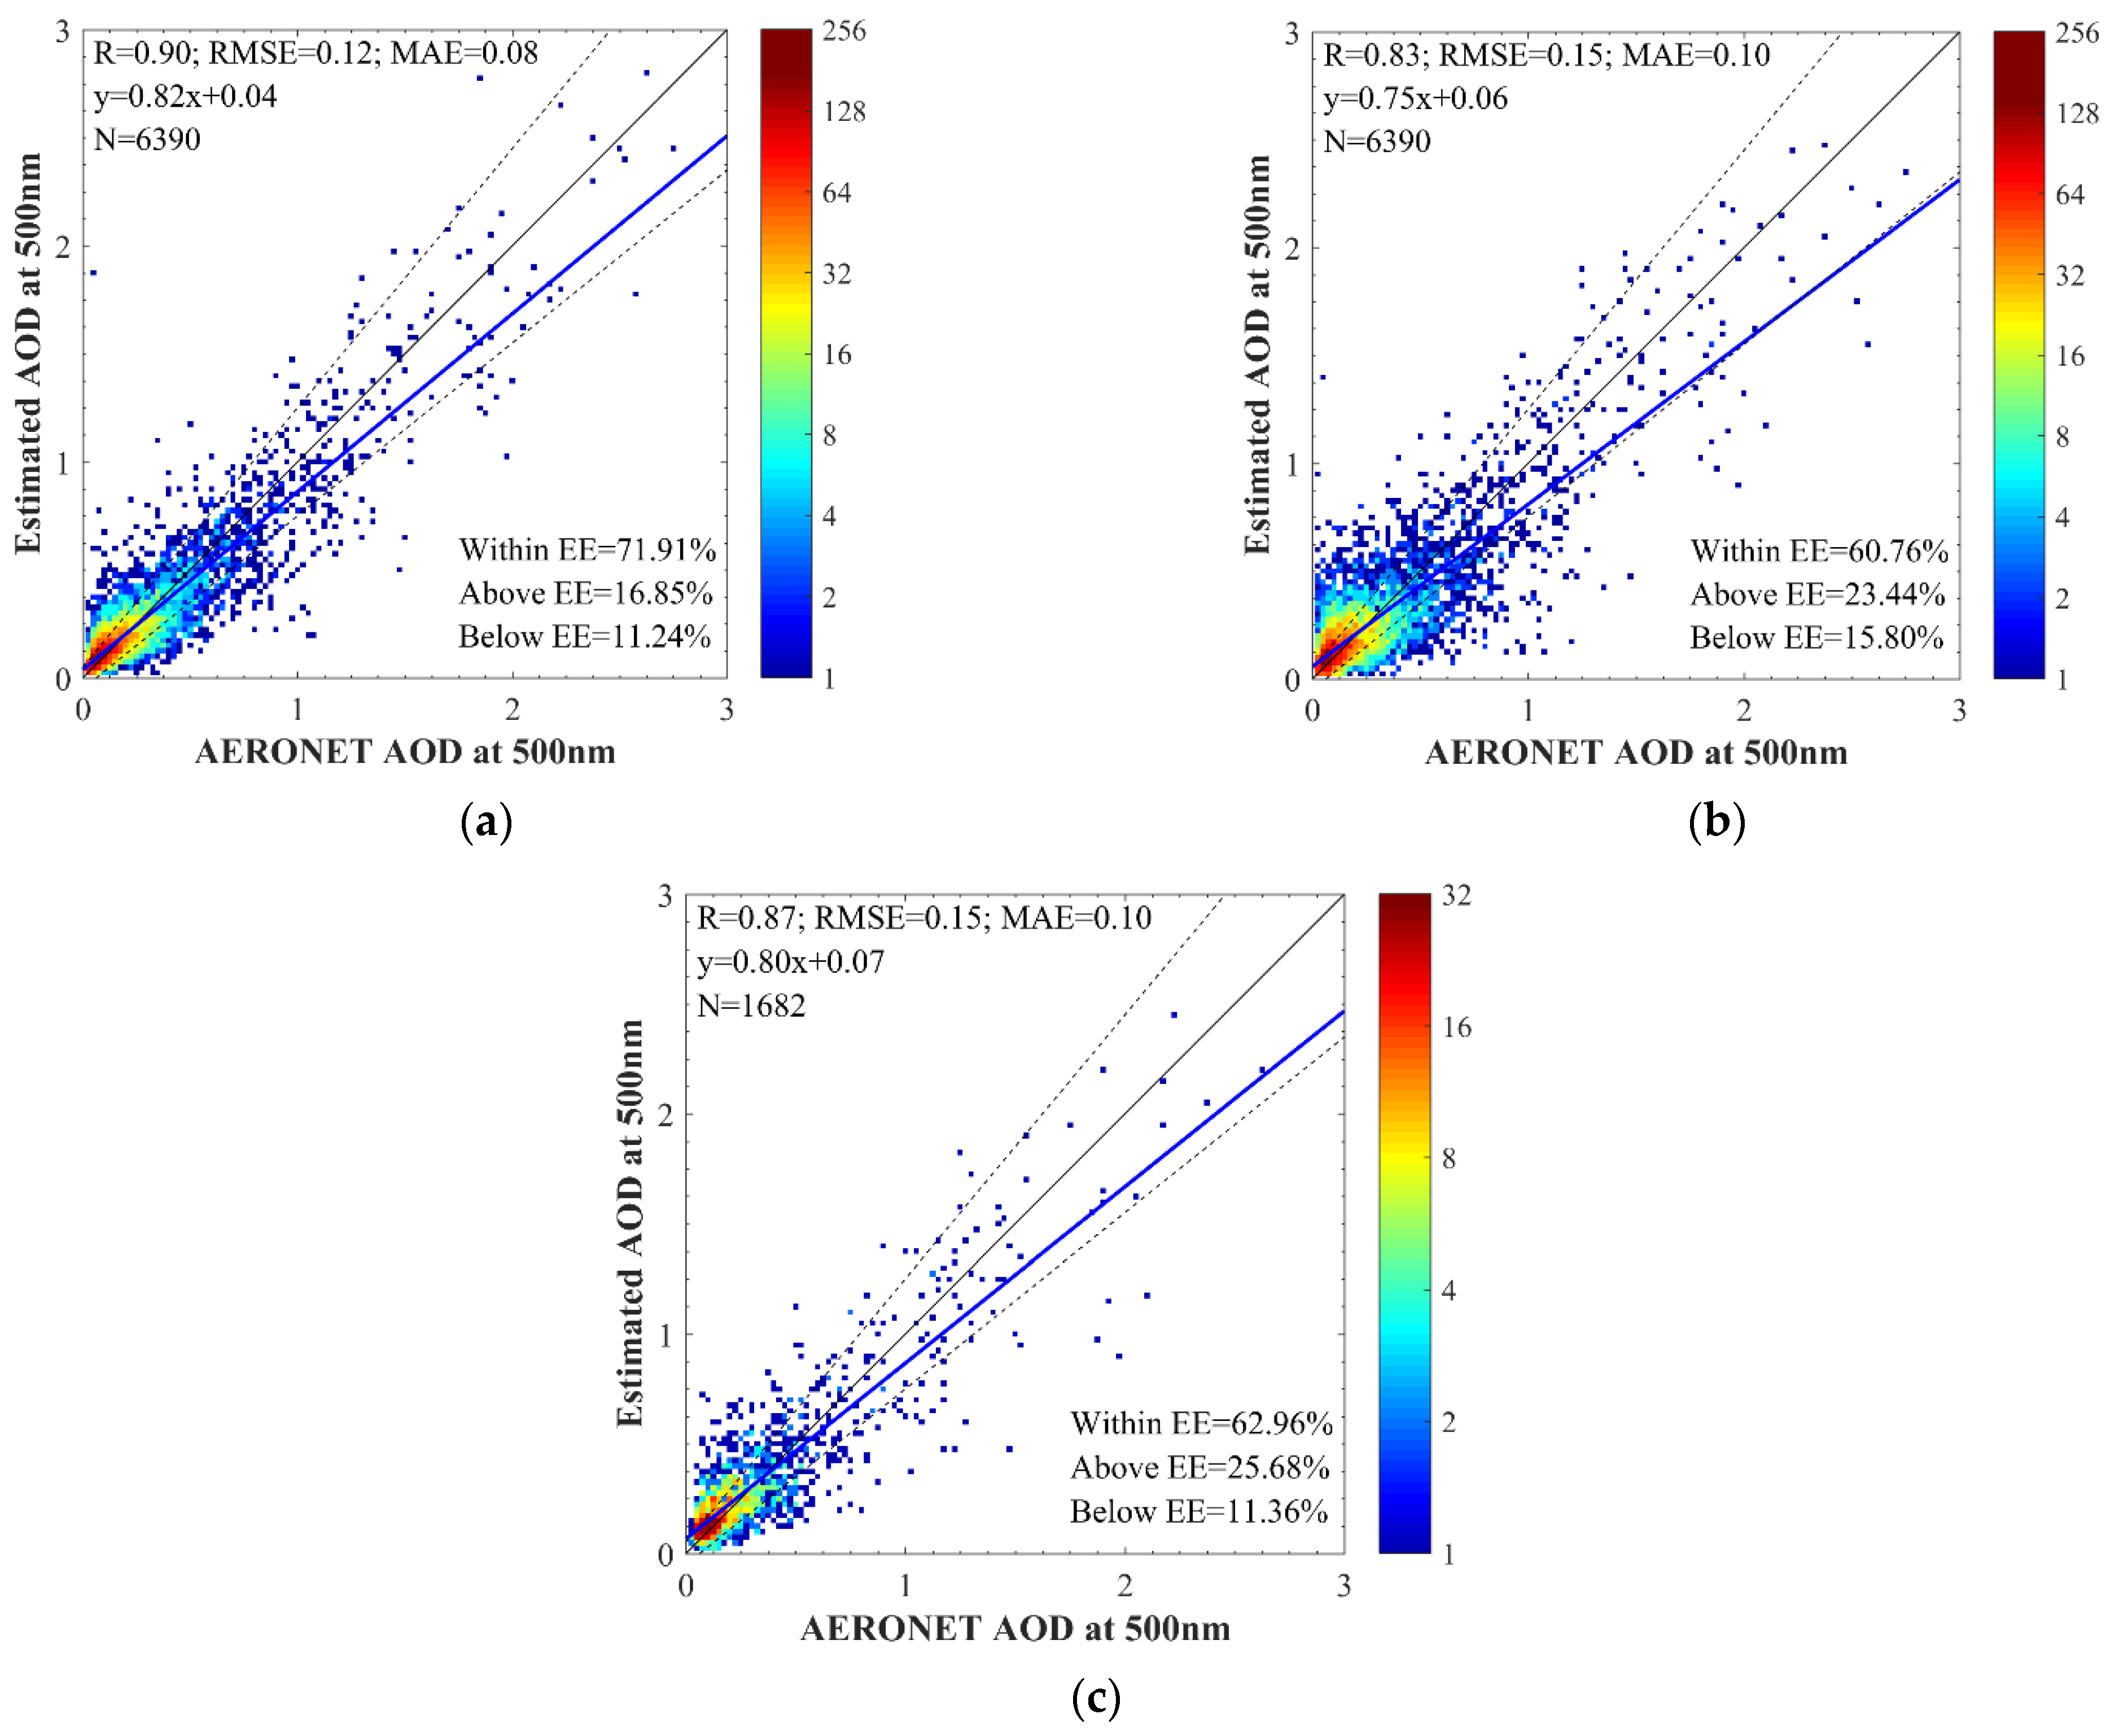
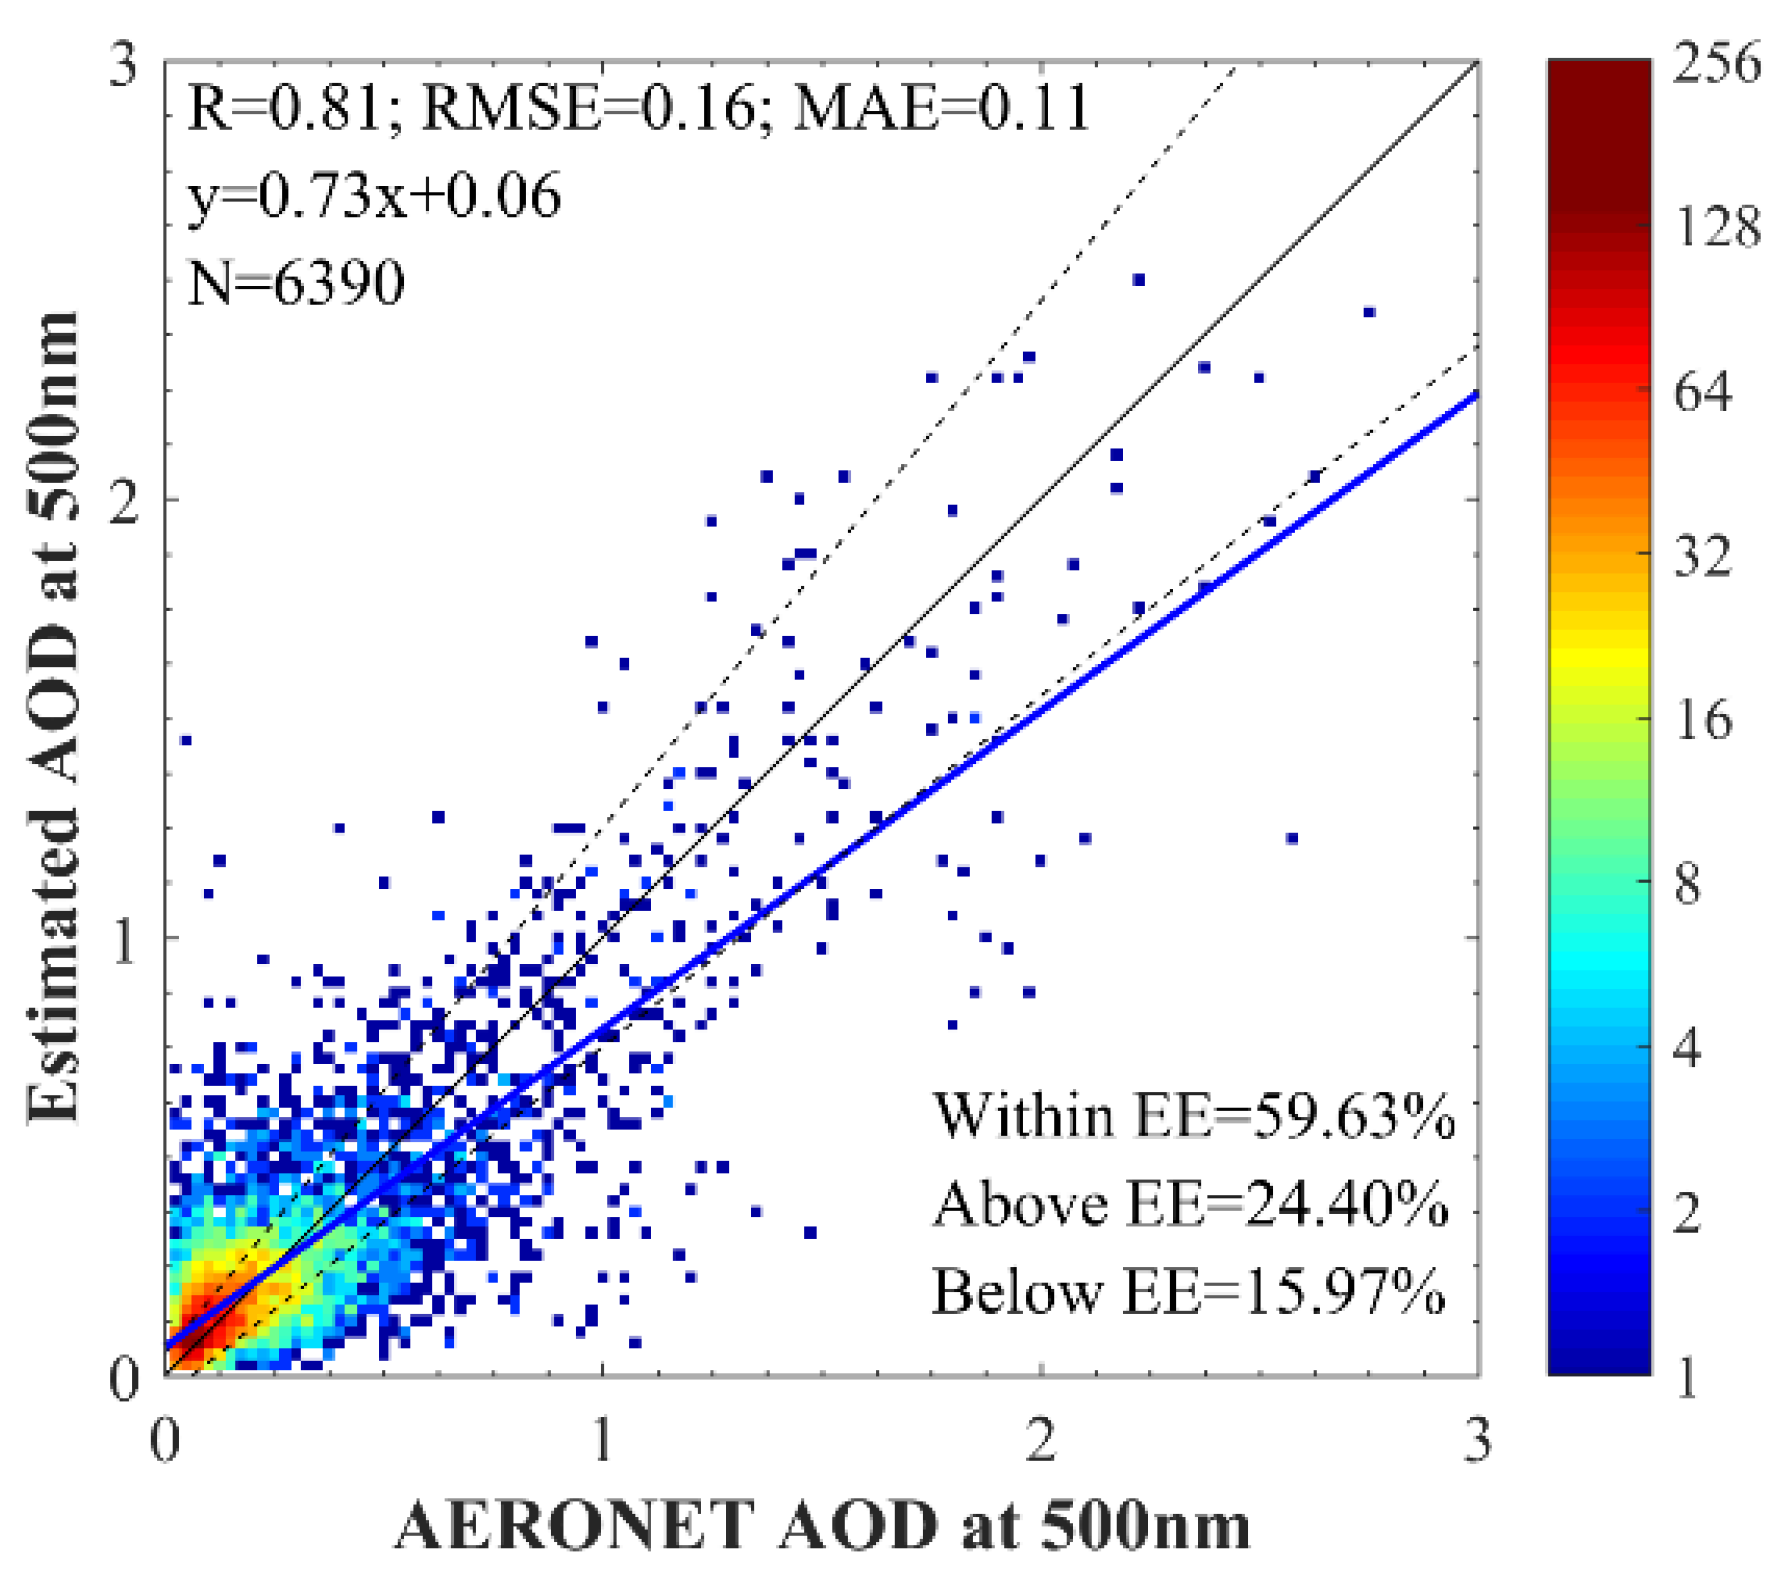
Figure 3 shows density scatterplots between the DNN estimated AOD and the AERONET AOD at 500 nm ((a): k-fold cross-validation; (b): leave-one-station-out cross-validation; (c) same as (b), but only for the urban AERONET stations). The R, RMSE, MAE and linear regression equations are also shown in the figures. Both k-fold cross-validation (Figure 3a) and leave-one-station-out cross-validation (Figure 3b) show good performance in all the evaluation metrics (RMSE = 0.12/0.15, and R = 0.90/0.83, fraction within the uncertainty of ± (0.05 + 0.20 ×AODAERONET) = 72%/61%, respectively). The linear regression slope and intercept are 0.82 and 0.04 for k-fold cross-validation and 0.75 and 0.06 for leave-one-station-out cross-validation, indicating that DNN slightly overestimated low AOD values and underestimated high AOD values. Figure 3c shows the leave-one-station-out cross-validation results for urban AERONET station samples. An AERONET is urban if at least three of the 3 × 3 MODIS pixels centered on the AERONET station are classified as urban in the MODIS land cover product. There are about a fourth of samples (1682) from the identified 89 urban AERONET stations. There is little difference between the accuracies for the urban samples (Figure 3c) and for all samples (Figure 3b).
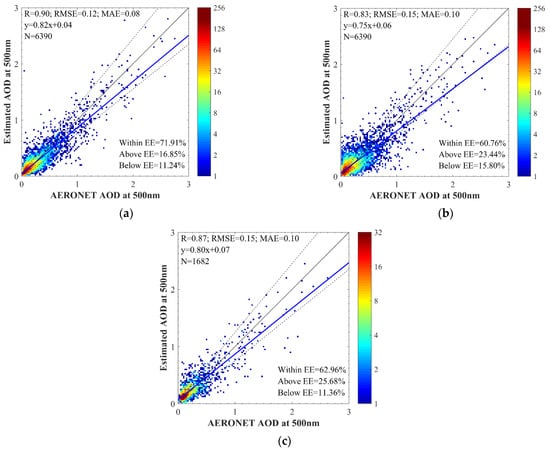
Figure 3.
(a) k-fold cross-validation of the DNN estimated 500 nm AOD (k = 329); (b) leave-one-station-out cross-validation of the DNN estimated 500 nm AOD; and (c) same as (b), but only for urban AEROENTE stations.
The leave-one-station-out cross-validation strategy is recommended for use despite the fact that the accuracy of k-fold cross-validation is better than that of the leave-one-station-out cross-validation. This is because the k-fold cross-validation may boost the validation accuracy as the validation and training samples could come from the same AERONET station. The trained model application to locations without any training data is actually unknown for the k-fold cross-validation and the model is usually less representative to non-AERONET station locations due to the different surface reflectance characteristics and aerosol optical properties. The leave-one-station-out cross-validation has training and validation samples that are forced to come from different stations and thus reflects the accuracy for large-area applications where most of the pixel locations have no AERONET observations for DNN training. For the following analysis, only the results for the leave-one-station-out cross-validation are shown.
Figure 4 shows the RMSE map for the DNN leave-one-station-out AOD validation with RMSE derived for each AERONET station. There are 170 out of 329 stations with RMSE smaller than 0.1 and 12 larger than 0.3. The variety of the RMSE values depends on the station average AOD magnitude (Figure 2). For example, the RMSE of stations in Europe and the Korean Peninsula is small and the RMSE of stations in south Asian countries and around the Sahara Desert is large. There are a few stations with low AOD, but high RMSE values, such as the Simonstown_IMT station in South Africa (with RMSE of 0.40 but mean AOD value of 0.04). The stations with very high RMSE values are located in west-central Africa, where there are only a few training samples and with different aerosol characteristics from Europe and Asia.
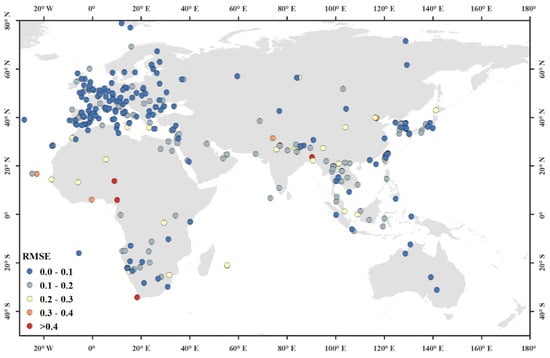
Figure 4.
The AERONET station specific RMSE for the leave-one-station-out AOD validation.
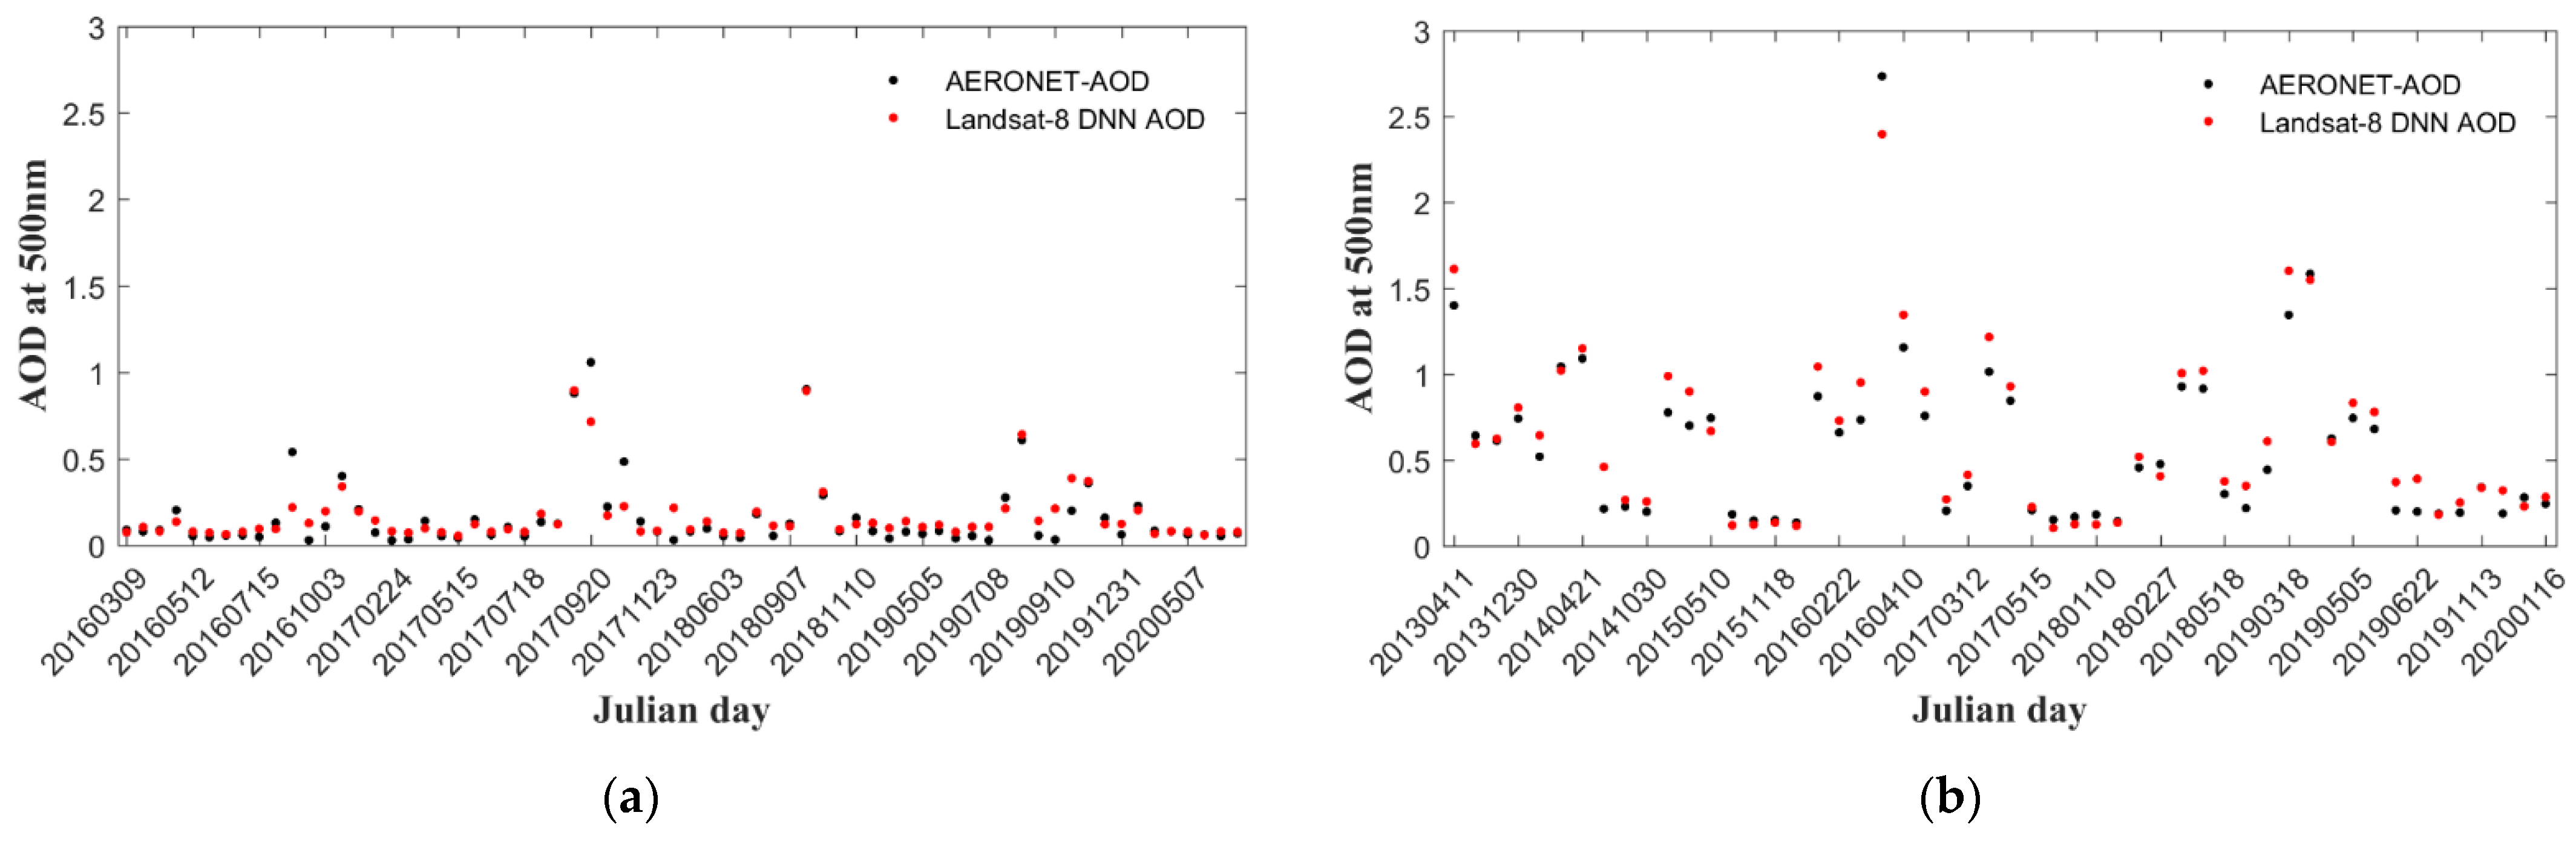
Figure 5 shows two example time series of AOD at the Windpoort station and the Chiang_Mai_Met_Sta station for the AERONET and Landsat-8 DNN AOD. The two AERONET stations are selected for this comparison because of their large number of collocated samples and because they represent low mean AOD (0.16) and high mean AOD (0.58), respectively. The Windpoort station is located at 15.48°E, 19.37°S in Namibia, representing a typical rural aerosol model, and the Chiang_Mai_Met_Sta station is located at 18.77°N, 98.97°E in Thailand, representing a typical polluted urban aerosol model. Despite their differences, the Landsat-8 DNN estimated AOD agrees well with the AERONET measured AOD, and successfully captures the time series fluctuation of the AERONET AOD. There is no apparent underestimation or overestimation of the DNN AOD.

Figure 5.
Example AOD time series at the Windpoort station (a) and the Chiang_Mai_Met_Sta station (b) from AERONET (in black) and Landsat-8 DNN AOD (in red).
5. Discussion
In this study, the AERONET AOD measurements observed within a relatively large temporal window (±30 min) centered at the Landsat-8 acquisition time were averaged as the AOD training data (Section 3.1). To examine whether a smaller temporal window has a better accuracy, we collocated samples using ±5 min and ±15 min temporal windows. To be specific, the AERONET AOD within ±5 min and ±15 min of the Landsat-8 acquisition time were averaged as the AOD and their leave-one-station-out cross-validation results are shown in Figure 6a,b, respectively. As expected, the smaller temporal window generated a smaller number of collocated samples. There is little accuracy difference between the ±15 min (Figure 6b) and ±30 min (Figure 3b) temporal collocation window results. The validation accuracy of the ±5 min window results is slightly inferior to the validation accuracy of the ±15 min and ±30 min window results. This may be because of the smaller number of collocated samples (4608), resulting in insufficient DNN training. Consequently, a relatively large (±30 min) window is used in this study to gain more training samples. Such large temporal window has been applied in AOD validation studies [37,59].
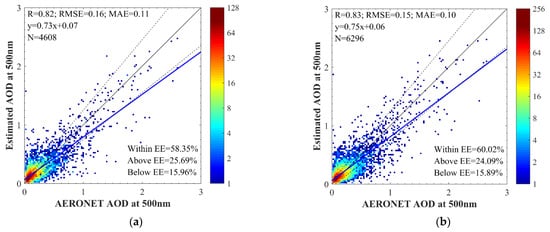
Figure 6.
Leave-one-station-out cross-validation results of the collocated samples by averaging the AERONET AOD observations within (a) 5 min and (b) 15 min of the Landsat-8 overpass.
The DNN method is not to replace the existing radiative transfer methods, but to complement them. As noted in the introduction, the DNN methods try to approximate the complicated physical relationship between AOD and satellite TOA observations without any a priori assumption on aerosol model and surface reflectance. Despite that the current DNN models have very powerful capability to represent complicated relationships, one main and well-known drawback is that the learned model only represents well the physical relationship in the training data. For example, the learned model in this study is not applicable for ocean surface AOD retrieval, which may need a new DNN model trained (calibrated) using the ocean ground AOD measurement data [60]. The training data representativeness is the key for the successful machine learning application. For example, in Figure 4, there are a few AERONET stations with high RMSE in the south of the Sahara Desert, which is, likely, because this region aerosol model and surface condition are not well represented in the training data, i.e., most AERONET stations are not located in the desert. The dust aerosols are distributed in global desert regions [61,62] with relative less human settlement and thus AERONET stations. To further examine this issue, Figure 7 shows the RMSE of the DNN estimated AOD as a function of Ångström exponent that is derived from the AERONET spectral AOD. The Ångström exponent describes the AOD spectral dependence and is usually related to the aerosol models. In general, a high Ångström exponent value is related to fine particles (e.g., industry air pollution aerosols) and a low Ångström exponent value is related to coarse particles (e.g., dust and sea salt aerosols). The AERONET AOD with a small Ångström exponent tends to have a large bias and there is a general decrease trend of RMSE with an increase in Ångström exponent. This is possibly because the AERONET stations in arid and semi-arid regions with dust aerosols dominate the small Ångström exponent AODs and the bright surface reflectance is relatively sparse in the AERONET training dataset. This could also be simply due to the large AOD values in the region, i.e., the AOD magnitude also decreases with the increase in Ångström exponent, which reflects that the coarse aerosols normally have larger AOD values than fine aerosols. Decoupling the two contribution factors is very difficult, if not impossible, and future studies on this are encouraged to understand the DNN algorithm performance.
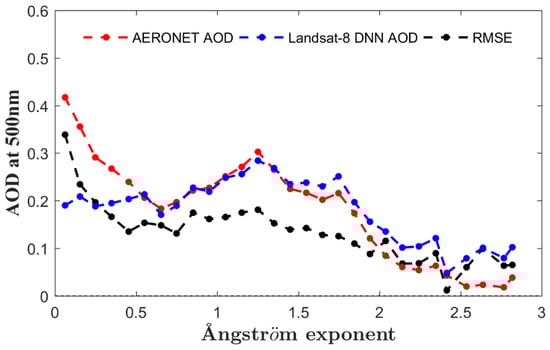
Figure 7.
RMSE in DNN-estimated AOD as a function of Ångström exponent. AERONET AOD, Landsat-8 DNN AOD, and their RMSE are shown in red, blue and black dotted lines, respectively.
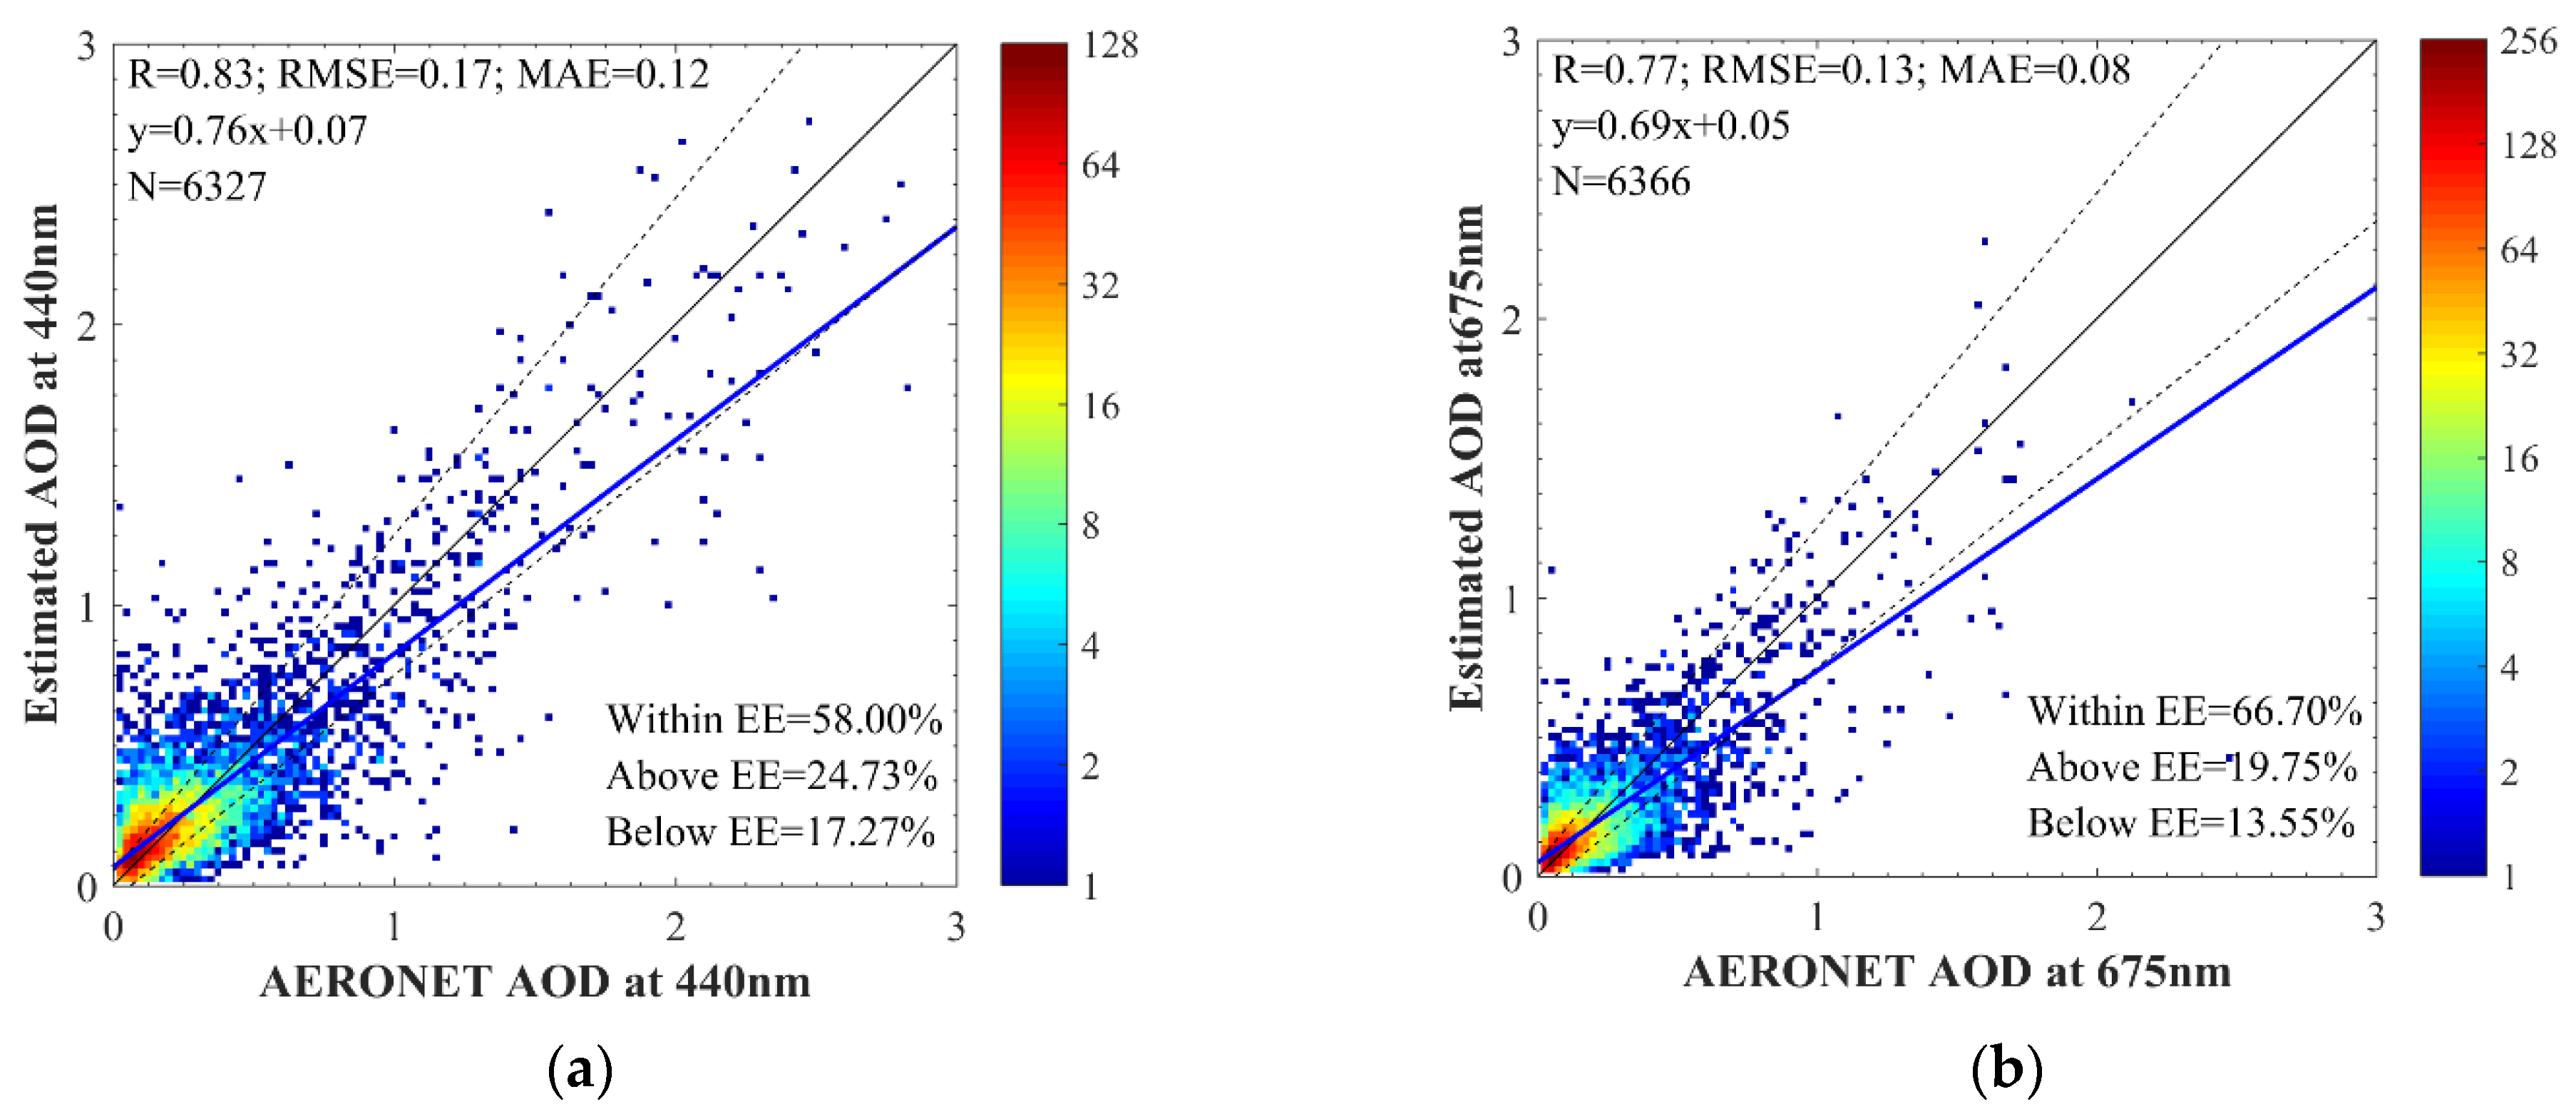
The developed DNN model for 500 nm AOD estimation can neither provide the physical explanations of the underlying learned relationship nor estimate other aerosol-relevant variables. In particular, most physical based methods can estimate AOD at any wavelength using some physical dependence principle of the aerosol model assumptions. For the DNN-based method, however, as no model assumption is given, additional DNN models need to be trained to estimate AOD at other wavelengths. To test the effectiveness, we trained two new models for AOD estimation at 440 nm and 675 nm, respectively, using the same model structure. The same training samples were used, except that the 500 nm AERONET AOD is replaced with the 440 nm and 675 nm AOD, respectively. The leave-one-station-out cross-validation results are shown in Figure 8. The RMSE of 440 nm (RMSE = 0.17), 500 nm (0.15) and 675 nm (0.13) AOD DNN estimation decreases with the wavelength because the AOD magnitude decreases with the wavelength as the particular sizes of the aerosols are normally smaller than these wavelengths. The correlation coefficient (R) is the same for the AOD estimation at 440 nm (0.83) and 500 nm (0.83) and is smaller for 675 nm AOD estimation (0.77), mainly because the 675 nm AOD has a very smaller range of AOD that may decrease the R-value.
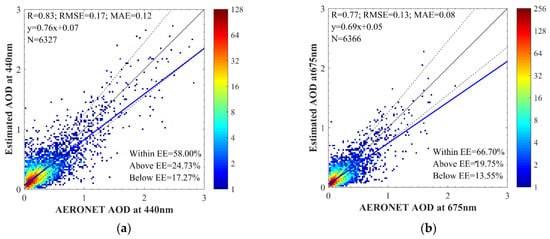
Figure 8.
The scatterplots of the DNN estimated (a) 440 nm and (b) 675 nm AOD results against the corresponding AERONET AODs using the leave-one-station-out cross-validation.
It should be noted that there are no publicly available Landsat-8 AOD products that can be used for inter-comparison with the DNN AOD retrieval in this study. The public available software package Generalized Retrieval of Aerosol and Surface Properties (GRASP) that was developed to jointly characterize aerosol and surface properties for observations, such as POLDER and AERONET [63], may require code adaptations for Landsat-8 observations. The reported accuracy in the literature [25,31,32,33] on Landsat-8 AOD retrieval has an RMSE ranging from 0.04 to 0.135 and R2 ranging from 0.670 to 0.997. Their study regions, however, often cover less than two city locations and a meaningful comparison with this study is impossible. We encourage future study to inter-compare the DNN-based AOD retrieval and physical model-based retrieval to understand better their strengthens and limitations. We also encourage the USGS, who now provides Landsat-8 surface reflectance product, to provide also the AOD product derived in the surface reflectance calculation. This will not only benefit users focusing on aerosol studies but also those land application users who rely on the AOD quality to determine the surface reflectance quality.
The developed method can be used for Sentinel-2 data with several advantages over Landsat-8 data. First, Sentinel-2 has more bands in the solar reflective wavelength region that may be useful for aerosol characterization (e.g., the water vapor band). We note Sentinel-2 has no thermal bands and we found, however, that the thermal bands had only small contribution to the Landsat-8 AOD estimation. Figure 9 shows the leave-one-station-out cross-validation results for the 500 nm AOD estimation without the thermal BT as predictors. The accuracy slightly drops compared to Figure 3b results with BT as predictors. Secondly, Sentinel-2 has higher temporal resolution (5-day) than Landsat-8 (16-day), which may be helpful for aerosol studies. Thirdly, the Sentinel-2 level-2 product has a publicly available AOD that can be used as a baseline to compare the DNN AOD estimation. The Sentinel-2 AOD is generated by the atmospheric correction software known as Sen2Cor [64], based on the DT algorithm. The developed DNN needs to be retrained using Sentinel-2 TOA reflectance data and the adaptation should be straightforward as the data are also available in the GEE.
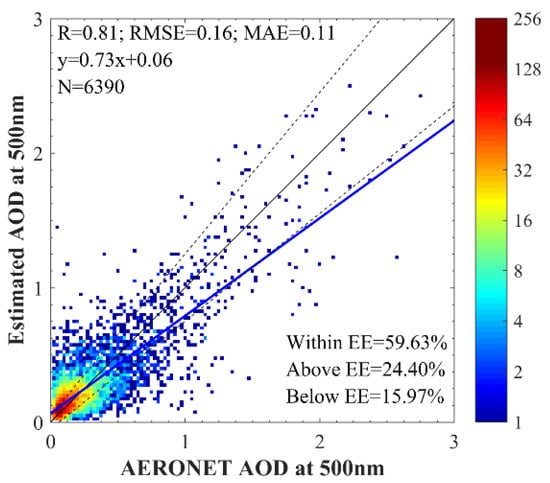
Figure 9.
The leave-one-station-out cross-validation of the DNN 500 nm AOD results without using the thermal bands (i.e., same as Figure 3b expect that the thermal bands BT are excluded in the predictors).
6. Conclusions
In this paper, a DNN-based high spatial resolution AOD retrieval method for Landsat-8 data has been presented. The Landsat-8 TOA reflectance and BT, sun-sensor geometry, and auxiliary data were used as predictors. The AERONET version 3 Level 2.0 observation over 60°S–60°N, 30°W–160°E during 2013–2020 were collocated to obtain 6390 training and validation samples. The k-fold and leave-one-station-out cross-validation were undertaken and compared. The leave-one-station-out cross-validation has a lower validation accuracy, but it is believed to reflect the large area application accuracy as the training and validation samples are from different AERONET stations. For the leave-one-station-out cross-validation, the DNN-estimated AOD agrees well with AERONET AOD measurements (R = 0.83, RMSE = 0.15), as 61% of retrieval fall within the uncertainty of ± (0.05 + 0.20 *AODAERONET). The DNN-estimated AOD has larger errors over small Ångström exponent aerosol conditions.
The accuracy of DNN models usually increase with training sample number and there are two ways to boost training sample size. On the one hand, one can use more ground-based AOD measurements from other AERONET stations and non-AERONET stations. For example, the Sun–Sky Radiometer Observation Network (SONET) can provide many more AOD measurements over mainland China than AERONET, especially over northeast China. On the other hand, one can use the Landsat-9 to augment training data. The Landsat-9 carrying OLI-2 and TIRS-2 was launched on 27 September 2021 and the data are now public available.
Author Contributions
Conceptualization, H.K.Z. and L.S.; methodology, L.S. and H.K.Z.; software, L.S., Z.B., L.Y. and J.Z.; validation, L.S.; writing—original draft preparation, L.S. and H.K.Z.; writing—review and editing, H.K.Z., L.S., Y.S. and L.Y.; funding acquisition, L.S. All authors have read and agreed to the published version of the manuscript.
Funding
L.S. was supported by the Science and Technology Department of Ningxia under grant No. 2019BEB04009.
Institutional Review Board Statement
Not applicable.
Informed Consent Statement
Not applicable.
Data Availability Statement
Not applicable.
Acknowledgments
The authors would like to thank the USGS Landsat program management and staff for the free provision of the Landsat-8 data and GEE for the provision of cloud-computing platform. The authors would also like to thank the principal investigators of the AERONET stations used in this paper for maintaining their stations and making their data publicly available.
Conflicts of Interest
The authors declare no conflict of interest.
References
- Allan, R.P. Climate Change 2021: The Physical Science Basis: Working Group I Contribution to the Sixth Assessment Report of the Intergovernmental Panel on Climate Change; Stocker, T., Ed.; WMO, IPCC Secretariat: Geneva, Switzerland, 2021. [Google Scholar]
- Levy, R.C.; Mattoo, S.; Munchak, L.A.; Sayer, A.M.; Patadia, F.; Hus, N.C. The collection 6 MODIS aerosol products over land and ocean. Atmos. Meas. Tech. 2013, 6, 2989–3034. [Google Scholar] [CrossRef] [Green Version]
- Sayer, A.M.; Hsu, N.C.; Bettenhausen, C.; Jeong, M.J. Validation and uncertainty estimates for MODIS Collection 6 “deep Blue” aerosol data. J. Geophys. Res. Atmos. 2013, 118, 7864–7872. [Google Scholar] [CrossRef] [Green Version]
- Lyapustin, A.; Wang, Y.; Korkin, S.; Huang, D. MODIS collection 6 MAIAC algorithm. Atmos. Meas. Tech. 2018, 11, 5741–5765. [Google Scholar] [CrossRef] [Green Version]
- Kahn, R.A.; Gaitley, B.J.; Garay, M.J.; Diner, D.J.; Eck, T.F.; Smirnov, A.; Holben, B.N. Multiangle Imaging SpectroRadiometer global aerosol product assessment by comparison with the Aerosol Robotic Network. J. Geophys. Res. Atmos. 2010, 115, D23209. [Google Scholar] [CrossRef]
- Thomas, G.E.; Carboni, E.; Sayer, A.M.; Poulsen, C.A.; Siddans, R.; Grainger, R.G. Oxford-RAL Aerosol and Cloud (ORAC): Aerosol retrievals from satellite radiometers. In Satellite Aerosol Remote Sensing over Land; Kokhanovsky, A.A., Leeuw, G., Eds.; Springer: Berlin/Heidelberg, Germany, 2009; pp. 193–225. [Google Scholar] [CrossRef]
- Mei, L.; Rozanov, V.; Vountas, M.; Burrows, J.P.; Levy, R.C.; Lotz, W. Retrieval of aerosol optical properties using MERIS observations: Algorithm and some first results. Remote Sens. Environ. 2017, 197, 125–140. [Google Scholar] [CrossRef] [PubMed]
- Kikuchi, M.; Murakami, H.; Suzuki, K.; Nagao, T.M.; Higurashi, A. Improved hourly estimates of aerosol optical thickness using spatiotemporal variability derived from Himawari-8 geostationary satellite. IEEE Trans. Geosci. Remote Sens. 2018, 56, 3442–3455. [Google Scholar] [CrossRef]
- Kaufman, Y.J.; Tanré, D.; Remer, L.A.; Vermote, E.F.; Holben, B.N. Operational remote sensing of tropospheric aerosol over land from EOS moderate resolution imaging spectroradiometer. J. Geophys. Res. Atmos. 1997, 102, 17051–17067. [Google Scholar] [CrossRef]
- Levy, R.C.; Remer, L.A.; Mattoo, S.; Vermote, E.F.; Kaufman, Y.J. Second-generation operational algorithm: Retrieval of aerosol properties over land from inversion of Moderate Resolution Imaging Spectroradiometer spectral reflectance. J. Geophys. Res. Atmos. 2007, 112, D13211. [Google Scholar] [CrossRef] [Green Version]
- Hsu, N.C.; Jeong, M.J.; Bettenhausen, C.; Sayer, A.M.; Hansell, R.; Seftor, C.S. Aerosol properties over bright-reflecting source regions. IEEE Trans. Geosci. Remote Sens. 2004, 42, 557–569. [Google Scholar] [CrossRef]
- Hsu, N.C.; Tsay, S.C.; King, M.D.; Herman, J.R. Near-global aerosol loading over land and ocean. IEEE Trans. Geosci. Remote Sens. 2013, 118, 9296–9315. [Google Scholar]
- Lyapustin, A.; Wang, Y.; Laszlo, I.; Kahn, R.; Korkin, S.; Remer, L.; Levy, R.; Reid, J.S. Multiangle implementation of atmospheric correction (MAIAC): 2. aerosol algorithm. J. Geophys. Res. Atmos. 2011, 116, D03211. [Google Scholar] [CrossRef]
- Mhawish, A.; Banerjee, T.; Sorek-Hamer, M.; Lyapustin, A.; Broday, D.M.; Chatfield, R. Comparison and evaluation of MODIS Multi-angle Implementation of Atmospheric Correction (MAIAC) aerosol product over South Asia. Remote Sens. Environ. 2019, 224, 12–28. [Google Scholar] [CrossRef]
- Jackson, J.M.; Liu, H.; Laszlo, I.; Kondragunta, S.; Remer, L.A.; Huang, J.; Huang, H.-C. Suomi-NPP VIIRS aerosol algorithms and data products. J. Geophys. Res. Atmos. 2013, 118, 12673–12689. [Google Scholar] [CrossRef]
- Ge, B.; Li, Z.; Liu, L.; Yang, L.; Chen, X.; Hou, W.; Zhang, Y.; Li, D.; Qie, L. A dark target method for Himawari-8/AHI aerosol retrieval: Application and validation. IEEE Trans. Geosci. Remote Sens. 2019, 57, 381–394. [Google Scholar] [CrossRef]
- Hsu, N.C.; Lee, J.; Sayer, A.M.; Carletta, N.; Chen, S.-H.; Tucker, C.J.; Holben, B.N.; Tsay, S.-C. Retrieving near-global aerosol loading over land and ocean from AVHRR. J. Geophys. Res. Atmos. 2017, 122, 9968–9989. [Google Scholar] [CrossRef] [Green Version]
- Yoshida, M.; Kikuchi, M.; Nagao, T.M.; Murakami, H.; Nomaki, T.; Higurashi, A. Common retrieval of aerosol properties for imaging satellite sensors. J. Meteorol. Soc. Jpn. Ser. II 2018, 96B, 193–209. [Google Scholar] [CrossRef] [Green Version]
- Li, S.; Wang, W.; Hashimoto, H.; Xiong, J.; Vandal, T.; Yao, J.; Qian, L.; Ichii, K.; Lyapustin, A.; Wang, Y.; et al. First provisional land surface reflectance product from geostationary satellite Himawari-8 AHI. Remote Sens. 2019, 11, 2990. [Google Scholar] [CrossRef] [Green Version]
- Li, T.; Shen, H.; Zeng, C.; Yuan, Q.; Zhang, L. Point-surface fusion of station measurements and satellite observations for mapping PM2.5 distribution in China: Methods and assessment. Atmos. Environ. 2017, 152, 477–489. [Google Scholar] [CrossRef] [Green Version]
- Yang, L.; Xu, H.; Jin, Z. Estimating spatial variability of ground-level PM2.5 based on a satellite-derived aerosol optical depth product: Fuzhou, China. Atmos. Pollut. Res. 2018, 9, 1194–1203. [Google Scholar] [CrossRef]
- Bilal, M.; Mhawish, A.; Nichol, J.E.; Qiu, Z.; Nazeer, M.; Ali, A.; de Leeuw, G.; Levy, R.C.; Wang, Y.; Chen, Y.; et al. Air pollution scenario over Pakistan: Characterization and ranking of extremely polluted cities using long-term concentrations of aerosols and trace gases. Remote Sens. Environ. 2021, 264, 112617. [Google Scholar] [CrossRef]
- She, L.; Mei, L.; Xue, Y.; Che, Y.; Guang, J. SAHARA: A Simplified Atmospheric Correction Algorithm for Chinese gAofen data: 1. Aerosol Algorithm. Remote Sens. 2017, 9, 253. [Google Scholar] [CrossRef] [Green Version]
- Sun, K.; Chen, X.; Zhu, Z.; Zhang, T. High resolution aerosol optical depth retrieval using gaofen-1 WFV camera data. Remote Sens. 2017, 9, 89. [Google Scholar] [CrossRef] [Green Version]
- Wei, J.; Huang, B.; Sun, L.; Zhang, Z.; Wang, L.; Bilal, M. A simple and universal aerosol retrieval algorithm for Landsat series images over complex surfaces. J. Geophys. Res. Atmos. 2017, 122, 13338–13355. [Google Scholar] [CrossRef]
- Masek, J.; Vermote, E.; Saleous, N.; Wolfe, R.; Hall, F.; Huemmrich, K.F.; Gao, F.; Kutler, J.; Lim, T.-K. A Landsat surface reflectance dataset for North America, 1990-2000. IEEE Geosci. Remote Sens. Lett. 2006, 3, 68–72. [Google Scholar] [CrossRef]
- Vermote, E.; Justice, C.; Claverie, M.; Franch, B. Preliminary analysis of the performance of the Landsat 8/OLI land surface reflectance product. Remote Sens. Environ. 2016, 185, 46–56. [Google Scholar] [CrossRef] [PubMed]
- Dwyer, J.L.; Roy, D.P.; Sauer, B.; Jenkerson, C.B.; Zhang, H.; Lymburner, L. Analysis ready data: Enabling analysis of the Landsat archive. Remote Sens. 2018, 10, 1363. [Google Scholar] [CrossRef]
- Ju, J.; Roy, D.P.; Vermote, E.V.; Masek, J.; Kovalskyy, V. Continental-scale validation of MODIS-based and LEDAPS Landsat ETM+ atmospheric correction methods. Remote Sens. Environ. 2012, 122, 175–184. [Google Scholar] [CrossRef] [Green Version]
- Li, Z.; Roy, D.P.; Zhang, H.K.; Vermote, E.F.; Huang, H. Evaluation of Landsat-8 and Sentinel-2A aerosol optical depth retrievals across Chinese cities and implications for medium spatial resolution urban aerosol monitoring. Remote Sens. 2019, 11, 122. [Google Scholar] [CrossRef] [Green Version]
- Lin, H.; Li, S.; Xing, J.; He, T.; Yang, J. High resolution aerosol optical depth retrieval over urban areas from Landsat-8 OLI images. Atmos. Environ. 2021, 261, 118591. [Google Scholar] [CrossRef]
- Omari, K.; Abuelgasim, A.; Alhebsi, K. Aerosol optical depth retrieval over the city of Abu Dhabi, United Arab Emirates (UAE) using Landsat-8 OLI images. Atmos. Pollut. Res. 2019, 10, 1075–1083. [Google Scholar] [CrossRef]
- Jin, Y.; Hao, Z.; Chen, J.; He, D.; Tian, Q.; Mao, Z.; Pan, D. Retrieval of Urban Aerosol Optical Depth from Landsat 8 OLI in Nanjing, China. Remote Sens. 2021, 13, 415. [Google Scholar] [CrossRef]
- Ou, Y.; Chen, F.; Zhao, W.; Yan, X.; Zhang, Q. Landsat 8-based inversion methods for aerosol optical depths in the Beijing area. Atmos. Pollut. Res. 2017, 8, 267–274. [Google Scholar] [CrossRef]
- She, L.; Zhang, H.; Li, Z.; De Leeuw, G.; Huang, B. Himawari-8 Aerosol Optical Depth (AOD) Retrieval Using a Deep Neural Network Trained Using AERONET Observations. Remote Sens. 2020, 12, 4125. [Google Scholar] [CrossRef]
- Su, T.; Laszlo, I.; Li, Z.; Wei, J.; Kalluri, S. Refining aerosol optical depth retrievals over land by constructing the relationship of spectral surface reflectances through deep learning: Application to Himawari-8. Remote Sens. Environ. 2020, 251, 112093. [Google Scholar] [CrossRef]
- Chen, X.; de Leeuw, G.; Arola, A.; Liu, S.; Liu, Y.; Li, Z.; Zhang, K. Joint retrieval of the aerosol fine mode fraction and optical depth using MODIS spectral reflectance over northern and eastern China: Artificial neural network method. Remote Sens. Environ. 2020, 249, 112006. [Google Scholar] [CrossRef]
- Jia, C.; Sun, L.; Cheng, Y.; Zhang, X.; Wang, W.; Wang, Y. Inversion of aerosol optical depth for Landsat8 OLI data using deep belief network. J. Remote Sen. 2020, 24, 1180–1192. [Google Scholar]
- Liang, T.; Sun, L.; Wang, Y. Retrieval of regional Aerosol optical depth using deep learning. Acta Opt. Sin. 2021, 41, 15–23. [Google Scholar]
- Holben, B.N.; Eck, T.F.; Slutsker, I.; Tanré, D.; Buis, J.P.; Setzer, A.; Vermote, E.; Reagan, J.A.; Kaufman, Y.J.; Nakajima, T.; et al. AERONET—A federated instrument network and data archive for aerosol characterization. Remote Sens. Environ. 1998, 66, 1–16. [Google Scholar] [CrossRef]
- Giles, D.M.; Sinyuk, A.; Sorokin, M.G.; Schafer, J.S.; Smirnov, A.; Slutsker, I.; Eck, T.F.; Holben, B.N.; Lewis, J.R.; Campbell, J.R.; et al. Advancements in the aerosol robotic network (AERONET) version 3 database–automated near-real-time quality control algorithm with improved cloud screening for sun photometer aerosol optical depth (AOD) measurements. Atmos. Meas. Tech. 2019, 12, 169–209. [Google Scholar] [CrossRef] [Green Version]
- Egorov, A.V.; Roy, D.P.; Zhang, H.; Li, Z.; Yan, L.; Huang, H. Landsat 4, 5 and 7 (1982 to 2017) Analysis Ready Data (ARD) observation coverage over the conterminous United States and implications for terrestrial monitoring. Remote Sens. 2019, 11, 447. [Google Scholar] [CrossRef] [Green Version]
- Rengarajan, R.; Storey, J.C.; Choate, M.J. Harmonizing the Landsat Ground Reference with the Sentinel-2 Global Reference Image Using Space-Based Bundle Adjustment. Remote Sens. 2020, 12, 3132. [Google Scholar] [CrossRef]
- LeCun, Y.; Bengio, Y.; Hinton, G. Deep learning. Nature 2015, 521, 436–444. [Google Scholar] [CrossRef] [PubMed]
- Zhang, H.K.; Roy, D.P.; Martins, V.S. Large Area, Single Pixel Time Series, Convolutional Neural Network Land Cover Classification. Remote Sens. Environ. 2022; submitted. [Google Scholar]
- Glorot, X.; Bordes, A.; Bengio, Y. Deep sparse rectifier neural networks. J. Mach. Learn. Res. 2011, 15, 315–323. [Google Scholar]
- He, K.; Zhang, X.; Ren, S.; Sun, J. Delving Deep into Rectifiers: Surpassing Human-Level Performance on Imagenet Classification. In Proceedings of the IEEE International Conference on Computer Vision, Santiago, Chile, 7–13 December 2015; pp. 1026–1034. [Google Scholar] [CrossRef] [Green Version]
- Ioffe, S.; Szegedy, C. Batch Normalization: Accelerating Deep Network Training by Reducing Internal Covariate Shift; Google: Mountain View, CA, USA, 2015. [Google Scholar]
- He, K.; Zhang, X.; Ren, S.; Sun, J. Deep residual learning for image recognition. In Proceedings of the IEEE Conference on Computer Vision and Pattern Recognition, Las Vegas, NV, USA, 30 June 2016; p. 770778. [Google Scholar]
- Abadi, M.; Agarwal, A.; Barham, P.; Brevdo, E.; Chen, Z.; Citro, C. Tensorflow: Large-Scale Machine Learning on Heterogeneous Distributed Systems. 2016. Available online: https://static.googleusercontent.com/media/research.google.com/en//pubs/archive/45166.pdf (accessed on 19 January 2019).
- Rodriguez, J.D.; Perez, A.; Lozano, J.A. Sensitivity analysis of k-fold cross validation in prediction error estimation. IEEE Trans. Pattern Anal. Mach. Intell. 2010, 32, 569–575. [Google Scholar] [CrossRef] [PubMed]
- Hu, X.; Waller, L.A.; Al-Hamdan, M.Z.; Crosson, W.L.; Estes, M.G., Jr.; Estes, S.M.; Quattrochi, D.A.; Sarnat, J.A.; Liu, Y. Estimating ground-level PM2.5 concentrations in the Southeastern United States using MAIAC AOD retrievals and a two-stage model. Remote Sens. Environ. 2014, 140, 220–232. [Google Scholar] [CrossRef]
- He, Q.; Huang, B. Satellite-based mapping of daily high-resolution ground PM2.5 in China via space-time regression modeling. Remote Sens. Environ. 2018, 206, 72–83. [Google Scholar] [CrossRef]
- Kloog, I.; Nordio, F.; Coull, B.A.; Schwartz, J. Incorporating local land use regression and satellite aerosol optical depth in a hybrid model of spatiotemporal PM2.5 exposures in the Mid-Atlantic states. Environ. Sci. Technol. 2012, 46, 11913–11921. [Google Scholar] [CrossRef] [Green Version]
- Dong, L.; Li, S.; Yang, J.; Shi, W.; Zhang, L. Investigating the performance of satellite-based models in estimating the surface PM2.5 over China. Chemosphere 2020, 256, 127051. [Google Scholar] [CrossRef] [PubMed]
- Remer, L.A.; Kleidman, R.G.; Levy, R.; Kaufman, Y.J.; Tanré, D.; Mattoo, S.; Martins, J.V.; Ichoku, C.; Koren, I.; Yu, H.; et al. Global aerosol climatology from the MODIS satellite sensors. J. Geophys. Res. Atmos. 2008, 113, D14. [Google Scholar] [CrossRef] [Green Version]
- Roy, D.; Zhang, H.; Ju, J.; Gomez-Dans, J.; Lewis, P.; Schaaf, C.; Sun, Q.; Li, J.; Huang, H.; Kovalskyy, V. A general method to normalize Landsat reflectance data to nadir BRDF adjusted reflectance. Remote Sens. Environ. 2016, 176, 255–271. [Google Scholar] [CrossRef] [Green Version]
- Zhang, H.; Roy, D.P.; Kovalskyy, V. Optimal solar geometry definition for global long-term Landsat time-series bidirectional reflectance normalization. IEEE Trans. Geosci. Remote Sens. 2016, 54, 1410–1418. [Google Scholar] [CrossRef]
- Li, L. A Robust Deep Learning Approach for Spatiotemporal Estimation of Satellite AOD and PM 2.5. Remote Sens. 2020, 12, 264. [Google Scholar] [CrossRef] [Green Version]
- Witthuhn, J.; Hünerbein, A.; Deneke, H. Evaluation of satellite-based aerosol datasets and the CAMS reanalysis over the ocean utilizing shipborne reference observations. Atmos. Meas. Tech. 2020, 13, 1387–1412. [Google Scholar] [CrossRef] [Green Version]
- Song, H.; Wang, K.; Zhang, Y.; Hong, C.; Zhou, S. Simulation and evaluation of dust emissions with WRF-Chem (v3. 7.1) and its relationship to the changing climate over East Asia from 1980 to 2015. Atmos. Environ. 2017, 167, 511–522. [Google Scholar] [CrossRef]
- Liu, X.; Song, H.; Lei, T.; Liu, P.; Xu, C.; Wang, D.; Zhao, H. Effects of natural and anthropogenic factors and their interactions on dust events in Northern China. Catena 2021, 196, 104919. [Google Scholar] [CrossRef]
- Dubovik, O.; Lapyonok, T.; Litvinov, P.; Herman, M.; Fuertes, D.; Ducos, F.; Federspiel, C. GRASP: A versatile algorithm for characterizing the atmosphere. SPIE Newsroom 2014, 25, 2-1201408. [Google Scholar] [CrossRef]
- Main-Knorn, M.; Pflug, B.; Louis, J.; Debaecker, V.; Müller-Wilm, U.; Gascon, F. Sen2Cor for sentinel-2. In Image and Signal Processing for Remote Sensing XXIII; International Society for Optics and Photonics: Bellingham, DC, USA, 2017; Volume 10427, p. 1042704. [Google Scholar]


Publisher’s Note: MDPI stays neutral with regard to jurisdictional claims in published maps and institutional affiliations. |
© 2022 by the authors. Licensee MDPI, Basel, Switzerland. This article is an open access article distributed under the terms and conditions of the Creative Commons Attribution (CC BY) license (https://creativecommons.org/licenses/by/4.0/).