Review

Distributed Feedback Interband Cascade Laser Based Laser Heterodyne Radiometer for Column Density of HDO and CH4 Measurements at Dunhuang, Northwest of China

1
Key Laboratory of Atmospheric Optics, Anhui Institute of Optics and Fine Mechanics, Chinese Academy of Sciences, Hefei 230031, China
2
Advanced Laser Technology Laboratory of Anhui Province, Hefei 230037, China
3
College of Electrical and Optoelectronic Engineering, West Anhui University, Lu’an 237012, China
4
School of Electronic Engineering and Intelligent Manufacturing, Anqing Normal Univesity, Anqing 246011, China
*
Author to whom correspondence should be addressed.
Remote Sens. 2022, 14(6), 1489; https://doi.org/10.3390/rs14061489
Submission received: 18 February 2022 / Revised: 14 March 2022 / Accepted: 16 March 2022 / Published: 19 March 2022
(This article belongs to the Special Issue Optical and Laser Remote Sensing of Atmospheric Composition)

Abstract

:
Remote sensing of HDO and CH4 could provide valuable information on environmental and climatological studies. In a recent contribution, we reported a 3.53 μm distributed feedback (DFB) inter-band cascade laser (ICL)-based heterodyne radiometer. In the present work, we present the details of measurements and inversions of HDO and CH4 at Dunhuang, Northwest of China. The instrument line shape (ILS) of laser heterodyne radiometer (LHR) is discussed firstly, and the spectral resolution is about 0.004 cm−1 theoretically according to the ILS. Furthermore, the retrieval algorithm, optimal estimation method (OEM), combined with LBLRTM (Line-by-line Radiative Transfer Model) for retrieving the densities of atmospheric HDO and CH4 are investigated. The HDO densities were retrieved to be less than 1.0 ppmv, while the CH4 densities were around 1.79 ppmv from 20 to 24 July 2018. The correlation coefficient of water vapor densities retrieved by LHR and EM27/SUN is around 0.6, the potential reasons for the differences were discussed. Finally, in order to better understand the retrieval procedure, the Jacobian value and the Averaging Kernels are also discussed.

1. Introduction

Water vapor absorbs almost 20% solar radiation and amplifies the greenhouse effects three or more times by positive feedback [1,2]. HDO is a kind of static isotope of water vapor, the knowledge of H2O-HDO is relevant to identifying different atmospheric processes that govern the moisture budget at specific locations and the changes in meteorology and marine pollution. Methane is another important greenhouse gas because of the 25 times global warming potential higher than carbon dioxide [3]. Remote sensing of the abundance of water vapor isotopes and CH4 provide valuable information on those above researches. For this purpose, in-situ, ground-based and satellite remote sensing based on absorption spectroscopy methods are used for the abundance of water vapor isotopes and CH4 density.
The in-situ methods such as Cavity Ring-Down Spectroscopy (CRDS), Enhanced Cavity Absorption Spectroscopy (CEAS) and Quartz-enhanced Photoacoustic Spectroscopy (QEPAS) for trace gases detections are recently discussed, and the sensitivity of these techniques could even obtain ppt level [4,5,6,7,8,9]. Besides the above methods, other technology of in-situ detection such as light-induced thermoelastic spectroscopy is also been discussed recently [10,11,12]. The ground-based methods are usually using Fourier Transfer Infrared Radiometer [13,14,15]. The SCIAMACHY instrument onboard the satellite ENVISAT was the first instrument to provide global retrievals of water isotopes with high sensitivity near the ground [16,17]. But owing to the degradation, the data record of SCIAMACHY HDO only covers the years 2003 through 2005, the connection to the entire ENVISAT was unfortunately lost in April 2012. Another global HDO distribution research based on satellite GOSAT was produced by Frankenberg et al. [18]. The global distributions of HDO from GOSAT are consistent with the SCIAMACHY and FTIR on the ground [18,19,20]. The results showed that the combination of multiple observation methods provide precise outcomes of water vapor isotopes and methane. In consideration of the significance, we developed a laser heterodyne radiometer (LHR) using a distributed feedback interband cascade laser (DFB-ICL) as a local oscillator (LO) operating in the 3.53 μm for atmospheric HDO and CH4 monitoring.
While the LHRs performed high qualities for monitoring atmospheric trace gases with small size and low cost, given the above advantages, LHRs have been successfully used to measure atmospheric O3, CO2 and CH4, et al., from the ground using either a quantum cascade laser (QCL) or DFB-ICL as a LO [21,22,23,24,25]. During the field measurement campaign, HDO and CH4 were chosen as the target species.
In this contribution, we present an analysis of atmospheric HDO and CH4 measurements retrieved from the data recorded by a DFB-ICL based LHR operating in swept LO frequency mode. The measurements campaign was made at the Meteorological Station of Dunhuang (40.14°N, 94.68°E, altitude 1140 m) from 10 to 24 July 2018. Column densities of atmospheric HDO and CH4 were retrieved from the measurements using the optimal estimation method (OEM). At last, the results of LHR and EM27/SUN are compared, and the potential reasons for the differences and several crucial parameters are discussed for a better understanding of LHR and improvement of it.

2. Materials and Methods

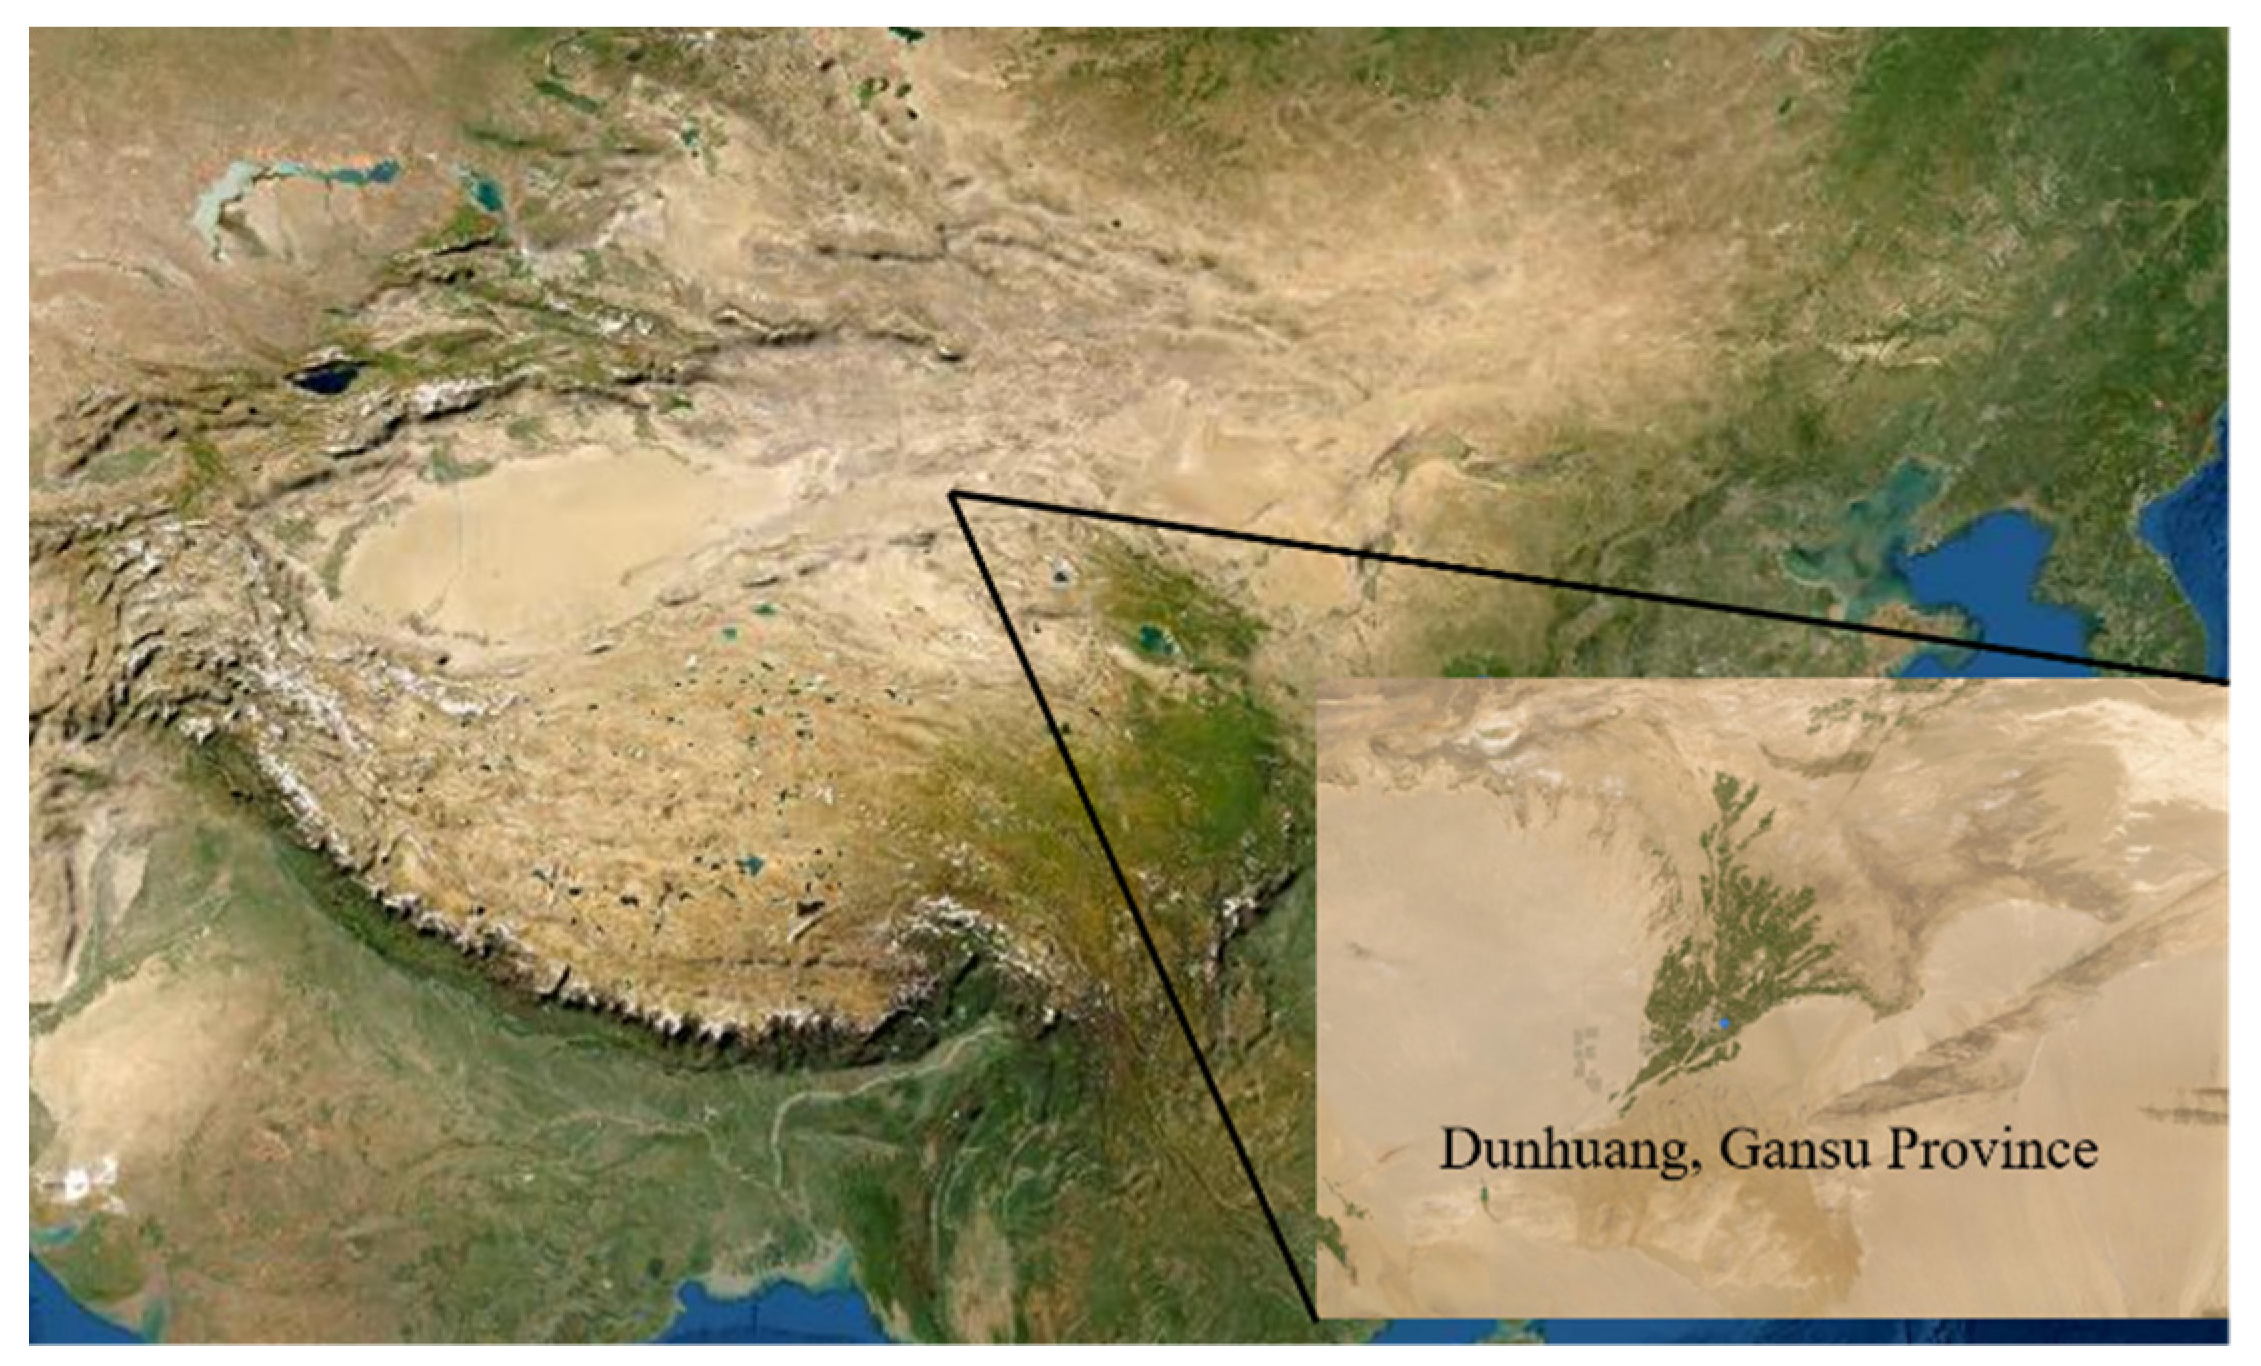
2.1. Measurement Site

As it is well known, Dunhuang commands a strategic position at the crossroads of the ancient Southern Silk Route and the main road leading from India via Lhasa to Mongolia and Southern Siberia, as well as controlling the entrance to the narrow Hexi Corridor (Figure 1), which led straight to the heart of the north Chinese plains. Dunhuang’s average precipitation is less than 30 mm per year, the groundwater in the inland river and basin originating from Qilian Mountain is the primary water source in this area. Due to global warming since the 20th century, the glaciers in the Qilian Mountains are melting rapidly. The change of glacial meltwater is bound to have an impact on the runoff of inland rivers. It is of great significance to study the source and sink of water vapor to form the local climate. Therefore, the rebuilt LHR prototype was very suitable for the field measurement campaign.

2.2. Laser Heterodyne Radiometer

Heterodyning is commonly used in radio frequency, and it provides ultra-high spectral resolution when used in infrared spectra detection, the intrinsic resolve capacity enables fully resolved narrow fingerprint molecular absorption lineshapes [26]. The basic principle of laser heterodyning is to down-convert the received signal to a lower, intermediated frequency (IF) signal from high frequency (tens of 1013 Hz) to the radio frequency by mixing the incident radiation with that from the local oscillator (LO) [27,28]. The details of LHR’s principle and composition were introduced by Weidmann, Wilson, et al. [23,24,25,29], we try to figure the instrument line shape (ILS) of LHR out in the present work.
The ILS is one of the most important parameters of the spectrometer, which determines the spectral resolution of the measured results. The previous studies of ILS usually used the function of radio frequency filter without consideration of integral time of lock-in amplifier (LIA), it may increase retrieval error with fast scanning of LO or large integral time.
The response function of a system could be obtained by inputting a Dirac signal in the time domain. For an LHR system, it transforms the frequency signal into the time signal. According to the laser heterodyne theory, the IF signal power in the frequency domain is proportional to the convolution of LO and input signal power (assumed the gain is 1):
P I F ( ω ) = P L O ( ω L O ) P S ( ω S )
The power of LO is:
P L O ( ω ) = P L O f ( ω ω L O ( t ) )
The PLO is the total power of LO, and f(ω) is the line shape function of LO. Because of the scanning of LO during the measurement, the ωLO(t) represents the frequency at the time of t.
ω L O ( t ) = ω 0 + Δ ω t / T ( T / 2 t T / 2 )  
T is the total scanning time. The input signal is a constant, when modulated by the chopper, the power is:
p S ( t ) = p S exp ( i ω S t ) ( 1 + cos Ω t )  
The Ω is the frequency of chopper, Ω is much lower than ωLO and ωS. The power of the input signal in the frequency domain is:
P S ( ω ) = P S [ δ ( ω S ) + δ ( ω S ± Ω ) / 2 ] = P S [ δ + δ ( ± Ω ) / 2 ] δ ( ω S )
It is easy to get the power of the IF signal (Figure 2) during the scanning of LO:
P I F = P L O P S [ δ + δ ( ± Ω ) / 2 ] δ ( ω S ) f ( ω ω L O ( t ) )
The IF signal is filtered by the radio filter, the out power is:
P I F = P L O P S [ δ + δ ( ± Ω ) / 2 ] f ( ω ( ω L O ( t ) ω S ) ) H ( ω )
This signal is also needed to be power detected, the output voltage is proportional to the input power:
U = β P L O P S [ δ + δ ( ± Ω ) / 2 ] + f ( ω ( ω L O ( t ) ω S ) ) H ( ω ) d ω                   = β P L O P S [ δ + δ ( ± Ω ) / 2 ] + f ( ( ω S ω L O ( t ) ) ( ω ) ) H ( ω ) d ω
β is the efficiency of the power detection. Now, we set ω′ = −ω and according to the convolution theory:
U = β P L O P S [ δ + δ ( ± Ω ) / 2 ] ( 1 ) + f ( ( ω S ω L O ( t ) ) ω ) H ( ω ) d ω       = β P L O P S [ δ + δ ( ± Ω ) / 2 ] + f ( ( ω S ω L O ( t ) ) ω ) H ( ω ) d ω       = β P L O P S [ δ + δ ( ± Ω ) / 2 ] f ( ω S ω L O ( t ) ) H ( ω S ω L O ( t ) )
The range of the IF signal is
ω S ω 0 Δ ω / 2 ω S ω L O ( t ) ω S ω 0 + Δ ω / 2
Normally, this range is much larger than the line width of LO and band of radio filter, so in the total scanning period, the convolution of the last two-part in (9) is equivalent to:
f ( ω S ω L O ( t ) ) H ( ω S ω L O ( t ) ) f ( ω ) H ( ω )
The output voltage in total scanning time could be simplified as follows:
U = [ β P L O P S f ( ω ) H ( ω ) ] [ δ + δ ( ± Ω ) / 2 ]
The output signal from the power detector is filtered and demodulated by LIA, the result is the ILS of LHR. The reference signal is a sine wave, so the spectrum of reference is:
E R e f = A Re f δ ( ± Ω ) / 2
The convolution of two signals is:
U = [ β P L O P S f ( ω ) H ( ω ) ] [ δ + δ ( ± Ω ) / 2 ] A Re f δ ( ± Ω ) / 2               = [ β A Re f P L O P S f ( ω ) H ( ω ) ] [ δ ( ± 2 Ω ) / 2 + δ ( ± Ω ) + δ ] / 2
This signal needs to be filtered by the low-pass filter in LIA, because the cut-off frequency (fc is not large than tens Hertz) of the low-pass filter is much less than the modulation frequency (Ω normally is 1~2 kHz) so that ±2Ω and ±Ω signal are filtered by the low-pass filter:
U = β A Re f P L O P S f ( ω ) H ( ω ) δ / 2
The response function of the low-pass filter in the time domain is hlp, the output signal:
u = β A Re f P L O P S f ( ω ) H ( ω ) h l p / 2
β, η′, PLO, PS and ARef are constants, the simplified ILS of LHR is:
I L S = f ( ω ) H ( ω ) h l p
The result shows that the ILS of LHR is the convolution of the line-shape function of LO, the response function of the radio filter and the response function of the low-pass filter. The line width of LO is normally less than several tens MHz and could be equivalent to Dirac function in the condition of spectra measurements. According to the analysis of ILS, when the integral time is pretty small or the scanning time is large enough, H(ω) is approximated to the ILS.
The main specifications of the 3.53 μm LHR are given in Table 1.
According to the analysis of ILS, the simulated and measured of ILS are obtained (Figure 3), the results indicate that the measurement is consistent with the simulation, the theoretical and actual spectral resolution is nearly 0.004 cm−1 and 0.005 cm−1, respectively. The resolution meets the spectral resolution demands of water vapor and methane measurements.
The wavelength of local oscillator accuracy and repetition are important parameters of the LHR, the measurement of laser wavelength and the distribution are shown in Figure 4. The maximum and minimum of wavenumber is 2831.9518 cm−1 and 2831.9497 cm−1, the uncertainty is 0.0021 cm−1 which is little than spectral resolution, and the statistical characterization fits the gaussian distribution, the stability meets the demands of column density measurements.

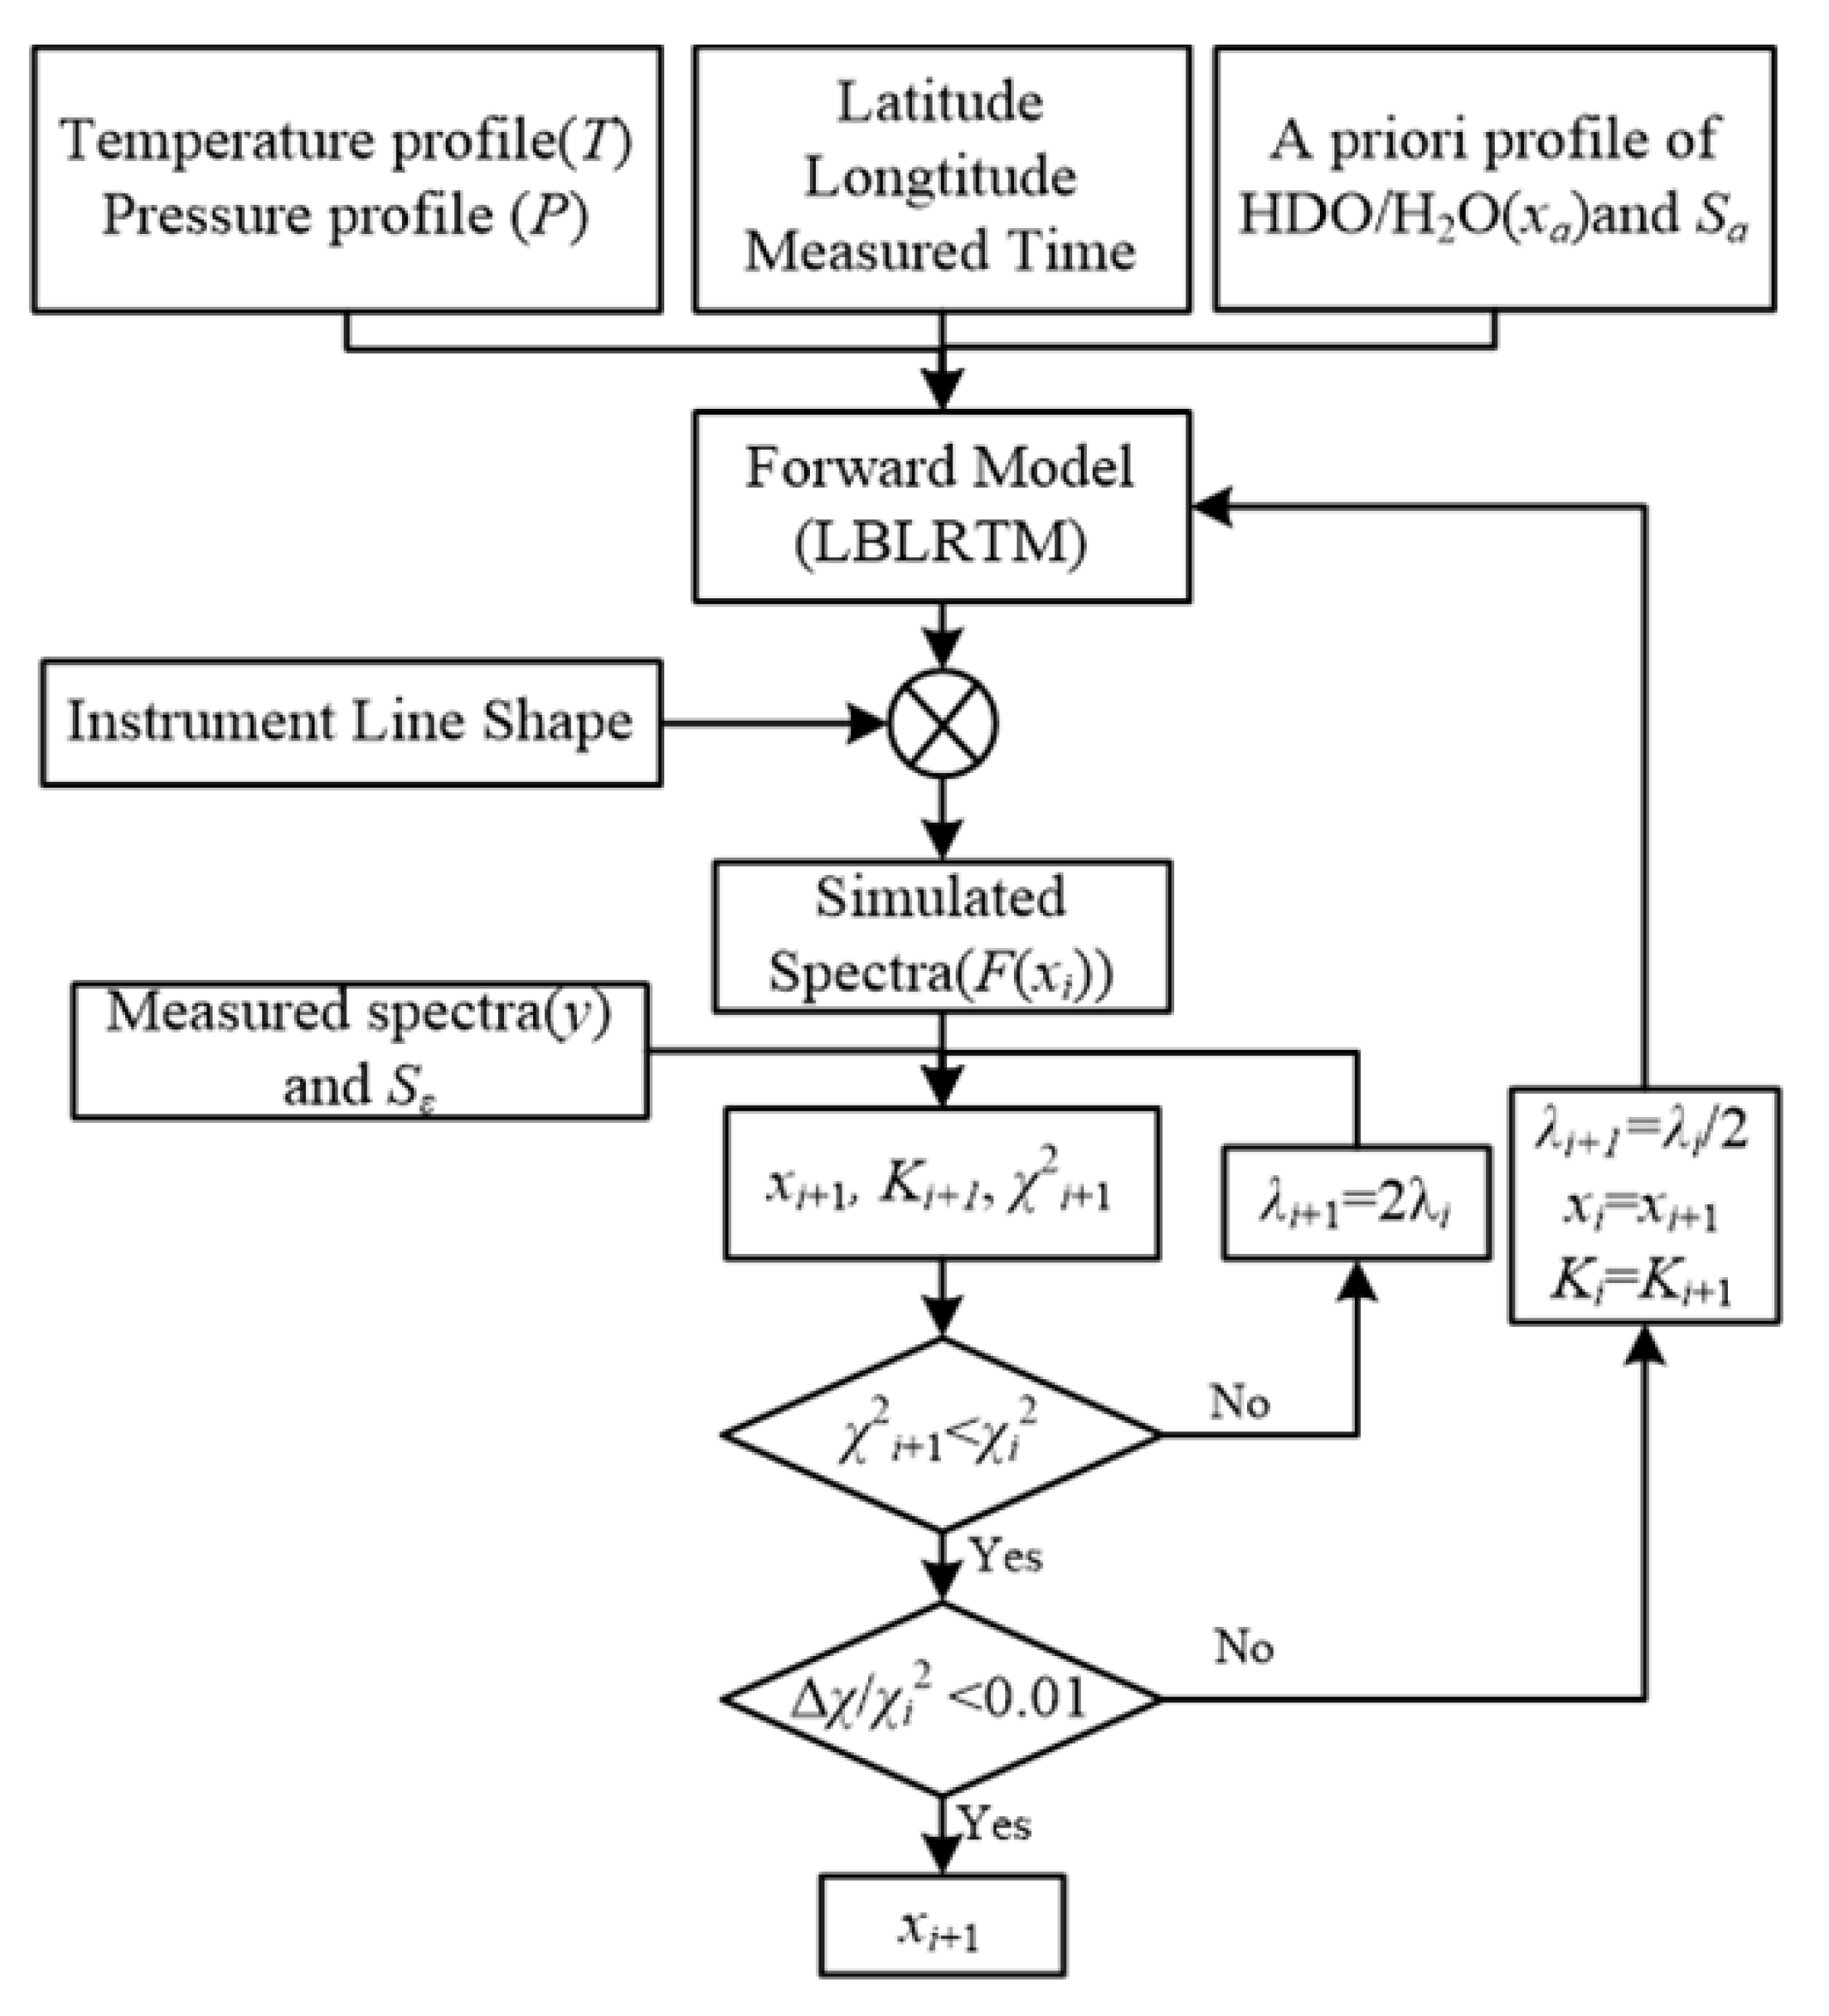
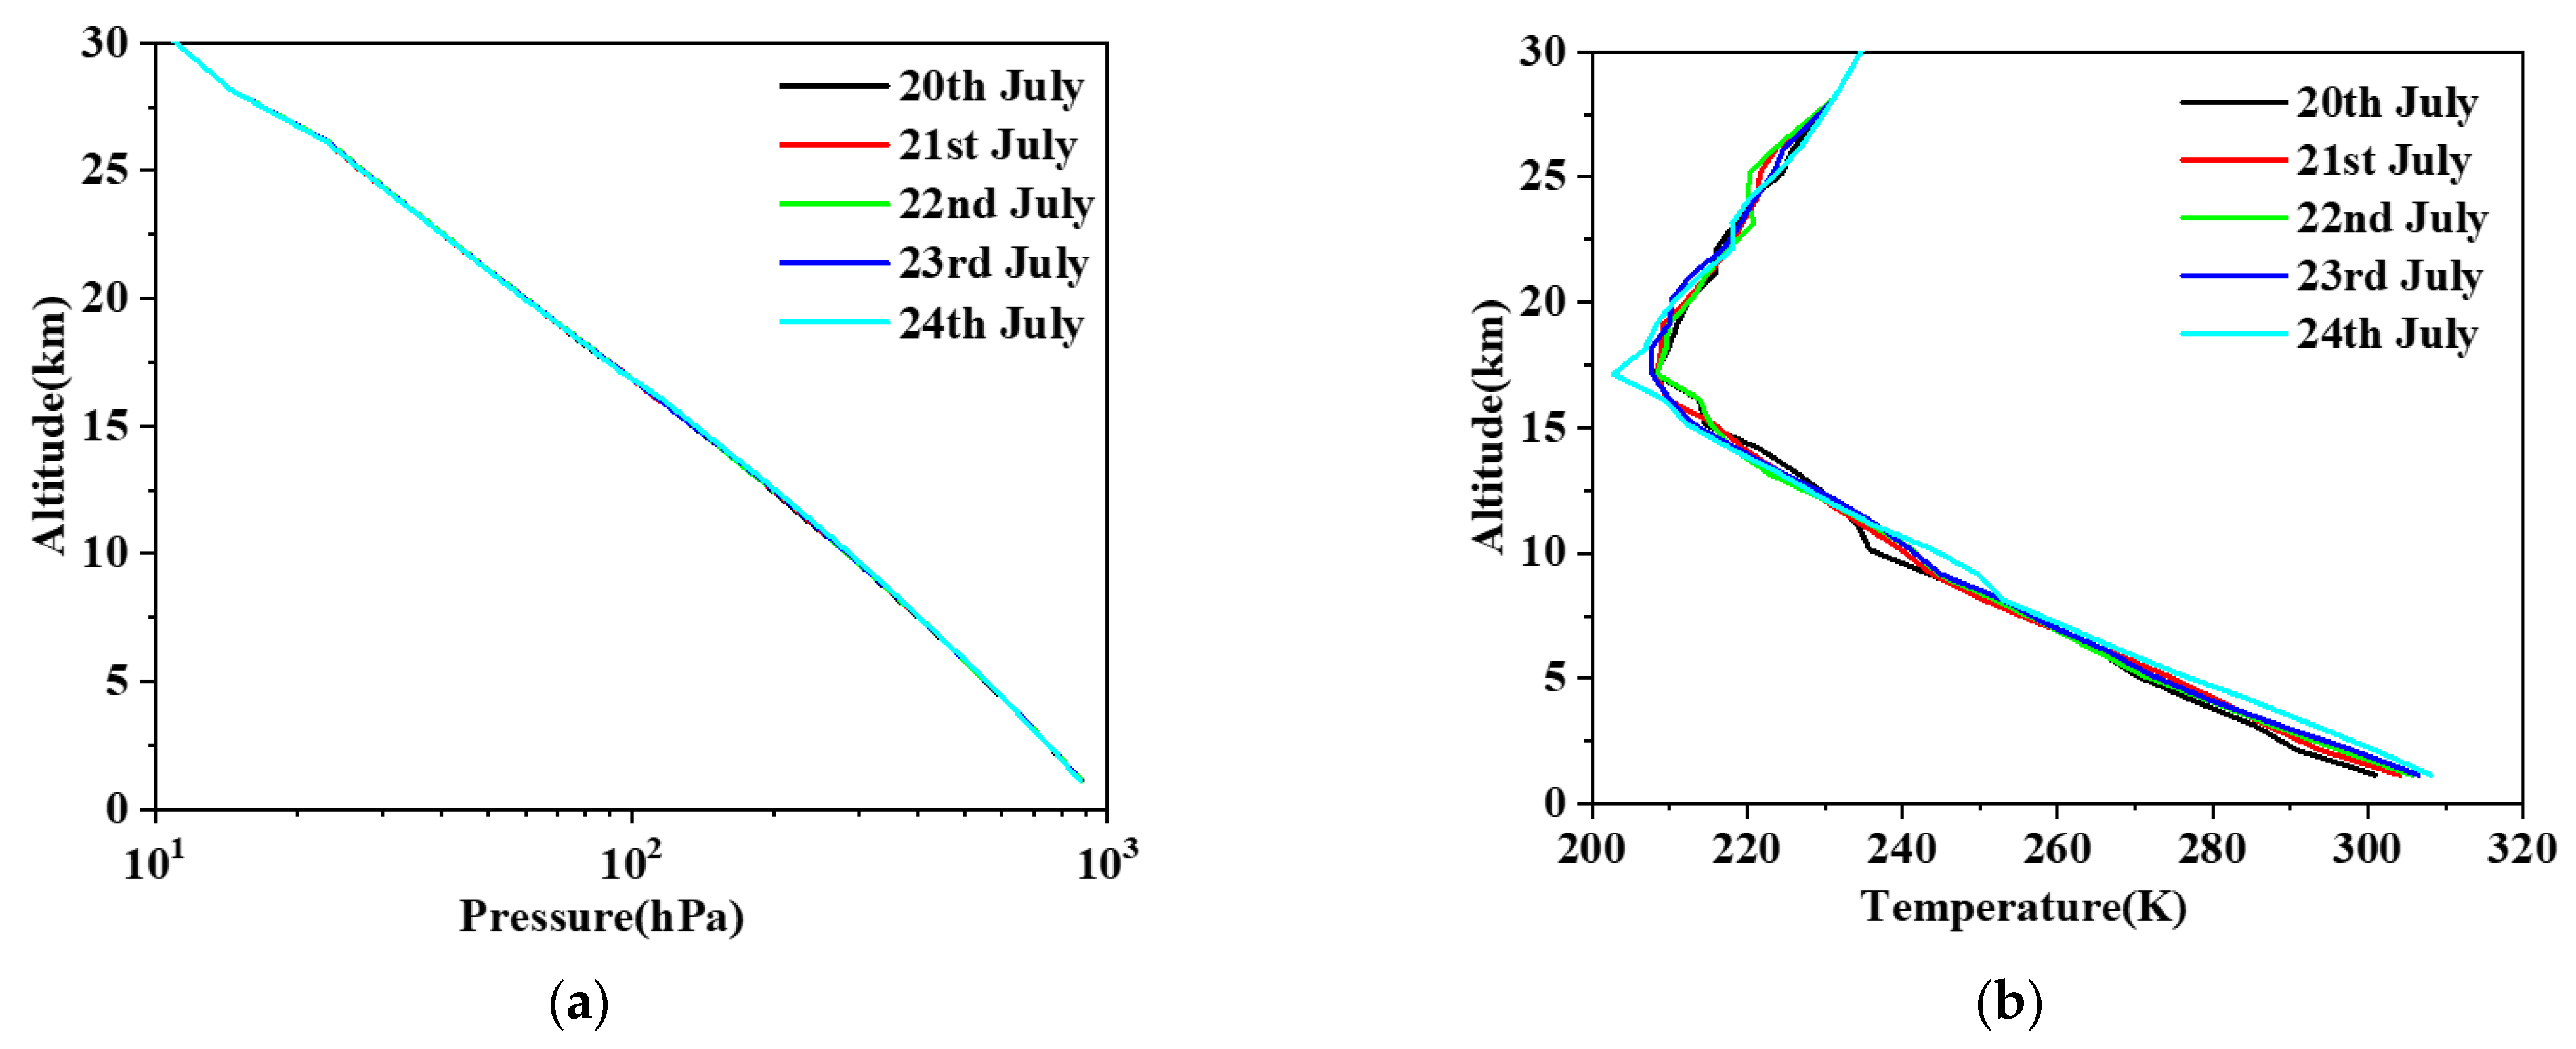
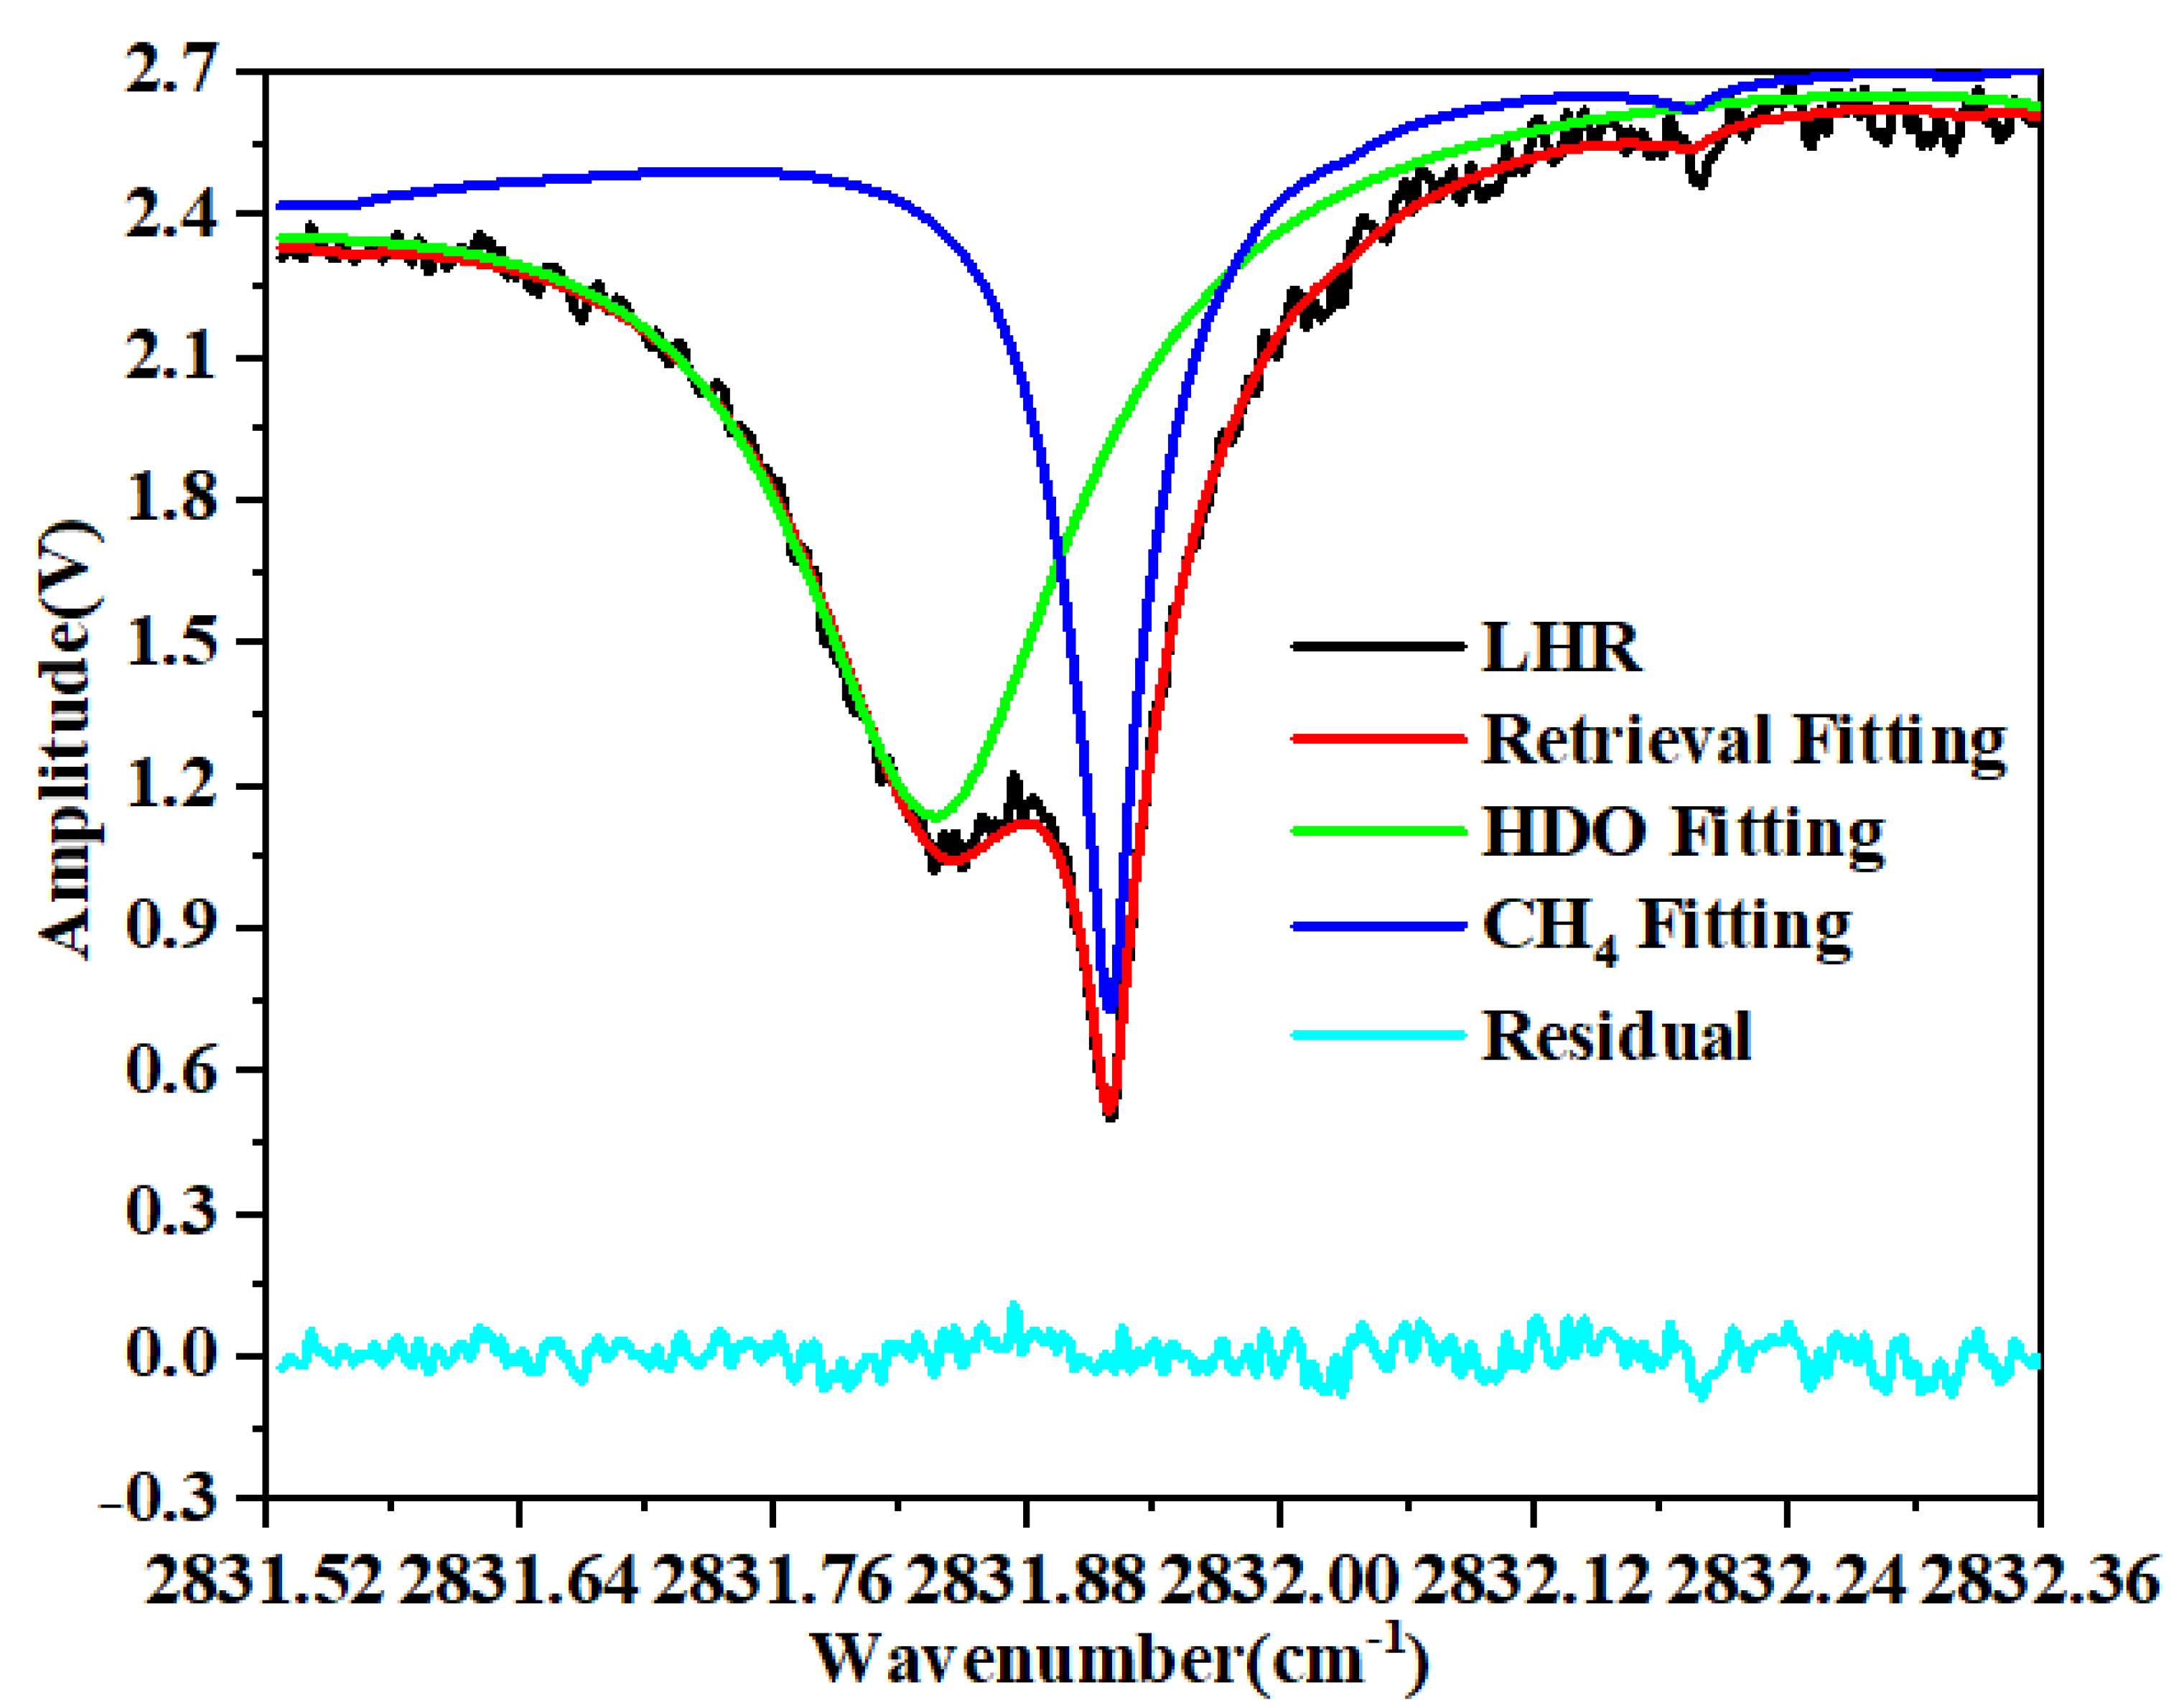
2.3. Retrieval Method
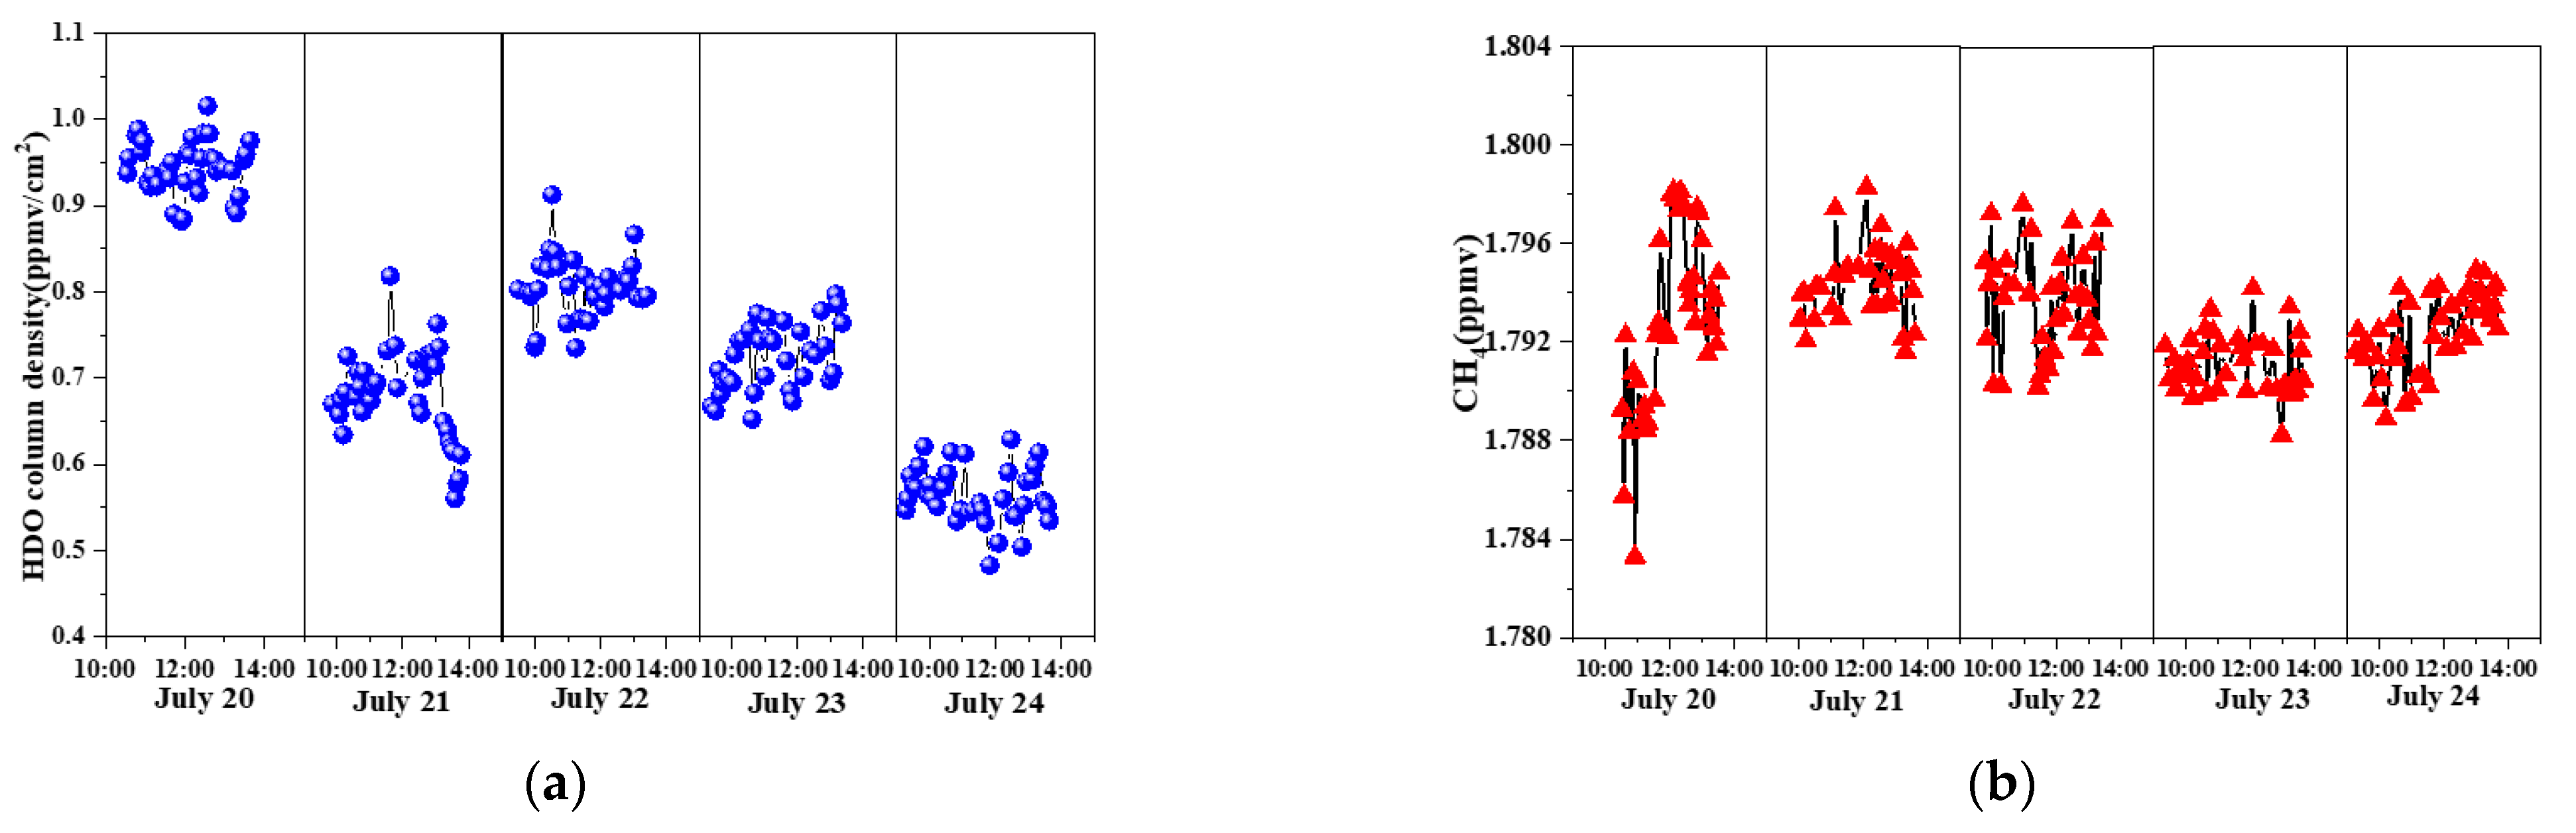
The OEM approach was adopted for the HDO and CH4 retrievals, and the key step of using the approach was further constrained by using climatological water vapor and methane a priori data. This approach strictly follows the method described by C. Rodgers [30]. The forward model F is defined by
y = F ( x ) + ε
The vector y is the measurement with error ε, x is the state vector. The forward model is based on the line-by-line radiative transfer model (LBLRTM, version 12.8). The state vector x contains the vertical profiles of atmospheric water vapor and methane, expressed in the logarithm of volume mixing ratios (VMRs). Using the logarithm can introduce excellent effects, such as reducing the numerical difference of water vapor and methane, ensuring the positive values and making it easier to retrieve very low values when the density of water and methane are very low.
For the faster speed of iteration of the state vector, the Gauss-Newton iteration is adopted in the inversion iteration:
x i + 1 = x i + ( K i T S ε 1 K i + ( 1 + λ i ) S a 1 ) 1 × [ K i T S ε 1 ( y F ( x i ) ) S a 1 ( x i x a ) ]
The λi is the Lagrange factor and λi is chosen at each step to minimize the cost function. It can be seen that when the λi→0, the step tends to Gauss-Newton, and when the λi→∞, the step direction tends to steepest descent. The main processes of the retrieval method are shown in Figure 5.

3. Results

The pressure and temperature profiles used in retrieval were measured by the radiosonde, as shown in Figure 6. The a priori profiles of water vapor and methane were obtained from the Europe Center for Medium-Range Weather Forecast (ECMWF). The atmosphere is separated into 13 layers from surface to 30 km with an altitude grid of 1, 2 and 5 km account HDO concentration decreases exponentially with height, almost 90% HDO or water vapor concentrate below the 5 km altitude and the analysis of averaging kernels indicates that the half-width near the surface is 1~2 km. So the spatial resolution below 5 km is set as 1 km per layer, the upper atmosphere contains less HDO or water vapor, the spatial resolution is set as 2 km at 6~10 km and 5 km at 10~30 km.
The OEM approach obtained a better fitting result of measured spectra, one group of measured spectra and retrievals are shown in Figure 7, the residual between measured spectra and the fitting is less than 0.1 V.
The HDO and methane column densities from 20 to 24 July are shown in Figure 8. During the measurement campaigns, the column density of HDO was only about 0.5~1.0 ppmv and obviously decreased from 20 to 24 July. The methane column density at Dunhuang was 1.792 ± 0.005 ppmv and the maximum fluctuation of methane was on 20 July.
According to the HDO/H2O ratio of Vienna Standard Mean Ocean Water (VSMOW), the column densities of water vapor at Dunhuang are obtained and are shown in the Figure 9:
Due to the low density of water vapor, the variation of water vapor column density at Dunhuang is 1500~3300 ppmv (0.85~1.75 g/cm2), and also has a decreasing trend from 20 to 24 July.
The precipitation before the experiment increased the humidity of the surface and the lack of evaporation source from the ground because of the sunny day from 20 July are the possibility of the decreasing trend of water vapor density. And the increased surface humidity by rainy weather with low temperatures before 20 July might also be influenced the methane emission from the biologic activity and result in the fluctuations of methane during the experiment.

4. Discussion

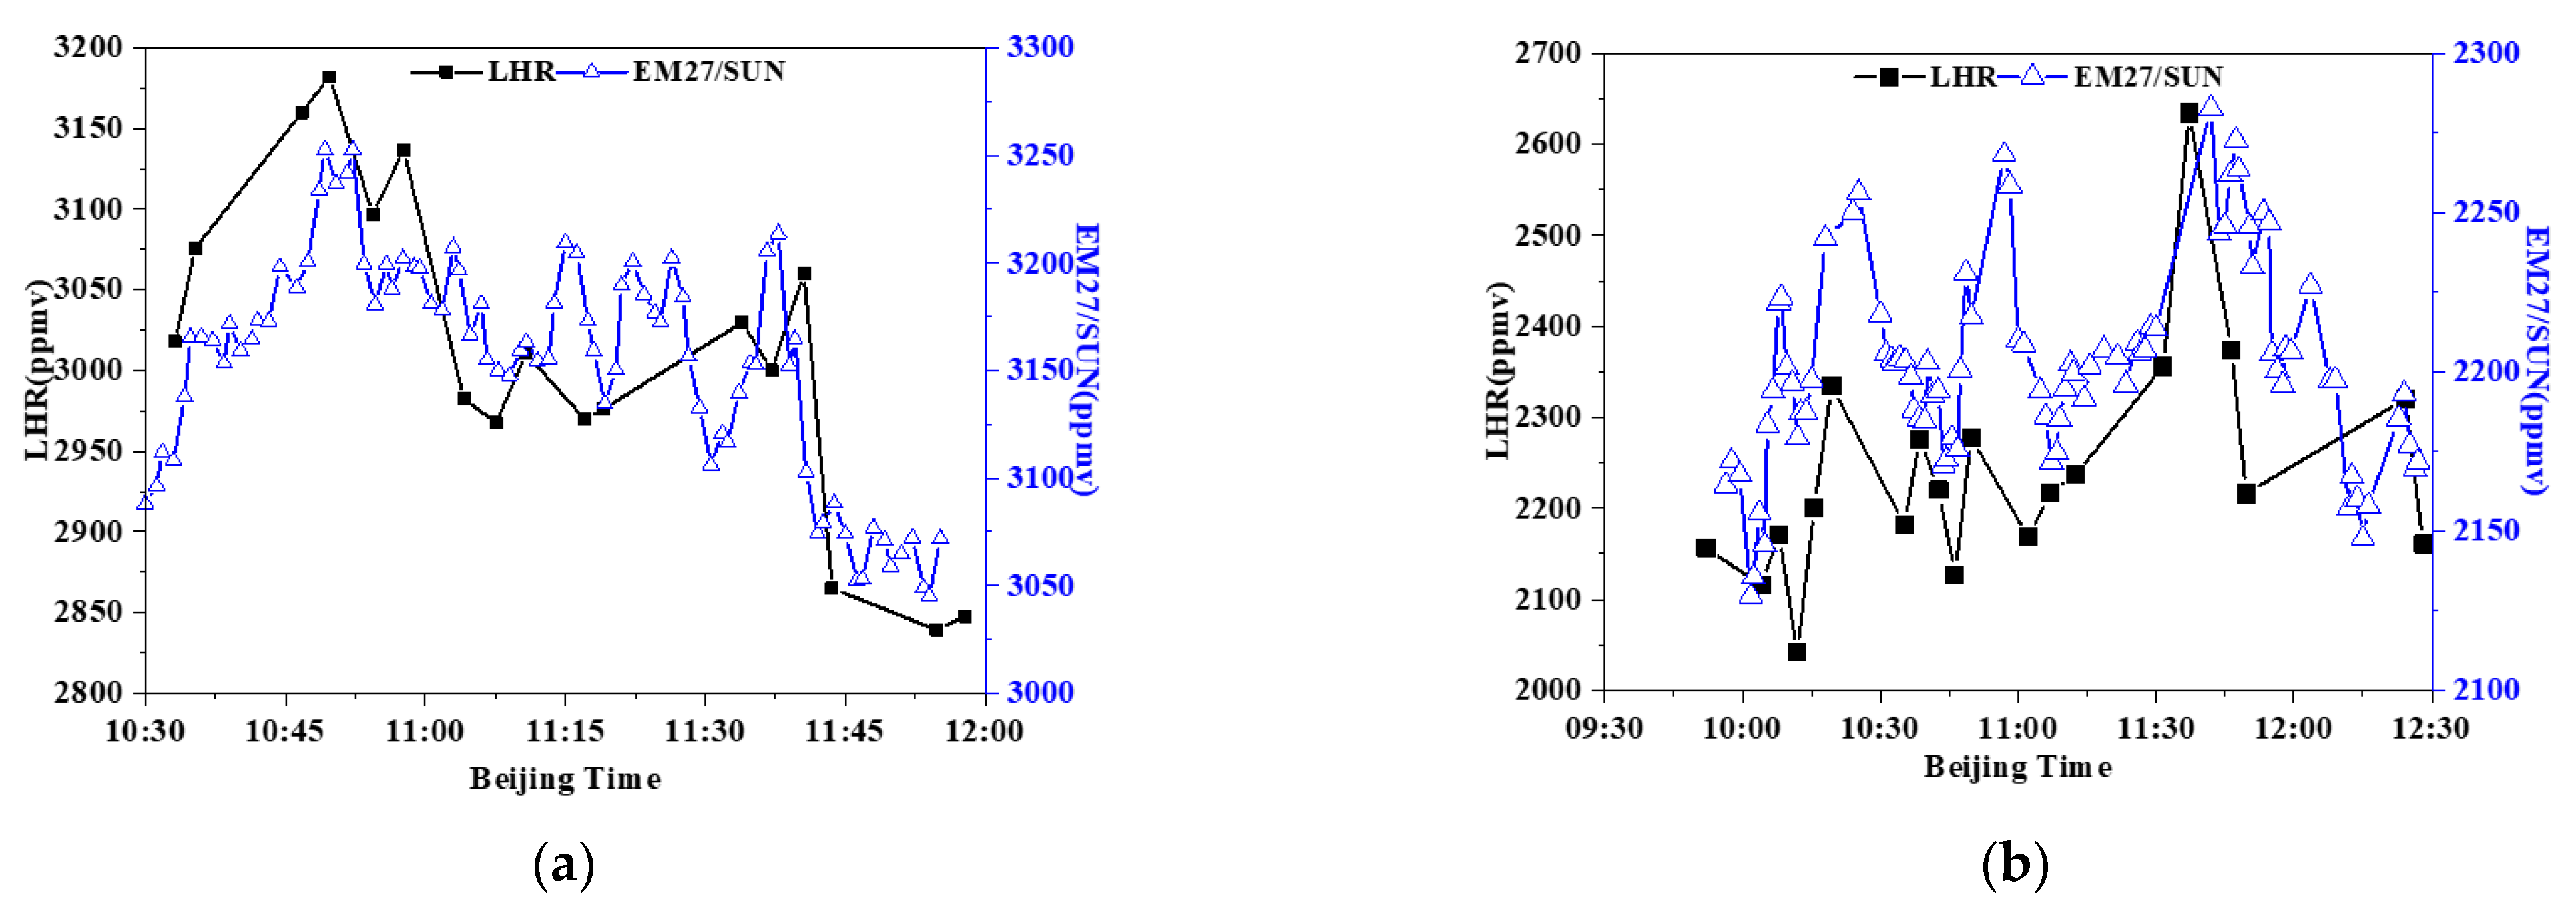
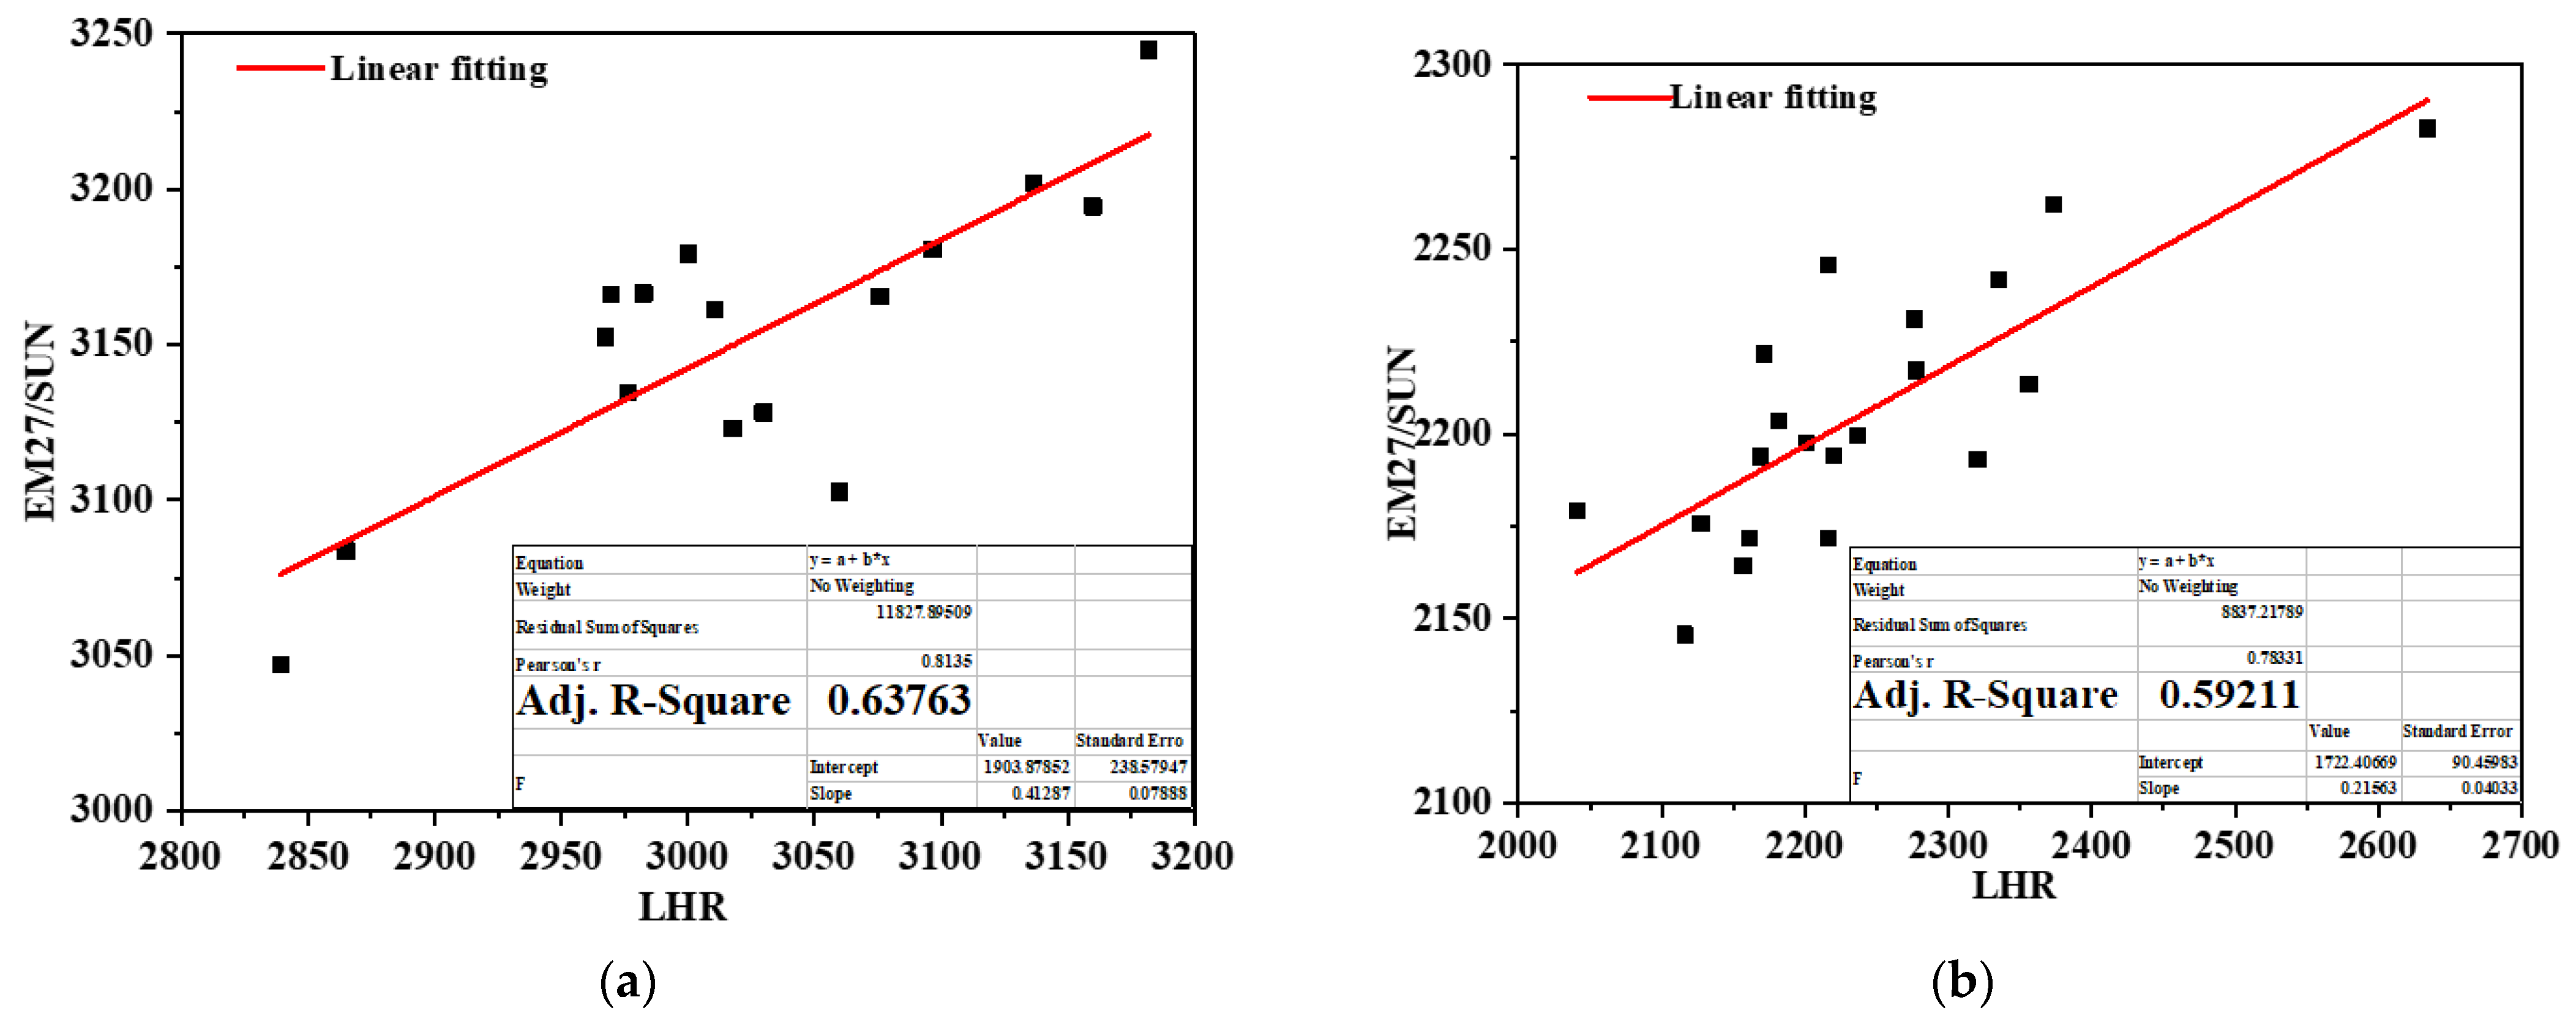
4.1. Comparison of LHR and FTIR

During the measurement campaign, another instrument (Bruker, EM27/SUN) was used to monitor the atmospheric greenhouse simultaneously and the retrieval algorithm was developed by Hans Frank (Karlsruher Institute für Technologie, KIT) [31]. The retrieved column densities of water vapor by LHR and EM27/SUN on July 20th and 21st, and the correlations are shown in Figure 10 and Figure 11, respectively.
The average values of water vapor measured by LHR were 3023 ppmv on 20th and 2239 ppmv on 21st, the EM27/SUN’s results were 3152 ppmv and 2201 ppmv, respectively. The relative errors are 4.09% and 1.73%, and the correlations between LHR and EM27/SUN are around 0.6 (0.637 and 0.592).
The column densities of methane retrieved by LHR and EM27/SUN are shown in Figure 12.
The average values of methane measured by LHR were 1.79 ppmv on 20th and 1.794 ppmv on 21st, the EM27/SUN’s results were 1.871 ppmv and 1.86 ppmv, respectively. The relative errors of the averaged column densities are 4.33% and 3.53%.
There may be three reasons that lead to differences between the results of LHR and EM27/SUN: (1) The spectral errors of LHR are larger than EM27/SUN’s and the a priori and the covariance matrix of water vapor and methane are different, these may induce to different results; (2) The abundance of HDO at Dunhuang may be different with HITRAN database; (3) In the target spectral range, there are 0.0786 cm−1 intervals between the line of HDO (2831.8413 cm−1) and CH4 (2831.9199 cm−1), the absorption of HDO and CH4 is too close with each other which influences the retrieval results; (4) The last reason is the retrieval band of water vapor and methane by EM27/SUN is 8353.4–8463.1 cm−1 and 5897-6145 cm−1 respectively, but by the LHR just using single or several absorption peaks which is very sensitive to the concentration variation.

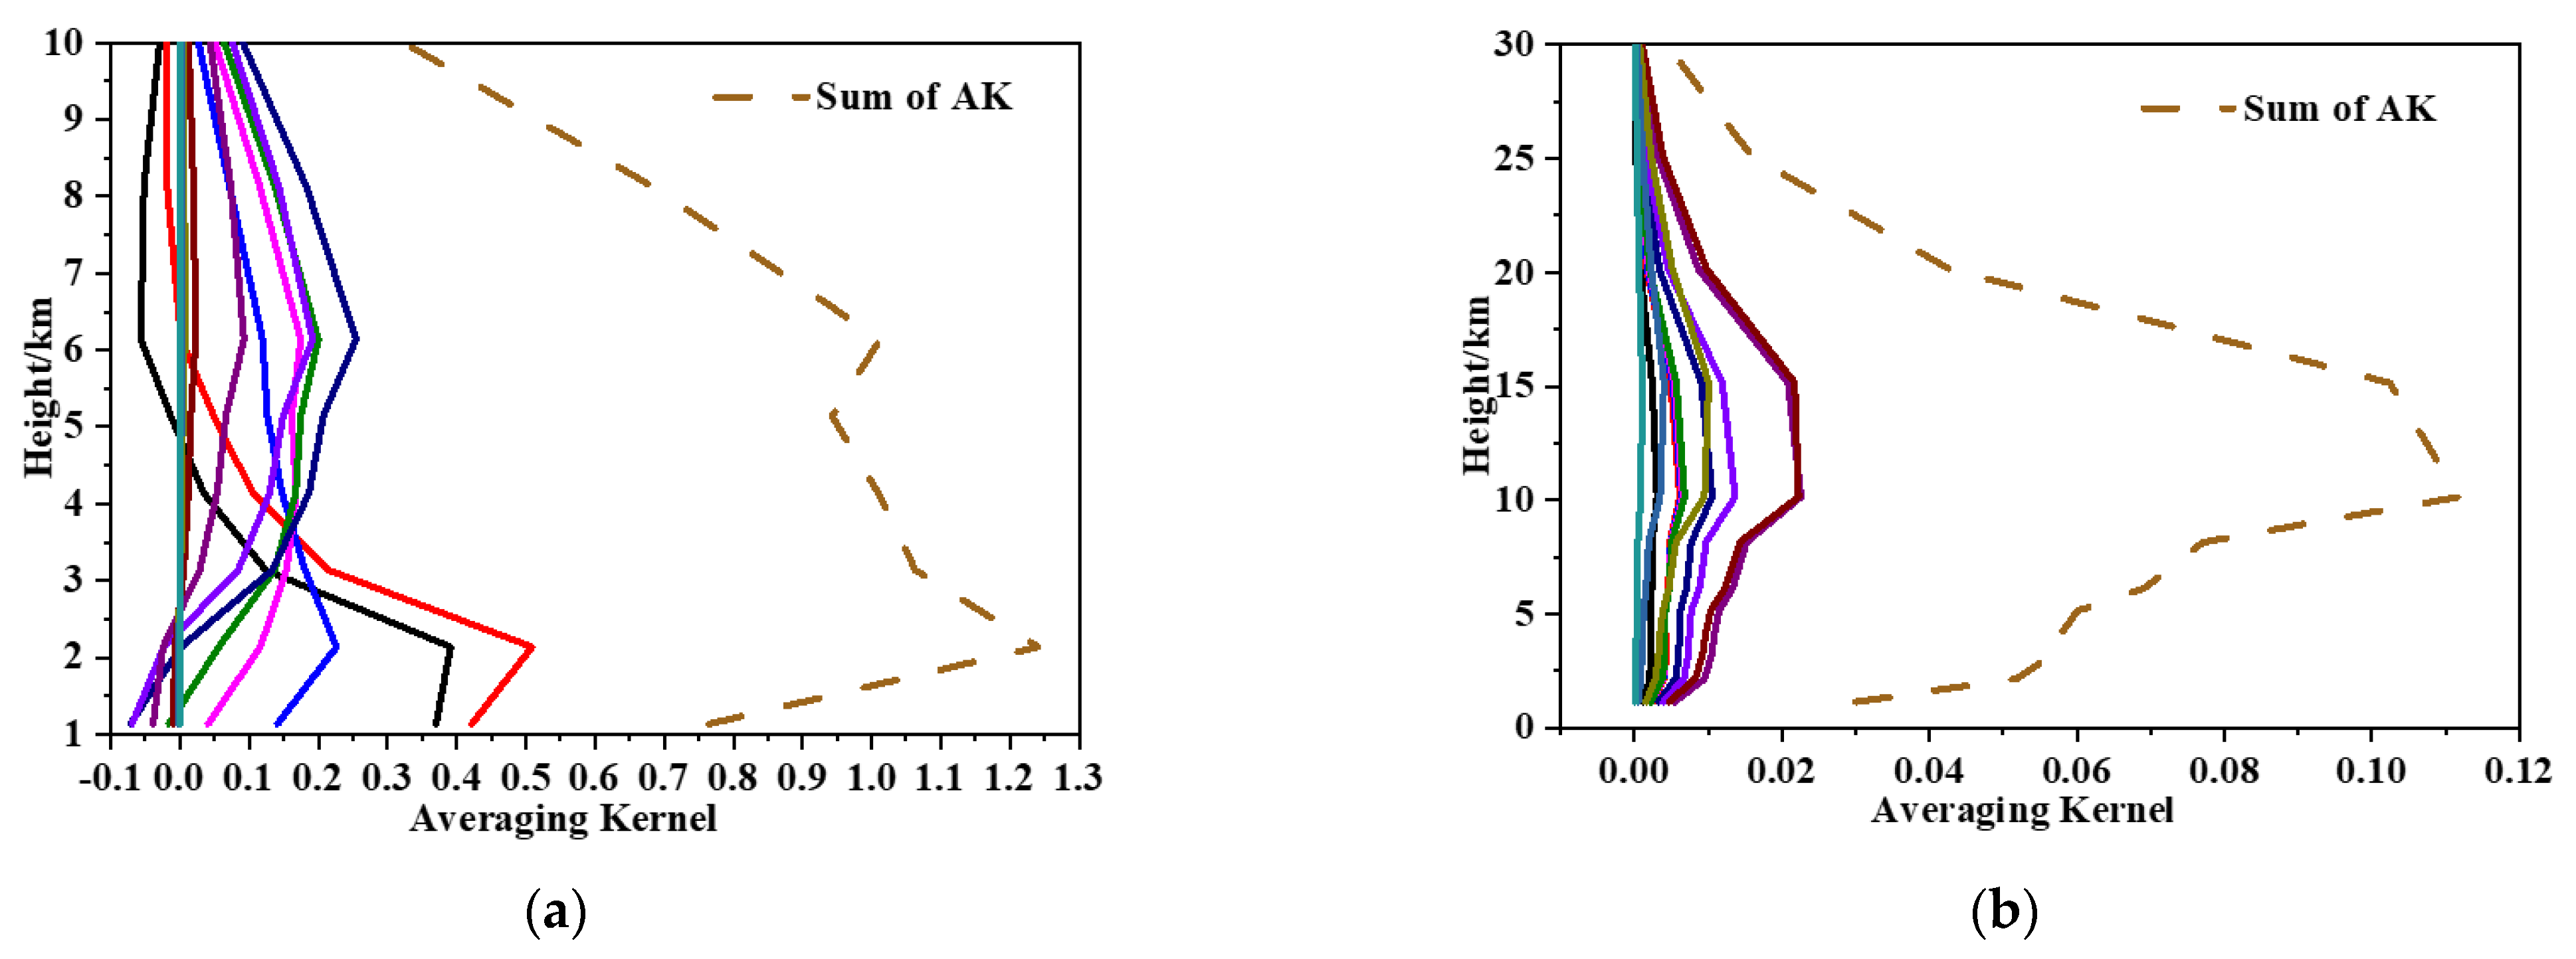
4.2. Analysis of the Jacobian and Averaging Kernel

Each element of the Jacobian matrix is the partial derivative of a forward model element concerning a state vector element. The Jacobian value of water vapor and methane are shown in Figure 13. The transmission has high sensitivity with water vapor density below 7 km, this value agreed with the atmospheric convection and the convection in this area is more robust than coastal areas. The possible reason is the more vigorous atmospheric convection in this area transporting water vapor to a higher atmosphere than in wetlands, forests and grasslands.
Because of the even distribution in the troposphere, the Jacobian of methane at the top of the troposphere (~18 km) still exists a significant value and theoretically provides more information of the atmosphere.
The averaging kernel (AK) provides a simple characterization of the relationship between the retrieval and the actual state. The formula of AK is described by
A = ( K T S ε 1 K + S a 1 ) 1 K T S ε 1 K  
The K is the Jacobian matrix, Sε and Sa are the measurement error covariance and associated covariance matrix. The AKs of water vapor and methane are shown in Figure 14. In order to obtain the differences in retrievals and the actual states, the sum of AK is also calculated.
The AKs of water vapor and methane indicate the information was mainly occupied by water vapor. The sums of water vapor AK were more significantly than 0.5 below 8 km, which meant the measurements obtained lots of water vapor distributed information in this range. And above 8 km, the results were limitedly obtained from measurements. The AKs of methane are shown in the right figure, unfortunately, indicating that the retrieved results were dependent on the a priori rather than real states.
The single vector analysis of AK shows the significant layer of the retrieval. Figure 15 shows the first eight most significant SVs of the “ K ” matrix. The first four SVs have an extreme value near the ground, which means the actual state contributed significantly to the retrieved state near the ground and is agreeable with the actual distribution of water vapor.

5. Conclusions

The instrumental line shape (ILS) of DFB-ICL based LHR was characterized. Using the radiometer, field measurements of HDO and CH4 around 3.53 μm have been reported. The continuous measurements with high resolution and SNR were obtained, the inversion algorithm was also realized for retrieving column density of HDO and CH4. The retrieved densities of HDO are less than 1.0 ppmv and densities of CH4 are around 1.79 ppmv from 20 to 24 July. The relative errors of LHR and EM27/SUN are less than 5.0%, and during the experiments, the decreasing trend of water vapor was been observed. The interval of HDO and CH4 absorption lines may not large enough and lead to the not so accurate retrieved results of methane, but the errors of water vapor are in a proper range.
For better measurements of water vapor and its isotopes, we developed the 3.66 μm LHR in our laboratory recently. The absorption intensity of H2O (υ = 2732.4932 cm−1, S = 1.206 × 10⁻²⁴ cm−1/(molec·cm−2)) and HDO (υ = 2730.9274 cm−1, S = 2.777 × 10⁻²⁴ cm−1/(molec·cm−2)) are proper and their interval exceeds 1.5 cm−1 in this band. Furthermore, other molecules’ absorption intensities are much weaker than H2O and HDO and the scanning range of LO will be increased to about 2.8 cm−1, these conditions will guarantee better measurements and we expect more accurate retrieved results.

Author Contributions

Conceptualization, X.L.; methodology, Z.C., H.M. and G.W.; software, X.L. and D.L.; validation, X.L. and D.L.; formal analysis, X.L. and D.L.; investigation, X.L.; resources, X.L. and P.W.; data curation, X.L., D.L. and P.W.; writing—original draft preparation, X.L.; writing—review and editing, X.L.; visualization, X.L.; supervision, Z.C. and Y.H.; project administration, X.L.; funding acquisition, X.L. All authors have read and agreed to the published version of the manuscript.

Funding

This research was funded by the Youth Innovation Promotion Association of Chinese Academy of Sciences, grant number 2015264) and the Strategic Priority Research Program of Chinese Academy of Sciences, grant number XDA17010104.

Institutional Review Board Statement

Not applicable.

Informed Consent Statement

Not applicable.

Data Availability Statement

Not applicable.

Conflicts of Interest

The authors declare no conflict of interest.

References

  1. Sheng, F.X.; Mao, J.T.; Li, J.G.; Ge, Z.; Zhang, A.C.; Sang, J.G.; Pan, N.; Zhang, H. Radiation processes in the ground and atmosphere. In Atmospheric Physics, 2nd ed.; Peking University Press: Beijing, China, 2013; Volume 2, pp. 6–25. [Google Scholar]
  2. Held, I.M.; Soden, B.J. Water vapor feedback and global warming. Annu. Rev. Energy Environ. 2000, 25, 441–475. [Google Scholar] [CrossRef] [Green Version]
  3. Solomon, S.; Qin, D.; Manning, M.; Chen, Z.; Marquis, M.; Averyt, K.B.; Tignor, M.; Miller, H.L. Climate Change 2007: The Physical Science Basis. Contribution of Working Group I to the Fourth Assessment Report of the Intergovernmental Panel on Climate Change (IPCC). Comput. Geom. 2007, 18, 95–123. [Google Scholar] [CrossRef] [Green Version]
  4. Michel, A.P.M.; Wang, W.E.; Wang, L.; Nikodem, M.; Tsai, T.; Baeck, M.L.; Smith, J.; Wysocki, G. A Quantum Cascade Laser Spectrometer for Measurement of Water Vapor Isotopes in the Urban Environment. In CLEO: Applications and Technology; Optical Society of America: Washington, DC, USA, 2012. [Google Scholar]
  5. Chang, A.; Visser, A.; Oerter, E.; Bond, T. Detection of O18 and D Isotopes in Water Vapor using a Fiber-Coupled Tunable Diode Laser Absorption Spectroscopy Multi-Pass Cell. In CLEO: QELS_Fundamental; Optical Society of America: Washington, DC, USA, 2018. [Google Scholar]
  6. Liu, J.; Zhao, G.; Ma, W.; Axner, O. Development of a Doppler-bradened NICE-OHMS system for trace gas detection based on a single sideband phase modulator. Opt. Express 2021, 29, 42411–42419. [Google Scholar] [CrossRef]
  7. Zhou, X.; Zhao, G.; Liu, J.; Zhou, Y.; Yan, X.; Li, Z.; Ma, W.; Jia, S. Fiber pigtailed DFB laser-based optical feedback cavity enhanced absorption spectroscopy with a fiber-coupled EOM for phase correction. Opt. Express 2022, 30, 6332–6340. [Google Scholar] [CrossRef]
  8. Ma, Y.; Hong, Y.; Qiao, S.; Lang, Z.; Liu, X. H-shaped acoustic micro-resonator-based quartz-enhaced photoacoustic spectroscopy. Opt. Lett. 2022, 47, 601–604. [Google Scholar] [CrossRef]
  9. Ma, Y.; Hu, Y.; Qiao, S.; Lang, Z.; Liu, X.; He, Y.; Spagnolo, V. Quartz tuning forks resonance frequency matching for laser spectroscopy sensing. Photoacoustics 2022, 25, 1003291–1003297. [Google Scholar] [CrossRef]
  10. Qiao, S.; Ma, Y.; He, Y.; Patimisco, P.; Sampaolo, A.; Spagnolo, V. Ppt level carbon monoxide detection based on light-induced thermoelastic spectroscopy exploring custom quartz tuning forks and a mid-infrared QCL. Opt. Express 2021, 29, 25100–25108. [Google Scholar] [CrossRef]
  11. Liu, X.; Qiao, S.; Ma, Y. Highly sensitive methane detection based on light-induced thermoelastic spectroscopy with a 2.33 µm diode laser and adaptive Savitzky-Golay filtering. Opt. Express 2022, 30, 1304–1313. [Google Scholar] [CrossRef]
  12. Liu, X.; Ma, Y. Sensitive carbon monoxide detection based on light-induced thermoelastic spectroscopy with a fiber-coupled multipass cell. Chin. Opt. Lett. 2022, 20, 0312011–0312015. [Google Scholar] [CrossRef]
  13. Toptygin, A.Y.; Gribanov, K.G.; Zakharov, V.I.; Kasai, Y.; Kagawa, A.; Murayama, Y.; Imasu, R.; Schmidt, G.; Hoffmann, G.W.; Jouzel, J. Method and results of retrieval of HDO/H2O in atmosphere from IMG/ADEOS and FTIR data. In Proceedings of the 15th Symposium on High-Resolution Molecular Spectroscopy, Nizhny Novgorod, Russia, 12 December 2006; Volume 6580, p. 65800X. [Google Scholar] [CrossRef]
  14. Worden, J.; Noone, D.; Galewsky, J.; Bailey, A.; Bowman, K.; Brown, D.; Hurley, J.; Kulawik, S.; Lee, J.; Strong, M. Estimate of bias in Aura TES HDO/H2O profiles from comparison of TES and in situ HDO/H2O measurements at the Mauna Loa observatory. Atmos. Chem. Phys. 2011, 11, 4491–4503. [Google Scholar] [CrossRef] [Green Version]
  15. Lacour, J.L.; Clarisse, L.; Worden, J.; Schneider, M.; Barthlott, S.; Hase, F.; Risi, C.; Clerbaux, C.; Hurtmans, D.; Coheur, P.-F. Cross-validation of IASI/MetOp derived tropospheric δD with TES and ground-based FTIR observations. Atmos. Chem. Phys. 2015, 8, 1447–1466. [Google Scholar] [CrossRef] [Green Version]
  16. Scheepmaker, R.A.; Frankenberg, C.; Galli, A.; Butz, A.; Schrijver, H.; Deutscher, N.M.; Wunch, D.; Warneke, T.; Fally, S.; Aben, I. Improved water vapour spectroscopy in the 4174–4300 cm−1 region and its impact on SCIAMACHY HDO/H2O measurements. Atmos. Meas. Tech. Discuss. 2013, 5, 8539–8578. [Google Scholar] [CrossRef]
  17. Boesch, H.; Deutscher, N.M.; Warneke, T.; Byckling, K.; Cogan, A.J.; Griffith, D.W.T.; Notholt, J.; Parker, R.J.; Wang, Z. HDO/H2O ratio retrievals from GOSAT. Atmos. Meas. Tech. 2013, 6, 599–612. [Google Scholar] [CrossRef] [Green Version]
  18. Frankenberg, C.; Wunch, D.; Toon, G.; Risi, C.; Scheepmaker, R.; Lee, J.-E.; Wennberg, P.; Worden, J. Water vapor isotopologue retrievals from high-resolution GOSAT shortwave infrared spectra. Atmos. Meas. Tech. 2013, 6, 263–274. [Google Scholar] [CrossRef] [Green Version]
  19. Herman, R.L.; Worden, J.; Noone, D.; Henze, D.; Bowman, K.; Pereira, K.C.; Payne, V.H.; Kulawik, S.S.; Fu, D.J. Comparison of Optimal Estimation HDO/H2O Retrievals from AIRS with ORACLES measurements. Atmos. Meas. Tech. Discuss. 2019. [Google Scholar] [CrossRef]
  20. Schneider, A.; Borsdorff, T.; De Brugh, J.A.; Aemisegger, F.; Feist, D.G.; Kivi, R.; Hase, F.; Schneider, M.; Landgraf, J. First data set of H2O/HDO columns from the Tropospheric Monitoring Instrument (TROPOMI). Atmos. Meas. Tech. 2020, 13, 85–100. [Google Scholar] [CrossRef] [Green Version]
  21. Fukunishi, H.; Okano, S.; Taguchi, M.; Ohnuma, T. Laser heterodyne spectrometer using a liquid nitrogen cooled tunable diode laser for remote measurements of atmospheric O3 and N2O. Appl. Opt. 1990, 29, 2722–2728. [Google Scholar] [CrossRef]
  22. Taguchi, M.; Okano, S.; Fukunishi, H.; Sasano, Y. Comparison of ozone profiles from ground-based laser heterodyne spectrometer and ozonesonde measurements. Geo. Res. Lett. 1990, 17, 2349–2352. [Google Scholar] [CrossRef]
  23. Weidmann, D.; Reburn, W.J.; Smith, K.M. Retrieval of atmospheric ozone profiles from an infrared quantum cascade laser heterodyne radiometer: Results and analysis. Appl. Opt. 2007, 46, 7162–7171. [Google Scholar] [CrossRef]
  24. Tsai, T.R.; Rose, R.A.; Weidmann, D.; Wysocki, G. Atmospheric vertical profiles of O3, N2O, CH4, CCl2F2, and H2O retrieved from external-cavity quantum-cascade laser heterodyne radiometer measurements. Appl. Opt. 2012, 51, 8779–8792. [Google Scholar] [CrossRef] [Green Version]
  25. Melroy, H.R.; Wilson, E.L.; Clarke, G.B.; Ott, L.E.; Mao, J.; Ramanathan, A.K.; McLinden, M.L. Autonomous field measurements of CO2 in the atmospheric column with the miniaturized laser heterodyne radiometer (Mini-LHR). Appl. Phys. B 2015, 120, 609–615. [Google Scholar] [CrossRef] [PubMed] [Green Version]
  26. Protopopov, V.V. Principles of optical heterodyning. In Laser Heterodyning; Rhodes, W.T., Ed.; Springer: Berlin, Germany, 2009; Volume 1, pp. 1–47. [Google Scholar]
  27. Tan, T.; Cao, Z.S.; Wang, G.S.; Wang, L.; Liu, K.; Huang, Y.B.; Chen, W.D.; Gao, X.M. Study on the technology of the 4.4 μm mid-infrared laser heterodyne spectrum. Spectrosc. Spect. Anal. 2015, 35, 60–63. [Google Scholar] [CrossRef]
  28. Lu, X.J.; Cao, Z.S.; Huang, Y.B.; Gao, X.M.; Rao, R.Z. Laser heterodyne spectrometer for solar spectrum measurement in the 3.53 μm region. Opt. Precis. Eng. 2019, 26, 16–24. [Google Scholar] [CrossRef]
  29. Wang, J.J.; Wang, G.S.; Tan, T.; Zhu, G.; Sun, C.Y.; Cao, Z.S.; Chen, W.D.; Gao, X.M. Mid-infrared laser heterodyne radiometer (LHR) based on a 3.53 μm room-temperature interband cascade laser. Opt. Express 2019, 27, 9610–9619. [Google Scholar] [CrossRef] [PubMed]
  30. Rodgers, C.D. Inverse Methods for Atmospheric Sounding, 2nd ed.; World Scientific: London, UK, 2004; Volume 4–5, pp. 65–100. [Google Scholar]
  31. Hase, F.; Hannigan, J.W.; Coffey, M.T.; Goldman, A.; Pfner, M.H.; Jones, N.B.; Rinsland, C.P.; Wood, S.W. Intercomparison of retrieval codes used for the analysis of high-resolution, ground-based FTIR measurements. J. Quant. Spectrosc. Radiat. Transf. 2004, 87, 25–52. [Google Scholar] [CrossRef]
Figure 1. The experiment site at Dunhuang in Gansu province of Northwest China.
Remotesensing 14 01489 g001
Figure 2. The power of the IF signal in the frequency domain.
Remotesensing 14 01489 g002
Figure 3. The simulated and measured ILS of 3.53 μm LHR.
Remotesensing 14 01489 g003
Figure 4. The wavelength stability of local oscillator.
Remotesensing 14 01489 g004
Figure 5. The flow chart of retrieval method.
Remotesensing 14 01489 g005
Figure 6. The pressure and temperature profiles at Dunhuang. (a) The measured atmospheric pressure profile during the experiments; (b) The measured atmospheric temperature profile during the experiments.
Remotesensing 14 01489 g006
Figure 7. The measured spectra (black line), the retrieval fitting (red line), HDO fitting (green line), CH4 fitting (blue line) and the residual (light blue line).
Remotesensing 14 01489 g007
Figure 8. (a) HDO and (b) CH4 column density from 20 to 24 July at Dunhuang.
Remotesensing 14 01489 g008
Figure 9. Water vapor column densities at Dunhuang.
Remotesensing 14 01489 g009
Figure 10. The water vapor column densities of EM27/SUN and LHR on (a) 20 and (b) 21 July.
Remotesensing 14 01489 g010
Figure 11. The correlation analysis of LHR and EM27/SUN water vapor measurements on (a) 20 and (b) 21 July.
Remotesensing 14 01489 g011
Figure 12. The methane column density of EM27/SUN and LHR on (a) 20 and (b) 21 July.
Remotesensing 14 01489 g012
Figure 13. The Jacobian value of (a) HDO and (b) CH4.
Remotesensing 14 01489 g013
Figure 14. Averaging Kernel of (a) HDO and (b) CH4.
Remotesensing 14 01489 g014
Figure 15. The first eight and most significant singular vectors (SVs) of K matrix.
Remotesensing 14 01489 g015
Table 1. Specifications of the Laser Heterodyne Radiometer.
ParameterValueUnit
Line-width of LO<10MHz
Frequency coverage2831.5~2832.4cm−1
Scanning period12s
Radiofilter band8~35MHz
Integral time10ms
Target speciesHDO, CH4--
Publisher’s Note: MDPI stays neutral with regard to jurisdictional claims in published maps and institutional affiliations.

