Article

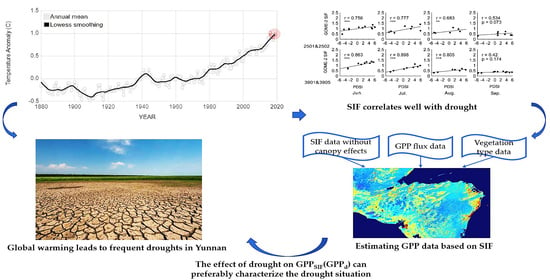
SIF-Based GPP Is a Useful Index for Assessing Impacts of Drought on Vegetation: An Example of a Mega-Drought in Yunnan Province, China

1
College of Geography and Environmental Science, Northwest Normal University, Lanzhou 730070, China
2
Key Laboratory of Resource Environment and Sustainable Development of Oasis, Lanzhou 730000, China
3
Cryosphere Research Station on the Qinghai-Tibet Plateau, State Key Laboratory of Cryospheric Science, Northwest Institute of Eco-Environment and Resources, Chinese Academy of Sciences, Lanzhou 730000, China
*
Author to whom correspondence should be addressed.
Remote Sens. 2022, 14(6), 1509; https://doi.org/10.3390/rs14061509
Submission received: 27 January 2022 / Revised: 17 March 2022 / Accepted: 18 March 2022 / Published: 21 March 2022

Abstract

:
The impact of drought on terrestrial ecosystem Gross Primary Productivity (GPP) is strong and widespread; therefore, it is important to study the response of terrestrial ecosystem GPP to drought. In this paper, we compared the correlations of Sun-induced Chlorophyll fluorescence (SIF), Enhanced Vegetation Index (EVI), and Normalized Differential Vegetation Index (NDVI) with the drought index sc_PDSI, estimated GPP in Yunnan Province, China, based on SIFTOTAL data (SIF data with canopy effects eliminated), and analyzed the response characteristics of GPP to drought for one mega-drought event (2009–2011) in combination with the sc_PDSI drought index. The results show that SIF is more sensitive to drought than the NDVI and EVI; the correlation between the GPP estimated based on SIF data (GPPSIF) and the actual observed flux values (R2 = 0.83) is better than GPPGLASS and GPPLUE, and the RMSE is also lower than those two products. This drought has a serious impact on GPP, and the monthly average values of the effect of drought on GPP (GPPd) in Yunnan Province in 2009, 2010, and 2011 are −11.37 gC·m−2·month−1, −23.48 gC·m−2·month−1 and −17.92 gC·m−2·month−1, which are 8.6%, 17.48% and 13.85% of the monthly average in a normal year, respectively. The spatial variability of GPP response to drought is significant, which is mainly determined by the degree, and duration of the drought, the vegetation type, the topography, and anthropogenic factors. In conclusion, GPPSIF quickly and accurately reflects the process of this drought, and this study helps to elucidate the response of GPP to drought conditions and provides more scientific information for drought prediction and ecosystem management.

Graphical Abstract

1. Introduction

The Gross Primary Productivity (GPP) of terrestrial ecosystems reflects the amount of organic carbon fixed by terrestrial vegetation through photosynthesis, which is the largest component of the global terrestrial carbon flux [1]. In the context of a warming climate, the frequency of droughts has tended to increase significantly, the impact of drought on the terrestrial ecosystem GPP is the strongest and most widespread of all climate extremes [2]. Therefore, it is important to study the response of terrestrial ecosystem GPP to drought [3].
Although there have been a number of studies on the response of GPP to drought, most of the GPP data used in these studies were estimated based on various vegetation indices such as the Normalized Differential Vegetation Index (NDVI), the Enhanced Vegetation Index (EVI), and the Normalized Difference Water Index (NDWI) [4]. It is well known that an arid environment can lead to changes in the vegetation physiological and metabolic functions of vegetation, which can reduce photosynthesis and fluorescence production [5,6]. However, these vegetation indices are only sensitive to changes in the canopy structure and pigment concentration and are not directly related to photosynthesis [7]. Therefore, when drought occurs, the spectral characteristics of the vegetation canopy do not change immediately, resulting in GPP based on these vegetation indices not reflecting drought quickly and accurately, and the response to drought has a significant lag effect [7]. Sun-induced Chlorophyll fluorescence (SIF) data is a light signal produced by vegetation during photosynthesis, a concomitant product of photosynthesis, and has the advantage of providing more intuitive information on plant biochemical, physiological, and metabolic functions than reflectance-based vegetation indices [8]. Therefore, SIF has been used to study water stress at different spatial scales. During drought, fluorescence decreases due to water stress even if vegetation canopy greenness remains constant [5] Therefore, SIF is more sensitive to vegetation stress by drought than vegetation index, which measures only vegetation greenness [9].
Special research, however, is not available at present to demonstrate that SIF-based vegetation GPP responds better to drought climate than vegetation index-based GPP products, and is an excellent indicator to accurately and quickly reflect the process of drought impact on vegetation. Therefore, this study analyzed the response of GPP to drought based on SIF data simulation using a mega-drought as a case study.
Drought indices are convenient tools with which to assess drought, such as the Standardized Precipitation Index (SPI) [10] and the Standardized Precipitation Evapotranspiration Index (SPEI), which rely on meteorological factors to assess drought and ignore the influence of surface factors on drought. However, there is an increasing recognition that aridity should be evaluated using a more diverse representation of water demand and supply for different land surface processes [11,12]. Therefore, we need an index that fully considers the factors influencing drought. The Palmer drought severity index (PDSI), established by Palmer [13] in 1965, fully considered all elements of water balance (temperature, precipitation, evapotranspiration, soil type, etc.) [14]. Wells et al. [15] developed an adaptive Palmer drought severity index (sc_PDSI) based on the PDSI, which automatically corrects for persistence and climate weighting factors at each site when calculating this index. Thus, the calculation results are more adapted to the climate characteristics of each site [16]. Moreover, the index has a different sensitivity to dry and to wet conditions, which improves spatial comparability and applicability, and is now widely used in drought assessment, water resource management, and other fields. The index has good applicability in China, especially in the southwest region [16]. For these reasons, we used the sc_PDSI index to characterize the drought situation.
Yunnan Province, located along in the southwest border of China, has always been an area with more severe droughts, such as the great summer drought in 2005 and the extraordinary drought in 2009–2011. Hence, this paper takes Yunnan Province as the study area, for this mega-drought in 2009–2011; combines vegetation type data, GPP flux observation data and drought index data to analyze the response process of GPP simulated based on SIF data (GPPSIF) to drought and estimate the value of the effect of drought on GPPSIF (GPPd), to prove that GPPSIF is an effective index to assess the response of vegetation to drought.

2. Materials and Methods

2.1. Study Area

Yunnan, abbreviated as Dian, is located in the southwest of China, between 21°8′32″~29°15′8″ north latitude and 97°31′39″~106°11′47″ east longitude, with a total area of 394,000 square km. The topography of Yunnan Province is high in the northwest and low in the southeast, with the Yuanjiang Valley and the southern part of the Yunling Mountain Range as the boundary, divided into two parts. The eastern part is on the Yunnan–Guizhou Plateau, with high altitude and a rich growth of grassland, farmland, and scrub; the western part is in the longitudinal valley area of the Hengduan Mountains; the southwestern part has gentle terrain and very high vegetation cover; and the northwestern part is at a very high altitude, generally at 3000–4000 m. The average precipitation in the province is about 1100 mm, showing a general trend of more precipitation in the east, west, and south, gradually decreasing from the center to the north. Figure 1 shows the general situation of Yunnan Province.

2.2. Data Resources

2.2.1. Index Data

The index data used in this paper include Sun-induced Chlorophyll fluorescence (SIF), Normalized Differential Vegetation Index (NDVI), Enhanced Vegetation Index (EVI) and Near-infrared Reflectance (NIRT) data. SIF data from the Global Ecological Panel (https://globalecology.unh.edu accessed on 18 May 2021) is a new high spatial and temporal resolution (0.05°, 8 d) global “OCO-2” SIF (GOSIF) dataset based on discrete OCO-2 SIF, MODIS and meteorological reanalysis data [17], which has shown good performance in estimating GPP [18]. NDVI, EVI and NIRT data are taken from the MOD13C2 dataset of the Land Processes Distributed Active Archive Center (LP DAAC) website (https://lpdaac.usgs.gov/ accessed on 21 May 2021), with temporal resolution of days and spatial resolution of 0.05° × 0.05°. The period chosen for this paper is from 2003 to 2018.

2.2.2. Drought Data

Drought index data are obtained using the self-corrected Palmer Drought Index sc_PDSI with a dataset from the CRU climate dataset [19] (https://crudata.uea.ac.uk/cru/data/drought/#global accessed on 19 May 2021) the spatial resolution is 0.5° × 0.5°, and we resampled the data to a 0.05° × 0.05° size for spatial scale consistency. The droughts are classified into nine grades according to the results of sc_PDSI, with smaller values indicating drier and larger values indicating wetter conditions, as shown in Table 1 [15]. The period chosen for this paper is from 2003 to 2018.

2.2.3. Gross Primary Productivity (GPP) Data

There are two GPP products used in this study: GPPLUE and GPPGLASS. GPPLUE is estimated using a light use efficiency (LUE) model, and LUE is improved by introducing a clearness index (CI) and an evaporation ratio [20], with a resolution of 8 d and a spatial resolution of 0.05° × 0.05°. GPPGLASS is a collection of eight currently international models with a Bayesian multi-algorithm integration approach [21], with a temporal resolution of 8 d and a spatial resolution of 1 km. Both products are derived from the National Earth System Science Data Center (http://www.geodata.cn accessed on 22 May 2021). The GPP product data from 2003 to 2018 are selected for this paper, and the spatial resolution is resampled to 0.05° × 0.05° using a bilinear interpolation method. The purpose of using these two GPP products is for comparison with the SIF-based GPP.
This study also used eight flux tower GPP data based on the vorticity correlation method (Dangxiong, Dinghushan, Haibei, Xilingole, Qianyanzhou, Xishuangbanna, Yucheng and Changbaishan sites) in China from 2003 to 2010 with SIF data to establish linear fitting equations of GPP-SIF for different vegetation types and calculate fitting coefficients for different vegetation types (in Section 2.3.1, we denote these coefficients by Si). The vegetation types included alpine meadows, typical grasslands, scrub, woodlands, and farmlands. In addition, we also used data from the Changling flux site that were not involved in the linear fit to verify the accuracy of the simulated GPP (due to data limitations, we currently only have access to flux data for the Changling site from 2007–2010, so the data period for accuracy verification in Section 3.2 is 2007–2010).
The eight flux site data used for the linear fit were obtained from the China Terrestrial Ecosystem Flux Observation Research Network (China FLUX, http://www.chinaflux.org/ accessed on 23 May 2021). The data for the Changling site was obtained from FLUXNET (https://fluxnet.org/data/download-data/ accessed on 3 March 2022).

2.2.4. Vegetation Type Data

The vegetation type data are obtained from the Resource and Environment Science Data Center of the Chinese Academy of Sciences (http://www.resdc.cn/ accessed on 23 May 2021) with a spatial resolution of 1 km × 1 km. The types included five categories: arable land, forest land, grassland, scrub, and other types.
The drought period studied in this paper is June 2009–April 2011, and other time periods appear in the data for comparison with the drought period. For spatial scale consistency, all data were resampled to a 0.05° × 0.05° spatial resolution using the bilinear method [22], except for vegetation type data, which were resampled to 0.05° × 0.05° using the nearest neighbor method [23].

2.3. Methods

2.3.1. Estimation of GPP Based on SIF Data

GPP is mainly determined by two variables: absorbed photosynthetically active radiation of vegetation canopy ( A P A R ) and light use efficiency (LUE, ε ). The calculation equation is as follows:
G P P = A P A R × ε P
where A P A R represents the photosynthetically active radiation absorbed by the canopy (MJ·m−2) and ε P denotes the actual light use efficiency of vegetation photosynthesis (gC·MJ−1), which is the efficiency of photosynthetically active radiation absorbed by the canopy to be converted into organic carbon.
SIF contains information on light use efficiency ( ε ) and absorbed photosynthetically active radiation of canopy ( A P A R ) (see Equation (2)):
S I F ( λ ) = A P A R × ε F ( λ ) × f e s c ( λ )
where λ is the spectral wavelength, εF is the fluorescence quantum yield (i.e., the ratio of fluorescence emitted by the plant after absorbing photosynthetically active radiation), and fesc(λ) is the proportion of fluorescence emitted by chloroplasts that can escape from the canopy. Combining Equations (2) and (3) can be obtained as follows.
G P P = S I F ( λ ) × ε P ε F ( λ ) × 1 f e s c ( λ )
When the vegetation area covered by the satellite repeat does not change in canopy structure within a certain time, f e s c ( λ )   can be assumed to be a constant value and will be defaulted to 1. The relationship between G P P and S I F is determined by the ratio of the two light energy utilization rates:
G P P S I F = A P A R × ε P A P A R × ε F ( λ ) × f e s c ( λ )
G P P = S I F × ε P ε F ( λ ) = S I F × S i
In addition, Badgley et al. [24] showed that the product of N I R T and N D V I can effectively separate the signal from the vegetation, thus eliminating the problems caused by the non-vegetation component of the pixels. By multiplying N D V I by N I R T , the effect of canopy structure on the observed S I F can be effectively reduced.
N I R V = N I R T × N D V I
G P P = S I F N I R v × S = S I F T O T A L × S i
where SIFTOTAL is the S I F of the total canopy obtained after eliminating the effect of canopy structure, and Si is the fit coefficient between the G P P observations and S I F for different vegetation types that we presented in Section 2.2.3.

2.3.2. Correlation Analysis and Root Mean Square Error Calculation

Correlation analysis is to reveal the closeness of the interrelationship between elements. In this paper, the coefficient of determination R 2 is mainly used to judge the degree of fit and correlation of different data, and the correlation between vegetation SIF, EVI, NDVI and drought index sc_PDSI is calculated separately with the following equations:
R 2 = 1 i ( y i f i ) 2 i ( y i y ¯ ) 2
where y is the actual value, f is the predicted value, y ¯ is the average of the actual value y, and yi and fi denote the values of variables y and f in year i, respectively.
In addition, the correlation analysis based on image elements [25] was used in this paper to determine the correlation between the values of GPP response to drought and the drought index with the following equation:
R x y = i = 1 n [ ( x i x ¯ ) × ( y i y ¯ ) ] i = 1 n ( x i x ¯ ) 2 i = 1 n ( y i y ¯ ) 2
where, R x y is the correlation coefficient of x, y variables; xi, and yi represent the values of x and y variables in the year i, respectively, n is the sample size; x ¯ denotes the mean value of variable x; and y ¯ denotes the mean value of variable y. The root means square error ( R M S E ) is calculated as follows:
R M S E = 1 m i = 1 m ( x i y i ) 2
The R M S E measures the deviation between the observed GPP fluxes and the GPP simulation values.

3. Results

3.1. SIF Correlates Better with Drought Than EVI and NDVI

Although drought impacts vegetation production throughout the growing season [26], the sensitivity of plants to water stress varies according to their phenology [27,28]. Vegetation photosynthesis is strongest during the peak greenness season and weaker during the senescence period, so vegetation is more sensitive to drought in the peak growing months [4]. Therefore, the peak growth period was chosen as the study period for correlation analysis in this section. The correlation analysis in this section is calculated on a monthly basis for the peak growth period from May to September 2009–2011, for a total of 15 months.
The spatial distributions of SIF, EVI, NDVI and sc_PDSI during the study period are shown in Figure 2, and the correlation distributions and significance test percentages of the three indices with sc_PDSI are shown in Figure 3 and Figure 4. Figure 3 and Figure 4 show that the mean value of correlation and the proportion of positive correlation between SIF and sc_PDSI are the largest among the three indices, indicating that the correlation between SIF and sc_PDSI is the best.
The correlation between SIF and sc_PDSI in Yunnan Province (Figure 3a) shows a spatial distribution pattern of “low in the west and high in the east”. According to Figure 3, the mean value of the correlation between SIF and sc_PDSI is 0.42, which shows a significantly positive correlation overall. The significantly positive correlation area (correlation > 0 and p < 0.05) accounted for about 52.79% of the province’s area, which is mainly distributed in parts of Central and Northeastern Yunnan, and the sc_PDSI in these areas ranged from −3.4 to −0.87. The annual mean value of SIF in this area is about 0.892, which is 17.33% less than the 2008 (non-drought year) mean SIF value of 1.079. The insignificant correlation area (p > 0.05) accounted for about 34.07% of the province’s area and is mainly distributed in some areas such as Southern and Western Yunnan, where the drought index ranged from −4.02 to −0.41. The annual mean value of SIF in these areas is 1.133, which is 9.14% less than the 2008 mean value of 1.247. The significantly negative correlation area (correlation < 0 and p < 0.05) accounted for about 13.14% of the province’s area, mainly in Western Yunnan. The drought index in these areas ranged from −3.26 to −0.27. The annual mean value of SIF in these areas is 1.167, which is 5.90% more than the 2008 mean value of 1.102.
The spatial correlations of EVI and NDVI with sc_PDSI in Yunnan Province are shown in Figure 3b,c. The overall spatial pattern is similar to the distribution pattern of correlations between SIF and sc_PDSI. In addition to the lower overall correlation than SIF, the main differences are in Southwest Yunnan. The drought situation in Southwest Yunnan is mild to moderate, and the annual average values of SIF, EVI and NDVI in Southwest Yunnan from 2009 to 2011 are lower than those in 2008. The annual mean values of SIF, EVI and NDVI in Southwest Yunnan from 2009 to 2011 are 0.94%, 5.18% and 12.25% lower than those in 2008, respectively. It is evident that drought has less influence on Southwest Yunnan and the correlation between each index and sc_PDSI should be reltively low. However, EVI and NDVI were significantly and positively correlated with sc_PDSI, which may be related to the characteristics of vegetation indices. Furthermore, the areas of EVI, NDVI, and sc_PDSI with a significantly positive correlation in Central and Eastern Yunnan accounted for less than SIF.
For a more accurate description, we selected four uniformly distributed sites in Yunnan Province: Lijiang, Lincang, Wenshan, and Zhaotong (distribution can be seen in Figure 1). Then, we extracted their multi-year growth peak (May–September) SIF, NDVI, and EVI data and sc_PDSI data for correlation analysis. The results are shown in Figure 5. It can be seen that all three indices and sc_PDSI were significantly and positively correlated, with R2 means of 0.68, 0.43 and 0.50, respectively. The correlation between SIF and sc_PDSI was the highest, and the correlation between EVI and sc_PDSI was slightly better than that of NDVI. Thus, the correlation between SIF and the drought index sc_PDSI was found to be significantly better than that of EVI and NDVI, both in all of Yunnan and at individual sites.

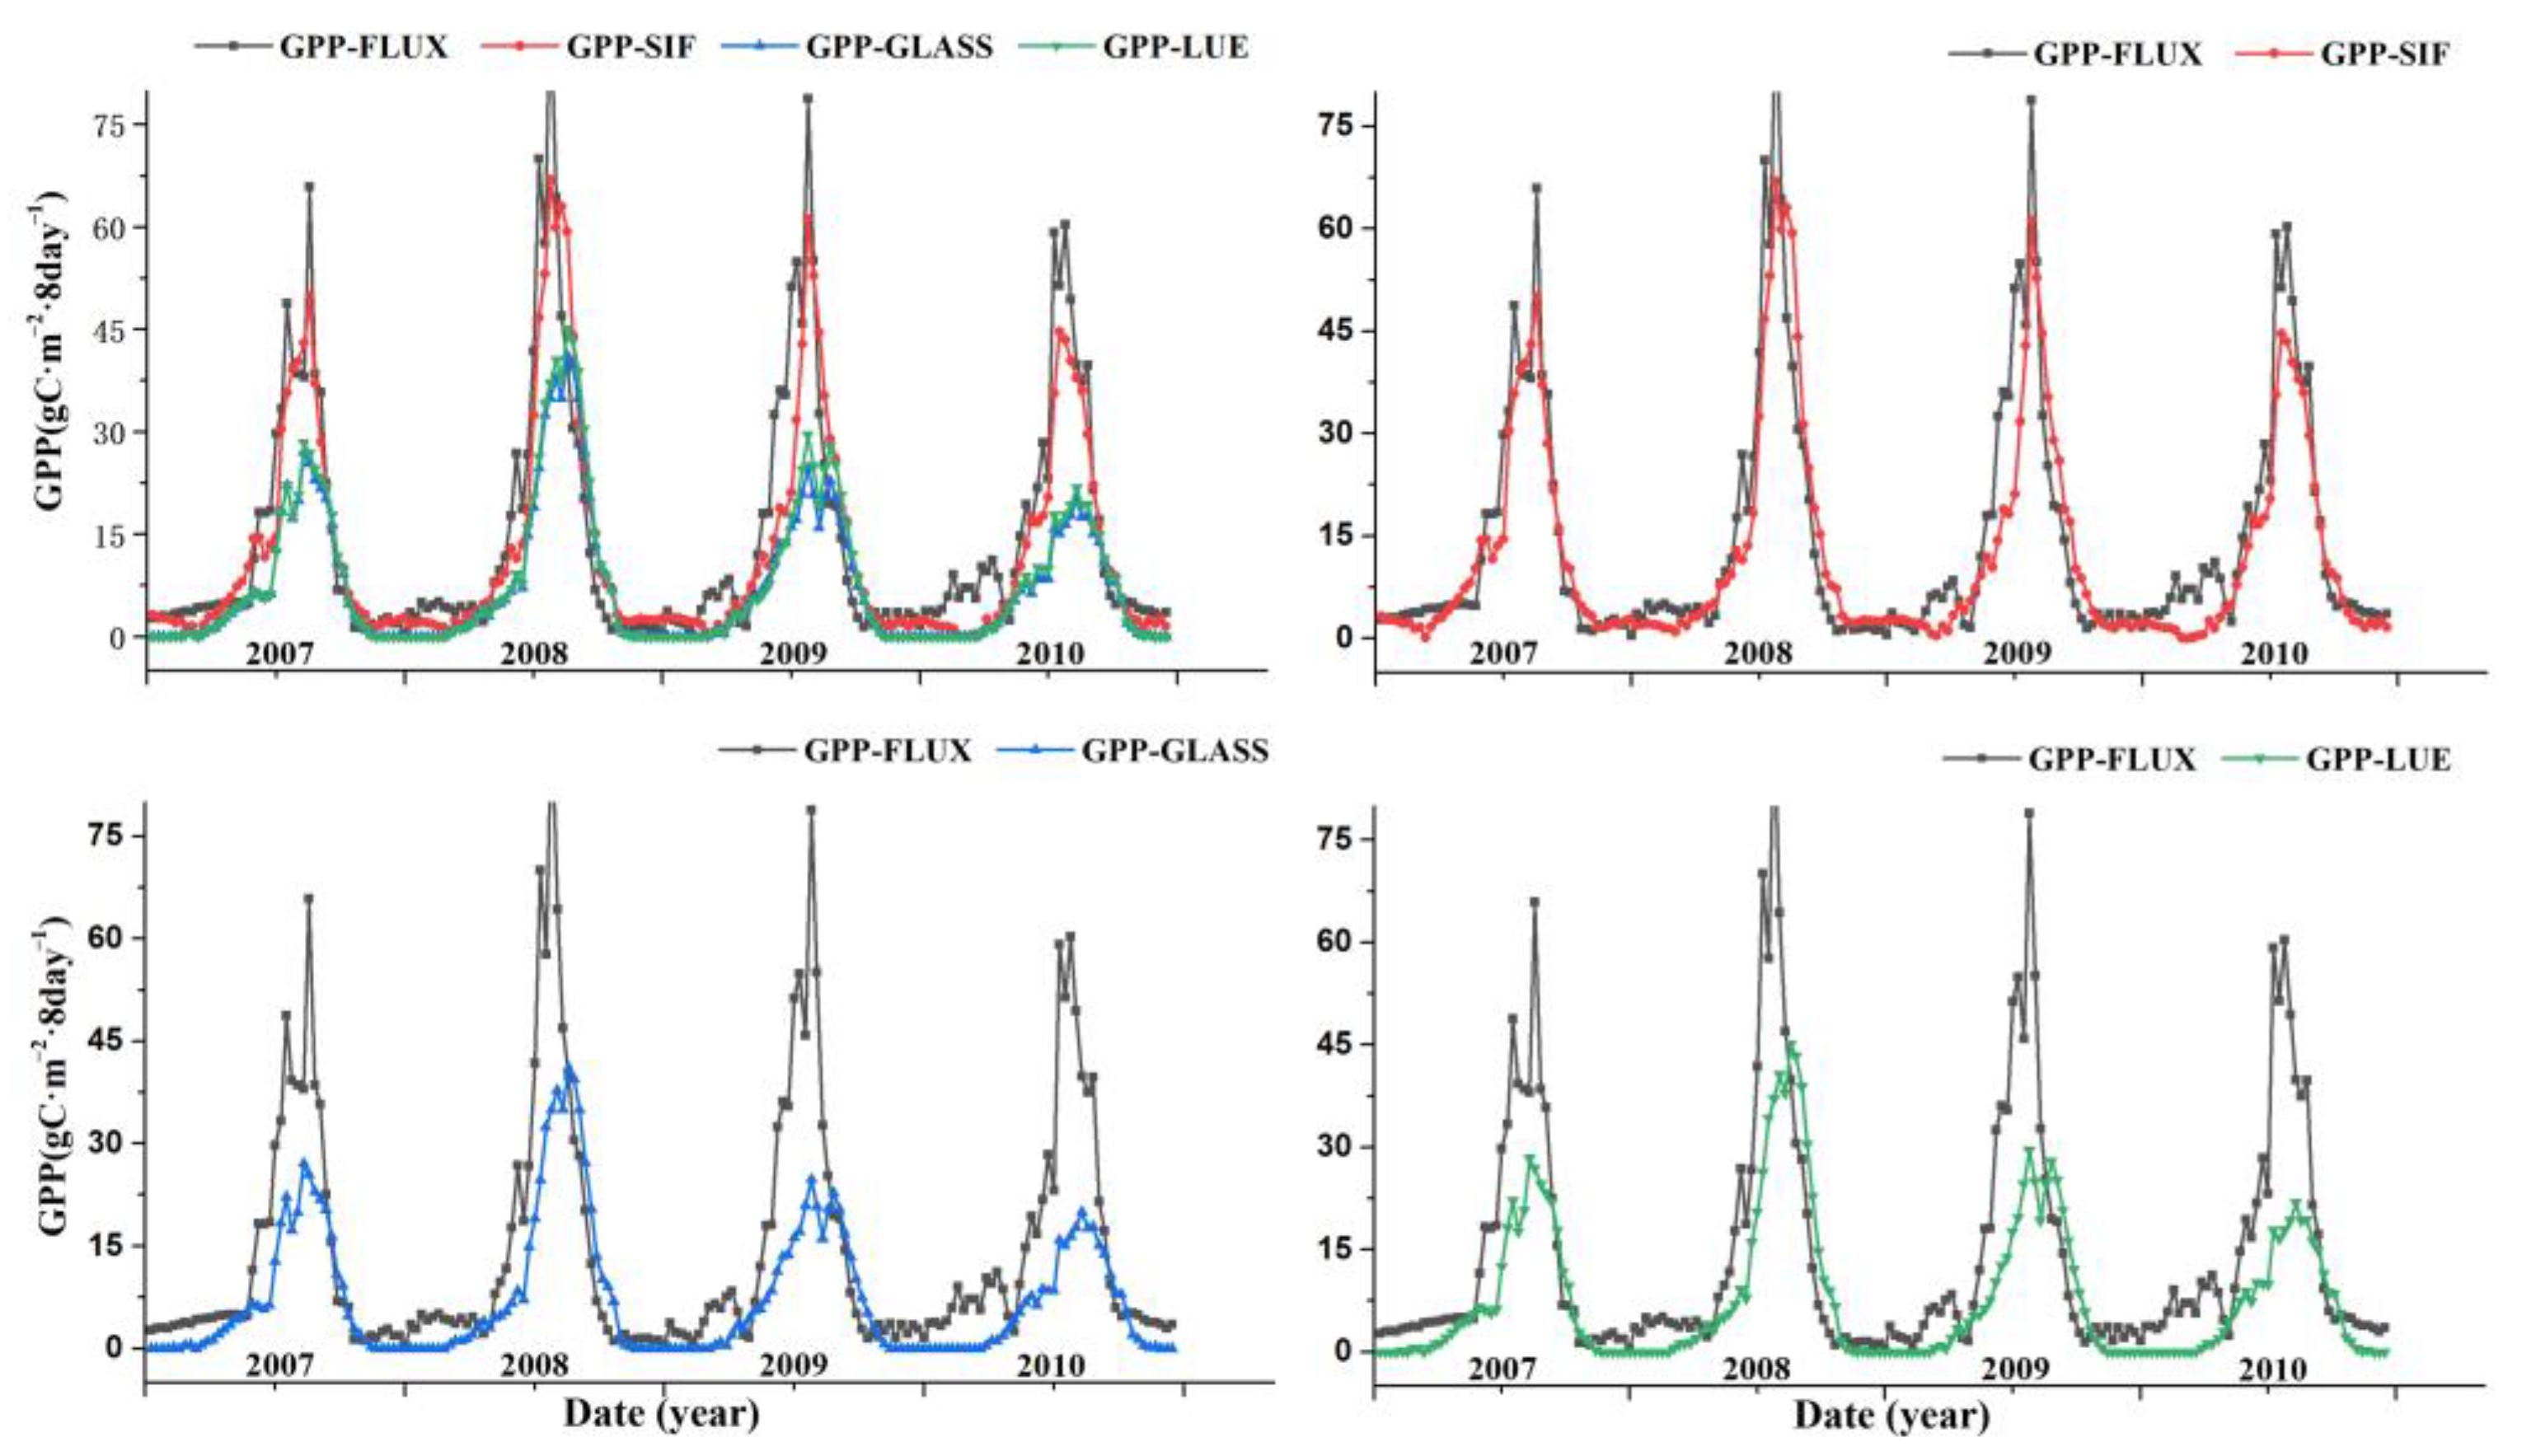
3.2. GPPSIF Has Better Accuracy Than Other GPP Products

According to Section 3.1, it is known that the correlation between SIF and drought index is higher, so this study estimates GPP in Yunnan Province based on SIF data to study the effect of drought on GPP. We simulated GPP in Yunnan Province from 2003 to 2018 at 8-day, monthly and annual scales based on SIF data, vegetation type data, and GPP flux site data, etc. Although there are many SIF-based GPP products [29], most of these products are global in scope, and this article only studies a small area on the southwestern border of China, so the applicability and accuracy may be not good. In addition, most current GPP-SIF products do not eliminate the effects of vegetation canopy. We use the SIF data that eliminate the influence of the canopy to estimate the GPP.
We first validated the accuracy of the three GPPs using the 2007–2010 Changling flux data (only the 2007–2010 flux data were found at this site so far) that were not involved in the calculation of the GPP-SIF fit coefficients (Figure 6), and found that GPPSIF, GPPGLASS and GPPLUE all had better accuracy, but GPPSIF had the highest R2 of 0.83.
To further verify the accuracy of the three GPPs, we also compared the variation in the three products (Figure 7). We found that the change trends of GPPSIF and GPP flux observations were extremely similar, and although the estimated values were slightly higher in drought years (2009 and 2010), the difference was small. The hysteresis effect of GPPGLASS is obvious, and the response to seasonal changes is sluggish; GPPLUE values are generally low and differ greatly from the measured values. The RMSE of the three products during the non-drought (2007–2008) and drought (2009–2010) periods were 4.97 gC·m−2·8day−1, 6.09 gC·m−2·8day−1, 6.54 gC·m−2·8day−1 and 5.28 gC·m−2·8day−1, 5.65 gC·m−2·8day−1, 5.92 gC·m−2·8day−1, the smallest and more stable RMSE values for GPPSIF. In addition, we found that GPPGLASS and GPPLUE had smaller RMSE values in the drought period than in the non-drought period.
Furthermore, the spatial distribution of the three GPPs (Figure 8) is basically the same, with the Yunling–Yuanjiang valley as the boundary in general. The GPP in the western region is significantly higher than that in the east, showing the blocking effect of the vertical ridge and valley area, with a decreasing trend from the southwest to northeast. There are also differences in the distribution of the three, one is that the mean values are 2042.78 gC·m−2·year−1, 2287.33 gC·m−2·year−1 and 1865.47 gC·m−2·year−1, and the second is that the highest absolute value of the correlation coefficient between GPPSIF and DEM data of Yunnan Province is 0.62 by Pearson correlation analysis, which indicates that the spatial distribution of GPPSIF coincided with the topography to a high degree. The histogram statistics also found that the GPPSIF data values changed more gently, the data distribution was concentrated, and the extreme values accounted for less.
In conclusion, in terms of the correlation, RMSE, and spatial distribution, the GPPSIF simulated in this study is more accurate, which can provide an accurate database for the subsequent analysis of the results.

3.3. Drought Evolution and GPP Response to Drought in Yunnan

3.3.1. sc_PDSI Spatiotemporal Pattern Evolution

According to Figure 9 and Table 2, it can be seen that this massive drought swept through Yunnan in June 2009, peaked in January 2010, gradually subsided in the second half of 2010, and largely returned to normal by March 2011. In June 2009, Western Yunnan and parts of Northeastern Yunnan experienced a slight drought. The drought in July and August from Western Yunnan and Northeastern Yunnan spread to Central Yunnan, and the drought area accounted for about 28.4% of the province. The drought in September and October spread rapidly and gradually spread to the province, and the drought accounted for 88.6%. By December, the province’s drought accounted for 99%. The degree of drought at the border areas of Western Yunnan and parts of South-eastern Yunnan became serious and accounted for about 53.6%. The drought was still very severe by January 2010, with about 63% of the province having an sc_PDSI value below −3, a severe drought situation, except for the three river basins in Northwest Yunnan and near Yuanjiang in Southern Yunnan. In April 2010, the drought started to ease from Northwest Yunnan. In October 2010, except for the drought in Southern Yunnan and some parts of Northeast Yunnan, the drought situation in the rest of the region improved, and the severe drought area dropped to 31.72%. By March 2011, Yunnan Province basically returned to normal.
From the drought recovery, Western and Northwestern Yunnan recovered earlier, basically returning to normal at the end of 2010, with a drought duration of about 16–20 months. Eastern and Central Yunnan recovered later, returning to mild and moderate drought, and drought continued by June 2011, with a duration of about 22–26 months.

3.3.2. GPPSIF Is More Sensitive to Drought Response

To compare the response of the three GPP datasets to drought in Yunnan Province, eight regions evenly distributed throughout the province and with different vegetation types were selected for analysis in this study (Figure 10): Shangri-La (alpine meadow), Dali (coniferous forest), Zhaotong (grassland), Luxi (broadleaf forest), Yuxi (farmland), Jinghong (broadleaf forest), Wenshan (scrub), and Qujing (coniferous forest). Figure 11 and Figure 12a–h show the monthly mean changes of GPPSIF, GPPGLASS, GPPLUE, and drought index sc_PDSI in Yunnan Province and eight regional drought years (2009–2011).
Compared to the other two products, the GPPSIF in Yunnan Province responded more rapidly to drought (Figure 11). The GPPSIF increased normally from March to June (pre-drought period), from 128.72 gC·m−2·month−1 to 222.522 gC·m−2·month−1, and in July (beginning of the drought) the GPPSIF increased slowly, only 8.29 gC·m−2·month−1 more than in June. The GPPSIF started to decrease in August, and fell to 206.07 gC·m−2 in September, while the other two GPPs maintained an upward trend from April to August until September when they started to decline.
It is more obvious from the data of small regions, such as Region 2 (Figure 12b): that GPPSIF increased normally from 124.75 gC·m−2·month−1 to 206.54 gC·m−2·month−1 in March–May 2009, but GPPSIF decreased rapidly after the occurrence of drought in June, almost two months earlier than the normal decline period. Similarly, in several other regions, the GPP decreased rapidly in the same month or within the second month after the strong decrease in sc_PDSI index. Although the reduction in GPP due to the normal decline in vegetation could not be excluded, most areas saw a decline that was 1–2 months earlier than normal. In contrast, GPPGLASS and GPPLUE began to decline only in July and August. In addition, the sc_PDSI index changed around June 2011, GPPSIF showed the same trend of change, indicating that GPPSIF responded better to drought.
The response of GPPSIF to the drought recovery also showed a clear superiority. For example, the drought in Region 3 (Figure 12c) went through the following stages: a slight drought in January 2009, a slowdown in April 2010, and an increase in drought in May 2011. Correspondingly, the GPPSIF increased rapidly to 270.798 gC·m−2·month−1 in June 2010, which was less than the 283.4552 gC·m−2·month−1 in the same period of a normal year; the drought started to worsen in May 2011, and the GPPSIF decreased rapidly in June, dropping by nearly 70 gC·m−2 in September.

3.3.3. Response Characteristics of GPPSIF to Drought

Based on Section 3.3.2, we can understand that the response of GPPSIF to drought is more accurate and faster than the remaining two GPP products. Yet, although GPPSIF responded better to drought than the other two products, we still need to further compare these data between normal and drought periods to assess whether this change accurately reflects the effects of drought. Thus, in order to estimate the value of the effect of drought on GPP (GPPd), we take the monthly average value of GPPSIF in multiple normal years (in this paper we use multi-year monthly averages for 2003, 2004, 2008, 2013, 2014, and 2015) as the benchmark and compare it with the GPPSIF data during the drought period (in this section, we take June 2009 to June 2011 as the drought study period), i.e., GPPd = drought month GPP–normal month GPP. Figure 13 shows the variation in GPPd with drought index sc_PDSI.
Figure 13 shows that the GPPd was 10.285 gC·m−2·month−1 and 8.41 gC·m−2·month−1 in June and July 2009, indicating that at the beginning of the drought, the effects of drought were not significant and the plants could still grow normally. With the aggravation of the drought, sc_PDSI dropped to about −3 and remained stable, and GPPd decreased significantly, with GPPd in November and December 2009 being: −37.64 gC·m−2·month−1 and −42.24 gC·m−2·month−1, respectively, especially in Eastern and Central Yunnan, where there was a larger drop of about −62.52 gC·m−2·month−1. The maximum value of GPPd decline in the province occurred in October 2010: −58.35 gC·m−2·month−1. As the drought gradually eased, the GPPd was 12.26 gC·m−2·month−1 in June 2011, marking the end of the drought in that period. The overall trend of GPPd was in excellent agreement with the drought index (Figure 13). The monthly average values of GPPd in Yunnan Province in 2009, 2010 and 2011 were: −11.37 gC·m−2·month−1, −23.48 gC·m−2·month−1 and −17.92 gC·m−2·month−1, respectively, which corresponded well with the drought index of Yunnan Province in these three years: −1.112, −2.722 and −0.932.
Moreover, we found that GPP decreased rapidly after the onset of drought, but recovered relatively slowly. The monthly average value of GPPd in the province took only six months from the beginning of 10.29 gC·m−2·month−1 to −52.24 gC·m−2·month−1 in the basic drought in the province. In contrast, it took about 11 months when GPPd from −18.71 gC·m−2·month−1 to GPPd almost returned to normal (close to 0). The length of recovery also has spatial variability, with faster recovery in Southwest Yunnan, where only four months were spent in Region 4, and a slower recovery in the lower elevation areas of the river valley in Northwest Yunnan, which were more affected by the drought and took about nine months.
In addition, the response of GPPSIF to drought varies across geographic regions, with most areas in Eastern Yunnan responding rapidly and strongly to drought, Southwestern Yunnan responding slowly to drought and with less impact from it, and alpine areas in Northwestern Yunnan having less drought and some areas with positive GPPd. As shown in Figure 14b, the drought in Northwest Yunnan was mild (sc_PDSI > –1). Most of the remaining areas experienced moderate drought (−3 < sc_PDSI < −2). Severe drought (−4 < sc_PDSI < −3) occurred in Southeast Yunnan, Southwest Yunnan, and the Dali region in Western Yunnan, and extreme drought (sc_PDSI < −4) occurred in a small part of Southeast Yunnan. The highest values of GPPd are mainly located in Region 1 in Northwest Yunnan, Region 6 in East Yunnan, and a small part of Southwest Yunnan (Figure 14a). The distribution area of high values is small, and the average down is only 4.25~24.09 gC·m−2·month−1. Most of the areas are negative values of GPPd. The lowest values of GPPd are mainly located in Chuxiong in Central Yunnan, Zhaotong in Northeast Yunnan, and most of Southeast Yunnan, and the down values in these areas are about −34.79~−78.27 gC·m−2·month−1.
The response characteristics of GPP can be found more intuitively from the small regions analysis. Southwest Yunnan was less affected by drought. For example, Region 4 of Southwest Yunnan began to have a drought in June 2009, when the GPPd was −0.29 gC·m−2·month−1 in July–September (Figure 13), which was still basically the same as the normal period. The monthly average value of GPPd in this region was −20.28 gC·m−2·month−1 throughout the drought period, which was less affected. Region 3 of Western Yunnan started to have a slight drought in January 2009 and the GPPd was only −6.82 gC·m−2·month−1 in July 2009; the sc_PDSI was −1.42 at this time. The monthly mean value of GPPd in Region 3 during the drought was −18.07 gC·m−2·month−1, combined with the severe drought in this region (sc_PDSI in 2009 mean value of −2.14) and GPPd indicates that the drought had little effect on the region.
On the contrary, Region 6 in East Yunnan and Region 8 in Southeast Yunnan experienced severe drought. The monthly average values of GPPd in drought years are −34.74 gC·m−2·month−1 and −63.22 gC·m−2·month−1, respectively, which are significantly higher than the monthly average value of GPPd in the province −23.31 gC·m−2·month−1. This was especially evident in Region 8, where GPPd reached 21.58% of the monthly GPP mean value, indicating that this area responds strongly to drought. Meanwhile, Region 5, located in Eastern Yunnan, responded to drought in June 2009 when drought conditions worsened (the sc_PDSI monthly mean value of −3) although the GPPd decline value was relatively small, with a GPPd monthly mean value of −26.08 gC·m−2·month−1. As for Region 1 in Northwest Yunnan, the mean value of GPPd from 2009 to 2011 was 1488.63 gC·m−2·month−1, which was higher than the mean value of 1392.48 gC·m−2·month−1 in previous years, indicating that drought promoted the photosynthesis of vegetation in this region.
Figure 15 shows the scatter plot of the raster values of the two plots in Figure 14, with the horizontal axis representing the mean value of sc_PDSI and the vertical axis representing the total value of GPPd. We found that the coefficient of determination R2 between GPPd and sc_PDSI was 0.46, indicating that GPPSIF responded in some degree to the drought.

4. Discussion

4.1. Sensitivity Analysis of SIF, EVI, NDVI to Drought

Figure 4 shows the correlation between SIF, EVI and NDVI at multiple sites and sc_PDSI during peak growth. The correlation between SIF and sc_PDSI was higher than that between EVI and NDVI at all sites observed, due to the significant time-lag effect between reflectance-based vegetation indices and water stress [4] and has been widely discussed. In addition, it is worth noting that EVI and NDVI were significantly and positively correlated with sc_PDSI in most areas of Southwest Yunnan, mainly because continuous drought exacerbates the reduction in forest greenness and is more pronounced in evergreen broadleaf forests [30]. Vegetation indices, such as EVI and NDVI, are only sensitive to changes in canopy structure and pigment concentration, and they are not directly related to photosynthesis [7], but SIF is directly related to photosynthesis, so the decrease in photosynthesis due to drought stress is expected to be more accurately reflected by SIF.
In addition, Figure 4 shows that the correlation between SIF and sc_PDSI is different in different regions, and the R2 of SIF and sc_PDSI in the Lijiang region is 0.52, which is lower than the R2 of the other three sites, probably because the Lijiang site is close to Yulong Snow Mountain, with an elevation that is 2700 m higher than the rest of the sites. The average annual temperature is lower by about 11 °C. The effect of drought is limited because evaporation is relatively small and moisture is relatively abundant. The highest correlation is in Zhaotong because the Zhaotong site is close to the dry hot valley area, where high temperature and evaporation make moisture a major stressor for the vegetation, and the vegetation cover is low and mainly grasses, scrub, and low trees [31], so it is more sensitive to drought. Similarly, the Wenshan site is mostly scrub, which is more affected by drought, so the correlation is also higher. The vegetation at the Lincang site is lush and mostly trees, meaning that the vegetation has a stronger ability to regulate itself [32], so the response to drought is less sensitive than that at the Zhaotong site. The correlation is in the middle.
The spatial correlation between SIF and sc_PDSI confirms this (Figure 3a). The abundance of water resources and high vegetation cover in Western Yunnan, and the decrease in cloud cover during drought led to an increase in solar radiation, which was favorable for vegetation growth [33]. Therefore, the correlation between SIF and sc_PDSI in some areas of Western Yunnan is negative. In contrast, the vegetation cover in Central and Eastern Yunnan is lower than that in Western Yunnan, and precipitation is relatively low, so the vegetation in this region is more sensitive to drought.

4.2. GPP Accuracy and Spatial Distribution Pattern

Comparing the GPPSIF, GPPGLASS, and GPPLUE products with the flux data of the same period, the RMSE of the three products during non-drought and drought periods are 191.68 gC·m−2·year−1, 325.82 gC·m−2·year−1, 422.90 gC·m−2·year−1 and 230.14 gC·m−2·year−1, 368.07 gC·m−2·year−1, 373.58 gC·m−2·year−1, respectively. The RMSE of GPPSIF is the smallest and very stable. In addition, when the accuracy of the three products was verified with flux data, GPPSIF had the highest R2, reaching 0.81, indicating the superiority and reliability of SIF-based GPP for analyzing the effects of drought.
The GPPSIF is generally close to the other two products in terms of spatial distribution, but the Pearson correlation coefficients with the DEM show that the GPPSIF has the highest spatial agreement with the DEM, reflecting the change in vegetation with topographic gradients. The GLASS product shows high estimates and serious lags in drought years. It is also important to note that the RMSE of the GLASS and LUE-CI product is elevated during drought periods compared to normal periods, mainly due to the fact that the estimated values of the products are similar and generally low both in drought and non-drought years. Therefore, the RMSE is smaller in drought years.
According to Figure 7, the lowest value of GPP is located in Northwestern Yunnan, which is an alpine area on the southeastern edge of the Qinghai–Tibet Plateau with a high altitude. The main vegetation types on the underlying surface are alpine vegetation such as meadows, fir forests, artemisia shrub meadows, etc. Following Northwestern Yunnan are parts of Central and Eastern Yunnan, which are mostly grassland, scrub, and other vegetation with low vegetation cover. The high value areas of GPP are mainly distributed in Xishuangbanna, Southwest Yunnan, which has gentle terrain, low elevation, and is bordered by the Indian Ocean in the south, with abundant precipitation and lush vegetation mostly tropical rainforest. Overall, the differences in water and heat due to the effects of latitude, topography, and altitude, as well as the differences in vegetation types, are important reasons affecting the spatial distribution of vegetation GPP in Yunnan Province.
The estimated GPPSIF results in this paper are consistent with the basic characteristics of the spatial distribution of GPP in Yunnan Province in the Chinese region simulated by Zheng et al. [34] and Jiyu Hou et al. [35]. Of course, there will be some variation in any results, and Zheng et al. also concluded that GPP derived from light use efficiency models, machine learning models, and process-based biophysical models all exhibit substantial variation in magnitude and interannual variability on a global scale [34]. Model uncertainty remains a challenge for carbon cycle research, and further improvements in CPP models and methods are needed to improve the accuracy of terrestrial ecosystem GPP estimates in the future.

4.3. Response of GPP to Drought Conditions

The main physiological process affected by drought stress is photosynthesis [36]. GLASS and LUE-CI products are light use efficiency products, and vegetation indices are important input data for light use efficiency models [37], which are only sensitive to changes in canopy structure and pigment concentration and are not directly related to photosynthesis, so the lag effect of GPPGLASS and GPPLUE is significant and the precision is low. In contrast, SIF data are directly related to photosynthesis, and GPPSIF has a clear response advantage for drought monitoring.
The spatial pattern distribution of the monthly average value of GPPd and the drought index sc_PDSI in Yunnan Province from 2009 to 2011 is relatively consistent, and there is a good correspondence in terms of values, indicating that GPPSIF responds well to drought. The response of GPPSIF to drought varies from region to region, with severe drought in Eastern Yunnan. Most of the regions respond to drought rapidly and strongly, and GPPd also decreased significantly. In particular, in Region 8, Southeastern Yunnan, GPPd reached 21.58% of the monthly mean value of GPP. The region is home to severe, stony desertification, mostly grows scrub, and the vegetation demonstrates poor self-regulation, Long-term severe drought causes the vegetation in the region to fail to grow normally and GPP decreases significantly. This is also consistent with the findings of carbon flux observation [38,39], large-scale remote sensing inversion [40,41], and model simulation [3,41], showing that “drought significantly weakens the carbon sink function of ecosystems”. Meanwhile, the smaller decline value of GPPd in Region 5, Eastern Yunnan may be related to the smaller GPP of grassland vegetation itself. Southwest Yunnan responds slowly to drought, and drought has less impact on it. Evergreen broad-leaved forests and tropical rainforests are widely distributed in Southwest Yunnan, with extremely high forest cover and abundant precipitation, so this region is less sensitive to water stress. Although long-term severe drought still causes GPP to decline, GPPd in some areas showed positive values, indicating that drought promoted vegetation growth in these regions, which is consistent with the findings of Saleska et al. [33] based on the MODIS enhanced vegetation index (EVI) for the 2005 drought event in Southwestern Amazonia. Bonal et al. [32] also found that observations from some flux sites indicated that low precipitation and low cloudiness led to more CO2 uptake in tropical forests limited by radiation intensity during drought events.
It is worth noting that the GPPd values in Kunming in Central Yunnan and Qujing in Eastern Yunnan are also positive, which is due to the fact that Kunming is a national garden city, and Qujing is mostly vegetated with farmland, so the vegetation growth in these areas is mainly influenced by human factors, leading to an increase in GPP. The drought is less severe in the alpine areas of Northwest Yunnan, GPPd increases significantly in areas that are 4000 m above sea level, which echoes the negative correlation between SIF and sc_PDSI in some areas of Northwest Yunnan in Section 3.1. Snow and ice cover in high altitude areas and melting snow replenish water during drought, which relieves the hydraulic pressure on vegetation growth [42], coupled with increased solar radiation to promote vegetation photosynthesis. Thus, GPPd increased, indicating that mild drought can promote vegetation growth at high altitudes.
After the drought is relieved, the recovery time of GPP has strong spatial heterogeneity. The fastest recovery is in Southwest Yunnan, which is firstly due to the fact that Southwest Yunnan has lush vegetation and mostly evergreen broad-leaved forests and tropical monsoon rainforests, which are more resilient and recovering to drought stress than other regions [43]. Secondly, the recovery capacity of vegetation will gradually decrease as the drought time continues to intensify [44]. Although the drought in southwest Yunnan is rapid, the duration of severe drought is shorter (about 8 months), thus the recovery of GPP is faster. Zhang et al. [45] also found that the spring drought in 2010 in the southwest border of China reduced the vegetation productivity in spring and early summer in most of Southwest China, but this negative effect did not carry over to the vegetation growth in late summer and autumn. It is worth mentioning that the drought in Eastern Yunnan is severe and lasted the longest, with a severe drought period of more than 15 months, but its GPP recovery time is shorter, with most of the areas basically returning to normal levels in about 5~8 months, probably because the vegetation in Eastern Yunnan is mostly farmland, grassland, and scrub, which is easy to grow and has a faster life cycle. Thus, the vegetation recovers faster. We also found that although the drought situation eased in 2011, the GPP decline value is still higher than in 2009, which may be due to the lag in the impact of fire, insects, diseases, and vegetation death on vegetation productivity due to prolonged drought [46].

5. Conclusions

In this paper, we compared the sensitivity of SIF, EVI and NDVI to drought, estimated GPP in Yunnan Province using SIF data, eddy flux data, vegetation type data, and also analyzed the response of GPP to drought in comparison with two other GPP products (GPPGLASS and GPPLUE). The results show that SIF has a stronger correlation with drought than other vegetation indices. The accuracy of GPP based on SIF is higher, which can capture the whole process of drought impact on vegetation more quickly and accurately. It is an effective indicator of the impact of drought on vegetation. In addition, we also found that Eastern Yunnan responds to drought more rapidly than West Yunnan and the recovery time is short. Southeast Yunnan has the most severe drought and GPPd decreases significantly, while West Yunnan is relatively less affected by drought. The spatial variability of GPP response to drought is mainly determined by the degree and duration of drought, vegetation type, topography, elevation, and human factors.
This extreme drought is a climatic disaster of rapid onset and long duration, the maximum impact of the drought led to a 31.58% reduction in GPP in the province. The vegetation productivity in the vast majority of areas could not be restored to the pre-drought level within one year after the end of the drought. With global warming, extreme drought events will become more frequent. The accurate detection of drought effects on vegetation is important for vegetation conservation, disaster prevention, and mitigation. Moreover, the conclusion of this study about the accurate response of SIF to drought can be used as a case for using SIF as an input parameter in current carbon cycle models. Although this paper only takes Yunnan Province as an example for analysis, the method is also applicable to other regions. There are still many shortcomings in this paper; for example, only one drought index was considered in this study, which is not a completely accurate reflection of drought, and several suitable drought indices should be included to comprehensively assess drought conditions in the future. The accuracy of GPP estimated in this study also needs to be improved; we still need to further improve the GPP estimation model to increase the accuracy of GPP. In addition, this study failed to accurately reflect the values of drought legacy effects of different vegetation communities. Therefore, it can be taken as the main research direction in future studies.

Author Contributions

Conceptualization, C.L. and L.P.; methodology, C.L. and L.P.; software, Y.W. and L.P.; validation, M.Z.; formal analysis, Y.L. and J.C.; investigation, L.L. (Liangliang Li), L.L. (Lihui Liu) and T.D.; writing—original draft preparation, L.P. and C.L.; writing—review and editing, L.P., C.L. and X.W. All authors have read and agreed to the published version of the manuscript.

Funding

This study was financially supported by the National Natural Science Foundation of China (42161058, 41761083).

Institutional Review Board Statement

Not applicable.

Informed Consent Statement

Not applicable.

Data Availability Statement

Not applicable.

Acknowledgments

Not applicable.

Conflicts of Interest

The authors declare that there is no conflict of interest.

References

  1. Beer, C.; Reichstein, M.; Tomelleri, E.; Ciais, P.; Jung, M.; Carvalhais, N.; Rödenbeck, C.; Arain, M.A.; Baldocchi, D.; Bonan, G.B.; et al. Terrestrial Gross Carbon Dioxide Uptake: Global Distribution and Covariation with Climate. Science 2010, 329, 834–838. [Google Scholar] [CrossRef] [PubMed] [Green Version]
  2. Frank, D.; Reichstein, M.; Bahn, M.; Thonicke, K.; Frank, D.; Mahecha, M.; Smith, P.; Velde, M.; Vicca, S.; Babst, F. Effects of climate extremes on the terrestrial carbon cycle: Concepts, processes and potential future impacts. Glob. Chang. Biol. 2015, 21, 2861–2880. [Google Scholar] [CrossRef] [PubMed] [Green Version]
  3. Reichstein, M.; Ciais, P.; Papale, D.; Valentini, R.; Running, S.; Viovy, N.; Cramer, W.; Granier, A.; OGÉE, J.; Allard, V. Reduction of ecosystem productivity and respiration during the European summer 2003 climate anomaly: A joint flux tower, remote sensing and modelling analysis. Glob. Chang. Biol. 2010, 13, 634–651. [Google Scholar] [CrossRef]
  4. Wang, S.; Huang, C.; Zhang, L.; Lin, Y.; Cen, Y.; Wu, T. Monitoring and Assessing the 2012 Drought in the Great Plains: Analyzing Satellite-Retrieved Solar-Induced Chlorophyll Fluorescence, Drought Indices, and Gross Primary Production. Remote Sens. 2016, 8, 61. [Google Scholar] [CrossRef] [Green Version]
  5. Daumard, F.; Champagne, S.; Fournier, A.; Goulas, Y.; Ounis, A.; Hanocq, J.F.; Moya, I. A Field Platform for Continuous Measurement of Canopy Fluorescence. IEEE Trans. Geosci. Remote Sens. 2010, 48, 3358–3368. [Google Scholar] [CrossRef]
  6. Flexas, J.; Escalona, J.M.; Evain, S.; Gulías, J.; Moya, I.; Osmond, C.B.; Medrano, H. Steady-state chlorophyll fluorescence (Fs) measurements as a tool to follow variations of net CO2 assimilation and stomatal conductance during water-stress in C3 plants. Physiol. Plant. 2002, 114, 231–240. [Google Scholar] [CrossRef] [PubMed] [Green Version]
  7. Dobrowski, S.Z.; Pushnik, J.C.; Zarco-Tejada, P.J.; Ustin, S.L. Simple reflectance indices track heat and water stress-induced changes in steady-state chlorophyll fluorescence at the canopy scale. Remote Sens. Environ. 2005, 97, 403–414. [Google Scholar] [CrossRef]
  8. Norton, A.J.; Rayner, P.J.; Koffi, E.N.; Scholze, M.; Wang, Y.P. Estimating global gross primary productivity using chlorophyll fluorescence and a data assimilation system with the BETHY-SCOPE model. Biogeosciences 2018, 16, 3069–3093. [Google Scholar] [CrossRef] [Green Version]
  9. Xin, Q. Construction of Vegetation Drought Stress Index Based on Solar-Induced Chlorophyll Fluorescence. Master’s Thesis, Nanjing University, Nanjing, China, 2019. [Google Scholar]
  10. Mckee, T.B.; Doesken, N.J.; Kleist, J. The Relationship of Drought Frequency and Duration to Time Scales. In Proceedings of the 8th Conference on Applied Climatology, Anaheim, CA, USA, 17–22 January 1993. [Google Scholar]
  11. Roderick, M.L.; Greve, P.; Farquhar, G.D. On the assessment of aridity with changes in atmospheric CO2. Water Resour. Res. 2015, 51, 5450–5463. [Google Scholar] [CrossRef] [Green Version]
  12. Greve, P.; Roderick, M.L.; Ukkola, A.M.; Wada, Y. The aridity Index under global warming. Environ. Res. Lett. 2019, 14, 124006. [Google Scholar] [CrossRef] [Green Version]
  13. Palmer, W.C. Meteorological Drought [R]; Research Paper No. 45; U.S. Department of Commerce, Weather Bureau: Washington, DC, USA, 1965.
  14. Qiang, Z.; Liang, Z.; Xiancheng, C.; Jian, Z. Progresses and Challenges in Drought Assessment and Monitoring. Adv. Earth Sci. 2011, 26, 763–778. [Google Scholar]
  15. Wells, N.; Goddard, S.; Hayes, M.J. A Self-Calibrating Palmer Drought Severity Index. J. Clim. 2004, 17, 2335–2351. [Google Scholar] [CrossRef]
  16. Linlin, S.; Qiang, Z.; Yulong, R.; Yiping, L.; Lanying, H.; Yuanpu, L.; Suping, W. The applicable analysis of PDSI and self_calibrating PDSI drought indices in southwest China. J. Desert Res. 2021, 41, 10. [Google Scholar]
  17. Li, X.; Xiao, J. A Global, 0.05-Degree Product of Solar-Induced Chlorophyll Fluorescence Derived from OCO-2, MODIS, and Reanalysis Data. Remote Sens. 2019, 11, 517. [Google Scholar] [CrossRef] [Green Version]
  18. Qiu, R.; Han, G.; Ma, X.; Xu, H.; Zhang, M. A Comparison of OCO-2 SIF, MODIS GPP, and GOSIF Data from Gross Primary Production (GPP) Estimation and Seasonal Cycles in North America. Remote Sens. 2020, 12, 258. [Google Scholar] [CrossRef] [Green Version]
  19. van der Schrier, G.; Barichivich, J.; Briffa, K.R.; Jones, P.D. A scPDSI-based global data set of dry and wet spells for 1901–2009. J. Geophys. Res. Atmos. 2013, 118, 4025–4048. [Google Scholar] [CrossRef]
  20. Wang, M.; Sun, R.; Zhu, A.; Xiao, Z. Evaluation and Comparison of Light Use Efficiency and Gross Primary Productivity Using Three Different Approaches. Remote Sens. 2020, 12, 1003. [Google Scholar] [CrossRef] [Green Version]
  21. Yuan, W.; Liu, S.; Yu, G.; Bonnefond, J.M.; Chen, J.; Da Vis, K.; Desai, A.R.; Goldstein, A.H.; Gianelle, D.; Rossi, F. Global estimates of evapotranspiration and gross primary production based on MODIS and global meteorology data. Remote Sens. Environ. 2010, 114, 1416–1431. [Google Scholar] [CrossRef] [Green Version]
  22. Accadia, C.; Mariani, S.; Casaioli, M.; Lavagnini, A.; Speranza, A. Sensitivity of Precipitation Forecast Skill Scores to Bilinear Interpolation and a Simple Nearest-Neighbor Average Method on High-Resolution Verification Grids. Weather Forecast. 2003, 133, 129–130. [Google Scholar] [CrossRef]
  23. Pan, C. Extraction and Uncertainty Analysis of Impervious Surface Based on Multisource Remote Sensing Data in Yangtze River Delta, China; East China Normal University: Shanghai, China, 2016. [Google Scholar]
  24. Badgley, G.; Field, C.B.; Berry, J.A. Canopy near-infrared reflectance and terrestrial photosynthesis. Sci. Adv. 2017, 3, e1602244. [Google Scholar] [CrossRef] [Green Version]
  25. Zhou, W. The Spatial-Temporal Dynamic of Grassland Ecosystem Productivity and Its Influence Factors Analysis in China. Ph.D. Thesis, Nanjing University, Nanjing, China, 2014. [Google Scholar]
  26. Kramer, P.J.; Boyer, J.S. Water Relations of Plants and Soils; Academic Press: Cambridge, MA, USA, 1995; Volume 7. [Google Scholar]
  27. Ginestar, C.; Castel, J.R. Responses of young clementine citrus trees to water stress during different phenological periods. J. Pomol. Hortic. Sci. 1996, 71, 551–559. [Google Scholar] [CrossRef]
  28. Teare, I.D.; Peet, M.M. Crop-Water Relations [M]; John Wiley& Sons: New York, NY, USA, 1983. [Google Scholar]
  29. Li, X.; Xiao, J. Mapping Photosynthesis Solely from Solar-Induced Chlorophyll Fluorescence: A Global, Fine-Resolution Dataset of Gross Primary Production Derived from OCO-2. Remote Sens. 2019, 11, 2563. [Google Scholar] [CrossRef] [Green Version]
  30. Hongping, C.; Gensuo, J.; Jinming, F. Continuous drought intensifies reducing forest greenness. In Proceedings of the 2012 National Academic Forum for Doctoral Students in Atmospheric Sciences and the 12th Cross-Strait Youth Symposium, Beijing, China, 6 December 2012. [Google Scholar]
  31. Huan, D.; Feng, C.; Jinliang, W. Study on the Response Characteristics of Vegetation to Drought in Central Yunnan Based on SPEI Index. Geomat. Spat. Inf. Technol. 2020, 43, 51–55. [Google Scholar]
  32. Bonal, D.; Bosc, A.; Ponton, S.; Goret, J.Y.; Burban, B.; Gross, P.; Bonnefond, J.M.; Elbers, J.A.; Longdoz, B.; Epron, D.; et al. Impact of severe dry season on net ecosystem exchange in the Neotropical rainforest of French Guiana. Glob. Chang. Biol. 2008, 14, 1917–1933. [Google Scholar] [CrossRef]
  33. Saleska, S.R.; Didan, K.; Huete, A.R.; Da Rocha, H.R. Amazon Forests Green-Up During 2005 Drought. Science 2007, 318, 612. [Google Scholar] [CrossRef] [Green Version]
  34. Zheng, Y.; Shen, R.; Wang, Y.; Li, X.; Yuan, W. Improved estimate of global gross primary production for reproducing its long-term variation, 1982–2017. Earth Syst. Sci. Data 2020, 12, 2725–2746. [Google Scholar] [CrossRef]
  35. Hou, J.; Zhou, Y.; Liu, Y. Spatial and Temporal Differences of GPP Simulated by Different Satellite-derived LAI in China. Remote Sens. Technol. Appl. 2020, 35, 1015–1027. [Google Scholar]
  36. Chaves, M.M. Effects of Water Deficits on Carbon Assimilation. J. Exp. Bot. 1991, 42, 1–16. [Google Scholar] [CrossRef]
  37. Zheng, Y. Light Use Efficiency Based Gross Primary Productivity Estimation and Uncertainty Analysis. Master’s Thesis, Institute of Remote Sensing and Digital Earth, Chinese Academy of Sciences, Beijing, China, 2017. [Google Scholar]
  38. Schwalm, C.R.; Williams, C.A.; Schaefer, K.; Arneth, A.; Bonal, D.; Buchmann, N.; Chen, J.; Law, B.E.; Lindroth, A.; Luyssaert, S. Assimilation exceeds respiration sensitivity to drought: A FLUXNET synthesis. Glob. Chang. Biol. 2010, 16, 657–670. [Google Scholar] [CrossRef]
  39. Huang, K.; Wang, S.; Zhou, L.; Wang, H.; Liu, Y.; Yang, F. Effects of drought and ice rain on potential productivity of a subtropical coniferous plantation from 2003 to 2010 based on eddy covariance flux observation. Environ. Res. Lett. 2013, 8, 035021. [Google Scholar] [CrossRef] [Green Version]
  40. Zhao, M.; Running, S.W. Drought-induced reduction in global terrestrial net primary production from 2000 through 2009. Science 2010, 329, 940. [Google Scholar] [CrossRef] [PubMed] [Green Version]
  41. Zscheischler, J.; Mahecha, M.D.; Von Buttlar, J.; Harmeling, S.; Jung, M.; Rammig, A.; Randerson, J.T.; Schölkopf, B.; Seneviratne, S.I.; Tomelleri, E. A few extreme events dominate global interannual variability in gross primary production. Environ. Res. Lett. 2014, 9, 035001. [Google Scholar] [CrossRef] [Green Version]
  42. Li, P.; Sayer, E.J.; Jia, Z.; Liu, W.; Wu, Y.; Yang, S.; Wang, C.; Yang, L.; Chen, D.; Bai, Y.; et al. Deepened winter snow cover enhances net ecosystem exchange and stabilizes plant community composition and productivity in a temperate grassland. Glob. Chang. Biol. 2020, 26, 3015–3027. [Google Scholar] [CrossRef] [PubMed]
  43. Liang, W.; Yang, Y.; Fan, D.; Guan, H.; Zhang, T.; Long, D.; Zhou, Y.; Bai, D. Analysis of spatial and temporal patterns of net primary production and their climate controls in China from 1982 to 2010. Agric. For. Meteorol. 2015, 204, 22–36. [Google Scholar] [CrossRef]
  44. Sperry, J.S.; Love, D.M. What plant hydraulics can tell us about responses to climate-change droughts. New Phytol. 2015, 207, 14. [Google Scholar] [CrossRef] [PubMed]
  45. Zhang, L.; Xiao, J.; Li, J.; Wang, K.; Lei, L.; Guo, H. The 2010 spring drought reduced primary productivity in southwestern China. Environ. Res. Lett. 2012, 7, 045706. [Google Scholar] [CrossRef] [Green Version]
  46. Seidl, R.; Klonner, G.; Rammer, W.; Essl, F.; Moreno, A.; Neumann, M.; Dullinger, S. Invasive alien pests threaten the carbon stored in Europe’s forests. Nat. Commun. 2018, 9, 1626. [Google Scholar] [CrossRef] [PubMed]
Figure 1. Overview map of Yunnan Province, China.
Remotesensing 14 01509 g001
Figure 2. Distribution of monthly average values in Yunnan Province from 2009 to 2011: (a) SIF; (b) EVI; (c) NDVI; (d) sc_PDSI.
Remotesensing 14 01509 g002
Figure 3. Correlation distribution of monthly average values in Yunnan Province from 2009 to 2011: (a) sc_PDSI & SIF; (b) sc_PDSI & EVI; (c) sc_PDSI & NDVI. (The numbers below the title are the range of values for this raster plot and the mean value).
Remotesensing 14 01509 g003
Figure 4. Percentage of SIF, EVI, NDVI and sc_PDSI significance tests in Yunnan Province, 2009–2011.
Remotesensing 14 01509 g004
Figure 5. Scatter chart of SIF, NDVI, and EVI with sc_PDSI at the Yunnan sites.
Remotesensing 14 01509 g005
Figure 6. GPP accuracy verification. (a) accuracy verification of GPPSIF and flux observations; (b) accuracy verification of GPPGLASS and flux observations; (c) accuracy verification of GPPLUE and flux observations.
Remotesensing 14 01509 g006
Figure 7. Comparison of GPPSIF, GPPGLASS, GPPLUE, and GPP FLUX data from 2007–2010.
Remotesensing 14 01509 g007
Figure 8. Spatial distribution of GPPSIF data and the other two products data in 2009. (a) GPPSIF; (b) GPPGLASS; (c) GPPLUE. (The numbers below the title are the range of values for this raster plot).
Remotesensing 14 01509 g008
Figure 9. Spatial distribution of monthly average values of sc_PDSI from 2009 to 2011.
Remotesensing 14 01509 g009
Figure 10. Typical regional distribution in Yunnan Province.
Remotesensing 14 01509 g010
Figure 11. Changes in the three types of GPP and sc_PDSI in Yunnan Province, 2009–2011.
Remotesensing 14 01509 g011
Figure 12. Changes in the three GPPs and sc_PDSI in typical regions of Yunnan Province, 2009–2011. (ah) correspond to the data changes in areas (1)~(8) in Figure 10 respectively.
Remotesensing 14 01509 g012
Figure 13. Changes in GPPd and sc_PDSI, 2009-06–2011-06.
Remotesensing 14 01509 g013
Figure 14. The total value of GPPd and the mean value of sc_PDSI in all months, 2009-06–2011-06. (a) total value of GPPd; (b) mean value of sc_PDSI.
Remotesensing 14 01509 g014
Figure 15. Scatter plot of the total value of GPPd and the mean value of sc_PDSI in all months, 2009-06–2011-06.
Remotesensing 14 01509 g015
Table 1. sc_PDSI Dry and wet grades.
sc_PDSIWet/Dry Gradesc_PDSIWet/Dry Grade
≤−4.00Extreme Drought0.50~0.99Initial wetness
−3.00~−3.99Severe Drought1.00~1.99Slight wetness
−2.00~−2.99Moderate drought2.00~2.99Moderate wetness
−1.00~−1.99Slight drought3.00~3.99Severe wetness
−0.50~−0.99Initial drought≥4.00Extreme wetness
0.49~−0.49Normal
Table 2. Percentage of drought extent in 2009–2010 (according to sc_PDSI classification criteria).
2009-062009-092009-122010-012010-042010-102010-122011-03
Slight wetness16.39%0%0%0%1.41%15.58%15.28%15.71%
Normal67.39%11.42%0.11%0.07%13.92%9.85%16.05%50.78%
Slight drought15.58%63.99%9.99%6.95%7.38%6.12%21.92%29.31%
Moderate drought0.64%23.63%36.30%30.06%15.41%36.73%27.94%4.15%
Severe Drought0%0.96%53.60%62.92%61.88%31.72%18.81%0.05%
Publisher’s Note: MDPI stays neutral with regard to jurisdictional claims in published maps and institutional affiliations.

