Article

Changes in Long-Term PM2.5 Pollution in the Urban and Suburban Areas of China’s Three Largest Urban Agglomerations from 2000 to 2020

1
Aerospace Information Research Institute, Chinese Academy of Sciences, Beijing 100094, China
2
Zhongke Langfang Institute of Spatial Information Applications, Langfang 065001, China
3
State Key Laboratory of Resources and Environment Information System, Institute of Geographic Sciences and Natural Resources Research, Chinese Academy of Sciences, Beijing 100101, China
4
North China Institute of Aerospace Engineering, Langfang 065000, China
5
Spatial Sciences Institute, Dornsife College of Letters, Arts, and Sciences, University of Southern California, Los Angeles, CA 90089, USA
*
Author to whom correspondence should be addressed.
Remote Sens. 2022, 14(7), 1716; https://doi.org/10.3390/rs14071716
Submission received: 21 February 2022 / Revised: 23 March 2022 / Accepted: 30 March 2022 / Published: 2 April 2022

Abstract

:
Particulate matter (PM2.5) is a significant public health concern in China, and the Chinese government has implemented a series of laws, policies, regulations, and standards to improve air quality. This study documents the changes in PM2.5 and evaluates the effects of industrial transformation and clean air policies on PM2.5 levels in urban and suburban areas of China’s three largest urban agglomerations, Beijing–Tianjin–Hebei (BTH), the Yangtze River Delta (YRD), and the Pearl River Delta (PRD) based on a new degree of urbanization classification method. We used high-resolution PM2.5 concentration and population datasets to quantify the differences in PM2.5 concentrations in urban and suburban areas of these three urban agglomerations. From 2000 to 2020, the urban areas have expanded while the suburban areas have shrunk. PM2.5 concentrations in urban areas were approximately 32, 10, and 7 μg/m3 higher than those in suburban areas from 2000 to 2020 in BTH, YRD, and PRD, respectively. Since 2013, the PM2.5 concentrations in the urban regions of BTH, YRD, and PRD have declined at average annual rates of 7.30, 5.50, and 5.03 μg/m3/year, respectively, while PM2.5 concentrations in suburban areas have declined at average annual rates of 3.11, 4.23 and 4.69 μg/m3/year, respectively. By 2018, all of the urban and suburban areas of BTH, YRD, and PRD satisfied their specific targets in the Air Pollution and Control Action Plan. By 2020, the PM2.5 declines of BTH, YRD, and PRD exceeded the targets by two, three, and four times, respectively. However, the PM2.5 exposure risks in urban areas are 10–20 times higher than those in suburban areas. China will need to implement more robust air pollution mitigation policies to achieve the World Health Organization’s Air Quality Guideline (WHO-AQG) and reduce long-term PM2.5 exposure health risks.

1. Introduction

Air pollution is the leading environmental risk factor globally, and each year around 7 million deaths worldwide are caused by air pollution [1]. Among air pollutants, particulate matter 2.5 (PM2.5) or particles smaller than 2.5 microns in diameter, are considered the most harmful to human health [2,3]. Numerous studies using epidemiological cohorts also highlight that long-term exposure to PM2.5 severely impacts human health and causes respiratory or cardiovascular diseases [4,5]. In China, PM2.5 has been a significant public health concern during the past few decades and ranked fifth among the risk factors of disease burden [6]. To improve air pollution, China’s government has formulated many clean air policies and standards, such as the passage and implementation of the National Ambient Air Quality Standards (GB3096-1996), the Emission Standards of Air Pollutants for Thermal Power Plants (GB1323-2003), the Air Pollution and Control Action Plan [7], and the Thirtieth Five-Year Plan for Eco-Environmental Protection [8]. To assess the effectiveness of the implemented mitigation measures, long-term changes in PM2.5 concentrations are often considered valid response indicators. Therefore, it is of great practical value to study the changing characteristics of PM2.5 in urban agglomerations. Understanding the spatial variation of PM2.5 concentration can not only increase our understanding of the mechanism of air pollution but also provide scientific references for the implementation of targeted control measures [9,10,11].
Urban agglomeration has become a primary form of development in China [12,13]. Urban agglomerations are engines for growing the Chinese economy but are also massive sources of air pollutants. During the last decade, human activities in urban agglomerations have improved material wealth, living standards, while exacerbating air pollution compared to other areas [10]. The three largest urban agglomerations, Beijing–Tianjin–Hebei (BTH), the Yangtze River Delta (YRD), and the Pearl River Delta (PRD), cover 2.8% of the land area, house 18% of China’s residents, and produce 36% of China’s GDP [14]. The Chinese National New-type Urbanization Plan predicted that 52.6% and 60% of China’s population would live in urban settings by 2012 and 2020, respectively [15]. Rapid economic development, urbanization, and industrialization in these three urban agglomerations have led to a deterioration of air quality [16,17].
Many previous studies have examined the spatiotemporal patterns of PM2.5 using limited monitoring data [9,18,19,20,21,22,23,24,25,26]. However, due to the lack of sufficient measurements, especially in suburban areas, it is hard to assess the spatial distribution of PM2.5 and its impact on human wellbeing. To fill this data gap, some researchers have used satellite data to analyze air pollution’s spatiotemporal characteristics [12,27,28,29,30,31,32], and a growing number of studies have explored how urbanization affects PM2.5 concentrations [12,27,28]. For example, Li et al. [33] studied spatiotemporal patterns of particulate matter in the cities of northeast China and their relationship with meteorological parameters. Wu et al. [20] explored the effects of urban landscape patterns on PM2.5. Lou et al. [34] investigated the socio-economic driving factors of PM2.5 in the accumulation stage of air pollution events in the Yangtze River Delta. Chan and Yao [35] connected PM2.5 concentrations with human activities and the surrounding environment. Von Bismarck-Osten et al. [36] showed how human activities generate air pollutant emissions that can result in higher PM2.5 concentrations in urban relative to surrounding areas.
Most of these studies focused on the spillover effects of PM2.5 pollution in the urban agglomerations on surrounding areas. A few studies analyzed the PM2.5 disparities between urban and suburban areas in the urban agglomerations. For example, Zhao et al. [37] studied seasonal and diurnal variations of ambient PM2.5 concentrations in urban and rural environments in Beijing using two ground site observations. They found the annual mean PM2.5 of the urban site is about 30 μg/m3 higher than that of the rural site during the period 2005–2007. Similarly, Lin et al. [38] explored the difference in PM2.5 variations between urban and rural areas over eastern China during the period 2000–2015 and found that urban areas experienced more significant PM2.5 reductions than rural areas during the periods 2000–2005 and 2010–2015 and that average PM2.5 reduction rates were similar in rural and urban areas during the period 2006–2010.
This study documented PM2.5 changes in urban–suburban areas of China’s three major urban agglomerations during the last two decades based on high-resolution satellite data and the effects of industrial transformation and clean air policies in these areas. We used the new degree of urbanization classification [39] to divide the aforementioned urban agglomerations into urban and suburban areas based on population density. Zhang et al. [40] classified each of the 33 megacities into sparsely, moderately, and densely populated areas based on population density and found that the PM2.5 differences between densely and somewhat populated areas are slight. Therefore, we combined densely and moderately populated areas into one category in this study and classified each urban agglomeration into urban and suburban regions according to urban–suburban population distribution characteristics in China’s major urban agglomerations. In addition, we also documented the PM2.5 exposure risk disparities in urban and suburban areas in these three urban agglomerations.

2. Materials and Methods
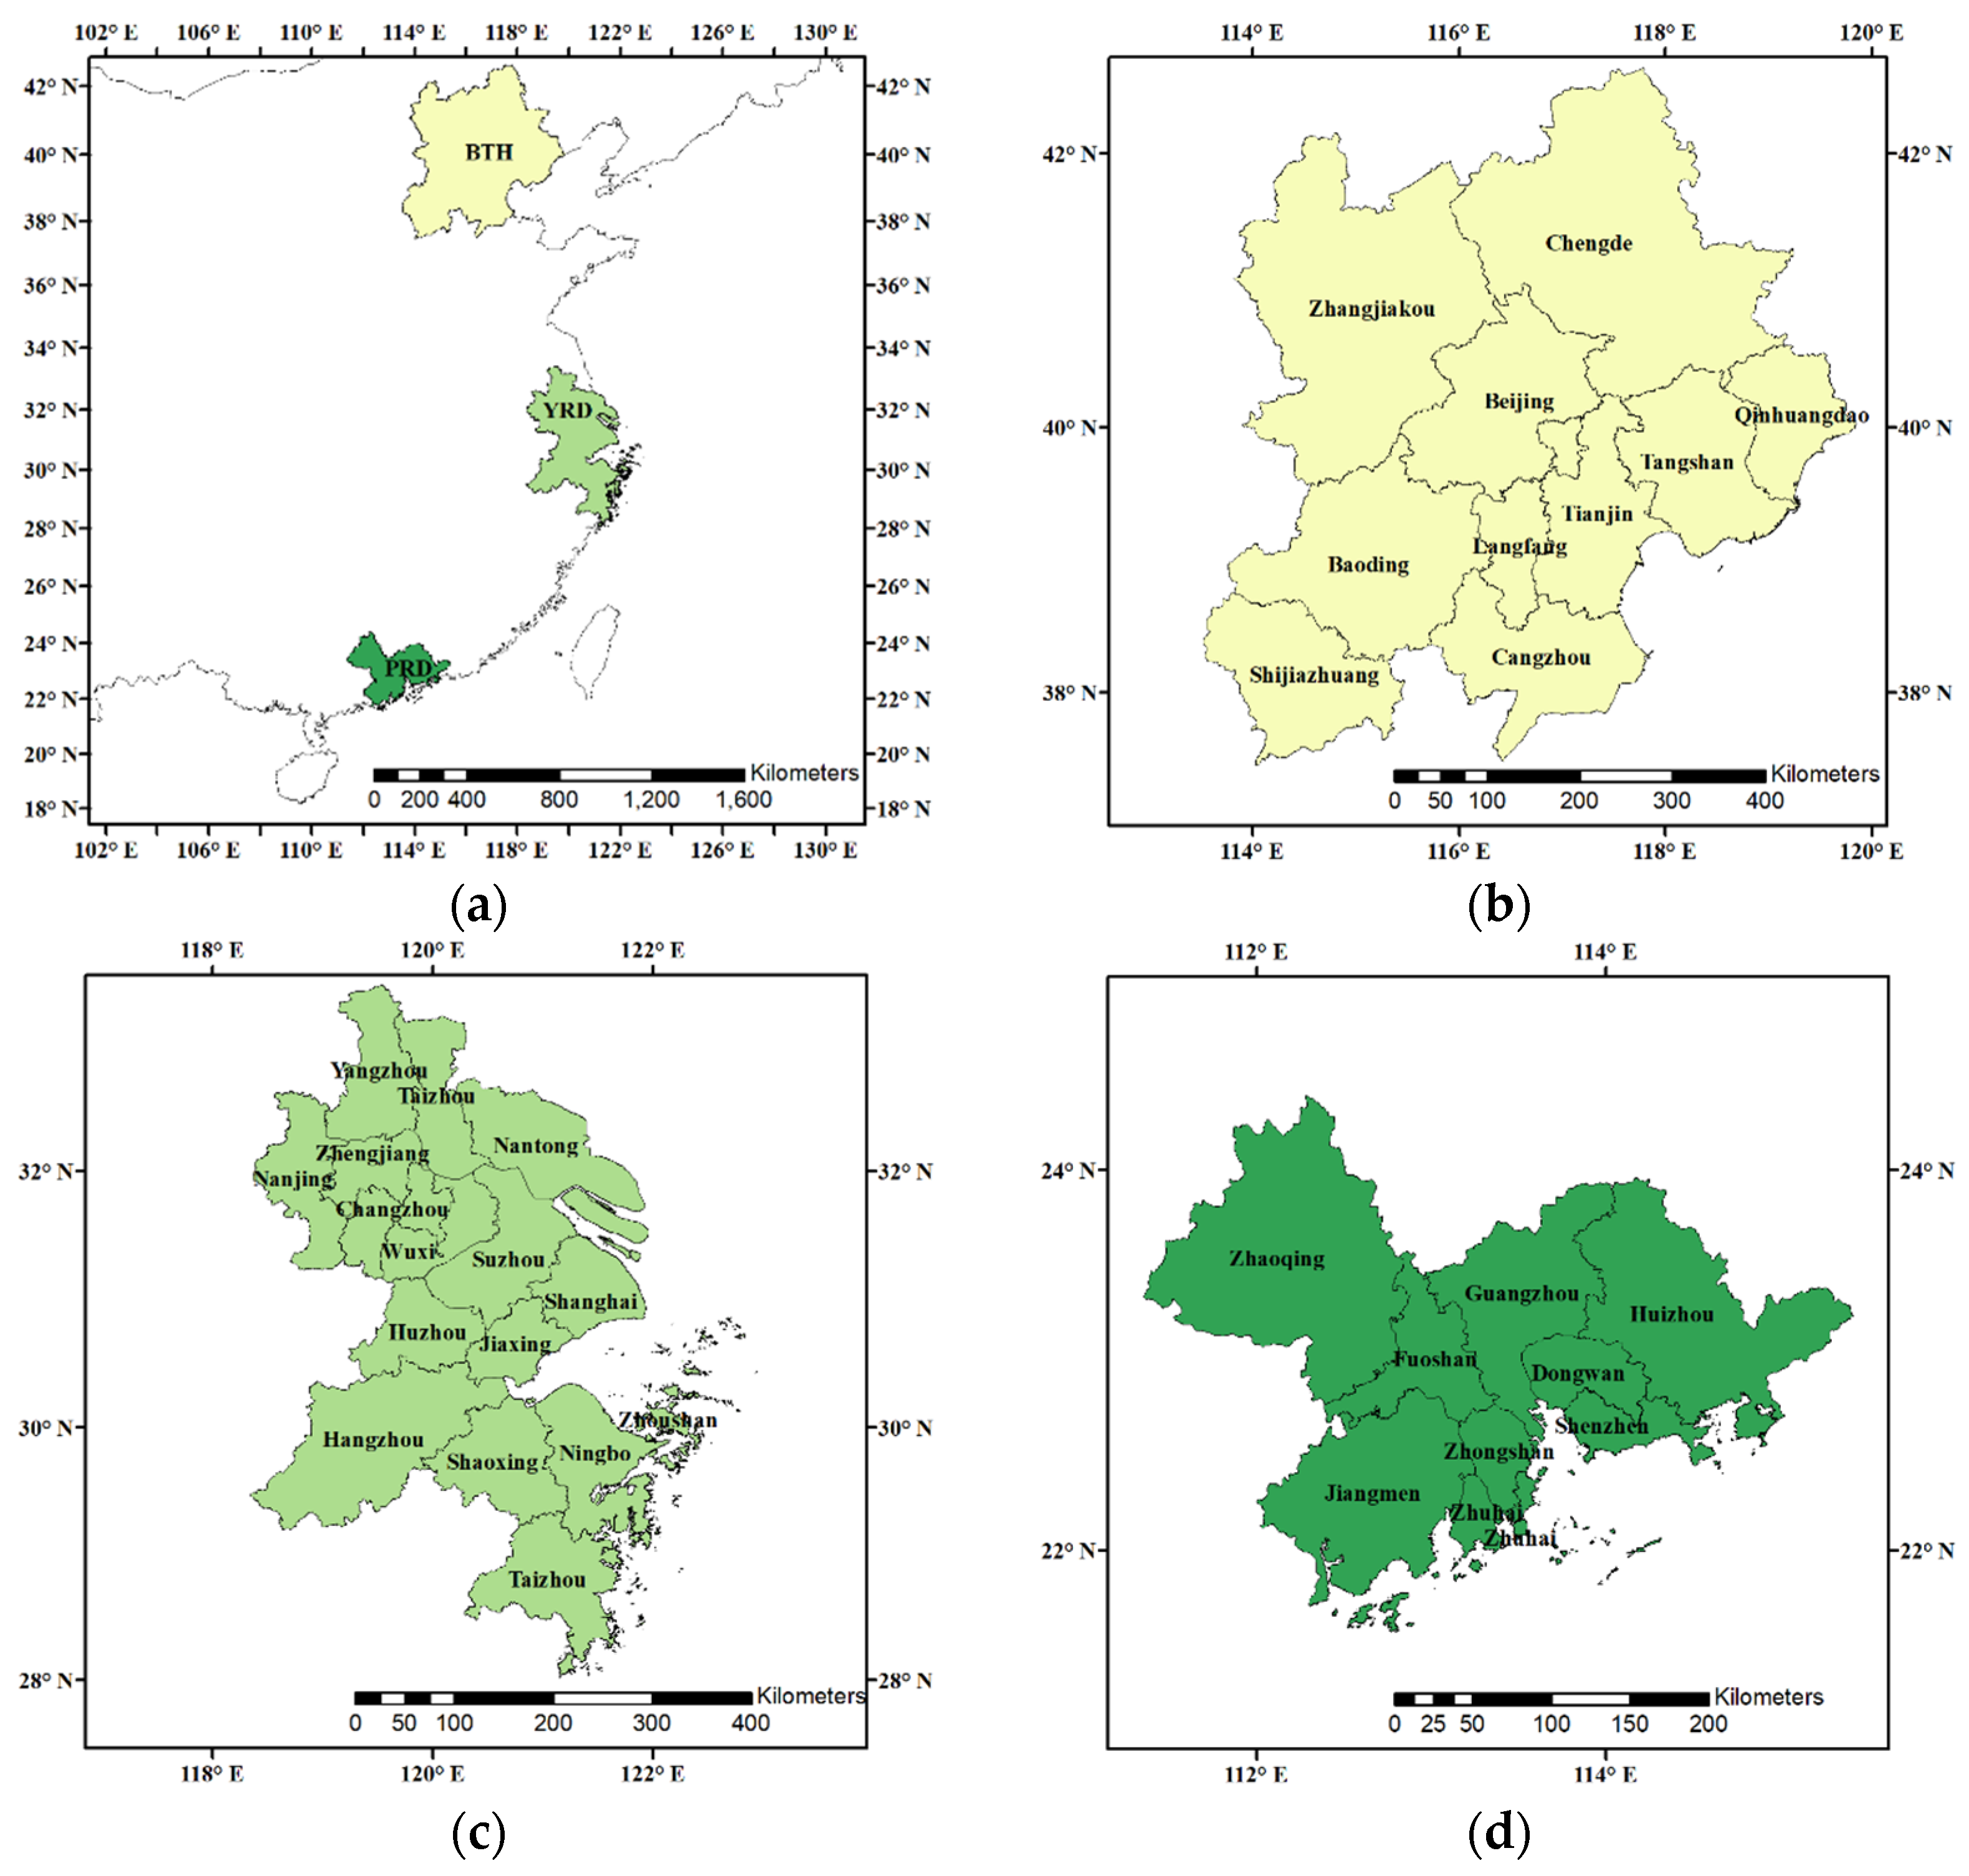
2.1. Study Area

This study focuses on China’s three largest urban agglomerations [12,13]. BTH is the leading innovation center in China. BTH is located in northern China and includes Beijing, Tianjin, and eight cities in Hebei province (Figure 1b). YRD is also a large and very competitive urban agglomeration. YRD is located in eastern China and includes Shanghai plus 15 cities in Zhejiang and Jiangsu provinces (Figure 1c). PRD is the most prosperous and dynamic urban agglomeration in the Asia-Pacific region. PRD is located in southern China and includes nine cities in Guangdong province (Figure 1d).

2.2. Data Sources

The China annual PM2.5 concentration data were acquired from the MODIS/Terra + Aqua MAIAC AOD products and other auxiliaries, such as ground-based measurements, satellite remote sensing products, atmospheric reanalysis, and other simulations, using artificial intelligence by taking into account the spatiotemporal heterogeneity of air pollution. It can be accessed at https://zenodo.org/record/4660858#.YYYdhW1BxPY on 3 June 2021. This dataset provides annual PM2.5 concentrations from 2000 to 2020. We used the MODIS/Terra + Aqua Level 3 data at a spatial resolution of 0.01 degrees that relies on the averaging of the Level 2 daily products. Wei et al. [41] obtained China’s annual PM2.5 concentration data based on the Space–Time Extra-Trees model (STET), which can capture changes in PM2.5 concentration well at different spatiotemporal scales with higher precision. The annual PM2.5 estimates are highly related to ground measurements (R2 = 0.94) and have an average root mean square error of 5.07 μg/m3 [41,42]. These results demonstrate that the data modeled by STET are reliable for monitoring the spatial and temporal variation trends of PM2.5 pollution in China.
Population count and density data were acquired from the NASA Socio-Economic Data and Applications Center. The gridded population of the world dataset in its fourth version [43,44] provides estimates of the human population count and density, consistent with national censuses and population registrations in 2000, 2005, 2010, 2015, and 2020. Using a proportional distribution grid algorithm, approximately 13.5 million country and sub-national administrative units allocated population counts and densities to grid cells. The data files were generated as global rasters with a resolution of 30 arc seconds (about 1 km at the equator). This dataset took advantage of improvements in the availability of census and geographic data to greatly increase the accuracy of this version [44].

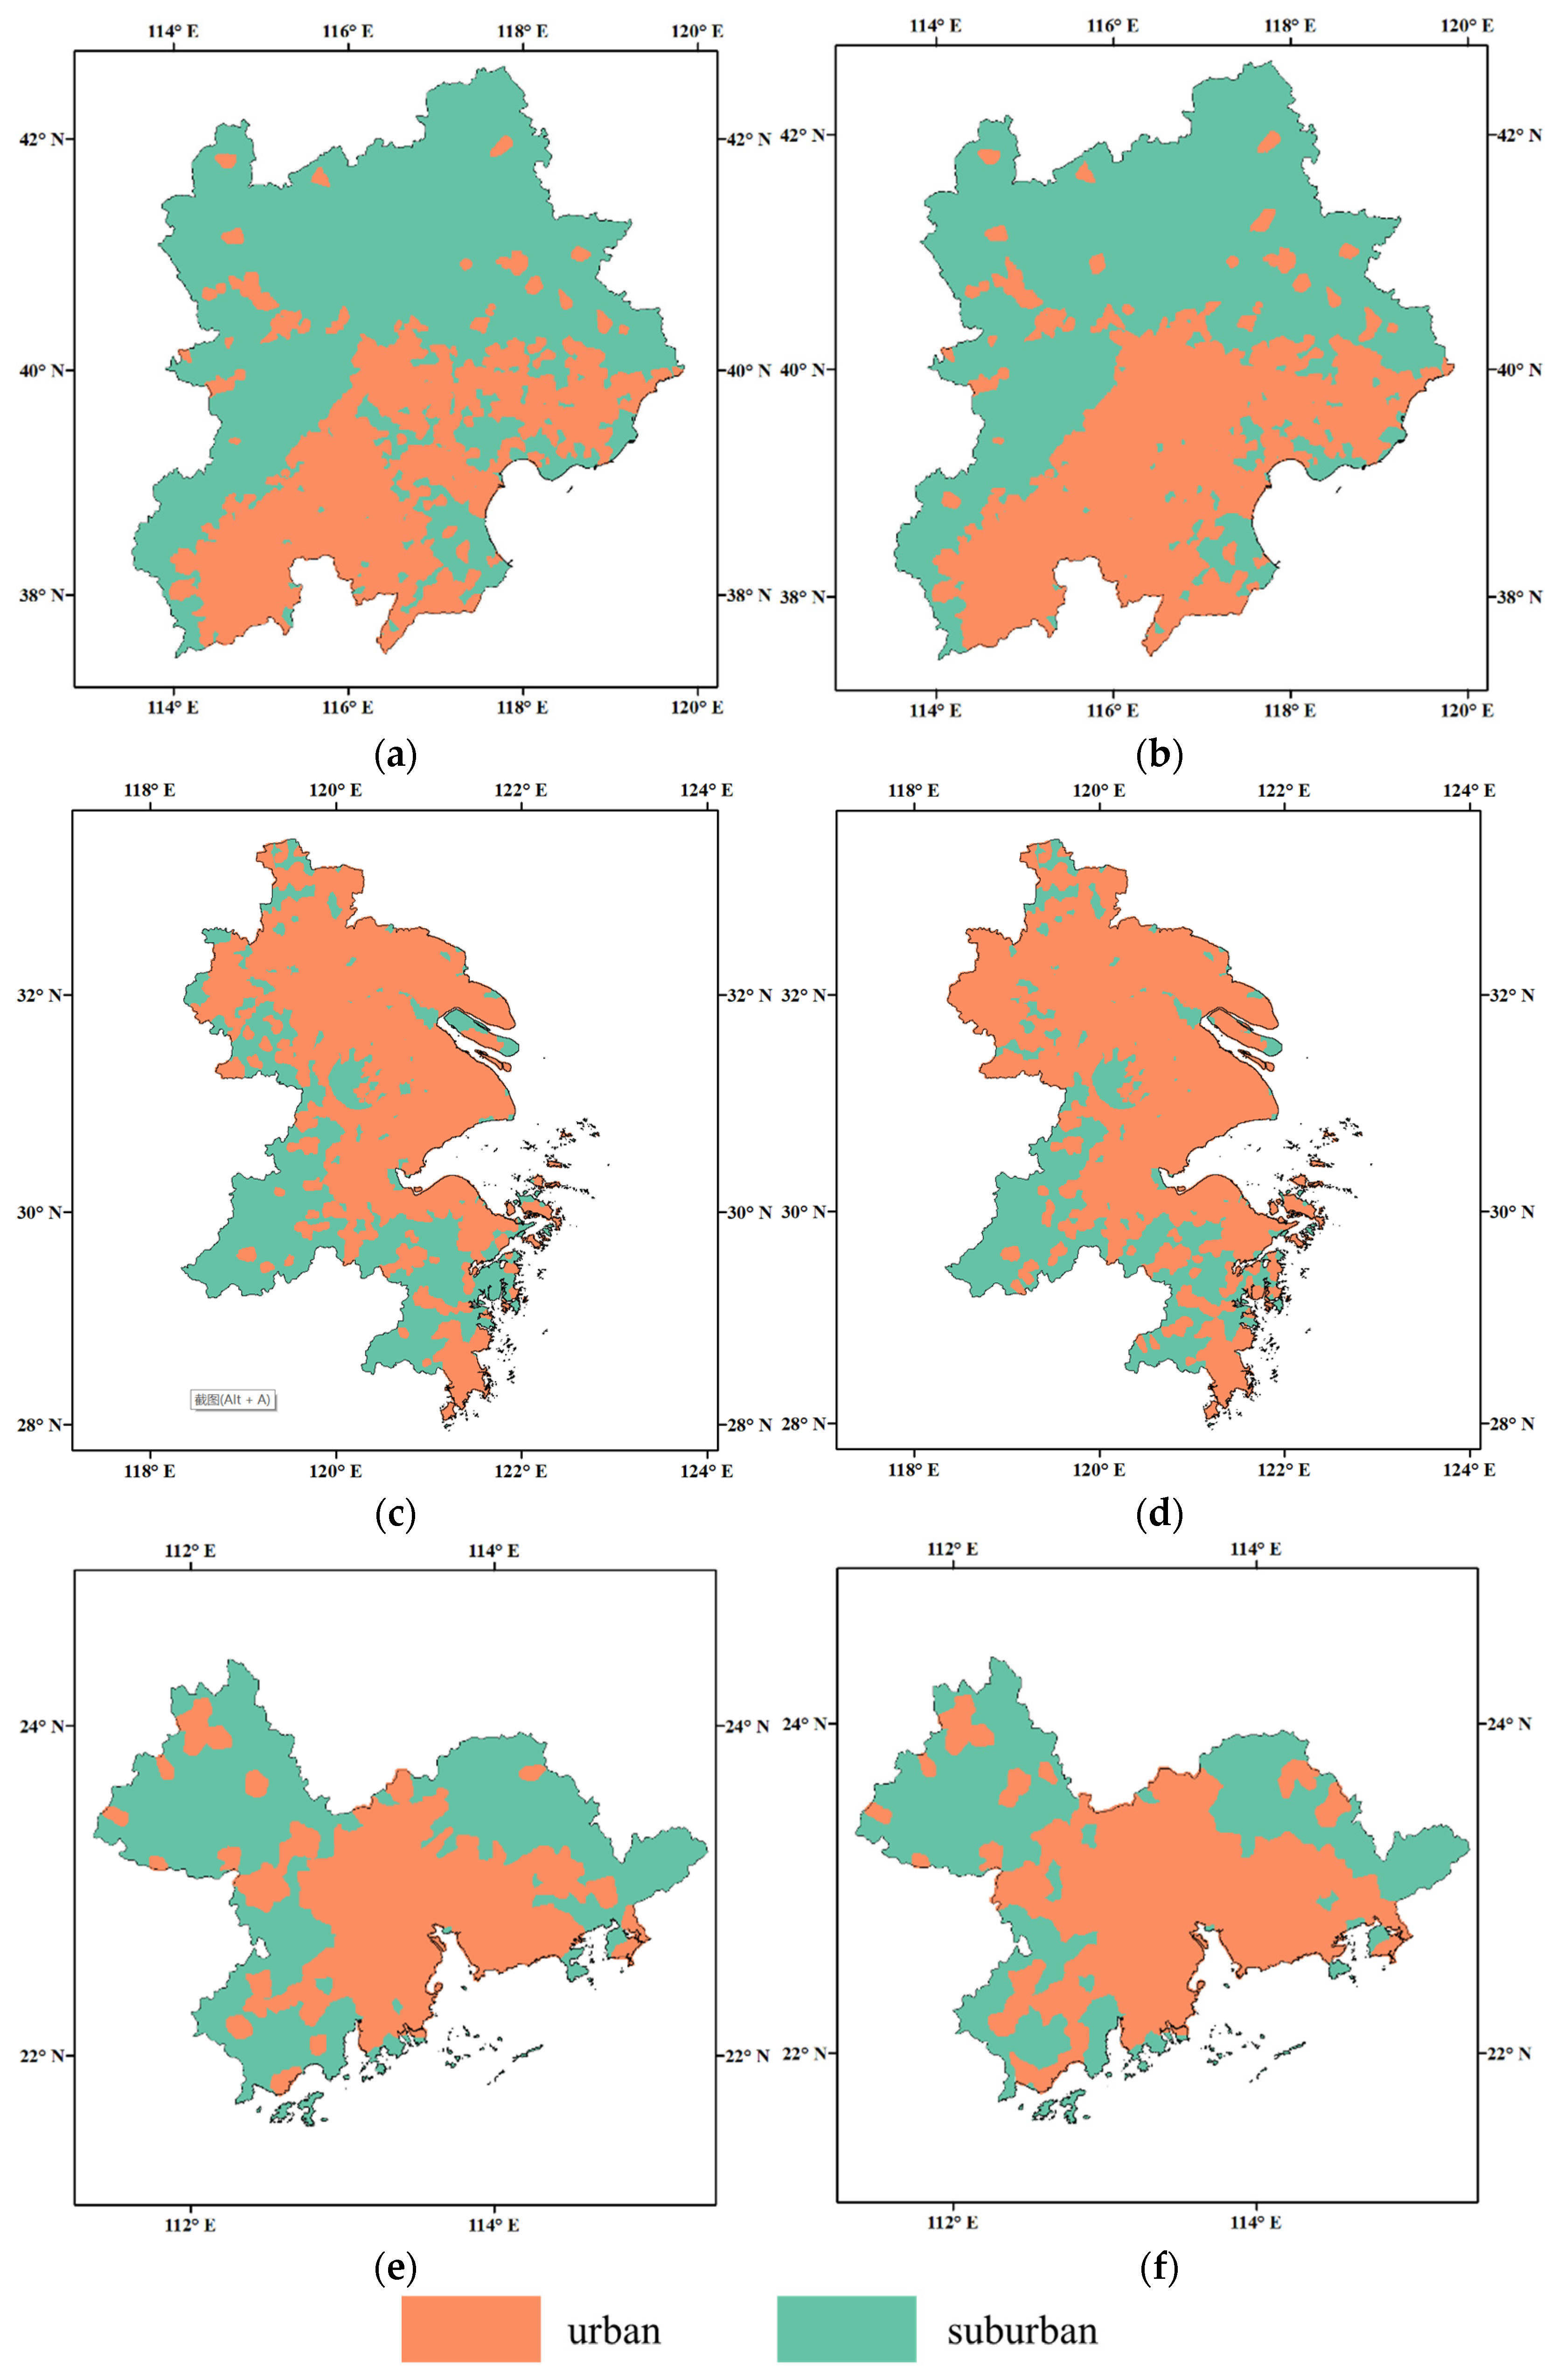
2.3. Classification Method Used to Delineate Urban and Suburban Areas

We used the new degree of urbanization classification [39] to divide the aforementioned urban agglomerations into urban and suburban areas based on population density. It was developed by six international organizations and agencies to facilitate international comparisons and is endorsed by the United Nations Statistical Commission [39]. Urban areas are those clusters of contiguous grid cells with a thickness of at least 300 residents per km2 and a minimum of 5000 people. Suburban areas are those grid cells not included in the urban areas. The chosen threshold was inspired by the size and density thresholds used by the country definitions. Of the 100 countries reporting size thresholds, most use this set of thresholds and this set of thresholds also passed the sensitivity analysis [39]. ArcGIS Pro [45] was used with the population grids to classify China’s three major urban agglomerations into these two degrees (i.e., classes). For the urban areas, we used a threshold of 300 residents per km2 and applied a majority filter with a 3 × 3 moving window to smooth the shape and eliminate small centers. In addition, we converted the raster to polygons and selected the polygons with more than 5000 residents. We then removed the urban areas from the whole urban agglomeration to obtain the suburban areas. The main ArcGIS Pro modules include Extract by mask, Extract by attributes, Raster to polygon, Aggregate polygons, Zonal statistics as a table, Select layer by attribute, and Erase.

2.4. Statistical Analysis Methods

The average change of areas and population in study areas from 2000 to 2020 were calculated as:
C = i = 1 i = n ( v 2000 + 5 × i v 2000 + 5 × ( i 1 ) v 2000 + 5 × ( i 1 ) ) × 100 % / n
where C is the percent change per 5 years from 2000 to 2020, n is 4, and v is the value of areas or population in urban and suburban areas in one specific year.
The average annual PM2.5 change before and after 2013 was calculated as:
Δ = i = 1 i = n U i V i n
where Δ , Δ 1 , and Δ 2 are the annual mean value of the difference between urban and suburban PM2.5 concentrations during 2000–2020, 2000–2013, and 2013–2020, respectively, and U i and V i are the PM2.5 concentrations in urban and suburban areas, respectively.
To track the efficacy of the Air Pollution and Control Action Plan [7] in the three largest agglomerations and whether they varied in urban and suburban areas, we calculated the percent change in PM2.5 concentrations across the whole region as well as the urban and suburban areas of the three largest agglomerations since 2013 using:
D i , j = P j P i P i × 100 %
where D i , j is the percent PM2.5 concentration change from the ith year to the jth year, and P i and P j are the PM2.5 concentration in the ith and jth years.
The mean annual changes in the PM2.5 concentrations in the urban and suburban areas of the three agglomerations during the period 2013–2020 were calculated using:
Δ = i = 1 i = 7 V 2013 + i V 2013 + ( i 1 ) 7
where Δ is yearly average PM2.5 difference during the period 2013–2020, v is the PM2.5 concentration in the ith year since 2013, and i ranges from 1 to 7.

2.5. PM2.5 Exposure Risk

The regional PM2.5 exposure risk [46] used to quantify the PM2.5 exposure risk disparity between urban and suburban areas was calculated as:
R i = P O P i × C i i = 1 n P O P i × C i n
where i refers to the grid number, R i represents the PM2.5 population exposure risk in grid i, P O P i is the exposed population in grid i, C i is the PM2.5 concentration in grid i, and n is the total number of grids in this region.

3. Results

3.1. The Variations of the Extents of Urban and Suburban Areas

We used the new degree of urbanization classification [47] to divide the three major urban agglomerations into urban and suburban areas based on population. The urban and suburban regions of BTH, YRD, and PRD in 2000 and 2020 can be seen in Figure 2. In BTH, the urban area is concentrated in the southeast. In YRD, the urban area is concentrated in the east. In PRD, the urban area is concentrated in the region’s center. From 2000 to 2020, the urban areas have gradually expanded in all three of these urban agglomerations while the suburban areas have shrunk.
We documented the areas and populations in the urban and suburban areas of the three urban agglomerations in 2000, 2005, 2010, 2015, and 2020. We used the WGS 1984 Web Mercator (Auxiliary Sphere) projected coordinate system in ArcGIS Pro 2.8 [45]. ArcGIS Pro (https://www.esri.com/en-us/arcgis/products/arcgis-pro/resources (accessed on 1 February 2022)) is desktop GIS software developed by Esri in United States which is notable in having a 64 bit architecture, combined 2-D, 3-D support, ArcGIS online integration and Python 3 support. In addition, we calculated the average change in the areas and the population from 2000 to 2020 using Equation (1). The results can be seen in Table 1.
From Table 1, we can see that the area of urban regions in these urban agglomerations has grown at an average rate of 3–5% per 5 years from 2000 to 2020, while the suburban areas have been shrinking at an average rate of 2–7% per 5 years. The population of urban regions has increased at an average rate of 11–14% per 5 years from 2000 to 2020, while the number of people in the suburban areas has decreased at an average rate of 0–6% per 5 years. The area and population in the urban regions have expanded while those in the suburban regions have shrunk in these urban agglomerations from 2000 to 2020.

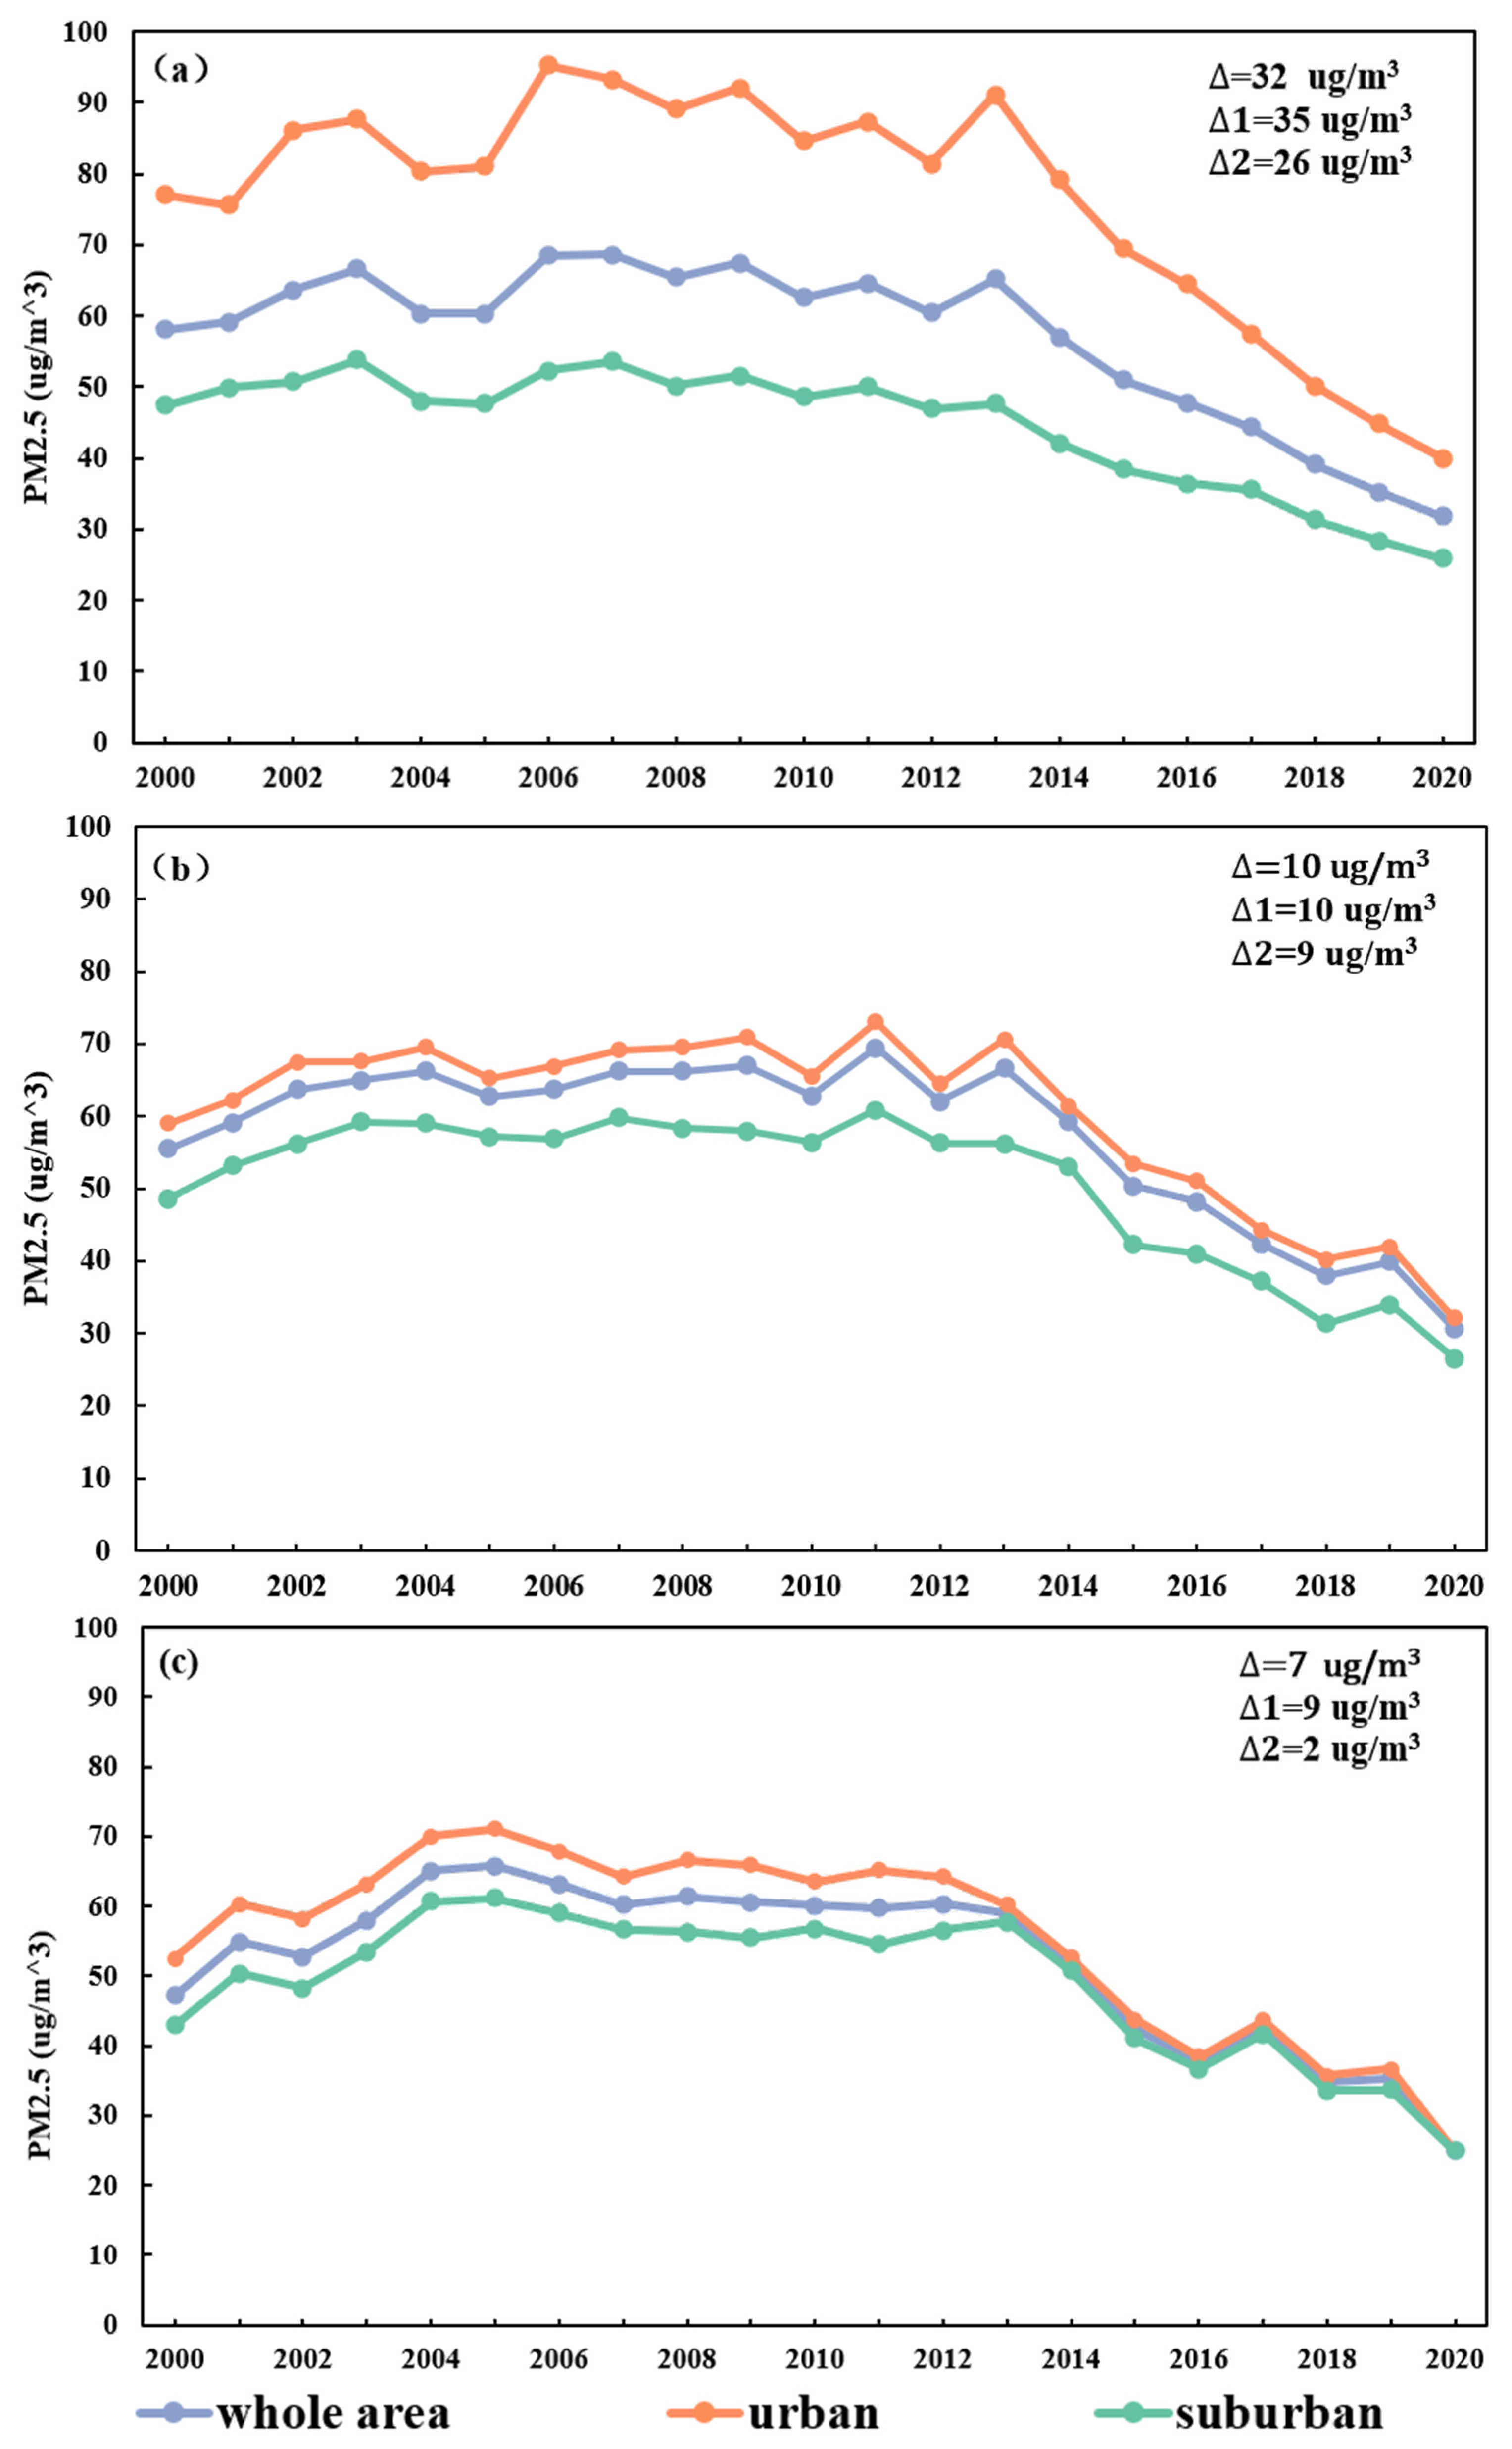
3.2. PM2.5 Disparities between Urban and Suburban Areas

We next calculated PM2.5 concentration variations from 2000 to 2020 in the urban and suburban areas of BTH, YRD, and PRD (Figure 3). From Figure 3, we can see that the range of PM2.5 concentrations in BTH is significantly greater than that in YRD and PRD. In all three urban agglomerations, the changing trend of PM2.5 concentrations in urban and suburban areas from 2000 to 2020 is consistent with that of the entire region. The PM2.5 concentrations in urban areas are higher, and those in suburban areas are lower than the average for the whole of the region in each case. PM2.5 concentrations in the three urban agglomerations showed annual variations but remained high before 2013 and steadily declined from 2013 onwards. The gap between the urban and suburban areas has shrunk, most notably in PRD, since 2013. We used Equation (2) to calculate the average annual change before and after 2013.
In BTH, the highest PM2.5 concentration of 92 μg/m3 occurred in the urban area in 2006, and the lowest PM2.5 concentration of 26 μg/m3 happened in the suburban area in 2020. Before 2013 the PM2.5 difference between urban and suburban areas was 35 μg/m3, and the difference between them after 2013 was 26 μg/m3. In YRD, the highest PM2.5 concentration of 73 μg/m3 occurred in the urban area in 2011, and the lowest PM2.5 concentration of 26 μg/cm3 happened in the suburban area in 2020. Before 2013 the PM2.5 difference between urban and suburban areas was 10 μg/m3, and the difference between them after 2013 was 9 μg/m3. In PRD, the highest PM2.5 concentration of 71 μg/m3 occurred in the urban area in 2005, and the lowest PM2.5 concentration of 25 μg/m3 happened in the suburban area in 2020. Before 2013 the PM2.5 difference between urban and suburban areas was 9 μg/m3, and the difference between them after 2013 was just 2 μg/m3.
During the past 20 years, the range of the maximum and minimum PM2.5 concentrations in BTH was the largest and was the smallest in PRD. After 2013, the disparity of PM2.5 concentration between urban and suburban areas in all the three agglomerations has become smaller, especially in PRD, where the difference is only 2 μg/m3. PM2.5 concentrations in the entire urban and suburban areas, and therefore the three regions as a whole, have dropped dramatically since 2013 because the Chinese government implemented some key air pollution control policies, such as the Air Pollution and Control Action Plan [7] coupled with the relocation or closure of essential industrial plants that have traditionally constituted primary PM2.5 sources in these three urban agglomerations. Therefore, PM2.5 concentrations in China’s three major urban agglomerations have gradually declined, and the disparity between urban and suburban areas has diminished since 2013 as well.

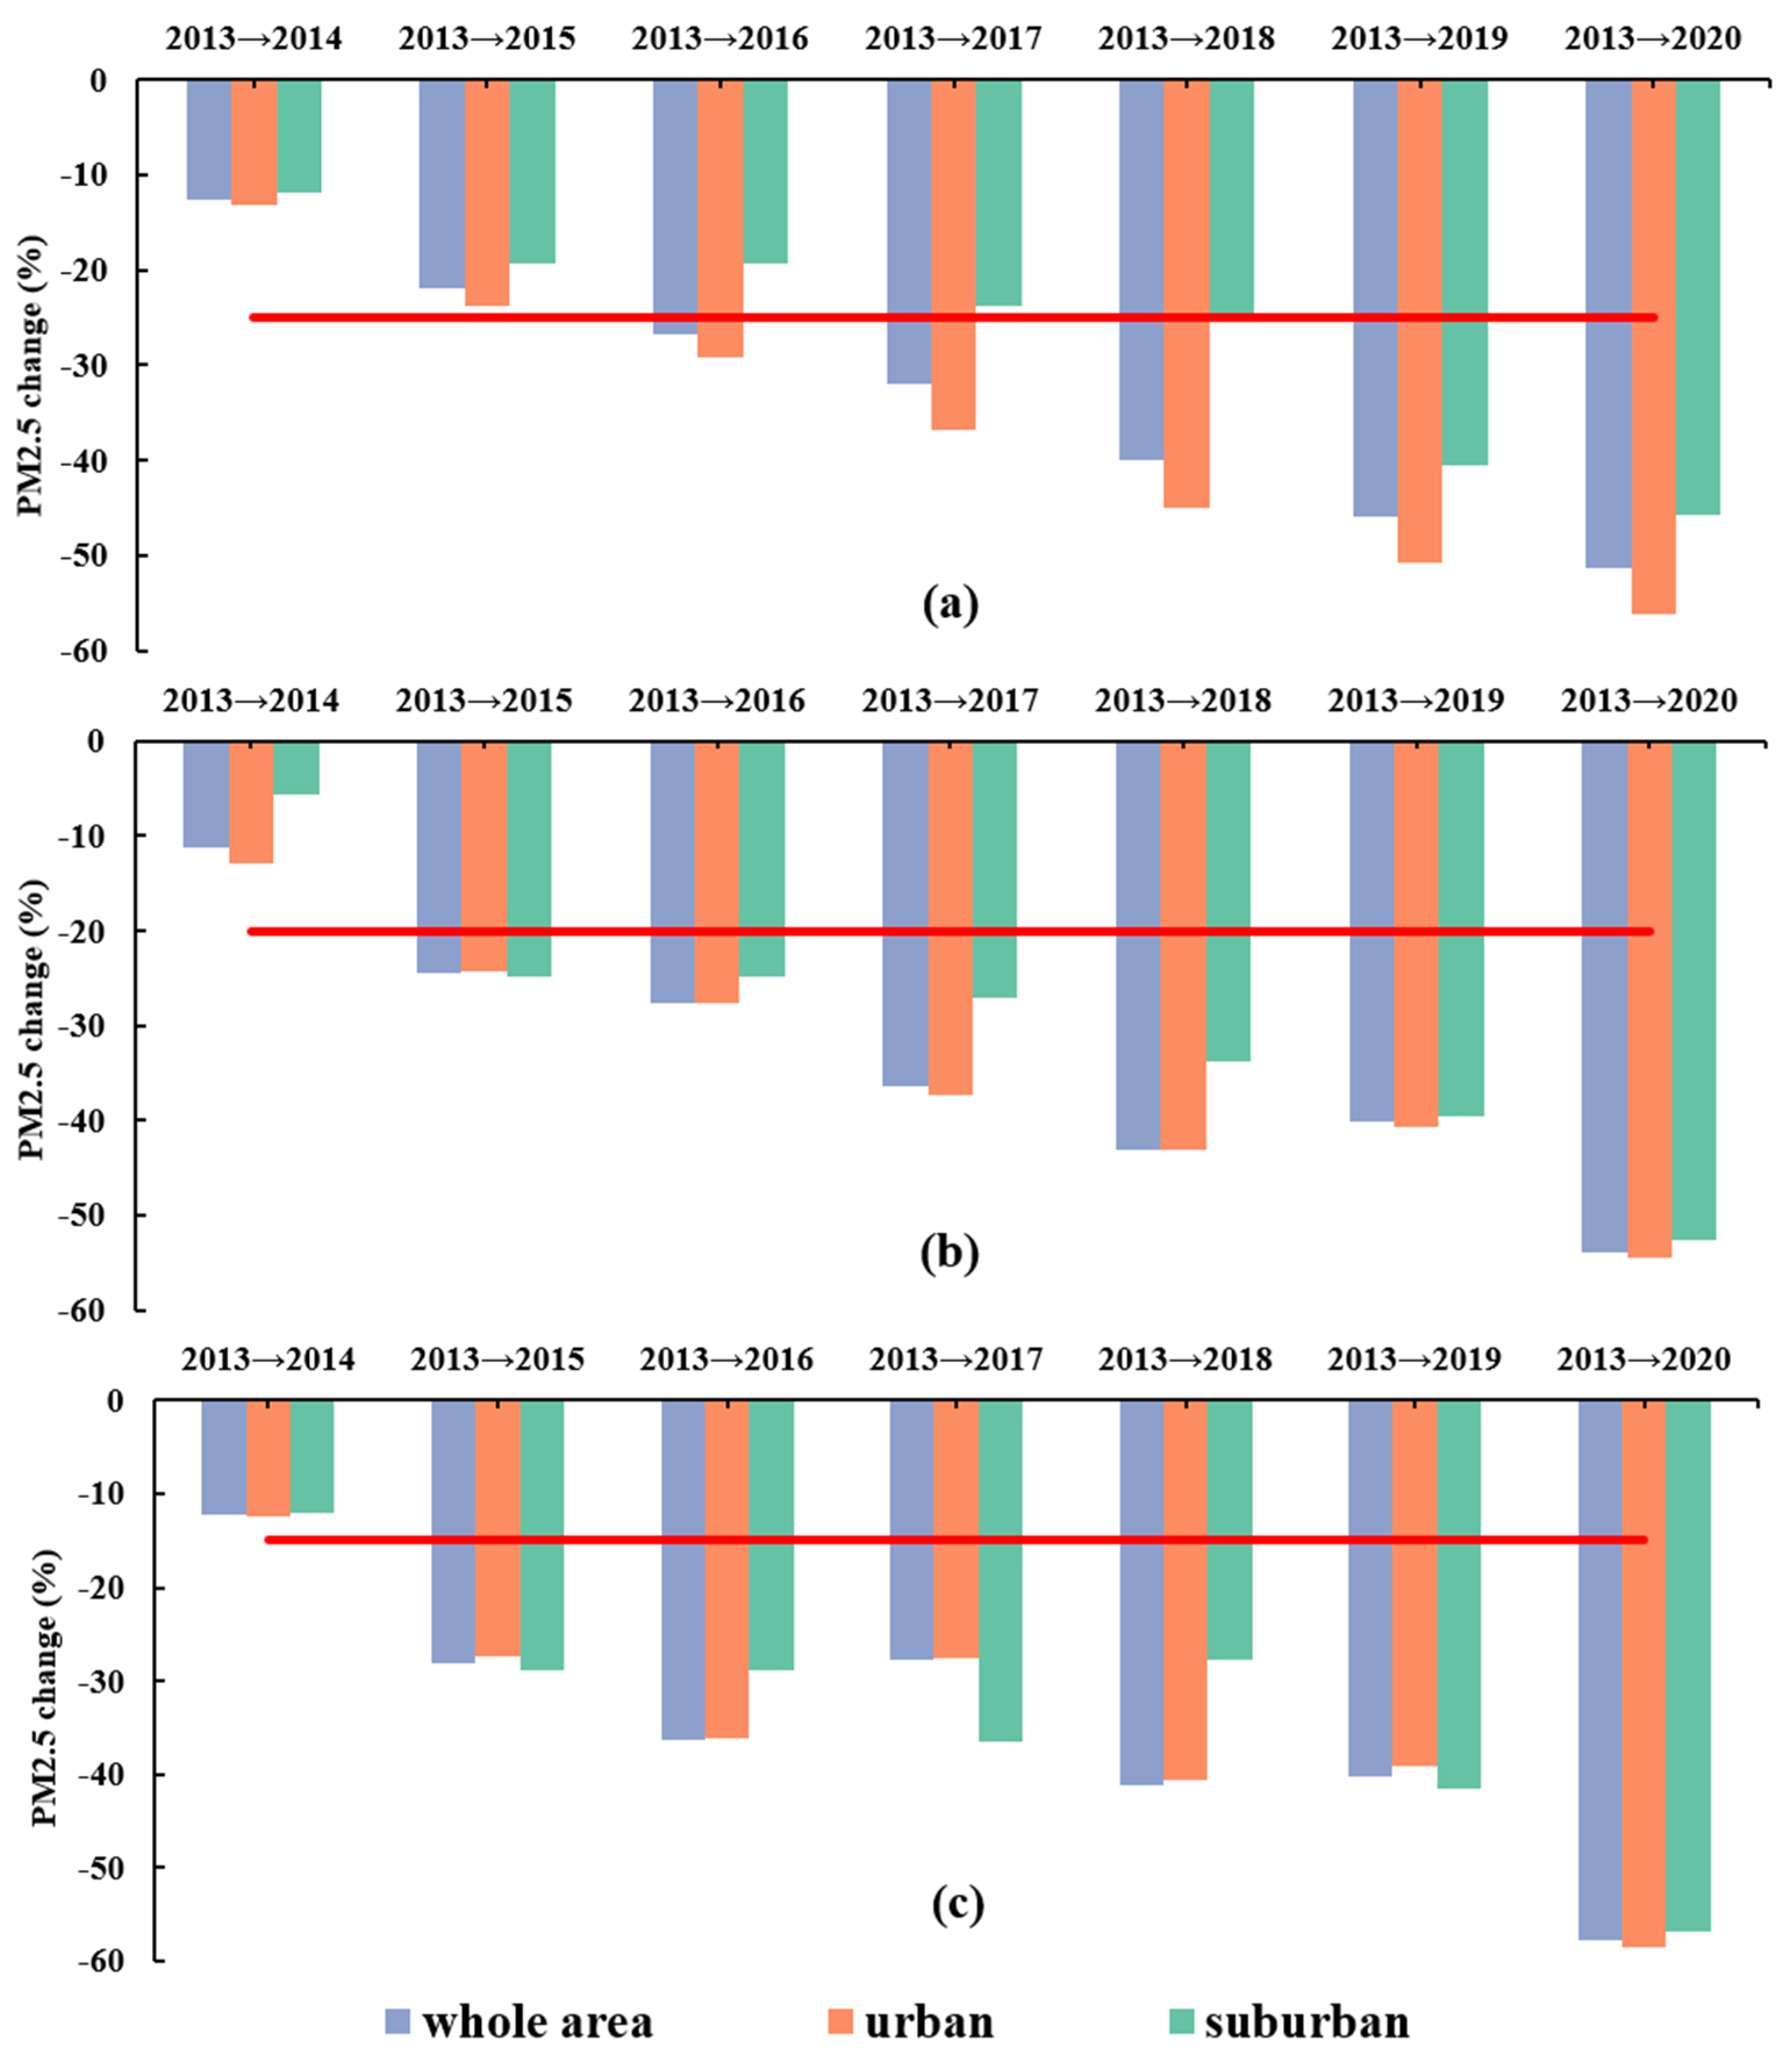
3.3. The Effect of China’s Clean Air Policies on Urban–Suburban Areas

The Air Pollution and Control Action Plan [7] set specific targets for the three largest agglomerations by which the PM2.5 concentrations in BTH, YRD, and PRD should be 25%, 20%, and 15% less in 2017 than those in 2013, respectively. To track the efficacy of this program in the three largest agglomerations and whether they varied in urban and suburban areas, we calculated the percentage change in PM2.5 concentrations across the whole region, as well as the urban and suburban areas of the three largest agglomerations since 2013 using Equation (3).
The percent PM2.5 concentration change across the whole region and urban and suburban areas in the three largest urban agglomerations since 2013 can be seen in Figure 4. The PM2.5 concentrations in the three agglomerations have decreased steadily, especially in urban areas. In BTH, the total and the urban regions reached the 25% target by 2016, and the urban and suburban areas and, therefore, the region reached this goal by 2018. By 2020, BTH achieved double the reductions that had been mandated. In YRD, the urban and suburban areas and, therefore, the region reached its specific target of a 20% drop by 2015, and it exceeded this target threefold in 2020. In PRD, the urban and suburban areas and, therefore, the region reached its specific target of a 15% drop by 2015, and it exceeded this target by four times by 2020.
We next calculated the mean annual changes in the PM2.5 concentrations in the urban and suburban areas of the three agglomerations during the period 2013–2020 using Equation (4). Table 2 shows how the PM2.5 concentrations in the urban and suburban areas of the three urban agglomerations decreased at a rate of 3–7 μg/m3 per year. In general, the rate of decrease in urban areas is faster than that in suburban areas. The most rapid decline in PM2.5 concentrations is in the urban area of BTH (7.30 μg/m3 per year), and the slowest decline in PM2.5 concentrations occurred in the suburban area of BTH (3.11 μg/m3 per year). The PM2.5 concentrations in YRD and PRD’s urban and suburban regions declined by 4–5 μg/m3 per year from 2013 to 2020.
By 2018, the urban and suburban areas in the BTH, YRD, and PRD regions had met or exceeded their specific targets in the Air Pollution and Control Action Plan [7]. By 2020, the PM2.5 declines in BTH, YRD, and PRD exceeded their targets by two, three, and four times, respectively. The reductions in urban areas are particularly noticeable. Since 2013, the PM2.5 concentrations in the urban areas of BTH, YRD, and PRD have declined at average annual rates of 7.30, 5.50, and 5.03 μg/m3, respectively, while those in suburban areas have declined at annual rates of 3.11, 4.23 and 4.69 μg/m3, respectively. The PM2.5 concentrations in urban areas decreased faster due to the relocation of key industrial plants (see Section 4 for additional details) as well the imposition of more stringent air quality policies, and these actions reduced the PM2.5 disparities between urban and suburban areas in all three regions.

3.4. PM2.5 Exposure Risks Vary in Urban and Suburban Areas

PM2.5 pollution is harmful to human health, and we used the relative risk calculated in Equation (5) to model the changes in PM2.5 exposure risks in BTH, YRD, and PRD during the period from 2000 to 2020. The distribution of PM2.5 exposure risks in the three urban agglomerations in 2000 and 2020 can be seen in Figure 5.
From Figure 5, we can see that the spatial pattern of PM2.5 exposure risks in the three urban agglomerations changed little from 2000 to 2020 and that the PM2.5 exposure risk in urban areas is higher than that in suburban areas.
From Table 3, we can see that the highest PM2.5 exposure risk (2.48) occurred in the urban area of BTH in 2000, while the lowest risk (0.09) occurred in the suburban area of YRD in 2020. In general, the PM2.5 exposure risk in urban areas is 10–20 times that of the suburban areas. In the three urban agglomerations, the PM2.5 exposure risk of BTH is higher than in PRD and YRD. From 2000 to 2020, PM2.5 exposure risks in the urban areas of BTH, YRD, and PRD decreased at rates of 0.06, 0.04, and 0.09 persons per km2, respectively. These rates were several times higher than those recorded in the suburban areas in BTH, YRD, and PRD (0.01, 0.01, and 0.003 persons per km2, respectively).

4. Discussion

This study quantitatively investigated the changes in PM2.5 concentrations between urban and suburban areas in China’s three major urban agglomerations during the past two decades. Some previous studies used land cover [48,49] or nightlight data [50] to distinguish between urban and non-urban areas, and the distribution of the urban regions based on population density data [39] used in our study mirrors prior classifications. We also show that the urban areas have expanded at an annual rate of 3–5%, while the suburban areas have shrunk by 2–7%. Some researchers have also studied the direct and spillover effects of urbanization on PM2.5 concentrations [12,51], and our results show that PM2.5 concentrations were 32, 10, and 7 μg/m3 higher in urban compared to suburban areas in BTH, YRD, and PRD, respectively during the period 2000–2020.
We analyzed PM2.5 changes in urban–suburban areas of China’s three major urban agglomerations during the last two decades based on the base of Wei’s [41,42] data and further analyzed the effects of industrial transformation and clean air policies in these areas. Our results also indicated that PM2.5 concentrations have dropped substantially in both urban and suburban areas in the three major urban agglomerations since 2013. We observed that since then, a series of laws, policies, regulations, and standards, such as the passage and implementation of the National Ambient Air Quality Standards (GB3096–1996) and the Emission Standards of Air Pollutants for Thermal Power Plants (GB1323–2003), the Air Pollution and Control Action Plan [7], and the Thirtieth Five-Year Plan for Eco-Environmental Protection [8] have been introduced. Some previous studies [11,49,52] also examined the effects of air pollution policies on PM2.5 improvement in China. Ma et al. [52] found these clean air policies led to a decrease of 4.27 μg/m3/year in PM2.5 during the period from 2013 to 2017 for all of China, and Zhai et al. [11] showed that China’s annual average PM2.5 decreased at a rate of 5.2 μg/m3/year during the period from 2013 to 2018. Those are consistent with our results, and we refined the PM2.5 concentrations and rates of decline by examining the urban and suburban areas within China’s three largest urban agglomerations separately. The rate of PM2.5 decline in urban areas was estimated to be 5.03–7.30 μg/m3/year, and that in suburban areas was estimated to be 3.11–4.23 μg/m3/year. The Air Pollution and Control Action Plan [7] also set up specific targets for the three chosen major urban agglomerations. Although studies [11,52] have reported that these three urban agglomerations had achieved their expected goals, our results also show that the rate of decline in PM2.5 in urban areas is faster than in suburban areas. The disparity between urban and suburban PM2.5 concentrations is getting smaller.
The faster air quality rates in these three urban agglomerations may be related to the closure or relocation of industrial plants that traditionally constituted primary pollution sources. The Shougang Group (www.shougang.com.cn (accessed on 1 February 2022)), for example, is one of China’s largest steel producers that moved all of its plants from Beijing’s city center to Caofeidian, a suburb of the Hebei Province, between 2005 and 2010. The Chinese government has also implemented various guidelines and targets to ensure the orderly relocation of the chemical industry from urban areas. New guidelines were issued in 2017 [53], for example, to promote the relocation and transformation of hazardous chemical production enterprises in densely populated areas. These guidelines identified 1176 dangerous chemical production enterprises in densely populated areas that do not meet the safety and health protection distance requirements and must be closed, retrofitted (to improve operations and reduce emissions), or moved to industrial parks by 2025. The plans called for 28.7% of these chemical enterprises to be closed and that 20% and 80% of the renovations to plants (30.6%) and relocations of the remainder of these plants (40.7%) would be completed by 2018 and 2020, respectively.
Notwithstanding the goals mentioned above, the industrial transformations [53], and the adoption of stringent policies to reduce PM2.5 pollution, long-term PM2.5 exposure risk is still high in China [46]. For example, the PM2.5 exposure risk in urban areas is 10–20 times higher than in suburban areas. The WHO recently adopted a new AQG (5 μg/m3) and retained the four longstanding Interim Targets ((ITs), 10, 15, 25, and 35 μg/m3 for IT-4, IT-3, IT-2, and IT-1, respectively) for annual PM2.5 [54]. The AQG was reduced from 10 μg/m3 [55] to 5 μg/m3 [54], while the lowest pollution in China’s three urban agglomerations was 25 μg/m3 during the past two decades. This is five times the AQG that China needs to adopt new and more stringent policies and measures to reduce PM2.5 pollution moving forward.

5. Conclusions

This study modeled changes in PM2.5 in urban and suburban areas of China’s three largest urban agglomerations. PM2.5 concentrations in urban areas were approximately 32, 10, and 7 μg/m3 higher than in suburban areas from 2000 to 2020 in BTH, YRD, and PRD, respectively. Since 2013, clean air policies have improved air quality, and the PM2.5 disparities between urban and suburban areas have shrunk. Since 2013, the PM2.5 concentrations in the urban areas of BTH, YRD, and PRD have declined at average annual rates of 7.30, 5.50, and 5.03 μg/m3/year, respectively, while PM2.5 concentrations in suburban have declined at average annual rates of 3.11, 4.23 and 4.69 μg/m3/year, respectively. By 2018, all of the urban and suburban areas of BTH, YRD, and PRD could satisfy their specific targets of the Air Pollution and Control Action Plan. By 2020, the PM2.5 declines of BTH, YRD, and PRD exceeded the targets by two, three, and four times, respectively. Some of these improvements, particularly in the urban areas, can be traced to the closure, retrofitting, and relocation of key industrial emissions sources, even though some of the new plants were moved to suburban areas. Air pollution in urban and suburban areas is getting closer, so more attention should be paid not only to urban areas but also to suburban areas. China needs to implement more robust air pollution mitigation policies to achieve WHO’s AQG and reduce the long-term PM2.5 exposure health risks. In this study, we pay more attention to the impact of urban–suburban variations and national policies on PM2.5 concentration in China and will consider other influence factors, such as the economy and meteorology and risk assessment indices of the world’s urban areas agglomerations, in future work.

Author Contributions

Conceptualization, L.Z. and J.P.W.; methodology, N.Z.; software, W.Z.; validation, W.Z.; formal analysis, J.P.W.; investigation, W.Z.; resources, N.Z.; data curation, W.Z.; writing—original draft preparation, L.Z.; writing—review and editing, J.P.W.; visualization, W.Z.; supervision, N.Z.; project administration, W.Z.; funding acquisition, L.Z. All authors have read and agreed to the published version of the manuscript.

Funding

This study was supported by the National Natural Science Foundation of China (grant 41907192), the Civil Aerospace Pre-research Project (grant D040102) and China High Resolution Earth Observation Project (30-Y30F06-9003-20/22 and 05-Y30B01-9001-19/20-1).

Institutional Review Board Statement

Not applicable.

Informed Consent Statement

Not applicable.

Data Availability Statement

The datasets generated during and/or analyzed during the current study are open access or available from the corresponding author on reasonable request.

Acknowledgments

The authors would like to thank Wei for providing us with the PM2.5 dataset. We also thank the NASA Socio-Economic Data and Applications Center for its population data and Dijkstra’s new degree of urbanization classification method. The authors gratefully acknowledge the financial support of the China Scholarship Council and Spatial Science Institute in the Dornsife College of Letters, Arts and Sciences at the University of Southern California. The authors also acknowledge the open-access data, which are available from https://zenodo.org/record/4660858#.YYYdhW1BxPY (accessed on 1 February 2022) and https://sedac.ciesin.columbia.edu/data/set/gpw-v4-population-count-rev11/data-download (accessed on 1 February 2022). We also acknowledge the constructive comments from anonymous reviewers and editors, who have improved the manuscript quality.

Conflicts of Interest

The authors declare no conflict of interest.

References

  1. World Health Organization. Burden of Disease from Ambient Air Pollution for 2016; World Health Organization: Geneva, Switzerland, 2018. [Google Scholar]
  2. Mar, T.F.; Ito, K.; Koenig, J.Q.; Larson, T.V.; Eatough, D.J.; Henry, R.C.; Kim, E.; Laden, F.; Lall, R.; Neas, L.; et al. PM source apportionment and health effects. 3. Investigation of inter-method variations in associations between estimated source contributions of PM2. 5 and daily mortality in Phoenix, AZ. J. Expo. Sci. Environ. Epidemiol. 2006, 16, 311–320. [Google Scholar] [CrossRef] [PubMed] [Green Version]
  3. Fang, D.; Chen, B.; Hubacek, K.; Ni, R.; Chen, L.; Feng, K.; Lin, J. Clean air for some: Unintended spillover effects of regional air pollution policies. Sci. Adv. 2019, 5, eaav4707. [Google Scholar] [CrossRef] [PubMed] [Green Version]
  4. Kan, H.; Chen, R.; Tong, S. Ambient air pollution, climate change, and population health in China. Environ. Int. 2012, 42, 10–19. [Google Scholar] [CrossRef] [PubMed]
  5. Hoek, G.; Krishnan, R.M.; Beelen, R.; Peters, A.; Ostro, B.; Brunekreef, B.; Kaufman, J.D. Long-term air pollution exposure and cardio- respiratory mortality: A review. Environ. Health 2013, 12, 43. [Google Scholar] [CrossRef] [Green Version]
  6. Forouzanfar, M.H.; Afshin, A.; Alexander, L.T.; Anderson, H.R.; Bhutta, Z.A.; Biryukov, S.; Brauer, M.; Burnett, R.; Cercy, K.; Charlson, F.J.; et al. Global, regional, and national comparative risk assessment of 79 behavioural, environmental and occupational, and metabolic risks or clusters of risks, 1990–2015: A systematic analysis for the Global Burden of Disease Study 2015. Lancet 2017, 388, 1659–1724. [Google Scholar] [CrossRef] [Green Version]
  7. State Council of People’s Republic of China. The Air Pollution Prevention and Control Action Plan 2013; State Council of People’s Republic of China: Beijing, China, 2013. (In Chinese) [Google Scholar]
  8. State Council of People’s Republic of China. The Thirtieth Five-Year Plan for Ecological Environment Protection; State Council of People’s Republic of China: Beijing, China, 2016. (In Chinese) [Google Scholar]
  9. Yan, D.; Lei, Y.; Shi, Y.; Zhu, Q.; Li, L.; Zhang, Z. Evolution of the spatiotemporal pattern of PM2. 5 concentrations in China–A case study from the Beijing-Tianjin-Hebei region. Atmos. Environ. 2018, 183, 225–233. [Google Scholar]
  10. Wang, Y.; Liu, H.; Mao, G.; Zuo, J.; Ma, J. Inter-regional and sectoral linkage analysis of air pollution in Beijing–Tianjin–Hebei (Jing-Jin-Ji) urban agglomeration of China. J. Clean. Prod. 2017, 165, 1436–1444. [Google Scholar] [CrossRef]
  11. Zhai, S.; Jacob, D.J.; Wang, X.; Shen, L.; Li, K.; Zhang, Y.; Gui, K.; Zhao, T.; Liao, H. Fine particulate matter (PM2.5) trends in China, 2013–2018: Separating contributions from anthropogenic emissions and meteorology. Atmos. Chem. Phys. 2019, 19, 11031–11041. [Google Scholar] [CrossRef] [Green Version]
  12. Du, Y.; Sun, T.; Peng, J.; Fang, K.; Liu, Y.; Yang, Y.; Wang, Y. Direct and spillover effects of urbanization on PM2.5 concentrations in China’s top three urban agglomerations. J. Clean. Prod. 2018, 190, 72–83. [Google Scholar] [CrossRef]
  13. Fang, C.; Yu, D. China’s New Urbanization: Developmental Paths, Blueprints and Patterns; Springer: Berlin, Germany; Beijing, China, 2016. [Google Scholar]
  14. State Council of People’s Republic of China. New National Urbanization Plan (2014–2020); State Council of People’s Republic of China: Beijing, China, 2014. (In Chinese) [Google Scholar]
  15. Bai, X.; Shi, P.; Liu, Y. Society: Realizing China’s Urban Dream. Nature 2014, 509, 158–160. [Google Scholar] [CrossRef] [Green Version]
  16. Tie, X.; Cao, J. Aerosol pollution in China: Present and future impact on environment. Particuology 2009, 7, 426–431. [Google Scholar] [CrossRef]
  17. Zhao, X.J.; Zhao, P.S.; Xu, J.; Meng, W.; Pu, W.W.; Dong, F.; He, D.; Shi, Q.F. Analysis of a winter regional haze event and its formation mechanism in the North China Plain. Atmos. Chem. Phys. 2013, 13, 5685–5696. [Google Scholar] [CrossRef] [Green Version]
  18. Batterman, S.; Xu, L.; Chen, F.; Zhong, X. Characteristics of PM2.5 concentrations across Beijing during 2013–2015. Atmos. Environ. 2016, 145, 104–114. [Google Scholar] [CrossRef] [PubMed] [Green Version]
  19. Chen, W.; Tang, H.Z.; Zhao, H.M. Diurnal, weekly and monthly spatial variations of air pollutants and air quality of Beijing. Atmos. Environ. 2015, 119, 21–34. [Google Scholar] [CrossRef]
  20. Wu, J.; Xie, W.; Li, W.; Li, J. Effects of Urban Landscape Pattern on PM2.5 Pollution—A Beijing Case Study. PLoS ONE 2015, 10, e0142449. [Google Scholar]
  21. Han, L.; Zhou, W.; Li, W. Fine particulate (PM2.5) dynamics during rapid urbanization in Beijing, 1973–2013. Sci. Rep. 2016, 6, 23604. [Google Scholar] [CrossRef] [PubMed] [Green Version]
  22. Zhang, X.; Wang, L.; Wang, W.; Cao, D.; Wang, X.; Ye, D. Long-term trend and spatiotemporal variations of haze over China by satellite observations from 1979 to 2013. Atmos. Environ. 2015, 119, 362–373. [Google Scholar] [CrossRef]
  23. Huang, W.; Long, E.; Wang, J.; Huang, R.; Ma, L. Characterizing spatial distribution and temporal variation of PM10 and PM2.5 mass concentrations in an urban area of Southwest China. Atmos. Pollut. Res. 2015, 6, 842–848. [Google Scholar] [CrossRef]
  24. Wang, Y.Q.; Zhang, X.Y.; Sun, J.Y.; Zhang, X.C.; Chen, H.Z.; Li, Y. Spatial and temporal variations of the concentrations of PM10, PM2.5 and PM1 in China. Atmos. Chem. Phys. 2015, 15, 13585–13598. [Google Scholar] [CrossRef] [Green Version]
  25. Yang, Y.; Christakos, G. Spatiotemporal Characterization of Ambient PM2.5 Concentrations in Shandong Province (China). Environ. Sci. Technol. 2015, 49, 13431–13438. [Google Scholar] [CrossRef]
  26. Liu, M.; Bi, J.; Ma, Z. Visibility-based PM2.5 concentrations in China: 1957–1964 and 1973–2014. Environ. Sci. Technol. 2017, 51, 13161–13169. [Google Scholar] [PubMed]
  27. Han, L.; Zhou, W.; Li, W.; Li, L. Impact of urbanization level on urban air quality: A case of fine particles (PM2.5) in Chinese cities. Environ. Pollut. 2014, 194, 163–170. [Google Scholar] [CrossRef] [PubMed]
  28. Han, L.J.; Zhou, W.Q.; Li, W.F. City as a major source area of fine particulate (PM2.5) in China. Environ. Pollut. 2015, 206, 183–187. [Google Scholar] [CrossRef] [PubMed]
  29. Zhang, Y.-L.; Cao, F. Fine particulate matter (PM2.5) in China at a city level. Sci. Rep. 2015, 5, 14884. [Google Scholar]
  30. Yao, L.; Lu, N. Spatiotemporal distribution and short-term trends of particulate matter concentration over China, 2006–2010. Environ. Sci. Pollut. Res. 2014, 21, 9665–9675. [Google Scholar] [CrossRef]
  31. Shi, T.; Han, G.; Ma, X.; Gong, W.; Chen, W.; Liu, J.; Zhang, X.; Pei, Z.; Gou, H.; Bu, L. Quantifying CO2 Uptakes Over Oceans Using LIDAR: A Tentative Experiment in Bohai Bay. Geophys. Res. Lett. 2021, 48, e2020GL091160. [Google Scholar] [CrossRef]
  32. Pei, Z.; He, G.; Ma, X.; Su, H.; Gong, W. Response of major air pollutants to COVID-19 lockdowns in China. Sci. Total Environ. 2020, 743, 140879. [Google Scholar] [CrossRef]
  33. Li, X.; Ma, Y.; Wang, Y.; Liu, N.; Hong, Y. Temporal and spatial analyses of particulate matter (PM10 and PM2.5) and its relationship with meteorological parameters over an urban city in northeast China. Atmos. Res. 2017, 198, 185–193. [Google Scholar] [CrossRef]
  34. Lou, C.-R.; Liu, H.-Y.; Li, Y.-F.; Li, Y.-L. Socioeconomic Drivers of PM2.5 in the Accumulation Phase of Air Pollution Episodes in the Yangtze River Delta of China. Int. J. Environ. Res. Public Health 2016, 13, 928. [Google Scholar] [CrossRef] [Green Version]
  35. Chan, C.K.; Yao, X. Air pollution in mega cities in China. Atmos. Environ. 2008, 42, 1–42. [Google Scholar] [CrossRef]
  36. von Bismarck-Osten, C.; Birmili, W.; Ketzel, M.; Massling, A.; Petäjä, T.; Weber, S. Characterization of parameters influencing the spatio-temporal variability of urban particle number size distributions in four European cities. Atmos. Environ. 2013, 77, 415–429. [Google Scholar] [CrossRef]
  37. Zhao, X.; Zhang, X.; Xu, X.; Xu, J.; Meng, W.; Pu, W. Seasonal and diurnal variations of ambient PM2.5 concentration in urban and rural environments in Beijing. Atmos. Environ. 2009, 43, 2893–2900. [Google Scholar] [CrossRef]
  38. Lin, C.; Lau, A.K.H.; Li, Y.; Fung, J.C.H.; Li, C.; Lu, X.; Li, Z. Difference in PM2.5 Variations between Urban and Rural Areas over Eastern China from 2001 to 2015. Atmosphere 2018, 9, 312. [Google Scholar] [CrossRef] [Green Version]
  39. Dijkstra, L.; Florczyk, A.J.; Freire, S.; Kemper, T.; Melchiorri, M.; Pesaresi, M.; Schiavina, M. Applying the Degree of Urbanisation to the globe: A new harmonised definition reveals a different picture of global urbanisation. J. Urban Econ. 2021, 125, 103312. [Google Scholar] [CrossRef]
  40. Zhang, L.; Wilson, J.P.; MacDonald, B.; Zhang, W.; Yu, T. The changing PM2.5 dynamics of global megacities based on long-term remotely sensed observations. Environ. Int. 2020, 142, 105862. [Google Scholar] [CrossRef] [PubMed]
  41. Wei, J.; Li, Z.; Cribb, M.; Huang, W.; Xue, W.; Sun, L.; Guo, J.; Peng, Y.; Li, J.; Lyapustin, A. Improved 1 km resolution PM2.5 estimates across China using enhanced space–time extremely randomized trees. Atmos. Chem. Phys. 2020, 20, 3273–3289. [Google Scholar] [CrossRef] [Green Version]
  42. Wei, J.; Li, Z.; Lyapustin, A.; Sun, L.; Peng, Y.; Xue, W.; Su, T.; Cribb, M. Reconstructing 1-km-resolution high-quality PM2. 5 data records from 2000 to 2018 in China: Spatiotemporal variations and policy implications. Remote Sens. Environ. 2021, 252, 112136. [Google Scholar] [CrossRef]
  43. Center for International Earth Science Information Network—CIESIN—Columbia University. Documentation for the Gridded Population of the World, Version 4 (GPWv4); NASA Socioeconomic Data and Applications Center (SEDAC): Palisades, NY, USA, 2016; Available online: https://sedac.ciesin.columbia.edu/data/collection/gpw-v4/documentation (accessed on 4 August 2020).
  44. Doxsey-Whitfield, E.; MacManus, K.; Adamo, S.B.; Pistolesi, L.; Squires, J.; Borkovska, O.; Baptista, S.R. Taking advantage of the improved availability of census data: A first look at the gridded population of the world, version 4. Pap. Appl. Geogr. 2015, 1, 226–234. [Google Scholar] [CrossRef]
  45. ESRI. Performing Sensitivity Analysis. Available online: http://webhelp.esri.com/arcgisdesktop/9.2/index.cfm?TopicName=Performing_sensitivity_analysis (accessed on 4 March 2021).
  46. Zhang, L.; Pan, J. Spatial-temporal pattern of population exposure risk to PM2.5 in China. China Environ. Sci. 2020, 40, 1–12. [Google Scholar]
  47. Dijkstra, L.; Poelman, H. A harmonised definition of cities and rural areas: The new degree of urbanisation. European Comission Directorate-General for Regional and Urban Policy. Reg. Work. Pap. 2014, 1, 1–14. [Google Scholar]
  48. Gong, P.; Li, X.; Zhang, W. 40-Year (1978–2017) human settlement changes in China reflected by impervious surfaces from satellite remote sensing. Sci. Bull. 2019, 64, 756–763. [Google Scholar] [CrossRef] [Green Version]
  49. Xiao, Q.; Geng, G.; Liang, F.; Wang, X.; Lv, Z.; Lei, Y.; Huang, X.; Zhang, Q.; Liu, Y.; He, K. Changes in spatial patterns of PM2.5 pollution in China 2000–2018: Impact of clean air policies. Environ. Int. 2020, 141, 105776. [Google Scholar] [CrossRef] [PubMed]
  50. Zhou, Y.; Smith, S.J.; Elvidge, C.D.; Zhaom, K.; Thomson, A.; Imhoff, M. A cluster-based method to map urban area from DMSP/OLS nightlights. Remote Sens. Environ. 2014, 147, 173–185. [Google Scholar] [CrossRef]
  51. Wang, S.; Sun, P.; Sun, F.; Jiang, S.; Zhang, Z.; Wei, G. The Direct and Spillover Effect of Multi-Dimensional Urbanization on PM2.5 Concentrations: A Case Study from the Chengdu-Chongqing Urban Agglomeration in China. Int. J. Environ. Res. Public. Health. 2021, 18, 10609. [Google Scholar] [CrossRef]
  52. Ma, Z.; Liu, R.; Liu, Y.; Bi, J. Effects of air pollution control policies on PM2.5 pollution improvement in China from 2005 to 2017: A satellite-based perspective. Atmos. Chem. Phys. 2019, 19, 6861–6877. [Google Scholar] [CrossRef] [Green Version]
  53. State Council of People’s Republic of China. Guidelines on Promoting the Relocation and Transformation of Hazardous Chemical Production Enterprises in Densely Populated Areas; State Council of People’s Republic of China: Beijing, China, 2017. (In Chinese) [Google Scholar]
  54. World Health Organization; WHO European Centre for Environment. W.E.C.F. Environment. WHO Global Air Quality Guidelines: Particulate Matter (PM2.5 and PM10), Ozone, Nitrogen Dioxide, Sulfur Dioxide and Carbon Monoxide; World Health Organization: Geneva, Switzerland, 2021. [Google Scholar]
  55. World Health Organization. Air Quality Guidelines: Global Update 2005: Particulate Matter, Ozone, Nitrogen Dioxide, and Sulfur Dioxide; World Health Organization: Geneva, Switzerland, 2006. [Google Scholar]
Figure 1. The distribution and composition of China’s three major urban agglomerations (a), the 10 cities in BTH (b), the 16 cities in YRD (c), and the 9 cities in PRD (d).
Remotesensing 14 01716 g001
Figure 2. The distribution of urban and suburban areas of BTH, YRD, and PRD in 2000 and 2020. (a) BTH in 2000. (b) BTH in 2020. (c) YRD in 2000. (d) YRD in 2020. (e) PRD in 2000. (f) PRD in 2020.
Remotesensing 14 01716 g002
Figure 3. The PM2.5 concentrations (μg/m3) in the whole region as well as urban and suburban areas from 2000 to 2020 in (a) BTH, (b) YRD, and (c) PRD.
Remotesensing 14 01716 g003
Figure 4. The percentage of PM2.5 concentration change in urban and suburban areas and the region as a whole for BTH (a), YRD (b), and PRD (c) since 2013. The red lines show the targets specified in the Air Pollution and Control Action Plan for each urban agglomeration.
Remotesensing 14 01716 g004
Figure 5. The distribution of PM2.5 exposure risk measured in persons per km2 in BTH, YRD, and PRD in 2000 and 2020. (a) BTH in 2000. (b) BTH in 2020. (c) YRD in 2000. (d) YRD in 2020. (e) PRD in 2000. (f) PRD in 2020.
Remotesensing 14 01716 g005
Table 1. The variations in urban and suburban areas and populations from 2000 to 2020.
RegionYearUrbanSuburban
Area (km2)Pop. (Thousands)Area (km2)Pop. (Thousands)
BTH2000112,00061,125200,0009699
2005117,00067,514195,0009309
2010121,00074,590191,0009089
2015125,00082,669187,0008850
2020130,00091,962182,0008542
Percent Change (%) 411−2−3
YRD2000100,00084,43654,0004590
2005104,00093,10350,0004391
2010107,000102,96547,0004208
2015110,000114,27644,0003949
2020114,000127,22840,0003632
Percent Change (%) 511−4−6
PRD200029,00040,29736,0003592
200530,00045,72535,0003715
201032,00052,02433,0003818
201534,00059,59831,0003638
202035,00068,13630,0003654
Percent Change (%)3 14 −7 0
Table 2. The PM2.5 concentrations (μg/m3) in the urban and suburban areas of the three agglomerations and the percent change during the period 2013–2020.
YearBTHYRDPRD
UrbanSuburbanUrbanSuburbanUrbanSuburban
201391.0847.7270.6056.2160.1857.70
201479.1742.0961.5153.0852.7050.70
201569.4738.4853.4642.2843.7741.10
201664.4736.4151.0341.0138.4836.66
201757.4835.5444.2937.2243.6341.66
201850.1231.3340.1931.3335.7533.60
201944.7828.3441.9433.9636.6933.71
202039.9725.9332.1026.5924.9524.90
Δ −7.30−3.11−5.50−4.23−5.03−4.69
Table 3. Mean PM2.5 exposure risk in persons per km2 in urban and suburban areas of BTH, YRD, and PRD and the average change per 5 years during the period 2000–2020.
YearBTHYRDPRD
UrbanSuburbanUrbanSuburbanUrbanSuburban
20002.480.161.450.132.090.12
20052.420.141.410.132.020.12
20102.360.121.370.121.940.12
20152.310.111.340.101.820.11
20202.230.111.310.091.740.11
Δ −0.06−0.01−0.04−0.01−0.09−0.003
Publisher’s Note: MDPI stays neutral with regard to jurisdictional claims in published maps and institutional affiliations.

