1. Introduction
Oblique photogrammetry technology can comprehensively perceive complex scenes in a large-scale, high-precision, and high-definition way, and can provide rich building facade information. This technology has gradually become an important means of reconstructing and updating urban 3D models. Such 3D model reconstruction based on oblique photography generally includes the steps of sparse point cloud reconstruction, dense point cloud reconstruction, 3D mesh reconstruction, and texture reconstruction. Texture reconstruction technology can produce color, material, and other information for the reconstructed model, can further improve the visual expression effect of the model, and has become one of the essential key links in the 3D model reconstruction process. In recent years, with the rapid development of computer vision and photogrammetry, research on texture reconstruction using multi-view images has attracted extensive attention from scholars [
1,
2,
3,
4,
5,
6].
In the existing research, scholars have added texture information to 3D models by using multi-view images, restored the real physical characteristics of the object to the greatest extent, made the model more realistic, and have formed blending-based methods [
2,
3,
7] and a projection-based method [
1,
5,
6,
8]. The former projects the image onto the surface of the geometric model according to the camera parameters and then merges all visual images to complete the texture reconstruction. This method has high accuracy requirements for the camera parameters and geometric models and is prone to ghosting and blur. The latter establishes a visual image list for each triangular face according to the camera parameters and selects the best image to complete texture reconstruction using the global graph-cut optimization method, which can avoid the above problems. Therefore, some scholars have attempted to use this method for texture reconstruction in recent years. Lempitsky et al. [
5] first proposed a texture reconstruction method based on the angle between the normal of the triangular face and view rays as the data item. This method needs to synthesize the best image of each triangular face into a complete texture, which inevitably leads to the problem of texture seams. Therefore, Allene et al. [
1] proposed a texture reconstruction method based on a Laplacian pyramid, but this method could not handle the problem of image defocusing well. Waechter et al. [
8] proposed a texture reconstruction method based on the Sobel gradient integral as a data item, greatly improving the texture-reconstruction quality and making the texture clearer and smoother. Thus, this method has become the current mainstream texture reconstruction method. On this basis, Li et al. [
9] proposed a texture reconstruction method based on a sparse mesh to achieve the fast texture reconstruction of 3D models; Li et al. [
6] also proposed a texture reconstruction method based on automatic plane segmentation to reduce the number of texture maps. However, the above methods all adopt the global graph-cut optimization method, which is more suitable for small-scale urban 3D model texture reconstruction [
10].
For large-scale 3D model reconstructions of oblique images, the whole area often needs to be partitioned before reconstruction, hereafter referred to as partitioning reconstruction. Two kinds of reconstruction methods based on an octree [
11,
12,
13,
14] and a grid [
15,
16] are formed. The former is an adaptive partitioning reconstruction method according to the distribution of the scene geometry elements. When the reconstruction scale is enlarged, the method has the problem of low-efficiency subtree retrieval, due to tree depths that are too large. The latter is an adaptive partitioning reconstruction method according to the grid size. This method does not split the subtree, which can avoid the above problems. Therefore, this method is the mainstream partitioning reconstruction method at present. Zhang et al. [
17] proposed a 3D reconstruction method based on a control point grid, which can quickly and intuitively construct a 3D model from a single image. Han et al. [
15] proposed a 3D model reconstruction method based on mesh division, which can achieve a large-scale 3D mesh model partition reconstruction. On this basis, Wang et al. [
16] proposed a boundary cavity repair method based on the mesh division method, which can realize the cavity partition repair of a 3D mesh model. However, the above methods studied only the partitioning reconstruction of the 3D mesh model and did not carry out the subsequent partitioning texture reconstruction.
Therefore, it is necessary to explore a partitioning texture reconstruction method that is suitable for large-scale 3D models. Based on the partitioning reconstruction of the 3D mesh model, combined with the current mainstream texture reconstruction methods, this paper proposes a partitioning texture reconstruction method that takes the scene structure information into account. This method uses each tile as the basic unit of texture reconstruction, extracts the building outline based on the 3D mesh model, computes the topological neighbor relationship of the tiles, restores the incorrect occlusion relationship of the 3D mesh model caused by scene segmentation, modifies the data item and smoothing item of the energy function, and selects the best view. Finally, it smoothly adjusts the jagged boundary problem to further reduce the number of texture charts and achieve a high-quality texture reconstruction of the 3D mesh model in the tile, thereby achieving the texture reconstruction of a large-scale 3D mesh model.
The innovations presented in this work are as follows:
- (1)
A method of texture reconstruction based on scene segmentation is proposed that is suitable for a large-scale scene 3D mesh model. This method not only inherits the high quality of the projection-based texture reconstruction method, but also uses scene segmentation to achieve the texture reconstruction of large scenes, which can reduce computer resources and speed up texture reconstruction;
- (2)
A method of using the 3D mesh model between tiles to correctly restore the incorrect occlusion relationship caused by the partitioning is proposed, and the visual image list corresponding to the triangular face is correctly constructed to achieve the correct reconstruction of the texture of the 3D mesh model;
- (3)
A view selection method that takes the scene structure information into account is proposed. This method can select the best view for each triangular face, reduce the number of texture map fragments, and further optimize the internal texture seam problem.
2. Related Work
2.1. Existing Texture Reconstruction Methods
At present, the existing texture reconstruction methods pay relatively little attention to the partitioning texture reconstruction of large-scale 3D models based on oblique images. This approach is considered to be an effective and feasible method to introduce the texture reconstruction method of small scenes and high quality into that of large-scale 3D models. The most recent and effective method in the existing research was presented by Waechter et al. [
8], which is also the basic method of texture reconstruction in this paper. Aiming at the texture reconstruction problem of multi-view images, a texture reconstruction method based on the Markov energy function is proposed. The method first uses a global graph cut optimization algorithm to select the best visible image for each triangular face, then combines the triangular faces that use the same visible image continuously to generate a chart, and finally assembles multiple charts to generate Texture. The basic principles are as follows:
Step 1: Back occlusion and frustum clipping is performed based on the camera’s internal and external parameters to calculate the visibility relationship between the view and the triangular face, and the visible image label list is determined corresponding to the triangular face;
Step 2: The Sobel operator gradient integral of the triangular face in the image visual field is used as the data item, the Potts model is used as the smoothing item, the moving objects are deleted based on photo consistency detection to enhance the data item, and the images with consistent color are preferentially selected;
Step 3: The best view for each triangular face is selected by using the graph-cut algorithm and α-expansion to obtain the preliminary texture of the triangular face;
Step 4: For the initial texture obtained in the previous step, global color adjustment based on distance weighting is performed first, followed by local adjustments based on Poisson editing. The color block continuous texture is obtained and texture reconstruction is realized.
2.2. Existing Scene Partitioning Methods
At present, the existing research pays much attention to the partitioning reconstruction of large-scale 3D mesh models based on oblique images. This is considered to be an effective and feasible method to introduce the mature partitioning reconstruction method into the texture reconstruction of large-scale 3D models. The latest and most-effective method in the existing research was presented by Han et al. [
15], which is also the basic method of partitioning reconstruction in this paper. Aiming at the partitioning reconstruction of a 3D mesh model based on oblique images, a grid-based partitioning reconstruction method is proposed. The basic principle of this method is as follows:
Step 1: The large-scale point cloud data obtained from oblique images are partitioned based on the regular grid partitioning method, and the grid index is established for the unified management of all the partitioning grids, as shown in
Figure 1a;
Step 2: Based on the global graph-cut optimization algorithm, the point cloud inside each tile is independently meshed, and the 3D mesh model of each partitioning unit is generated, as shown in
Figure 1b;
Step 3: The 3D mesh models of each partitioning unit are combined based on the grid index to generate a 3D mesh model of the complete scene, as shown in
Figure 1c;
Step 4: Texture reconstruction is performed on the merged 3D mesh model, as shown in
Figure 1d.
2.3. Inadequacies of Existing Methods
The existing methods model triangular faces and their adjacencies by introducing a Markov random field, and solve this model through global graph-cut optimization, which can select the best texture image for each triangular face and solve the problem of texture reconstruction at the global scale. However, the texture reconstruction of complex morphological and large-scale 3D mesh models also has the following three limitations:
- (1)
Although the existing methods can realize the texture reconstruction of a small-scale scene on a global scale, the amount of data that needs to be processed increases with the increasing reconstruction range. In a single reconstruction range, a triangular face of one million levels may grow to ten million or even one billion levels, which greatly increases the reconstruction time and memory consumption. In severe cases, the program exits abnormally, and texture reconstruction cannot be carried out;
- (2)
Scene segmentation destroys the occlusion relationship between the 3D models of the original scene. If the reconstructed model is located inside the reconstruction area, the occlusion relationship is correct, and texture reconstruction can be performed correctly. If the reconstructed model is located at the edge of the reconstruction area, the occlusion relationship is incorrect; at this time, the texture reconstruction based on the existing method is incorrect, as shown in
Figure 2;
- (3)
The existing methods use the Potts model to smooth the texture selection between adjacent meshes without taking the scene structure information of the 3D model into account, which leads to serious fragmentation of the color blocks in the texture reconstruction, increases the difficulty of texture seam processing in the later stage, and reduces the visual effect of the 3D model.
3. Methodology
A parallel method for texture reconstruction in large-scale 3D automatic modeling is proposed for fast texture reconstruction in oblique photography. Different from the existing methods, this paper first divides the reconstruction area into blocks and uses each block grid as the basic unit of texture reconstruction, which can improve the computational efficiency, thus solving the shortcomings of the existing methods (1). Second, this paper constructs the topological relationship of the block grid and uses the triangular face information within and between blocks to restore the incorrect occlusion relationship caused by the block to solve the shortcomings of the existing methods (2). Finally, this paper introduces the “occlusion area” of the triangular face, the angle between the normal and the visible image light, and the distance from the texture coordinate to the image principal point as weighting factors to optimize the data items for view selection. It also introduces the structural information of the 3D model in the scene to optimize the smoothing term of the view selection and to achieve the best view selection of the triangular faces, thus solving the shortcomings of existing methods (3).
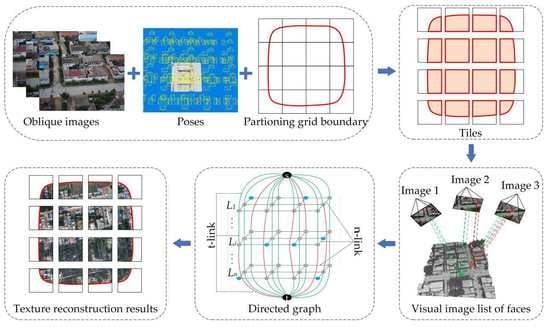
This method consists of the following five core steps:
Step 1: Calculating the texture reconstruction hierarchical relationship: A grid index of the block unit is established and the texture reconstruction hierarchical relationship is constructed from the inside to the outside, according to the relative relationship between the block unit and the reconstruction area;
Step 2: Building the outline extraction and classifying the neighborhood block units: The current processing unit and neighborhood block unit are determined based on the hierarchical relationship and grid index, the building outline is extracted based on the 3D mesh model of the adjacent block units, the occlusion influence range is calculated with the camera pose, and the neighborhood block units are divided into the two categories of non-occlusion and occlusion;
Step 3: Building a triangular face visual image list: Based on the geometric model structure of the neighborhood block unit with occlusion labels, the erroneous occlusion relationship of the triangular faces are restored within the current block, thereby constructing a correct visual image list for each triangular face;
Step 4: Selecting the best view label: The “occlusion area”, “angle between normal and light”, and “distance from texture coordinate to image principal point” are used as data item-weighting factors to modify the data item of the view selection energy function. The average normal of the neighborhood triangular mesh and the angle factor of the current triangular mesh are used to modify the smooth term of the view selection energy function and to complete the best view label selection of the triangular mesh, based on the global graph-cut optimization algorithm;
Step 5: Smoothing the view label: The neighborhood topological relationship of the view label based on the triangular face is smoothed to optimize the texture selection of the serrated triangular face to alleviate the problem of the texture seam in the block. The texture reconstruction process is shown in
Figure 3.
3.1. Hierarchical Relationship Calculation
To ensure the correctness of the reconstructed block grid texture, it is first necessary to establish the hierarchical relationship of the block texture reconstruction. The specific provisions are as follows. (1) The innermost reconstruction area is the initial reconstruction unit, which can be determined based on the relative relationship between the block grid and the reconstruction area; that is, the initial reconstruction unit is the first layer. (2) The blocking units adjacent to the first layer are the second layer. The reconstruction order of the units at the same level is sorted according to the distance from the center of the blocking grid to the center of the reconstruction area. The smaller the distance is, the higher the priority of the reconstruction order. (3) By analogy, the nth layer is obtained “from the inside to the outside”, thereby establishing the hierarchical relationship of the texture reconstruction. According to the relative relationship between the original block grid and the reconstruction area, the innermost block unit of the reconstruction area is taken as the initial reconstruction unit. As shown in
Figure 4, for the reconstruction range in
Figure 4a, the corresponding texture reconstruction hierarchy is shown in
Figure 4b.
3.2. Building Contour Extraction and Neighborhood Block Unit Classification
After establishing the texture reconstruction hierarchy, starting from the innermost layer (the first layer), “from the inside to the outside”, texture reconstruction is performed block by block using a distributed framework. There is a key problem in the reconstruction process, in that it is unclear how to judge whether the triangular face of the neighborhood block unit occludes the triangular face of the current reconstruction unit. For this reason, this paper uses the relative relationship between the building outline and the camera to predict the neighborhood occlusion relationship and to classify the neighborhood block units.
- (1)
Building outline extraction: The primary problem of the occlusion relationship recovery involves determining whether the neighborhood block unit grid affects the occlusion relationship of the current reconstructed unit grid, and the basis for the quick judgment of the occlusion relationship is to calculate the occlusion influence range by calculating the relative relationship between the building outline and the camera. Referring to the existing method [
18], this paper also uses the digital surface model (DSM) for building contour-boundary recognition. Specifically, a DSM is first generated based on a 3D model (mesh), as shown in
Figure 5b. Then, the Sobel edge-detection operator is used to extract the contour boundary of the model, as shown in
Figure 5c. Then, the main direction of the building outline is detected on the two-measurement smooth line by RANSAC. Next, each edge of the contour is assigned a dominant direction based on the alignment target from the MRF formula, and the boundary edge is aligned to the target direction. Finally, a compact building model is generated based on the closed contour and the average height of the model, as shown in
Figure 5d. For the detailed steps of the building contour model extraction process, which will not be repeated here, please refer to Zhu et al. [
18].
- (2)
Neighborhood block unit classification: First, the current texture reconstruction unit, as shown in
Figure 6b, calculates the occlusion range according to the building outline and camera parameters extracted from the 3D mesh model
, defined as Formula (1). Second, according to whether the occlusion influence range exceeds the spatial range of the neighborhood block, the neighborhood block units are divided into two categories. For Class I, the neighborhood is not occluded; that is, the triangular face of the neighborhood block unit cannot affect the occlusion relationship of the current reconstruction unit, as shown in
Figure 6a. Conversely, Class II involves neighborhood occlusion; that is, the triangular face of the neighborhood block unit can affect the occlusion relationship of the current reconstruction unit, as shown in
Figure 6c.
where
is the occlusion range under the current camera,
is the height of the building model, and
is the angle between the line connecting the current camera and the outer contour of the modeling model and the horizontal line on the ground.
3.3. Establishment of Visual Image List of Faces
After the prediction of the occlusion relationship, the occlusion classification of the neighborhood block unit is completed. Because the global graph-cut optimization method is used to select the best view, it is necessary to establish the corresponding visual image list for each triangular face. The key problem in the process of building the visual image list is determining how to construct the visual image list corresponding to the triangular face quickly and correctly. Therefore, this paper uses visual cone cutting and back occlusion detection to filter the triangular face of the visual area of the image. Based on the triangular face of the neighborhood block unit, occlusion detection is performed to remove the occluded image, and the correct visible image list of the triangular face is completed.
The necessary condition for building the correct visual image list of the triangular faces is to restore the occlusion relationship of the triangular face. To speed up the establishment of the visible image list of the triangular faces, this paper first constructs an octree index based on the vertex information of the triangular faces and uses viewing frustum clipping and back occlusion detection [
19,
20] to prescreen the triangular face in the visual area. The triangular faces in the block unit are divided into three cases: (1) the triangular face is located in the viewing frustum, not blocked by other triangular faces, and the camera is completely visible, as shown in the green mesh in
Figure 7; (2) the triangular face is located in the viewing frustum, and other triangular faces are partially obscured, where the triangular grid part is located in the viewing frustum, and the camera part is visible, as shown in the yellow grid in
Figure 5; (3) the triangular face is located in the viewing frustum and is completely occluded by other triangular faces, where the triangular grid is located outside the viewing frustum, and the camera is completely invisible, as shown in the gray grid in
Figure 7. To ensure the correct texture reconstruction, the list of visual images corresponding to the triangular faces in the third case does not include the image. In addition, because the blocking process destroys the original occlusion relationship of the triangular face, the triangular faces in the first two cases may be partially or completely visible to the camera in the subblock scene, but the camera in the full scene may be partially or completely invisible. Therefore, it is necessary to restore the occlusion relationship based on the triangular face of the neighborhood block unit of type II and further eliminate the completely occluded image in the list of visual images corresponding to the triangular face. The proportion of the “occlusion area” of the triangular face in the partially visible case is calculated as the weight factor of the energy function data item of the subsequent view selection. Thus far, the corresponding visible image list has been correctly established for each triangular face through the above algorithm.
3.4. Best-View Selection of Triangular Faces
After the above steps, the correct visual image list is established for each triangular face, and then it is necessary to select the image with a clear texture and rich details from the visual image list for each triangular face to extract the texture, taking into account the structural characteristics of the 3D mesh model. In essence, this is an optimization problem under the MRF framework, namely, the marking problem of the visual image list of a triangular face. In computer vision, graph cutting is one of the most effective methods to solve the minimization model of the energy function under the MRF framework [
21,
22]. Therefore, our method, similar to the Waechter method, is based on the graph-cut texture optimization algorithm under the MRF framework, solves the problem of too many texture charts in the original method, and realizes the best-view selection of a triangular face.
3.4.1. Building a Directed Graph
The directed graph is an intuitive representation of the real world, consisting of a point set V with associated edges E between nodes; it can be expressed as
. As shown in
Figure 8, we constructed a directed weighted graph
of the 3D mesh model of the scene, in which the two upper and lower special black terminal nodes are the source node
and sink node
of the directed graph
G, respectively. The rest of the nodes are the nodes of each triangular face in the 3D mesh model in different labeled images, where the number of nodes in each layer is equal to the number of triangular faces. The nodes are connected by t-link and n-link edges, which indicate the adjacency of the triangular face. The t-link is the edge connecting the source node
, the sink node
, and the nodes of different labeled images; this is the data item of the energy function of the nodes for selecting different labeled images
. If a labeled image is not in the visible image list of the triangular face, as shown by the blue node in
Figure 8, the node has no t-link edge connected to it, as shown by the red line in
Figure 8; if a labeled image is in the visible image list of the triangular face, as shown by the gray node in
Figure 8, the node has t-link edge connected to it, as shown by the green line in
Figure 8. The n-link is the edge connecting the nodes in the labeled image of the same layer, and it is the smooth term of the energy function of the adjacent nodes selecting the same labeled image.
3.4.2. Constructing an Energy Function
The energy function in the graph-cut algorithm is the mathematical expression of the actual problem, which is the bridge between the graph-cut theory and the actual problem. The first condition to achieve the optimal view selection for the triangular faces is to establish a uniform energy function. The Waechter method uses the Sobel gradient integral as the energy function data item to solve the problem of image defocus, and uses the Potts model as the energy function smoothing term to smooth the view selection of the neighborhood triangular mesh. The constructed energy function formula is as follows:
where
,
is the Sobel gradient integral of the triangular face
on the labeled image
, indicating the probability of node
selecting the label image
as the best image.
indicates that the adjacent nodes
and
select the same label image, and the smoothing item value is 0; otherwise, it is infinite.
However, the energy function constructed by the Waechter method does not consider the partial occlusion phenomenon, the angle between the triangular face and the light, the distance from the texture center to the main point of the image, the plane structure information of the three-dimensional model, leading to the low quality of the texture reconstruction, causing an excessive number of texture charts and aggravating the problem of texture seams. Compared with the original MRF energy function, we use the proportion of the “occlusion area”, the angle between the normal of the triangular face and light, and the distance from the texture center to the main point of the image as the data item weight factors to optimize the best-view selection of the triangular face. The plane structure information of the 3D model is introduced as the constraint condition of the smoothing item to reduce the number of texture charts and alleviate the problem of texture seams. The improved energy function formula is as follows.
To optimize the optimal view selection for the triangular face, we define the weight factor
as follows:
The weight factor of area proportion is:
where
,
is the area of the triangular face
after occlusion detection projected onto the marked image
, and
is the area of the triangular face
projected onto the labeled image
, indicating that, if it is completely visible, the weight value is 1. If the part is slightly visible, the weight value is the proportion of area.
The angle weighting factor is:
where
,
is the normal of the triangular face, and
is the ray between the projection center of the image
and the center of the triangular mesh.
The distance weighting factor is:
where
,
is the texture coordinate of the triangular face center in image
,
is the image principal point coordinate of image
, and
is the pixel coordinate of image
.
is the Euclidean distance from the pixel coordinate
to the principal point
, and
is the absolute value of the calculated weight.
To reduce the number of texture charts and alleviate the texture seam problem, we redefine the smoothing term
of the energy function as follows:
where
and
are the inverse distance-weighted normal vectors of the first-order neighborhood faces of the triangular faces
and
, respectively, and
is the angle between the normal vectors
and
, with the angle threshold
.
In this paper, we also use the
swap optimization algorithm to solve the energy function [
23], which is an effective graph-cut bipartition optimization algorithm that not only optimally partitions the initial dataset but can also change the multidimensional directed graph into a two-dimensional simple directed graph, thus avoiding the bounded t-link and n-link capacity values in the directed graph uncertainty [
22,
24,
25].
3.5. View Label Smoothing Optimization
After the above processing steps, the optimal view labels have been selected for each triangular face; however, the generated view labels tend to produce jagged boundaries and increase the texture seam problem. To alleviate the boundary seam problem, the jagged boundary needs to be smoothed and optimized. In the method used in this paper, when the jagged triangular face is visible in the best view of the neighborhood triangular face, the jagged triangular face is sorted into one of three categories based on the best view labels of the first-order neighborhood triangular mesh of the sawtooth triangular mesh. Type (I) is a fully enclosed jagged triangular face, i.e., the first-order neighborhood mesh view labels are exactly the same with one kind of label, as shown in the green box in
Figure 9a. Type (II) is a semi-enclosed jagged triangular face, i.e., the first-order neighborhood grid view labels are not exactly the same; there are two kinds of labels, as shown in the orange box in
Figure 9a. Type (III) is an unenclosed jagged triangular face, that is, the first-order neighborhood grid view labels are not exactly the same, and there are three kinds of labels, as shown in the red box in
Figure 9a. According to the type of jagged triangular face, different methods are used for smoothing, as follows:
- (I)
Fully enclosed: The view labels of the triangular faces in the first-order neighborhood of the jagged triangular face are identical and have one view label. The jagged triangular face is smoothed into the view label of the neighborhood triangular faces, and the smoothing result is shown in the green box in
Figure 9b;
- (II)
Semi-enclosed: The view labels of the triangular faces in the first-order neighborhood of the jagged triangular face are not identical and have two view labels. The jagged triangular face is smoothed into the view label with a large number of neighbor triangular face labels, and the smoothing result is shown in the orange box in
Figure 9b;
- (III)
Unenclosed: The view labels of the triangular faces in the first-order neighborhood of the jagged triangular face are completely different and have three view labels. The jagged triangular face is smoothed into the view label with the largest number of edge-length neighbor triangular face labels, and the smoothing result is shown in the red box in
Figure 9b.
4. Experiments and Analyses
The method proposed in this paper was embedded into NewMap-IMS software, which is a reality modeling software that was independently developed by the authors at the Chinese Academy of Surveying and Mapping. A 4.0 km × 2.5 km built-up urban area in Shandong Province, China, was chosen as the experimental area. A 5-lens (1 vertical-view lens + 4 side-view lenses) UltraCam Osprey Prima (UCOp) camera was used in 29 flights to collect 11,795 images, totaling 2.08 TB of data. The corresponding reconstruction area is approximately 10 km
2. The reconstruction area is divided into 173 subareas with a grid size of 250 m × 250 m, as shown in
Figure 10. The operating environment is a standard personal computer equipped with the Windows 10 64-bit operating system, an Intel Xeon(R) E3-1535 M CPU with a dominant frequency of 3.10 GHz, and 64 GB of memory. The effectiveness and superiority of the proposed method are validated by comparatively analyzing the proposed method and the method proposed by Waechter et al. [
8]. The experiments are composed of three parts: a comparative analysis of the texture reconstruction efficiency, a comparative analysis of the texture reconstruction results, and a comparative analysis of the number of texture charts.
4.1. Texture Reconstruction Efficiency Comparison Verification
In the reconstruction area, six groups of areas covering 0.5 km2, 1.0 km2, 1.5 km2, 2 km2, 5 km2, and 10 km2 were selected for texture reconstruction experiments, and the number of triangular faces in the experimental area ranged from 9,489,605–189,659,620 faces. The method in this paper uses a 250 m × 250 m grid size to partition the reconstructed area, while the Waechter method does not partition; the efficiencies of the Waechter method and the method in this paper are measured for comparative analysis.
- (1)
Reconstruction time comparison
The time consumption statistics for the two methods of texture reconstruction in experimental areas of varying sizes are shown in
Table 1, and a corresponding bar graph is presented in
Figure 11. In addition, the method in this paper has already preprocessed the scene segmentation of the reconstructed area, and the statistical time does not include the scene segmentation time.
As illustrated in
Table 1 and
Figure 11, the following conclusions can be drawn. (i) With increasing experimental area, the time consumption of both methods increases, but overall, the time consumption of the method proposed in this paper is lower than that of the Waechter method. With the increase in the number of triangular faces, the time consumption of the global graph-cut optimization algorithm in selecting the best view for triangular faces increases. However, our method uses regular grid partitioning to reduce the number of triangular faces, which avoids the time-consuming problem of global optimization that is caused by too many triangular faces. (ii) The Waechter method is applicable only for texture reconstruction within a small area (≤2 km
2). When the experimental area is too large (>2 km
2), the use of the Waechter method leads to computer crashes because of the excessive amount of data that needs to be processed. (iii) Within the reconstructable scope (≤2 km
2), the time consumption of this method is slightly lower than that of the Waechter method, but the difference is not significant.
- (2)
Memory consumption comparison
The memory consumption statistics of the two methods for texture reconstruction in experimental areas of varying sizes are shown in
Table 2, and a corresponding bar graph is presented in
Figure 12.
As illustrated in
Table 2 and
Figure 12, the following conclusions can be drawn. (i) Similar to the time consumption, the memory consumption of both methods increases with increasing experimental area. However, the memory consumption of the proposed method increases only slowly, whereas the Waechter method incurs significantly higher memory consumption that increases relatively rapidly. (ii) When the experimental area is large (>2 km
2), the use of the Waechter method in a single-computer environment leads to computer crashes due to memory limitations, resulting in a failure to complete the texture reconstruction. (iii) The memory consumption of the Waechter method is approximately 2–13 times greater than that of the proposed method within the reconstructable scope.
4.2. Texture Reconstruction Result Comparison Verification
The Waechter method is not applicable to the texture reconstruction of large-scale model data. To better compare the texture reconstruction results, the Waechter method also uses 3D model data after regular grid partitioning to verify the effectiveness of the method in this paper. The two methods select the building region (region 1 in
Figure 13) and the nonbuilding region (region 2 in
Figure 13) for experiments, as shown in
Figure 13.
- (1)
Texture reconstruction correctness comparison verification.
In the above-mentioned building area and nonbuilding area, the texture reconstruction results of the two methods are tested, and two different regions are selected for each type of region to evaluate the texture reconstruction results. The comparison and verification of the texture reconstruction results are shown in
Figure 14 and
Figure 15.
Figure 14b,c and
Figure 15b,c are the texture reconstruction results of the Waechter method and the method in this paper, respectively, in the building region. It is clear that the buildings in this region are dense and mutually occluded. After scene segmentation, the occluded relationship of the triangular mesh is incorrect. The Waechter method is used for texture reconstruction, and the corresponding texture reconstruction results are incorrect. The method in this paper first uses a triangular mesh of neighborhood blocks to restore the occlusion relation and then performs texture reconstruction, where the corresponding result of texture reconstruction is correct.
Figure 14e,f and
Figure 15e,f are the texture reconstruction results of the Waechter method and this method in nonbuilding areas, respectively. It is clear that there are no buildings and no occlusion in this region. After scene segmentation, the occlusion relationship of the triangular faces is correct. The Waechter method is used for texture reconstruction, and the texture reconstruction results are correct, but there is a problem based on the texture seams. The method in this paper first uses triangular faces of the neighborhood blocks to restore the occlusion relations and then performs texture reconstruction, and the result of texture reconstruction is correct, alleviating the problem of texture seams.
4.3. Texture Reconstruction Fragment-Count Comparison Verification
In the above-mentioned building area and nonbuilding area, the texture charts of the two methods are tested, and two different regions are selected for each type of region to evaluate the texture charts. The comparison and verification of the texture charts are shown in
Figure 16 and
Figure 17.
Figure 14b,c and
Figure 15b,c are the texture reconstruction results of the Waechter method and the method in this paper, respectively, in the building region. It is clear that the buildings in this region are dense and mutually occluded. The Waechter method is used for texture reconstruction, and the number of texture charts is large, making the scenario prone to the problem of texture seams. The method in this paper uses the scene structure to optimize the view selection of the neighborhood triangular faces, and the number of texture reconstructed fragments is greatly reduced, which can alleviate the problem of seams.
Figure 16e,f and
Figure 17e,f are the texture charts of the Waechter method and this method in nonbuilding areas, respectively. It is clear that there are no buildings and no occlusions in this region. The number of texture-reconstructed fragments for the Waechter method is also large, while the number of texture charts for the method in this paper is greatly reduced.
The statistics for the number of texture charts for both methods in the building area are shown in
Table 3, and the corresponding bar graph is presented in
Figure 18.
The statistics of the number of texture charts for both methods in the nonbuilding area are shown in
Table 4, and the corresponding bar graph is presented in
Figure 19.
From
Table 3 and
Table 4 and
Figure 18 and
Figure 19, it can be determined that the number of texture charts in this paper’s method is reduced by 30% on average in two different experimental regions. This can alleviate the problems of texture reconstruction errors and stitching seams, reflecting the effectiveness and superiority of this paper’s method.
5. Conclusions
Texture reconstruction is the last step of 3D model reconstruction, which can produce the color, material, and other information of the 3D model and is one of the key steps for improving the visual expression of the 3D model. At present, projection-based reconstruction is mostly used for the texture reconstruction of oblique photography 3D models. A more mature method involves modeling the adjacency relationship between triangular faces and faces through the MRF. Through the combined optimization of the MRF, this method can select the best texture for each triangular mesh that is suitable for the texture reconstruction of small-scale 3D models. However, large-scale texture reconstruction has some problems, such as a long calculation time, a large memory consumption, and reconstruction failure in large-scale texture reconstruction. Based on this, this paper proposes a block texture reconstruction method suitable for large-scale oblique photography 3D models. Each block is used as the basic unit of texture reconstruction, the hierarchical relationship between blocks is established “from inside to outside”, and the texture is reconstructed block by block. Under the premise of the correct texture reconstruction results, the method in this paper can improve the efficiency of texture reconstruction and reduce the number of texture charts. Experiments were conducted using real survey data to evaluate the rationality and effectiveness of the proposed method, and the following conclusions were drawn:
- (1)
In terms of texture reconstruction efficiency, when implemented on a standard personal computer, the Waechter method is applicable only for texture reconstruction in a small area (≤2 km2). When the experimental area is large (>2 km2), the use of the Waechter method leads to computer crashes because of the excessive amount of data that needs to be processed. Within the scope of reconstructable experiments, the time consumption of the method in this paper is slightly lower than that of the Waechter method, but the difference is not significant. However, the memory consumption of the Waechter method is approximately 2–13 times greater than that of the proposed method;
- (2)
In terms of texture reconstruction results, compared with the mature Waechter method, the method in this paper can correctly reconstruct the texture of the wrongly occluded area at the edge of the block; in the area where the small model fails to correctly reconstruct the area inside the block, the method in this paper can improve the quality of texture reconstruction;
- (3)
In terms of the number of texture charts, compared with the mature Waechter method, the method in this paper reduces the number of texture color blocks by 30%, and the texture reconstruction quality is better, which can avoid the problem of texture seams.
In our future research, the following insufficiency of the proposed method will be extensively studied: each block is used as a texture reconstruction unit, and each unit is reconstructed independently, which has the problem of inconsistent texture color between blocks and reduces the overall visualization effect of the 3D model. The next step is to construct a global color adjustment function based on the pixel color of the same name point between blocks to smooth the color difference of the texture between blocks and improve the quality of texture reconstruction.
Author Contributions
Conceptualization, F.W. and H.Z.; methodology, F.W., Z.L. and H.Z.; software, F.W. and Z.L.; Experiment, F.W., H.C., W.Q. and S.Z.; writing—original draft preparation, F.W. and H.Z.; supervision, Z.L. All authors have read and agreed to the published version of the manuscript.
Funding
This work was supported by the auspices of the National Natural Science Foundation of China (Grant No. 41971339), National Key Research and Development Project of China (Grant Nos. 2018YFB2100704, 2018YFC1407605), Basal Research Fund of CASM (Grant Nos. AR2107, AR2108, AR2120), and SDUST Research Fund (Grant No. 2019TDJH103).
Conflicts of Interest
The authors declare no conflict of interest.
References
- Allene, C.; Pons, J.-P.; Keriven, R. Seamless image-based texture atlases using multi-band blending. In Proceedings of the 2008 19th International Conference on Pattern Recognition, Tampa, FL, USA, 8 December 2008; pp. 1–4. [Google Scholar]
- Bernardini, F.; Martin, I.M.; Rushmeier, H. High-quality texture reconstruction from multiple scans. IEEE Trans. Vis. Comput. Graph. 2001, 7, 318–332. [Google Scholar] [CrossRef] [Green Version]
- Callieri, M.; Cignoni, P.; Corsini, M.; Scopigno, R. Masked photo blending: Mapping dense photographic data set on high-resolution sampled 3D models. Comput. Graph. 2008, 32, 464–473. [Google Scholar] [CrossRef] [Green Version]
- Chen, Z.; Zhou, J.; Chen, Y.; Wang, G. 3D Texture Mapping in Multi-view Reconstruction. In Proceedings of the International Symposium on Visual Computing, Rethymnon, Greece, 16–18 July 2012. [Google Scholar]
- Lempitsky, V.; Ivanov, D. Seamless Mosaicing of Image-Based Texture Maps. In Proceedings of the IEEE Conference on Computer Vision and Pattern Recognition, Minneapolis, MN, USA, 17–22 June 2007. [Google Scholar]
- Li, S.; Xiao, X.; Guo, B.; Zhang, L. A Novel OpenMVS-Based Texture Reconstruction Method Based on the Fully Automatic Plane Segmentation for 3D Mesh Models. Remote Sens. 2020, 12, 3908. [Google Scholar] [CrossRef]
- Frue, C.; Jain, S.; Zakhor, A. Data Processing Algorithms for Generating Textured 3D Building Facade Meshes from Laser Scans and Camera Images. Int. J. Comput. Vis. 2005, 61, 159–184. [Google Scholar] [CrossRef] [Green Version]
- Waechter, M.; Moehrle, N.; Goesele, M. Let There Be Color! Large-Scale Texturing of 3D Reconstructions. In Proceedings of the European Conference on Computer Vision, Zurich, Switzerland, 6–12 September 2014. [Google Scholar]
- Li, M.; Guo, B.; Zhang, W. An Occlusion Detection Algorithm for 3D Texture Reconstruction of multi-View Images. Int. J. Mach. Learn. Comput. 2017, 7, 152–155. [Google Scholar] [CrossRef]
- Kim, H.S.; Ban, Y.J.; Park, C.J. A seamless texture color adjustment method for large-scale terrain reconstruction. In ACM SIGGRAPH 2018 Posters; Association for Computing Machinery: New York, NY, USA, 2018; p. 56. [Google Scholar]
- Zeng, M.; Zhao, F.; Zheng, J.; Liu, X. Octree-based fusion for realtime 3D reconstruction. Graph. Model. 2013, 75, 126–136. [Google Scholar] [CrossRef]
- Mostegel, C.; Prettenthaler, R.; Fraundorfer, F.; Bischof, H. Scalable Surface Reconstruction from Point Clouds with Extreme Scale and Density Diversity. In Proceedings of the IEEE Conference on Computer Vision and Pattern Recognition (CVPR), Honolulu, HI, USA, 21–26 July 2017. [Google Scholar]
- Liu, J.; Mills, S.; Mccane, B. RocNet: Recursive Octree Network for Efficient 3D Deep Representation. In Proceedings of the 2020 International Conference on 3D Vision (3DV), Fukuoka, Japan, 25–28 November 2020. [Google Scholar]
- Yujian, W.; Shaowei, T.; Weiwei, D.; Wenpeng, J. Research on 3D modeling method based on hybrid octree structure. Open Electr. Electron. Eng. J. 2014, 8, 323–329. [Google Scholar] [CrossRef] [Green Version]
- Han, J.; Shen, S. Scalable point cloud meshing for image-based large-scale 3D modeling. Vis. Comput. Ind. Biomed. Art 2019, 2, 10. [Google Scholar] [CrossRef] [PubMed]
- Wang, F.; Liu, Z.; Zhu, H.; Wu, P. A Parallel Method for Open Hole Filling in Large-Scale 3D Automatic Modeling Based on Oblique Photography. Remote Sens. 2021, 13, 3512. [Google Scholar] [CrossRef]
- Zhang, S.; Liu, W. Single image 3D reconstruction based on control point grid. Multimed. Tools Appl. 2018, 77, 31875–31893. [Google Scholar] [CrossRef]
- Zhu, L.; Shen, S.; Gao, X.; Hu, Z. Urban Scene Vectorized Modeling Based on Contour Deformation. ISPRS Int. J. Geo-Inf. 2020, 9, 162. [Google Scholar] [CrossRef] [Green Version]
- Bakshi, N.; Shivani, S.; Tiwari, S.; Khurana, M. Optimized Z-Buffer Using Divide and Conquer. In Innovations in Computational Intelligence and Computer Vision; Springer: Singapore, 2021; pp. 41–47. [Google Scholar]
- Greene, N.; Kass, M.; Miller, G. Hierarchical Z-buffer visibility. In Proceedings of the 20th Annual Conference on Computer Graphics And Interactive Techniques, Anaheim, CA, USA, 2–6 August 1993; pp. 231–238. [Google Scholar]
- Boykov, Y.; Veksler, O.; Zabih, R. Fast approximate energy minimization via graph cuts. IEEE Trans. Pattern Anal. Mach. Intell. 2001, 23, 1222–1239. [Google Scholar] [CrossRef] [Green Version]
- Schmidt, M.; Alahari, K. Generalized fast approximate energy minimization via graph cuts: Alpha-expansion beta-shrink moves. arXiv 2011, arXiv:1108.5710 2011. [Google Scholar]
- Ming, L.; Weilong, Z.; Dingyuan, F. Automatic texture optimization for 3D urban reconstruction. Acta Geod. Et Cartogr. Sin. 2017, 46, 338. [Google Scholar]
- Ringbeck, T.; Hagebeuker, B. A Performance Review of 3D TOF Vision Systems in Comparison to Stereo Vision Systems. In Stereo Vision; I-Tech: Vienna, Austria, 2008; pp. 103–121. [Google Scholar]
- Zureiki, A.; Devy, M.; Chatila, R. Stereo matching and graph cuts. In Stereo Vision; I-Tech: Vienna, Austria, 2008; pp. 349–372. [Google Scholar]
Figure 1.
Basic principle of reconstruction using the Han method. (a) Partitioning grid; (b) mesh reconstruction; (c) mesh merging; and (d) texture reconstruction.
Figure 1.
Basic principle of reconstruction using the Han method. (a) Partitioning grid; (b) mesh reconstruction; (c) mesh merging; and (d) texture reconstruction.
Figure 2.
Occlusion relation error. (a) Original occlusion relation, (b) correct occlusion relationship after segmentation, and (c) incorrect occlusion relationship after segmentation.
Figure 2.
Occlusion relation error. (a) Original occlusion relation, (b) correct occlusion relationship after segmentation, and (c) incorrect occlusion relationship after segmentation.
Figure 3.
Flowchart of a parallel method for texture construction.
Figure 3.
Flowchart of a parallel method for texture construction.
Figure 4.
Calculation of hierarchical relationships. (a) Original partition grids and their reconstruction areas and (b) the hierarchical relationship calculation for reconstruction.
Figure 4.
Calculation of hierarchical relationships. (a) Original partition grids and their reconstruction areas and (b) the hierarchical relationship calculation for reconstruction.
Figure 5.
Extraction of the building contour model. (a) Original mesh, (b) digital surface model (DSM), (c) building contour extraction and (d) extraction results of the building contour model.
Figure 5.
Extraction of the building contour model. (a) Original mesh, (b) digital surface model (DSM), (c) building contour extraction and (d) extraction results of the building contour model.
Figure 6.
Neighborhood tile classification. (a) Type I, (b) current tile, and (c) Type II.
Figure 6.
Neighborhood tile classification. (a) Type I, (b) current tile, and (c) Type II.
Figure 7.
Triangular face classification. (1) Green means completely visible, (2) yellow means partially visible, and (3) gray means completely invisible.
Figure 7.
Triangular face classification. (1) Green means completely visible, (2) yellow means partially visible, and (3) gray means completely invisible.
Figure 8.
Multi-labeled directed graph.
Figure 8.
Multi-labeled directed graph.
Figure 9.
View label smoothing. (a) Unsmoothed label and (b) smoothed label.
Figure 9.
View label smoothing. (a) Unsmoothed label and (b) smoothed label.
Figure 10.
Experimental area.
Figure 10.
Experimental area.
Figure 11.
Bar graph for the time consumption comparison.
Figure 11.
Bar graph for the time consumption comparison.
Figure 12.
Bar graph for the memory consumption comparison.
Figure 12.
Bar graph for the memory consumption comparison.
Figure 13.
Texture reconstruction results of the experimental area.
Figure 13.
Texture reconstruction results of the experimental area.
Figure 14.
Texture reconstruction results obtained via the Waechter algorithm. (a) texture results for building area; (b,c) the texture reconstruction result of building area via Waechter method; (d) texture results for nonbuilding area; (e,f) the texture reconstruction results of nonbuilding area via Waechter method. red frame is the local detail area; red circle is the experimental comparison area.
Figure 15.
Texture reconstruction results obtained via the method proposed in this article. (a) texture results for building area; (b,c) the texture reconstruction result of building area via the method proposed in this article; (d) texture results for non-building area; (e,f) the texture reconstruction results of non-building area via the method proposed in this article. red frame is the local detail area; red circle is the experimental comparison area.
Figure 16.
Texture charts obtained via the Waechter algorithm. (a) texture charts for building area; (b,c) the texture charts of building area via Waechter method; (d) texture charts for nonbuilding area; (e,f) the texture charts of nonbuilding area via Waechter method. red frame is the local detail area; red circle is the experimental comparison area.
Figure 17.
Texture charts obtained via the method proposed in this article. (a) texture charts for building area; (b,c) the texture charts of building area via the method proposed in this article; (d) texture charts for non-building area; (e,f) the texture charts of non-building area via the method proposed in this article. red frame is the local detail area; red circle is the experimental comparison area.
Figure 18.
Bar graph for the number of texture charts in building experimental area comparison.
Figure 18.
Bar graph for the number of texture charts in building experimental area comparison.
Figure 19.
Bar graph for the number of texture charts with debris in the nonbuilding experimental area comparison.
Figure 19.
Bar graph for the number of texture charts with debris in the nonbuilding experimental area comparison.
Table 1.
Comparison of the time consumed using the two methods for texture reconstruction in different experimental areas.
Table 1.
Comparison of the time consumed using the two methods for texture reconstruction in different experimental areas.
| | | 0.5 km2 | 1 km2 | 1.5 km2 | 2 km2 | 5 km2 | 10 km2 |
|---|
| Time | Waechter method | 56.9 | 116.3 | 196.8 | 289.6 | OOM | OOM |
| Our method | 50.2 | 105.4 | 165.3 | 221.7 | 519.8 | 1242.9 |
Table 2.
Comparison of the memory consumed using the two methods for texture reconstruction in different experimental areas.
Table 2.
Comparison of the memory consumed using the two methods for texture reconstruction in different experimental areas.
| | | 0.5 km2 | 1 km2 | 1.5 km2 | 2 km2 | 5 km2 | 10 km2 |
|---|
| Memory | Waechter method | 26.7 | 56.9 | 93.28 | 172.9 | OOM | OOM |
| Our method | 11.8 | 12.1 | 12.2 | 12.5 | 12.9 | 13.3 |
Table 3.
Comparison of the number of texture charts using the two methods for texture reconstruction in the building experimental areas.
Table 3.
Comparison of the number of texture charts using the two methods for texture reconstruction in the building experimental areas.
| | Tile_1 | Tile_2 | Tile_3 | Tile_4 | Tile_5 | Tile_6 |
|---|
| Original Mesh | 171,014 | 225,314 | 232,495 | 231,846 | 204,792 | 119,387 |
| Waechter method | 9912 | 12,546 | 14,153 | 12,068 | 16,824 | 7866 |
| Our method | 6918 | 7289 | 9948 | 7365 | 11794 | 5043 |
Table 4.
Comparison of the number of texture charts using the two methods for texture reconstruction in non-building experimental areas.
Table 4.
Comparison of the number of texture charts using the two methods for texture reconstruction in non-building experimental areas.
| | Tile_7 | Tile_8 | Tile_9 | Tile_10 | Tile_11 | Tile_12 |
|---|
| Original mesh | 144,923 | 144,673 | 155,273 | 146,916 | 156,328 | 153,850 |
| Waechter method | 6333 | 6661 | 5426 | 8315 | 7868 | 9964 |
| Our method | 3549 | 3196 | 2529 | 4838 | 4615 | 6096 |
| Publisher’s Note: MDPI stays neutral with regard to jurisdictional claims in published maps and institutional affiliations. |
© 2022 by the authors. Licensee MDPI, Basel, Switzerland. This article is an open access article distributed under the terms and conditions of the Creative Commons Attribution (CC BY) license (https://creativecommons.org/licenses/by/4.0/).


