Abstract
Monitoring the variations in terrestrial water storage (TWS) is crucial for understanding the regional hydrological processes, which helps to allocate and manage basin-scale water resources efficiently. In this study, the impacts of climate change, glacier mass loss, and human activities on the variations in TWS of the Qaidam Basin over the period of 2002−2020 were investigated by using Gravity Recovery and Climate Experiment (GRACE) and GRACE Follow-On (GRACE-FO) data, and other hydrological and meteorological data. The results indicate that TWS anomalies (TWSA) derived from five GRACE solutions experienced significant increasing trends over the study period, with the change rates ranging from 4.85 to 6.90 mm/year (1.37 to 1.95 km3/year). The GRACE TWSA averaged from different GRACE solutions exhibited an increase at a rate of 5.83 ± 0.12 mm/year (1.65 ± 0.03 km3/year). Trends in individual components of TWS indicate that the increase in soil moisture (7.65 mm/year) contributed the most to the variations in TWS. Through comprehensive analysis, it was found that the temporal variations in TWS of the Qaidam Basin were dominated by the variations in precipitation, and the spatial variations in TWS of the Qaidam Basin were mostly driven by the increase in glacier meltwater due to climate warming, particularly in the Narin Gol Basin. In addition, the water consumption associated with human activities had relatively fewer impacts.
1. Introduction
Terrestrial water storage (TWS) refers to an integrated estimate of water stored on and beneath the land surface, including soil moisture, groundwater, surface water (lakes, rivers, and reservoirs), snow, glaciers, and plant canopy water, and is of great significance to the terrestrial and global hydrological cycles [1,2]. The variations in TWS can effectively indicate the balance or imbalance of water fluxes strongly affected by regional climate conditions [2]. The recent global warming has exacerbated the variability of TWS in many arid and semi-arid regions, as well as alpine regions [3,4,5]. Hence, accurate estimation of TWS is crucial for understanding the regional hydrological process, which helps to allocate and manage basin-scale water resources efficiently.
The Qaidam Basin, an arid-to-semi-arid endorheic basin in the Tibetan Plateau, is facing the problems of water scarcity and a fragile ecological environment [6]. The Qaidam Basin is considered to be the most susceptible region with the most significant warming in the Tibetan Plateau [7], which has a profound impact on water resources in this region, such as glacier retreat and drastic changes in the lake area. It is thus of vital significance to understand the impacts of climate change, glacier mass loss, as well as human activities on spatiotemporal variations in TWS of the Qaidam Basin. However, observation stations are sparse in high mountain regions, and the in situ observations only provide information on individual hydrological variables at point scales [8], which limits our understanding of TWS variations in this region.
The Gravity Recovery and Climate Experiment (GRACE) mission, a twin satellite-to-satellite tracking mission launched in March 2002, enables us to measure the mean and time-varying components of the Earth’s gravity field [9]. Since the change of the Earth’s gravity field is dominated by hydrological signals, the variations in TWS can be accurately quantified using GRACE data [10,11,12]. Despite the coarser spatial resolution (~300 km), GRACE can reveal the water storage changes with a precision of 1–1.5 cm across the globe [13]. After the retirement of the GRACE mission in October 2017, its follow-on mission, launched in May 2018, continues to provide consecutive data for the hydrological applications [14].
GRACE observations have been used to assess the variations in TWS of the Qaidam Basin in several studies. Jiao et al. [15] and Wei et al. [16] investigated the variations in TWS of the Qaidam Basin and the impacts of climate indices and meteorological changes on TWS variations. Bibi et al. [17] and Hu and Jiao [18] estimated the variations in groundwater (GW) of the Qaidam Basin by using TWS, soil moisture (SM), surface water storage (SWS), and snow water equivalent (SWE) based on the water storage equation (GW = TWS − SM − SWS − SWE). The above studies only selected the mass concentration (Mascon) solutions of GRACE data; the uncertainties between spherical harmonics (SH) solutions and mascon solutions were not taken into consideration. In addition, they mostly focused on some individual components of TWS, and the variations in surface water and glacier mass balance were generally ignored. Moreover, the analysis of the impacts of glacier mass loss and human water consumption on the variations in TWS is still lacking.
In this study, we intended to present a comprehensive analysis of the impacts of climate change, glacier mass loss, and human activities on spatiotemporal variations in TWS of the Qaidam Basin. The objectives of this study were as follows: (1) to evaluate the spatial and temporal variations in TWS of the Qaidam Basin over the past two decades; (2) to quantify the inter-annual variations in all components of TWS and their contributions to the variations in TWS; (3) to explore the potential driving factors affecting the spatiotemporal variations in TWS of the Qaidam Basin from the perspectives of climate change, glacier mass loss and human activities.
2. Study Area
The Qaidam Basin is a closed inland basin located in the northwestern Qinghai Province and the northeastern Tibetan Plateau, China, with a spatial range of approximately 34°30′–39°30′ N, 87°30′–99°30′ E (Figure 1). It is surrounded by the Kunlun Mountains in the south, the Qilian Mountains in the northeast, and the Altyn Tagh Mountains in the northwest [17]. The elevation of the basin ranges from 2636–6835 m, with an average elevation of over 4000 m in the surrounding mountains and approximately 2800 m in the basin interior. The water resources in the Qaidam Basin mainly originate from glaciers and snowfields in the surrounding mountainous areas. According to the second glacial catalog dataset of China [19], there were 1939 glaciers distributed in the basin in 2006, covering an area of 1654.37 ± 74.05 km2.
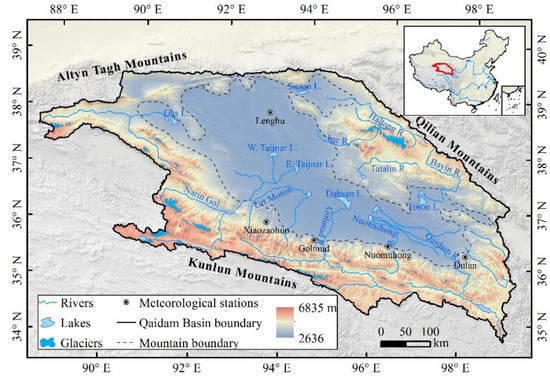
Figure 1.
Location map of the Qaidam Basin. The mountain boundary of the basin is also indicated.
The climate condition in the Qaidam Basin is typically alpine-arid continental, and there are obvious discrepancies between surrounding mountains and central plains. The annual mean temperature is about 4.8 °C in the central plains, while it is only about 1.5 °C in the surrounding mountains [18]. The spatial distribution of precipitation is uneven, which decreases from the periphery to the interior of the basin. The annual total precipitation ranges from approximately 16 mm in the central part of the basin to about 190 mm in the surrounding mountains.
3. Data and Methods
3.1. Data
3.1.1. GRACE/GRACE-FO Data
The GRACE/GRACE-FO data are available in two forms, including spherical harmonics (SH) solutions and mass concentration (Mascon) solutions [20]. The SH solutions have been the standard for the first decade of GRACE observations, which utilize global SH basis functions to parameterize the earth gravity field model [16,21]. The monthly GRACE/GRACE-FO SH solutions are released by the Scientific Data System composed of three processing centers: Center for Space Research, University of Texas (CSR), Jet Propulsion Laboratory (JPL), and Geo-Forschungs-Zentrum (GFZ). The mascon solutions utilize mass concentration blocks to parameterize the earth gravity field model, which makes the implementation of geophysical constraints much easier and can improve the GRACE gravity information for the study of Earth surface processes [22,23,24].
In this study, the latest Release-06 (RL06) Level-2 SH solutions from CSR (CSR-SH), JPL (JPL-SH), and GFZ (GFZ-SH) (available at: ftp://isdcftp.gfz-potsdam.de/grace/, accessed on 1 June 2021) and the gridded RL06 version 02 mascon data processed by CSR (CSR-M) (http://www2.csr.utexas.edu/grace/RL06_mascons.html, accessed on 1 July 2021) and JPL (JPL-M) (https://grace.jpl.nasa.gov/data/get-data/jpl_global_mascons, accessed on 1 July 2021) (Table 1) were selected to estimate the variations in TWSA of the Qaidam Basin. The data covered the period of April 2002 to December 2020, for a total of 192 months, including 163 months from GRACE (April 2002 to June 2017) and 29 months from GRACE-FO (June 2018 to December 2020). The missing data of GRACE were interpolated by average values from adjacent months, and the 11-month data gap between GRACE and GRACE-FO was not remedied since it was caused by the discontinuation of satellites [25,26].

Table 1.
The GRACE/GRACE-FO data used in this study.
3.1.2. GLDAS Data
The Global Land Data Assimilation System (GLDAS) is a land surface modeling system that aims to generate optimal fields of land surface states and fluxes based on satellite- and ground-based observations, using advanced land surface modeling and data assimilation techniques [27]. GLDAS includes five different land surface models, namely Noah, Mosaic, the Community Land Model (CLM), the Variable Infiltration Capacity (VIC), and Catchment (CLSM). Several studies have confirmed that the Noah model is the most robust global land surface model in GLDAS [28]. Therefore, the soil moisture, snow water equivalent, and plant canopy water data over the period of 2002–2020 were obtained from the latest GLDAS-2.1 Noah model outputs (https://disc.gsfc.nasa.gov, accessed on 1 June 2021), with a spatial resolution of 0.25°. The soil moisture is the sum of soil moisture in all soil profiles, including soil moisture content in 0–10 cm, 10–40 cm, 40–100 cm, and 100–200 cm underground, and root zone soil moisture.
3.1.3. Glacier Data
The glacier data of the Qaidam Basin in 2006 were taken from the second glacial catalog dataset of China (v1.0) published by the National Cryosphere Desert Data Center (http://www.ncdc.ac.cn, accessed on 1 December 2019) [19]. This dataset was compiled based on 218 Landsat TM/ETM+ images collected mainly from 2006 to 2010, and the glaciers in the study area were mainly concentrated in 2006. The widely used band ratio segmentation method was applied as the first step in extracting the glacier outlines, and intensive manual improvements were performed then [29]. This dataset provides several attributes for individual glaciers, and the area and volume of glaciers were used in this study.
The glacier data in 2016 were derived in this study. Since many debris-covered glaciers distributed in the Qaidam Basin, which are difficult to identify using automatic classification method, the glacier outlines were manually delineated here. A total of 26 Landsat OLI images, 2016, obtained from the United States Geological Survey (USGS) (http://earthexplorer.usgs.gov, accessed on 1 December 2019) were mainly used to delineate glacier outlines. Moreover, Google Earth images and SAR images [30,31,32] were used as reference images to help identify the debris-covered glaciers as well as illegible glaciers in Landsat images. After glacier delineation, the area of individual glaciers was calculated on the WGS84 spheroid in an Albers equal-area map projection. The glacier volume was estimated using the volume-area (V-A) scaling method based on empirical parameters proposed by Radić and Hock [33], which is the same as that used in the second glacial catalog dataset of China.
3.1.4. Meteorological Data
The monthly precipitation data from five meteorological stations in the Qaidam Basin (Figure 1, Table 2) for the period 2002–2020 were obtained from the National Meteorological Information Center of the China Meteorological Administration (CMA) (available at: http://data.cma.cn/, accessed on 1 July 2021). The meteorological stations are sparse in the Qaidam Basin, especially in alpine areas. Therefore, monthly precipitation data from GLDAS-2.1 Noah model outputs from 2002 to 2020 were also used in this study. To ensure the accuracy of the precipitation data, we compared GLDAS data with five CMA meteorological stations located in the Qaidam Basin. In addition, it is quite difficult to obtain the actual evapotranspiration from the observation stations, especially in the Qaidam Basin. Therefore, the evapotranspiration data during the period 2002 to 2020 were also obtained from GLDAS-2.1 Noah model outputs [8,34].
Table 2.
The location of meteorological stations in the Qaidam Basin.
3.1.5. Other Relevant Data
The water resources data of the Qaidam Basin during the period 2002–2020 were collected from the Qinghai Water Resources Bulletin, including the amount of surface water resources, groundwater resources, as well as water consumption. The water consumption includes the total water consumption and the water consumption for agricultural irrigation, forestry, husbandry, fishery, industry, resident, urban public, and eco-environment.
3.2. Methods
The main methods of this study include the processing of GRACE/GRACE-FO data, quantification of the contribution of TWS components to the variations in TWS based on the water storage equation, and assessment of the influencing factors of the variations in TWS based on water balance elements, glacier mass balance, and data for human water consumption.
3.2.1. GRACE/GRACE-FO Data Processing
The formula of converting SH solutions observed by GRACE and GRACE-FO to the variations in TWS expressed by equivalent water height (EWH) is as follows [35]:
where is the mean density of the Earth (the constant is 5517 kg/m3), is the density of water (the constant is 1000 kg/m3), is the equatorial radius (the constant is 6378136.33 m), and are the geocentric latitude and longitude, and are the SH coefficients anomalies, is the Loew coefficient, and is the normalized Legendre function, with maximum degree l and order m expanded to 60.
Five basic processing standards were applied to SH coefficients, including: (a) C20 terms replacement by solutions from Satellite Laser Ranging (SLR) [36], (b) the first-degree terms replacement by estimates from the atmosphere and ocean models [37], (c) Glacial Isostatic Adjustment (GIA) correction based on the model proposed by Geruo et al. [38], (d) mean baseline value subtraction from January 2004 to December 2009, and (e) grid value of equivalent water height with a spatial resolution of 0.25° transformation from SH coefficients. SH coefficients in the original data show obvious strip errors in space, generally oriented north to south, and there also exists large error in the high-degree terms of SH coefficients. Therefore, to reduce the north-south strip error and high-frequency noise, the SH solutions were smoothed with a Swenson destriping combined with a 300 km Gaussian smoothing [39,40]. Previous studies have shown that a Gaussian filter radius of 300 km is more appropriate, and it is commonly used [41,42].
The GRACE/GRACE-FO mascon solutions are provided in the form of equivalent water height. The post-processing was applied to the mascon solutions by following the above-mentioned steps (a)–(d), except that the GIA correction was applied based on the ICE-6G_D model from Peltier et al. [43] rather than the model from Geruo et al. [38] in step (c). The CSR-M and JPL-M solutions are provided at the spatial resolution of 0.25° and 0.5°, respectively. The JPL-M solution was then resampled at 0.25° by using nearest neighbor approach to keep consistent with TWSA from CSR-M and other SH solutions.
In this study, TWSA obtained from five GRACE solutions, including CSR-SH, JPL JPL-SH, GFZ-SH, CSR-M, and JPL-M, were compared during the period 2002 to 2020. TWSA within the basin was spatially averaged to obtain its monthly time series of it. To improve the signal-to-noise, GRACE TWSA was calculated by averaging the TWSA from five GRACE solutions [44,45]. When assuming the solution uncertainty as the major contributor, the standard deviation of TWSA among different solutions was calculated as the solution error [46]. In addition, the calibrated error of TWSA provided by JPL-M was also considered [47]. The total uncertainty of GRACE TWSA was calculated as:
where represents the total uncertainty, and are the solution error and calibrated error, respectively.
3.2.2. Water Storage Equation
TWS includes six major components, as shown in the following formula:
where refers to the terrestrial water storage, is surface water storage, is groundwater storage, is soil moisture storage, is snow water equivalent, is plant canopy water storage, and refers to glacier mass balance. The SWS, GWS, SMS, SWE, and CWS were calculated by using the same way as GRACE TWSA, calculating the basin-averaged monthly time series, and then subtracting the average values for the period of January 2004 to December 2009 to obtain the monthly time series anomalies. The components of TWS were represented as the equivalent water height (mm) or as equivalent water volume (km3).
3.2.3. Water Balance Equation
Precipitation (P), evapotranspiration (ET), and net water flux (P–ET) are key components of both atmospheric and terrestrial water balances, which have a vital impact on the variations of TWS [41,48]. For an endorheic basin, changes in TWS (∆TWS) can be estimated using the following formula:
In this study, the variations in P, ET, and P–ET were compared with the variation in TWS to assess the impacts of climate change on the variations in TWS of the Qaidam Basin.
4. Results
4.1. Variations in TWSA from GRACE
4.1.1. Spatial Pattern of TWSA Trends from GRACE
The spatial pattern of linear trends of TWSA derived from five GRACE solutions over the period of 2002 to 2020 is presented in Figure 2. TWSA from different GRACE solutions in the Qaidam Basin indicated significant increasing trends (p < 0.01) during the entire study period. The variation trends in TWSA from CSR-SH, JPL-SH, and GFZ-SH were relatively small, with the values ranging from 1.81 to 6.70 mm/year, 1.92 to 6.93 mm/year, and 4.01 to 7.90 mm/year, respectively (Figure 2a–c). However, obviously larger trends in TWSA were observed by CSR-M and JPL-M, especially in the southwest of the basin (Figure 2d,e). Although the spatial resolution of mascon solutions released by CSR and JPL are 0.25° and 0.5°, respectively, their native resolutions are 1° (∼120 km) and 3° (330 km), which is the reason for the differences in TWSA from CSR-M and JPL-M [22].
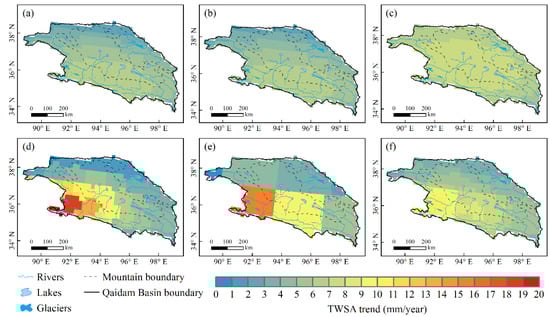
Figure 2.
The spatial variation trends in TWSA of the Qaidam Basin derived from CSR-SH (a), JPL-SH (b), GFZ-SH (c), CSR-M (d), JPL-M (e), and the variation trend in the average TWSA from five GRACE solutions (f), during the period of 2002–2020.
The GRACE TWSA was computed as the average of TWSA from five GRACE solutions, and the spatial variation of it in the Qaidam Basin is shown in Figure 2f. GRACE TWSA of the entire basin exhibited a significant increase during the period from 2002 to 2020, with the spatial variation trend ranging from 2.64 to 10.70 mm/year. As the rivers flow into the central basin from the mountainous area, the variation trend in GRACE TWSA generally increased from upstream mountains to the interior of the basin in space. The largest variation trend was mostly concentrated in the southwest and the smallest in the north of the basin.
4.1.2. Temporal Variations in TWSA from GRACE
The monthly time series of TWSA derived from different GRACE solutions during the period of 2002 to 2020 are displayed in Figure 3. TWSA from the five GRACE solutions agreed well in terms of amplitude and dynamics and were significantly correlated with the correlation coefficients larger than 0.80. TWSA from different GRACE solutions in the Qaidam Basin indicated significant increasing trends (p < 0.01) during the entire study period, with the change rates ranging from 4.85 to 6.90 mm/year, equivalent to the increase in water storage of 1.37 to 1.95 km3/year (Table 3). The increasing trends revealed by JPL-M (6.90 mm/year) and GFZ-SH (6.68 mm/year) were much larger than those of other solutions.
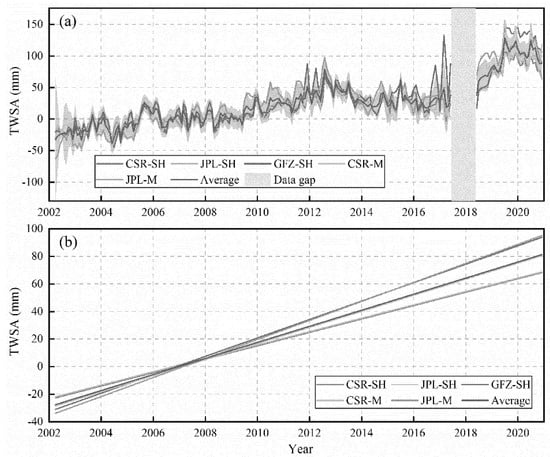
Figure 3.
The monthly time series of TWSA (a) and linear trends (b) derived from five GRACE solutions in the Qaidam Basin over the period of 2002–2020. In (a), the average TWSA series and the uncertainty bound are also shown with a blue solid line and light blue shaded area, respectively. The gray shaded region represents the gap of 11 months between GRACE and GRACE-FO data.
Table 3.
Trends in TWSA of the Qaidam Basin derived from five different GRACE solutions.
By averaging TWSA from five GRACE solutions, the GRACE TWSA exhibited an increase at a rate of 5.83 ± 0.12 mm/year, equivalent to the increase in water storage of 1.65 ± 0.03 km3/year. Specifically, the study period can be divided into two sub-periods (2002–2009 and 2009–2020). GRACE TWSA was mainly negative in the former sub-period and positive in the latter sub-period, indicating that the water storage of the Qaidam Basin was in deficit during the period of 2002–2009 and in surplus during the period of 2009–2020. Moreover, GRACE TWSA experienced a rapid increase after 2017, with a change rate of 22.82 ± 3.22 mm/year (6.46 ± 0.91 km3/year). The maximum positive TWSA of 128.52 ± 22.20 mm was observed in July 2019.
The annual cycles of TWSA derived from five GRACE solutions over the study period were also analyzed, as shown in Figure 4. The average TWSA of each month from different solutions was positive, indicating that water storage of the Qaidam Basin was mainly in surplus each month. However, TWSA of the Qaidam Basin displayed significant seasonal variabilities, with the minimum and maximum values of TWSA occurring in spring (March–May) and autumn (September–November), respectively. The variations of mean GRACE TWSA in different seasons from 2002 to 2020 are presented in Figure 5. It can be found that the increasing rate of TWSA was the largest in summer and the smallest in spring, with the values of 6.14 ± 0.41 mm/year and 5.48 ± 0.89 mm/year, equivalent to the increase in water storage of 1.74 ± 0.12 km3/year and 1.55 ± 0.25 km3/year, respectively.
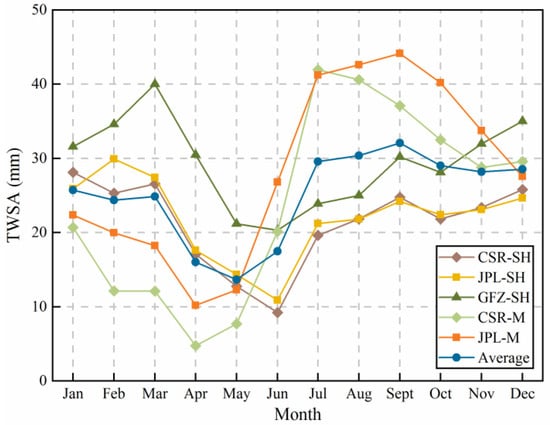
Figure 4.
The annual cycles of TWSA derived from five GRACE solutions in the Qaidam Basin over the period of 2002–2020.
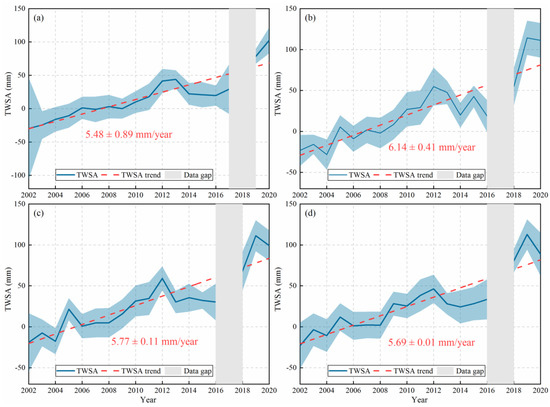
Figure 5.
The variations of mean TWSA in spring (March–May) (a), summer (June–August) (b), autumn (September–November) (c), and winter (December–February) (d) in the Qaidam Basin over the period of 2002–2020. TWSA here was the average TWSA from different GRACE solutions.
4.2. Variations in All Components of TWS
In this section, the variations in all components of TWS, including soil moisture, snow water equivalent, glacier mass balance, surface water, groundwater, and plant canopy water, were investigated. The variations in soil moisture anomalies, snow water equivalent anomalies, and plant canopy water anomalies of the Qaidam Basin derived from GLDAS are shown in Figure 6a–c. The soil moisture anomalies experienced an increase at a rate of 7.65 mm/year (2.16 km3/year) during the period from 2002 to 2020, which contributes ~131.17% to the variation in GRACE TWSA. This indicates a significant role of soil moisture in the variations in TWS of the Qaidam Basin. The snow water equivalent anomalies exhibited a slight increase at the rate of 0.06 mm/year (0.02 km3/year), and the plant canopy water remained basically unchanged (0.00 mm/year), suggesting a negligible role of the two components in TWS variations.
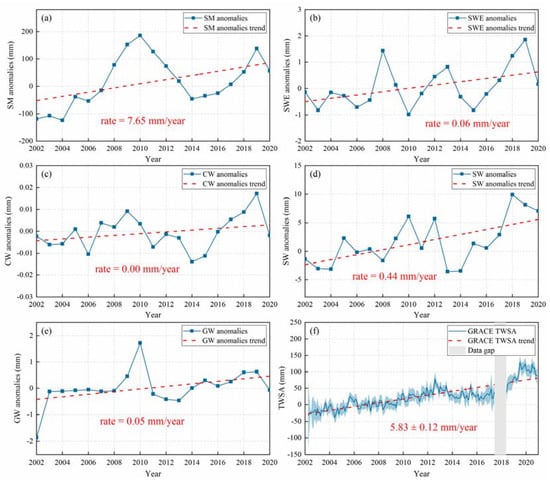
Figure 6.
The variations in soil moisture (SM) anomalies (a), snow water equivalent (SWE) anomalies (b), plant canopy water (CW) anomalies (c), surface water (SW) anomalies (d), groundwater (GW) anomalies (e), and GRACE TWSA (f) of the Qaidam Basin during the period of 2002 to 2020.
The variations in surface water anomalies and groundwater anomalies of the Qaidam Basin obtained from the Qinghai Water Resources Bulletin are presented in Figure 6d,e. The surface water of the Qaidam Basin increased at a rate of 0.44 mm/year over the period from 2002 to 2020, equivalent to the increase in water storage of 0.12 km3/year. The groundwater exhibited a slight increase at a rate of 0.05 mm/year (0.01 km3/year). The contributions of surface water and groundwater to the variation in TWSA of the Qaidam Basin were approximately 7.54% and 0.86%, respectively, indicating little effect of the two components on the variations in TWS.
Based on the second glacial catalog dataset of China and the glacier data derived in this study, we found that the glacier area in the Qaidam Basin reduced from 1654.37 ± 74.05 km2 in 2006 to 1587.66 ± 48.75 km2 in 2016, which reduced by 66.71 ± 88.65 km2 (4.03 ± 5.36%), at an average rate of 0.40 ± 0.54%. The glacier volume decreased by approximately 7.25 ± 5.22 km3 (7.10 ± 5.12%) over the 2006–2016 period, equivalent to the total loss of glacier mass of 6.16 ± 4.44 km3 w.e., by assuming a volume to mass conversion factor of 850 ± 60 kg/m3. Based on the glacier mass loss during 2006–2016, the annual glacier mass balance of the Qaidam Basin over the period of 2002–2020 was estimated to be −0.62 ± 0.44 km3 w.e./year (−2.18 ± 1.57 mm/year). For endorheic basins, glacier meltwater flows to rivers and eventually into the interior of the basin, which is an essential water resource supply in the basin. The glacier mass loss in the Qaidam Basin had a negative contribution of −37.38 ± 26.92% in the variation of TWS, indicating that the increase in glacier meltwater may lead to an increase in other components of TWS in this region.
Table 4 lists trends in all TWS components of the Qaidam Basin as well as their contributions to GRACE TWSA over the period of 2002 to 2020. The increase in TWS in the Qaidam Basin was mainly reflected by the increase in soil moisture and the loss of glacier mass. The increase in soil moisture contributed the most (~131.17%) to the variations in TWS. Despite that, the glacier mass loss had a negative contribution (−37.38 ± 26.92%) to the variations in TWS; the increase in glacier meltwater also contributed to the increase in other TWS components, particularly the soil moisture. In addition, other components of TWS had relatively little effect on the variations in TWS of the Qaidam Basin.
Table 4.
Trends in soil moisture, snow water equivalent, glacier mass balance, surface water, groundwater and plant canopy water and their contributions to GRACE TWSA during the period of 2002–2020.
5. Discussion
5.1. Impacts of Climate Change on the Variations in TWS
Climate change can affect the variations in TWS of the Qaidam Basin directly through precipitation and evapotranspiration. Figure 7 presents the variations in annual total precipitation from five meteorological stations during the period from 2002 to 2020. Four stations in the Qaidam Basin exhibited increases with the change rate ranging from 0.02 to 0.40 mm/year. Only Dulan station showed a decreasing trend (−0.47 mm/year). The meteorological stations in the Qaidam Basin are mainly distributed in plain areas, while the water resources in the basin are mainly affected by precipitation in the upstream mountains. Therefore, the precipitation data from the GLDAS model were selected here. Figure 8 displays the comparison of precipitation data from GLDAS Noah model outputs and meteorological stations from 2002 to 2020. Although the GLDAS model overestimates or underestimates precipitation at the point scale, there is a high consistency and correlation (r = 0.88) between basin-averaged precipitation from GLDAS and the average precipitation from five meteorological stations at the basin scale.
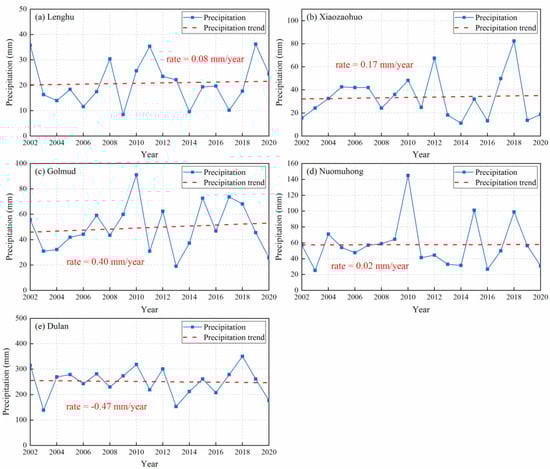
Figure 7.
The variations in annual total precipitation of the Qaidam Basin from Lenghu station (a), Xiaozaohuo station (b), Golmud station (c), Nuomuhong station (d), and Dulan station (e) during the period of 2002–2020.
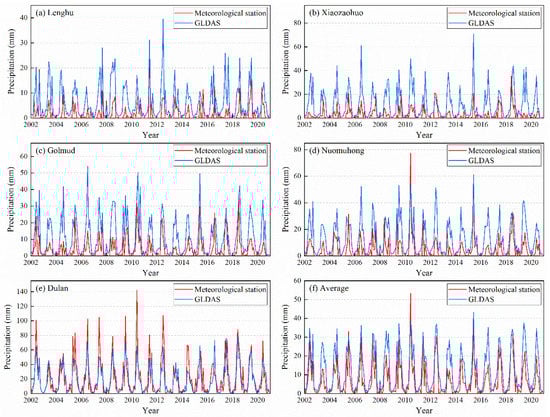
Figure 8.
The comparison of precipitation data from GLDAS Noah model outputs and meteorological stations in Lenghu station (a), Xiaozaohuo station (b), Golmud station (c), Nuomuhong station (d), Dulan station (e) and the average precipitation from five meteorological stations (f) during the period of 2002–2020.
Since the water storage of the Qaidam Basin was in deficit during the period of 2002–2009 and in surplus during the period of 2009–2020, the temporal variations in precipitation (P), evapotranspiration (ET), and net water flux (P–ET) over the two sub-periods were analyzed, as shown in Figure 9. P and ET both exhibited tremendous increases during the period of 2002–2009, and the much larger increasing rate of ET indicates that ET was the dominant factor leading to the loss of TWS over this period. P and ET showed relatively small increasing trends from 2009 to 2020, suggesting that the increase in TWS over this period was mostly attributed to an increase in P. Overall, TWS of the Qaidam Basin exhibited a significant increase over the entire study period, which demonstrates that the increase in precipitation played a dominant role on the temporal variations in TWS.
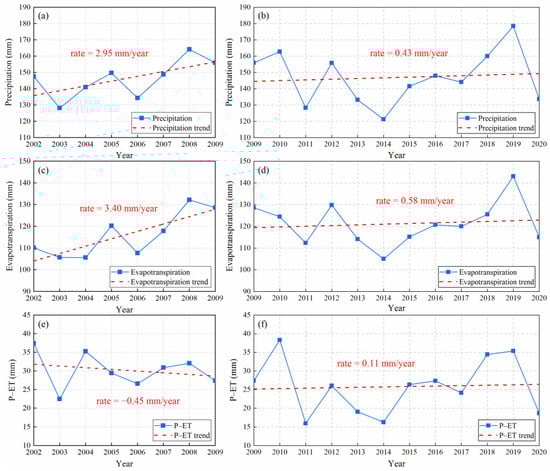
Figure 9.
The temporal variations in precipitation (P) (a), evapotranspiration (ET) (c) and net water flux (P–ET) (e) of the Qaidam Basin from GLDAS during the period of 2002–2009, and the temporal variations in P (b), ET (d) and P–ET (f) of the Qaidam Basin during the period of 2009–2020.
Figure 10 presents the spatial distribution of the annual total P and ET, as well as the spatial variation trends of P, ET, and P–ET over the period of 2002–2020. The mean annual total P and ET both decreased from east to west, with the maximum value mostly concentrated in the southeast and the minimum value in the north of the basin (Figure 10a,b). P, ET, and P–ET generally exhibited increases during the period of 2002–2020 (Figure 10c–e). The increase in P–ET in the mountainous area of the basin will lead to the increase in TWS in the downstream plain. For example, P–ET, in the upstream of the Qaidam River Basin and Golmud River Basin, showed significant increasing trends, and accordingly, TWS of the downstream plains also increased significantly. However, the opposite trends of P–ET in mountainous areas and TWS in the corresponding downstream plains were observed in several regions, e.g., a significant decrease in P–ET in the upstream of the Narin Gol Basin and a tremendous increase in TWS in the downstream of the basin, suggesting that precipitation had a relatively small contribution to river runoff and generally had little impact on the spatial variations in TWS of the Qaidam Basin.
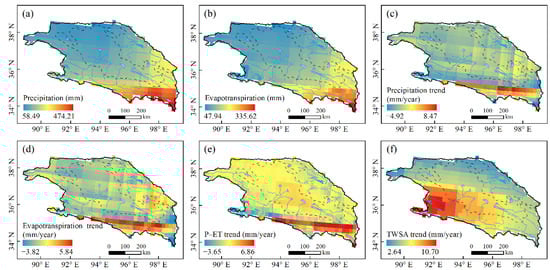
Figure 10.
The spatial distribution of the annual total P (a) and ET (b), and the spatial variation trends of P (c), ET (d), P–ET (e) and GRACE TWSA (f) of the Qaidam Basin during the period of 2002–2020.
5.2. Impacts of Glacier Mass Loss on the Variations in TWS
Glaciers are essential contributors to river runoff in the Qaidam Basin. According to the glacier data derived in this study, there were 2242 glaciers distributed in the basin in 2016, with a total area of 1587.66 ± 48.75 km2, an average area of 0.71 ± 0.02 km2, the minimum area of 0.01 ± 0.0038 km2, the maximum area of 82.22 ± 0.55 km2, and a total volume of 94.89 ± 2.68 km3. Since the Qaidam Basin is an endorheic basin, glacier change mainly affects the spatial variations in TWS. The area and volume of glaciers in the Qaidam Basin reduced by about 66.71 ± 88.65 km2 (4.03 ± 5.36%) and 7.25 ± 5.22 km3 (7.10 ± 5.12%) respectively from 2006 to 2016. Changes in glacier volume of sub-basins in the Qaidam Basin during the period of 2006–2016 were used to estimate the changes during the period of 2002–2020, which are presented in Figure 11.
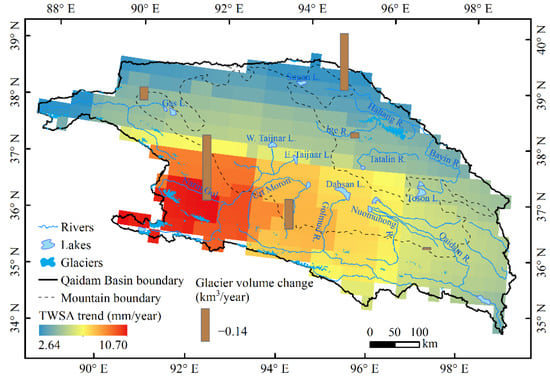
Figure 11.
Changes in glacier volume of sub-basins in the Qaidam Basin over the period of 2006–2016.
The glacier volume in the Narin Gol Basin and Haltang River Basin decreased a lot at the rates of 0.29 ± 0.10 km3/year and 0.25 ± 0.06 km3/year, equivalent to the negative glacier mass balance of 0.24 ± 0.09 km3 w.e./year (7.52 ± 2.71 mm/year) and 0.22 ± 0.05 km3 w.e./year (9.64 ± 2.25 mm/year), respectively. Since P–ET exhibited decreasing trends in the upstream of the two sub-basins, the increase in glacier meltwater played a dominant role in the increase in TWS in the downstream plains, especially the downstream of the Narin Gol Basin. In addition, the runoff infiltration of the Narin Gol reaches more than 70% [49], which might be the reason for the larger increase in TWS in the upstream than downstream of the basin.
The glacier mass loss was also observed in the upstream of the Golmud River Basin and Qaidam River Basin, where TWS and P–ET both increased significantly. This indicates that the increase in TWS in the downstream of the two sub-basins is affected by the increase in precipitation and glacier meltwater in the upstream mountains, and the latter contributed less than the former. For other sub-basins in the Qaidam Basin, glacier meltwater exhibited slight increasing trends, while P–ET showed a slight decrease in the upstream mountains, suggesting the important role of glacier meltwater on the variations in TWS of the downstream plains. In a word, the increase in glacier meltwater was the dominant factor for the spatial variations in TWS of the Qaidam Basin.
5.3. Impacts of Human Activities on the Variations in TWS
The water consumption associated with human activities in oasis areas is the main component of the total water consumption of the Qaidam Basin, which has a significant impact on the variations in TWS. Figure 12 presents the variations in total water consumption and the water consumption for individual terms, including agricultural irrigation, forestry, husbandry, fishery, industry, resident, urban public, and eco-environment in the Qaidam Basin over the period of 2002 to 2020. Water withdrawal for irrigation accounts for a large proportion of total water consumption in this region and experienced a decreasing trend (–0.01 km3/year) over the study period. The water consumption for forestry, husbandry, and fishery exhibited an increase at a rate of 0.01 km3/year, while water consumption for other purposes remained basically unchanged.
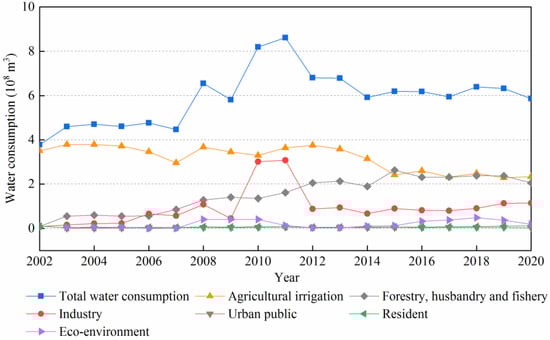
Figure 12.
The variations in total water consumption and the water consumption for agricultural irrigation, forestry, husbandry, fishery, industry, resident, urban public and eco-environment in the Qaidam Basin, during the period of the 2002–2020.
The total water consumption in the Qaidam Basin increased at a rate of 0.05 km3/year (0.17 mm/year) during the period of 2002 to 2011 and decreased at a rate of 0.02 km3/year (0.06 mm/year) during the period of 2011 to 2020. The opposite variation trends can explain the reason why TWS in this region was in deficit from 2002 to 2009 and in surplus after 2009. However, the total water consumption showed a slight increase, and the TWSA increased significantly over the period of 2002–2020, suggesting that the impacts of human activities on the variations in TWS of the Qaidam Basin were relatively small.
In summary, the precipitation played a dominant role in the temporal variations in TWS of the Qaidam Basin. The increase in glacier meltwater due to climate warming was the driving factor affecting the spatial variations in TWS of the Qaidam Basin, particularly in the Narin Gol Basin. In addition, the water consumption associated with human activities had relatively fewer impacts on the variations in TWS.
6. Conclusions
In this study, the variations in TWS and individual TWS components of the Qaidam Basin over the period of 2002 to 2020 were investigated by using GRACE and GRACE-FO data, GLDAS Noah model outputs, as well as data from Qinghai Water Resources Bulletin. The impacts of climate change, glacier mass loss, and human activities on the variations in TWS were further analyzed based on water balance elements, glacier mass balance, and data for human water consumption. The major results of this study are summarized as follows:
- (1)
- TWSA of the Qaidam Basin derived from different GRACE solutions agreed well in terms of amplitude and dynamics and were significantly correlated. The significant increasing trends were observed by TWSA from five GRACE solutions over the period of 2002–2020, with the change rates ranging from 4.85 to 6.90 mm/year (1.37 to 1.95 km3/year). The increasing trends revealed by JPL-M (6.90 mm/year) and GFZ-SH (6.68 mm/year) were much larger than those of other solutions.
- (2)
- The GRACE TWSA averaged from different GRACE solutions exhibited an increase at a rate of 5.83 ± 0.12 mm/year (1.65 ± 0.03 km3/year) during the period of 2002–2020. The variation trend in GRACE TWSA generally increased from upstream mountains to the interior of the basin in space, with the largest increasing trend mostly concentrated in the southwest and the smallest in the north of the basin. TWSA of the Qaidam Basin displayed significant seasonal variabilities, with the maximum values occurring in autumn and the largest increasing trend observed in summer (6.14 ± 0.41 mm/year).
- (3)
- The variation trends in components of TWS, including soil moisture, snow water equivalent, glacier mass balance, surface water, groundwater, and plant canopy water, were 7.65 mm/year, 0.06 mm/year, −2.18 ± 1.57 mm/year, 0.44 mm/year, 0.05 mm/year and 0.00 mm/year, respectively. Among these components of TWS, soil moisture contributed the most to the variations in TWS of the Qaidam Basin. Despite that, the glacier mass loss had a negative contribution to the variations in TWS; the increase in glacier meltwater also contributed to the increase in TWS.
- (4)
- The temporal variations in TWS of the Qaidam Basin were primarily affected by the variations in precipitation. The spatial variations in TWS of the Qaidam Basin were mostly driven by the increase in glacier meltwater due to climate warming, particularly in the Narin Gol Basin. In addition, the water consumption associated with human activities had relatively fewer impacts on the variations in TWS.
Author Contributions
Conceptualization, X.Y. and N.W.; methodology, X.Y., A.C. and Q.L.; software, Y.Z.; validation, Z.L.; formal analysis, X.Y. and A.C.; investigation, Z.L. and Q.L.; resources, X.Y.; data curation, X.Y.; writing—original draft preparation, X.Y.; writing—review and editing, N.W., A.C., Z.L., Q.L. and Y.Z.; Visualization, A.C.; Supervision, Y.Z.; Project Administration, N.W.; Funding Acquisition, N.W. All authors have read and agreed to the published version of the manuscript.
Funding
This research was funded by the Strategic Priority Research Program of the Chinese Academy of Sciences (XDA20060201, XDA19070302), the National Natural Science Foundation of China (42130516), and the Second Tibetan Plateau Scientific Expedition and Research Program (2019QZKK020102).
Institutional Review Board Statement
Not applicable.
Informed Consent Statement
Not applicable.
Data Availability Statement
Not applicable.
Acknowledgments
The authors are very grateful to CSR, JPL and GFZ for providing GRACE RL06 Level 2 product and mascon solutions, and the Goddard Earth Sciences Data and Information Services Center, NASA, for providing GLDAS-2.1 outputs. We thank the National Cryosphere Desert Data Center for providing the glacier data, and the China Meteorological Administration for providing the precipitation data. We appreciate the editors and the three anonymous reviewers for their valuable suggestions and advice.
Conflicts of Interest
The authors declare no conflict of interest.
References
- Rodell, M.; Famiglietti, J.S. Detectability of variations in continental water storage from satellite observations of the time dependent gravity field. Water Resour. Res. 1999, 35, 2705–2723. [Google Scholar] [CrossRef] [Green Version]
- Zhu, Y.; Liu, S.Y.; Yi, Y.; Xie, F.; Grünwald, R.; Miao, W.F.; Wu, K.P.; Qi, M.M.; Gao, Y.P.; Singh, D. Overview of terrestrial water storage changes over the Indus River Basin based on GRACE/GRACE-FO solutions. Sci. Total Environ. 2021, 799, 149366. [Google Scholar] [CrossRef]
- Chang, L.L.; Yuan, R.Q.; Gupta, H.V.; Winter, C.; Niu, G.Y. Why Is the Terrestrial Water Storage in Dryland Regions Declining? A Perspective Based on Gravity Recovery and Climate Experiment Satellite Observations and Noah Land Surface Model with Multiparameterization Schemes Model Simulations. Water Resour. Res. 2020, 56, e2020WR027102. [Google Scholar] [CrossRef]
- Wang, J.D.; Song, C.Q.; Reager, J.T.; Yao, F.F.; Famiglietti, J.S.; Sheng, Y.W.; Macdonald, G.M.; Brun, F.; Schmied, H.M.; Marston, R.A. Recent global decline in endorheic basin water storages. Nat. Geosci. 2018, 11, 926–932. [Google Scholar] [CrossRef] [Green Version]
- Shugar, D.H.; Jacquemart, M.; Shean, D.; Bhushan, S.; Upadhyay, K.; Sattar, A.; Schwanghart, W.; McBride, S.; de Vries, M.V.W.; Mergili, M.; et al. A massive rock and ice avalanche caused the 2021 disaster at Chamoli, Indian Himalaya. Science 2021, 373, 300–306. [Google Scholar] [CrossRef] [PubMed]
- Xiao, Y.; Shao, J.; Frape, S.K.; Cui, Y.; Dang, X.; Wang, S.; Ji, Y. Groundwater origin, flow regime and geochemical evolution in arid endorheic watersheds: A case study from the Qaidam Basin, northwestern China. Hydrol. Earth Syst. Sci. 2018, 22, 4381–4400. [Google Scholar] [CrossRef] [Green Version]
- Wang, X.; Yang, M.; Liang, X.; Pang, G.; Wan, G.; Chen, X. The dramatic climate warming in the Qaidam Basin, northeastern Tibetan Plateau, during 1961–2010. Int. J. Climatol. 2014, 34, 1524–1537. [Google Scholar] [CrossRef]
- Jing, W.L.; Zhao, X.D.; Yao, L.; Jiang, H.; Xu, J.H.; Yang, J.; Li, Y. Variations in terrestrial water storage in the Lancang-Mekong river basin from GRACE solutions and land surface model. J. Hydrol. 2020, 580, 124258. [Google Scholar] [CrossRef]
- Tapley, B.D.; Bettadpur, S.; Ries, J.C.; Thompson, P.F.; Watkins, M.M. GRACE Measurements of Mass Variability in the Earth System. Science 2004, 305, 503–505. [Google Scholar] [CrossRef] [Green Version]
- Tapley, B.D.; Watkins, M.M.; Flechtner, F.; Reigber, C.; Bettadpur, S.; Rodell, M.; Sasgen, I.; Famiglietti, J.S.; Landerer, F.W.; Chambers, D.P.; et al. Contributions of GRACE to understanding climate change. Nat. Clim. Chang. 2019, 9, 358–369. [Google Scholar] [CrossRef]
- Rodell, M.; Famiglietti, J.S.; Wiese, D.N.; Reager, J.T.; Beaudoing, H.K.; Landerer, F.W.; Lo, M.H. Emerging trends in global freshwater availability. Nature 2018, 557, 651–659. [Google Scholar] [CrossRef] [PubMed]
- Ahmed, M.; Sultan, M.; Wahr, J.; Yan, E. The use of GRACE data to monitor natural and anthropogenic induced variations in water availability across Africa. Earth-Sci. Rev. 2014, 136, 289–300. [Google Scholar] [CrossRef]
- Wahr, J.; Swenson, S.; Zlotnicki, V.; Velicogna, I. Time-variable gravity from GRACE: First results. Geophys. Res. Lett. 2004, 31, L11501. [Google Scholar] [CrossRef] [Green Version]
- Landerer, F.W.; Flechtner, F.M.; Save, H.; Webb, F.H.; Bandikova, T.; Bertiger, W.I.; Bettadpur, S.V.; Byun, S.H.; Dahle, C.; Dobslaw, H.; et al. Extending the Global Mass Change Data Record: GRACE Follow-On Instrument and Science Data Performance. Geophys. Res. Lett. 2020, 47, e2020GL088306. [Google Scholar] [CrossRef]
- Jiao, J.J.; Zhang, X.; Liu, Y.; Kuang, X. Increased Water Storage in the Qaidam Basin, the North Tibet Plateau from GRACE Gravity Data. PLoS ONE 2015, 10, e0141442. [Google Scholar] [CrossRef] [PubMed] [Green Version]
- Wei, L.Y.; Jiang, S.H.; Ren, L.L.; Tan, H.B.; Ta, W.Q.; Liu, Y.; Yang, X.L.; Zhang, L.Q.; Duan, Z. Spatiotemporal changes of terrestrial water storage and possible causes in the closed Qaidam Basin, China using GRACE and GRACE Follow-On data. J. Hydrol. 2021, 598, 126274. [Google Scholar] [CrossRef]
- Bibi, S.; Wang, L.; Li, X.P.; Zhang, X.T.; Chen, D.L. Response of Groundwater Storage and Recharge in the Qaidam Basin (Tibetan Plateau) to Climate Variations From 2002 to 2016. J. Geophys. Res. Atmos. 2019, 124, 9918–9934. [Google Scholar] [CrossRef]
- Hu, L.T.; Jiao, J.J. Calibration of a large-scale groundwater flow model using GRACE data: A case study in the Qaidam Basin, China. Hydrogeol. J. 2015, 23, 1305–1317. [Google Scholar] [CrossRef]
- Liu, S.Y.; Guo, W.Q.; Xu, J.L. The Second Glacial Catalogue Data Set of China (V1.0); National Cryosphere Desert Data Center: Lanzhou, China, 2019. [Google Scholar]
- Soltani, S.S.; Ashtiani, B.A.; Simmons, C.T. Review of assimilating GRACE terrestrial water storage data into hydrological models: Advances, challenges and opportunities. Earth-Sci. Rev. 2021, 213, 103487. [Google Scholar] [CrossRef]
- Landerer, F.W.; Swenson, S.C. Accuracy of scaled GRACE terrestrial water storage estimates. Water Resour. Res. 2012, 48, 4531. [Google Scholar] [CrossRef]
- Scanlon, B.R.; Zhang, Z.; Save, H.; Wiese, D.N.; Landerer, F.W.; Long, D.; Longuevergne, L.; Chen, J. Global Evaluation of New GRACE Mascon Products for Hydrologic Applications. Water Resour. Res. 2016, 52, 9412–9429. [Google Scholar] [CrossRef]
- Wiese, D.N.; Landerer, F.W.; Watkins, M.M. Quantifying and reducing leakage errors in the JPL RL05M GRACE mascon solution. Water Resour. Res. 2016, 52, 7490–7502. [Google Scholar] [CrossRef]
- Save, H.; Bettadpur, S.; Tapley, B.D. High-resolution CSR GRACE RL05 mascons. J. Geophys. Res. Solid Earth 2016, 121, 7547–7569. [Google Scholar] [CrossRef]
- Huang, W.J.; Duan, W.L.; Chen, Y.N. Rapidly declining surface and terrestrial water resources in Central Asia driven by socio-economic and climatic changes. Sci. Total Environ. 2021, 784, 147193. [Google Scholar] [CrossRef]
- Liu, X.; Hu, L.T.; Sun, K.N.; Yang, Z.Q.; Sun, J.C.; Yin, W.J. Improved Understanding of Groundwater Storage Changes under the Influence of River Basin Governance in Northwestern China Using GRACE Data. Remote Sens. 2021, 13, 2672. [Google Scholar] [CrossRef]
- Rodell, M.; Houser, P.R.; Jambor, U.; Gottschalck, J.; Mitchell, K.; Meng, C.J.; Arsenault, K.; Cosgrove, B.; Radakovich, J.; Bosilovich, M.; et al. The global land data assimilation system. Bull. Am. Meteorol. Soc. 2004, 85, 381–394. [Google Scholar] [CrossRef] [Green Version]
- Yang, T.; Wang, C.; Yu, Z.B.; Xu, F. Characterization of spatio-temporal patterns for various GRACE- and GLDAS-born estimates for changes of global terrestrial water storage. Glob. Planet. Chang. 2013, 109, 30–37. [Google Scholar] [CrossRef]
- Guo, W.Q.; Liu, S.Y.; Xu, J.L.; Wu, L.Z.; Shangguan, D.H.; Yao, X.J.; Wei, J.F.; Bao, W.J.; Yu, P.C.; Liu, Q.; et al. The second Chinese glacier inventory: Data, methods and results. J. Glaciol. 2015, 61, 357–372. [Google Scholar] [CrossRef] [Green Version]
- van Zyl, J.J.; Zebker, H.A.; Elachi, C. Imaging radar polarization signatures: Theory and observation. Radio Science 1987, 22, 529–543. [Google Scholar] [CrossRef]
- Muhuri, A.; Manickam, S.; Bhattacharya, A. Scattering Mechanism Based Snow Cover Mapping Using RADARSAT-2 C-Band Polarimetric SAR Data. IEEE J. Sel. Top. Appl. Earth Obs. Remote Sens. 2017, 10, 3213–3224. [Google Scholar] [CrossRef]
- Touzi, R. Target Scattering Decomposition in Terms of Roll-Invariant Target Parameters. IEEE Trans. Geosci. Remote Sens. 2007, 45, 73–84. [Google Scholar] [CrossRef]
- Radić, V.; Hock, R. Regional and global volumes of glaciers derived from statistical upscaling of glacier inventory data. J. Geophys. Res. Earth Surf. 2010, 115, F01010. [Google Scholar] [CrossRef]
- Wang, F.; Chen, Y.; Li, Z.; Fang, G.; Li, Y.; Wang, X.; Zhang, X.; Kayumba, P.M. Developing a Long Short-Term Memory (LSTM)-Based Model for Reconstructing Terrestrial Water Storage Variations from 1982 to 2016 in the Tarim River Basin. Remote Sens. 2021, 13, 889. [Google Scholar] [CrossRef]
- Swenson, S.; Wahr, J. Methods for inferring regional surface-mass anomalies from Gravity Recovery and Climate Experiment (GRACE) measurements of time-variable gravity. J. Geophys. Res. Solid Earth 2002, 107, 2193. [Google Scholar] [CrossRef] [Green Version]
- Cheng, M.K.; Tapley, B.D. Variations in the Earth′s oblateness during the past 28 years. J. Geophys. Res. Solid Earth 2004, 109, B03406. [Google Scholar] [CrossRef]
- Swenson, S.; Chambers, D.; Wahr, J. Estimating geocenter variations from a combination of GRACE and ocean model output. J. Geophys. Res. Solid Earth 2008, 113, B08410. [Google Scholar] [CrossRef] [Green Version]
- Geruo, A.; Wahr, J.; Zhong, S.J. Computations of the viscoelastic response of a 3-D compressible Earth to surface loading: An application to Glacial Isostatic Adjustment in Antarctica and Canada. Geophys. J. Int. 2013, 192, 557–572. [Google Scholar]
- Swenson, S.; Wahr, J. Post-processing removal of correlated errors in GRACE data. Geophys. Res. Lett. 2006, 33, L08402. [Google Scholar] [CrossRef]
- Wahr, J.; Molenaar, M.; Bryan, F. Time variability of the Earth′s gravity field: Hydrological and oceanic effects and their possible detection using GRACE. J. Geophys. Res. Solid Earth 1998, 103, 30205–30229. [Google Scholar] [CrossRef]
- Yang, X.; Wang, N.; Liang, Q.; Chen, A.; Wu, Y. Impacts of Human Activities on the Variations in Terrestrial Water Storage of the Aral Sea Basin. Remote Sens. 2021, 13, 2923. [Google Scholar] [CrossRef]
- Deng, H.; Chen, Y. Influences of recent climate change and human activities on water storage variations in Central Asia. J. Hydrol. 2017, 544, 46–57. [Google Scholar] [CrossRef]
- Peltier, W.R.; Argus, D.F.; Drummond, R. Comment on “An Assessment of the ICE-6G_C (VM5a) Glacial Isostatic Adjustment Model” by Purcell et al. J. Geophys. Res. Solid Earth 2018, 123, 2019–2028. [Google Scholar] [CrossRef]
- Sakumura, C.; Bettadpur, S.; Bruinsma, S.L. Ensemble prediction and intercomparison analysis of GRACE time-variable gravity field models. Geophys. Res. Lett. 2014, 41, 1389–1397. [Google Scholar] [CrossRef]
- Wang, Q.; Zheng, W.; Yin, W.; Kang, G.; Zhang, G.; Zhang, D. Improving the Accuracy of Water Storage Anomaly Trends Based on a New Statistical Correction Hydrological Model Weighting Method. Remote Sens. 2021, 13, 3583. [Google Scholar] [CrossRef]
- Abhishek; Kinouchi, T.; Sayama, T. A comprehensive assessment of water storage dynamics and hydroclimatic extremes in the Chao Phraya River Basin during 2002-2020. J. Hydrol. 2021, 603, 126868. [Google Scholar] [CrossRef]
- Liu, J.; Jiang, L.; Zhang, X.; Druce, D.; Kittel, C.M.M.; Tøttrup, C.; Bauer-Gottwein, P. Impacts of water resources management on land water storage in the North China Plain: Insights from multi-mission earth observations. J. Hydrol. 2021, 603, 126933. [Google Scholar] [CrossRef]
- Meng, F.C.; Su, F.G.; Li, Y.; Tong, K. Changes in terrestrial water storage during 2003-2014 and possible causes in Tibetan Plateau. J. Geophys. Res. Atmos. 2019, 124, 2909–2931. [Google Scholar] [CrossRef]
- Tan, H.B.; Lu, S.C.; Ta, W.Q.; Rao, W.B.; Guo, H.Y. Water resource and mineral source significances of Nalenggele River Catchment in Qaidam Basin. J. Hohai Univ. Nat. Sci. 2020, 48, 392–397. [Google Scholar]
Publisher’s Note: MDPI stays neutral with regard to jurisdictional claims in published maps and institutional affiliations. |
© 2022 by the authors. Licensee MDPI, Basel, Switzerland. This article is an open access article distributed under the terms and conditions of the Creative Commons Attribution (CC BY) license (https://creativecommons.org/licenses/by/4.0/).