Article

ERA5 Reanalysis for the Data Interpretation on Polarization Laser Sensing of High-Level Clouds

1
Laboratory for Analysis of High Energy Physics Data, Faculty of Physics, National Research Tomsk State University, 634050 Tomsk, Russia
2
Department of Optoelectronic Systems and Remote Sensing, Faculty of Radiophysics, National Research Tomsk State University, 634050 Tomsk, Russia
3
Laboratory of Physics of Climatic Systems, Institute of Monitoring of Climatic and Ecological Systems of the Siberian Branch of the Russian Academy of Sciences, 634055 Tomsk, Russia
4
Department of Meteorology and Climatology, Faculty of Geology and Geography, National Research Tomsk State University, 634050 Tomsk, Russia
5
Division for Experimental Physics, National Research Tomsk Polytechnic University, 634050 Tomsk, Russia
*
Author to whom correspondence should be addressed.
Remote Sens. 2023, 15(1), 109; https://doi.org/10.3390/rs15010109
Submission received: 22 November 2022 / Revised: 17 December 2022 / Accepted: 22 December 2022 / Published: 25 December 2022

Abstract

:
Interpreting the results of a high-level clouds (HLCs) lidar study requires a comparison with the vertical profiles of meteorological quantities. There are no regular radiosonde measurements of vertical profiles of meteorological quantities in Tomsk. The nearest aerological stations are several hundred kilometers away from the lidar and perform radiosonde measurements only a few times a day, whereas lidar experiments are performed continuously throughout the day. To estimate meteorological conditions at the HLC altitudes, we propose to use the ERA5 reanalysis. Its reliability was tested by comparing with the data from five aerological stations within a radius of 500 km around Tomsk. A labeled database of the lidar, radiosonde, and ERA5 data (2016–2020) for isobaric levels 1000–50 hPa was created. The temperature reconstruction error over the entire altitude range was characterized by an RMSE of 0.8–2.8 °C, bias of 0–0.9, and Corr ~1. The accuracy of the relative vertical profiles (RMSE 25–40%, Bias 10–22%, and Corr <0.7) and specific humidity (RMSE 0.2–1.2 g/kg, Bias ~0 g/kg, and Corr ~0) at the HLC altitudes were unsatisfying. The ERA5 data on wind direction and speed for the HLC altitudes were promising.

1. Introduction

More and more noticeable climatic changes on the Earth determine the need to improve weather and climate forecasts. Increasing the accuracy of atmospheric forecasting requires increasing the completeness, spatio-temporal resolution, and accuracy of meteorological information, as well increasing as the understanding of phenomena occurring in the atmosphere and its structure, composition, and dynamics. Cloudiness is not only a regulator of the radiation budget in the Earth’s climatic system, but also the most important factor in determining the inflow of solar energy to its surface [1,2,3]. Optical and microphysical models of the atmosphere remain imperfect. Such disadvantages include simplifications caused by insufficient knowledge of atmospheric processes and phenomena. Accounting for the effect of high-level clouds (HLCs) on the radiation budget in climatic models of the atmosphere is an important, unresolved problem [4,5].
Such clouds have a large horizontal size, reaching thousands of kilometers, and therefore can cover up to half of the Earth’s surface [6,7]. The HLC contribution to the greenhouse effect is significant despite their small optical thicknesses [8,9,10]. Special features of HLC optical transmittance are determined by their microstructure, characterized by the distribution of ice particles in the cloud by shape, size, and spatial orientation. These characteristics depend on meteorological conditions in the upper troposphere. Under certain conditions, particles can be oriented horizontally, which increases the reflectance and leads to the anomalous (specular) backscattering of optical radiation during sensing into the zenith. Existing atmospheric models, including the global atmospheric model developed by the European Centre for Medium-Range Weather Forecasts (ECMWF), do not consider the characteristics of the HLC microstructure. In contrast to droplet clouds, it is difficult to accurately describe the sizes and shapes of particles in crystalline or mixed clouds. Usually, the concept of “effective radius,” which is based on the equality of particle properties with a certain model sphere, is used [1]. This simplification allows the Mie theory to be used in calculating the radiative characteristics of HLCs, but it is quite coarse and negatively affects the accuracy of numerical weather and climate forecasts.
Experimental studies of HLCs are labor-intensive and expensive. There is no instrument for the contact determination of the spatial orientation of particles in clouds because it is violated during air sampling. The theoretical description of optical radiation interaction with non-spherical ice particles is a complex, multicomponent task. Modern instruments and methods for experimental data processing bring us closer to the tools that allow for the adequate relation of the characteristics of HLCs with meteorological conditions and the prediction of the microstructure of the clouds being formed. The use of polarization lidar, which provides an evaluation of particle orientation along with other parameters (the shape and size of ice particles) of the microstructure, makes it possible to compensate for the impossibility of determining the orientation of particles in HLCs using contact methods.
Airplane contrails also have optical properties similar to those of natural HLCs. They not only attenuate solar radiation flux themselves, but also form cirrus [11] (e.g., Cirrus floccus homomutatus and Cirrus fibratus homomutatus [12]). Contrails existing more than 10 min are named by the World Meteorological Organisation as the only artificial type of ice clouds [13]. Long-term observations of HLCs in northern latitudes [11] have shown an increase in the frequency of cloud formation with the growth of air traffic. Instrumental studies of contrail characteristics are difficult because the aircraft-based contact instruments provide little information (in addition, information on the orientation of ice particles cannot be obtained), and space platforms cannot observe contrails at the initial stage of formation due to their small dimensions. They become detectable by satellites 1–2 h after the emission of combustion products from aircraft engines, which is too long because the average contrail lifetime is about 1–6 h [14].
There are two main problems in developing optical models of crystalline HLCs that adequately reflect their microphysical characteristics. The first problem is the absence of the certified instrumental methods for determining the orientation of non-spherical particles in the atmosphere at the altitudes of HLC formation. The second problem is the complexity of calculations of the basic optical and radiative characteristics of such clouds.
The materials and methods are described in Section 2. Section 2.1 contains basic information about the high-altitude matrix polarization lidar of the National Research Tomsk State University (NR TSU). Section 2.2 explains the technique of using the meteorological data for the interpretation of the lidar data. In Section 2.2.1, radiosonde observations whose data are used for the estimation of clouds formation conditions are described. Some information about the ERA5 reanalysis and the evaluation of the applicability of the ERA5 reanalysis for processing and interpreting the lidar data are presented in Section 2.2.2 and Section 2.3, respectively. The results of the evaluation are shown in Section 3 and discussed in Section 4. Conclusions are presented in Section 5.

2. Materials and Methods

According to [15], the maximum information about the microphysical parameters of an ensemble of particles is contained in the light-scattering matrix (LSM). In the present work, vertical profiles of atmospheric parameters are measured using a high-altitude matrix polarization lidar (HAMPL) developed at the NR TSU. A special feature of the HAMPL is its ability to perform all the measurements necessary for experimental determining of the vertical profile of all elements of the backscattering phase matrix (BSPM; a special case of the LSM for scattering angles close to 180 degrees) of the HLC layers [16]. Existing analogs (for example, [17,18,19]) allow only some BSPM elements to be determined, and the rest elements are calculated based on the symmetry properties of such matrices.

2.1. High-Altitude Matrix Polarization Lidar of National Research Tomsk State University

A block diagram of the HAMPL is shown in Figure 1. The lidar is located in Tomsk and is oriented vertically in the zenith direction. It is regularly used for performing experiments on the sensing of HLCs from 2009. The measurements are carried out at any time of day when there are no precipitation, wind gusts, and low-level clouds. A Nd:YAG laser Lotis TII LS-2137U with an operating wavelength of 532 nm, a pulse energy of up to 400 mJ, and a pulse repetition rate of 10 Hz is used as an optical radiation source. A Cassegrain mirror lens with a primary mirror diameter of 0.5 m and a focal length of 5 m is used as a receiving antenna. A Wollaston prism, which divides the received, backscattered radiation into two orthogonally polarized beams, is installed on the output of the receiving optical channel of the lidar. These radiation beams are recorded by two photomultiplier tubes (PMTs), Hamamatsu H5783Ps, operating in the photon-counting mode with time strobing of the signal, which provides the lidar altitude resolution from 37.5 to 150 m. To suppress active backscatter noise from the lidar’s near-field zone (up to 3 km), electro-optical shutters (EOSs) [20] are mounted in front of the PMTs. The EOSs are based on a potassium dideuterium phosphate (DKDP) crystal with a maximum trigger frequency of 100 Hz, a high voltage pulse duration of 1–1000 µs, and a high voltage pulse delay relative to the trigger pulse of 1–100 µs. The use of EOSs allows the characteristics to remain linear even during lidar operation in the daytime at the maximum energy of the sensing pulse.
Pulses of radiation with four different polarization states (three linear and one circular) were sent to the atmosphere one by one. For each pulse, the polarization state of backscattered radiation described by the Stokes vector were determined. Thus, 16 intensity vertical profiles, from which 16 BSPM elements were calculated, were measured in each sensing cycle. In addition, other important cloud characteristics were determined based on the analysis of lidar measurement data, including optical characteristics (the scattering ratio and optical thicknesses, as well as geometrical ones) and the altitudes of the lower and upper boundaries and thicknesses [21]. As was noted in the Introduction, the horizontal orientation of ice particles in HLCs leads to anomalous backscattering of optical radiation during sensing into the zenith. Based on the HAMPL data, such clouds are identified if the following criteria are simultaneously met: scattering ratio R > 10, optical thickness τ < 1, and the BSPM element m44 < −0.4 [16,21].
The HAMPL provided the registration of lidar returns from HLCs in the parallel accumulation mode of 16 arrays of single-electron pulses. This mode allowed the intensity of all 16 lidar signals from the clouds, which were necessary to determine all elements of the BSPM, to be estimated with the same error. During sensing in this mode, there was a continuous change of polarization elements in the transmitting and receiving systems of the lidar, due to which the minimum time of a complete cycle of measurements for determining all BSPM elements was 2 s. Thus, the movement of the examined air volumes falling into the field of view of the telescope affected the measurements in the same way with each of the used combinations of the polarization states of sensing and received radiation.
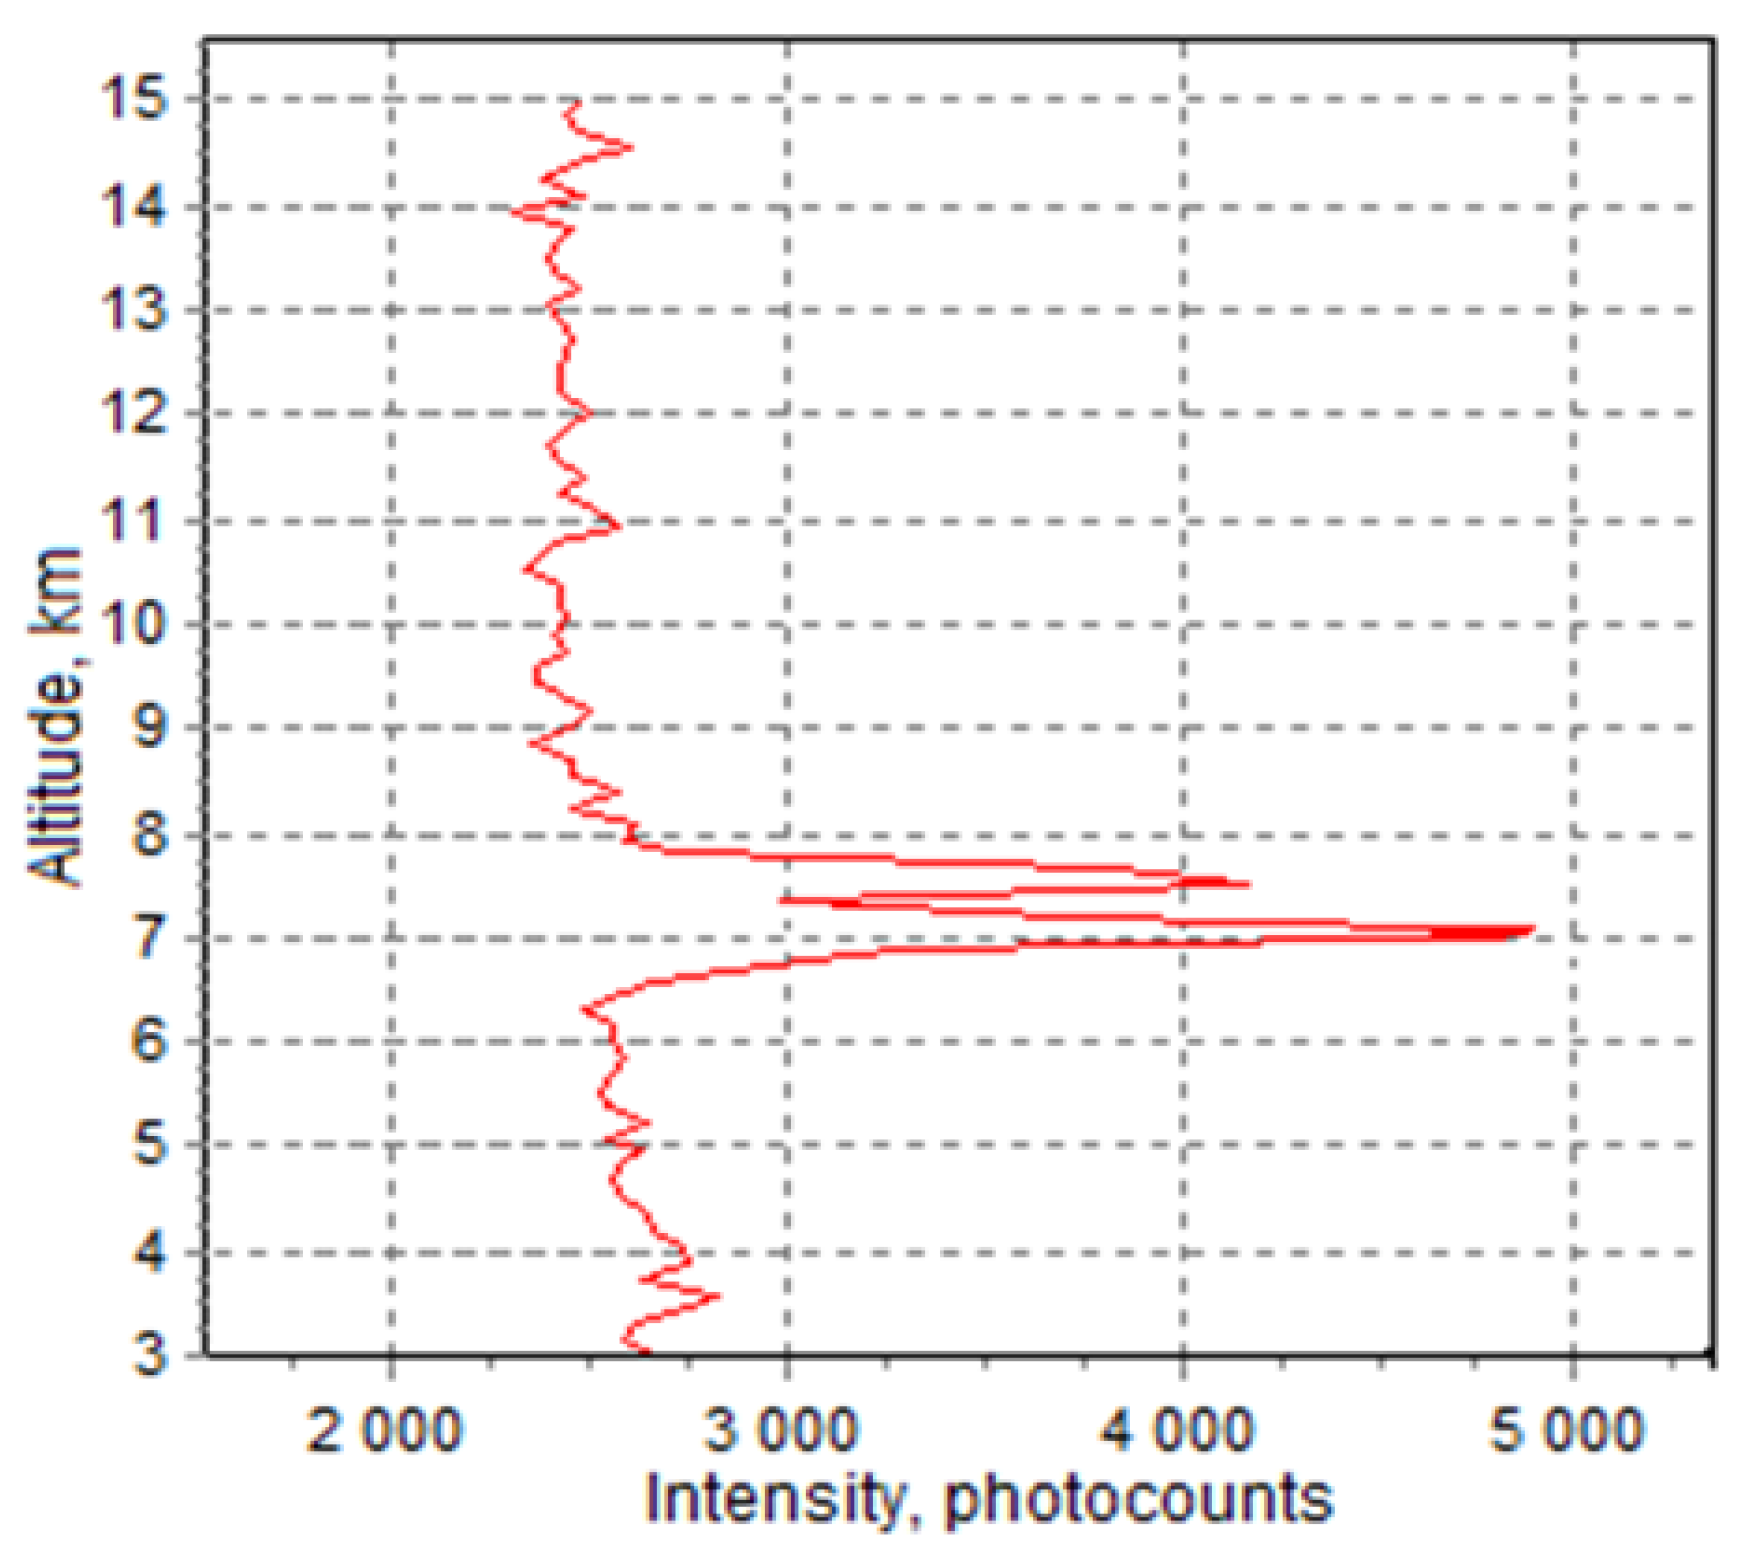
As an example, let us consider the results of lidar measurements from 1 June 2021. An extended HLC layer at altitudes of 6.2–8.3 km was registered. Figure 2 shows an example of the temporal dynamics of the vertical profile of the lidar signal intensity. Each vertical line on the plot corresponds to a single laser pulse. Figure 3 shows the same profile summed over the entire time of the measurement series.
In Figure 2, turquoise areas (brighter than the blue color, which corresponds to zero intensity) can be found at altitudes of about 6.5 km at time points around 2:39, 2:44 p.m. and between 2:49 p.m. and the end of the series. These areas correspond to the increase in intensity compared to the zero intensity (blue), which caused the intensity increase in Figure 3 starting from an altitude of about 6.4 km. Optical characteristics of the cloud registered with the HAMPL are presented in Table 1. As can be seen from the table, according to the criteria mentioned above, the observed cloud contained predominantly horizontally oriented ice particles.
In addition, the parallel signal recording made it possible to conduct a long, continuous session of HLC sensing and then select the time intervals for processing according to the given criteria. This procedure allowed us to establish that the same lengthy cloud can contain both specular (containing horizontally oriented ice particles) and non-specular local areas, as well as to estimate their sizes [22,23].

2.2. Use of Meteorological Data for the Interpretation of the Lidar Measurement Data

To study the clouds and to establish the relationships between their characteristics and environmental conditions, it was necessary to perform a joint analysis of the experimental data with the meteorological situation at appropriate altitudes. The most reliable and extremely important source of information on the vertical profiles of meteorological data was the radiosonde observation data. At present, the Russian radiosonde network includes 127 aerological stations in the territory of the Russian Federation and two more in Antarctica [24]. When interpreting the results of HAMPL measurements, to assess the meteorological conditions at the altitudes of HLCs, the measurement data of the aerological stations closest to Tomsk (Kolpashevo WMO 29231 and Novosibirsk WMO 29634) were used. Radiosonde data are freely available on the website of the University of Wyoming (USA) [25], which provides access to data from measurements performed around the globe from 1973.

2.2.1. Radiosonde Observations and Conditions for the Formation of Specular Clouds

Despite the remoteness of the aerological stations of Novosibirsk and Kolpashevo from each other, the meteorological conditions at the altitudes of HLC formation based on the data of both stations usually differ insignificantly [16,23]. The small differences in the vertical profiles of meteorological values from data from these stations are illustrated in Figure 4, which shows examples of the vertical profiles of temperature and wind direction measured at these stations. In this figure and throughout the text, we will use the abbreviation RAOB to designate upper-air measurement data (short for “RAdiosonde OBservations”). The designation ERA5 is used for the reanalysis data of the same name—it will be described below. In the examples presented in Figure 4, the vertical temperature profiles according to the data of radiosonde observations in Kolpashevo and Novosibirsk almost completely coincide. The vertical profiles of the wind direction according to the data of measurements at these stations are also close to each other, although they differ from each other by up to 10–20°. Separately, we note that the profiles of the reconstructed values of meteorological quantities according to the ERA5 reanalysis almost completely coincide with the profiles of radiosonde data.
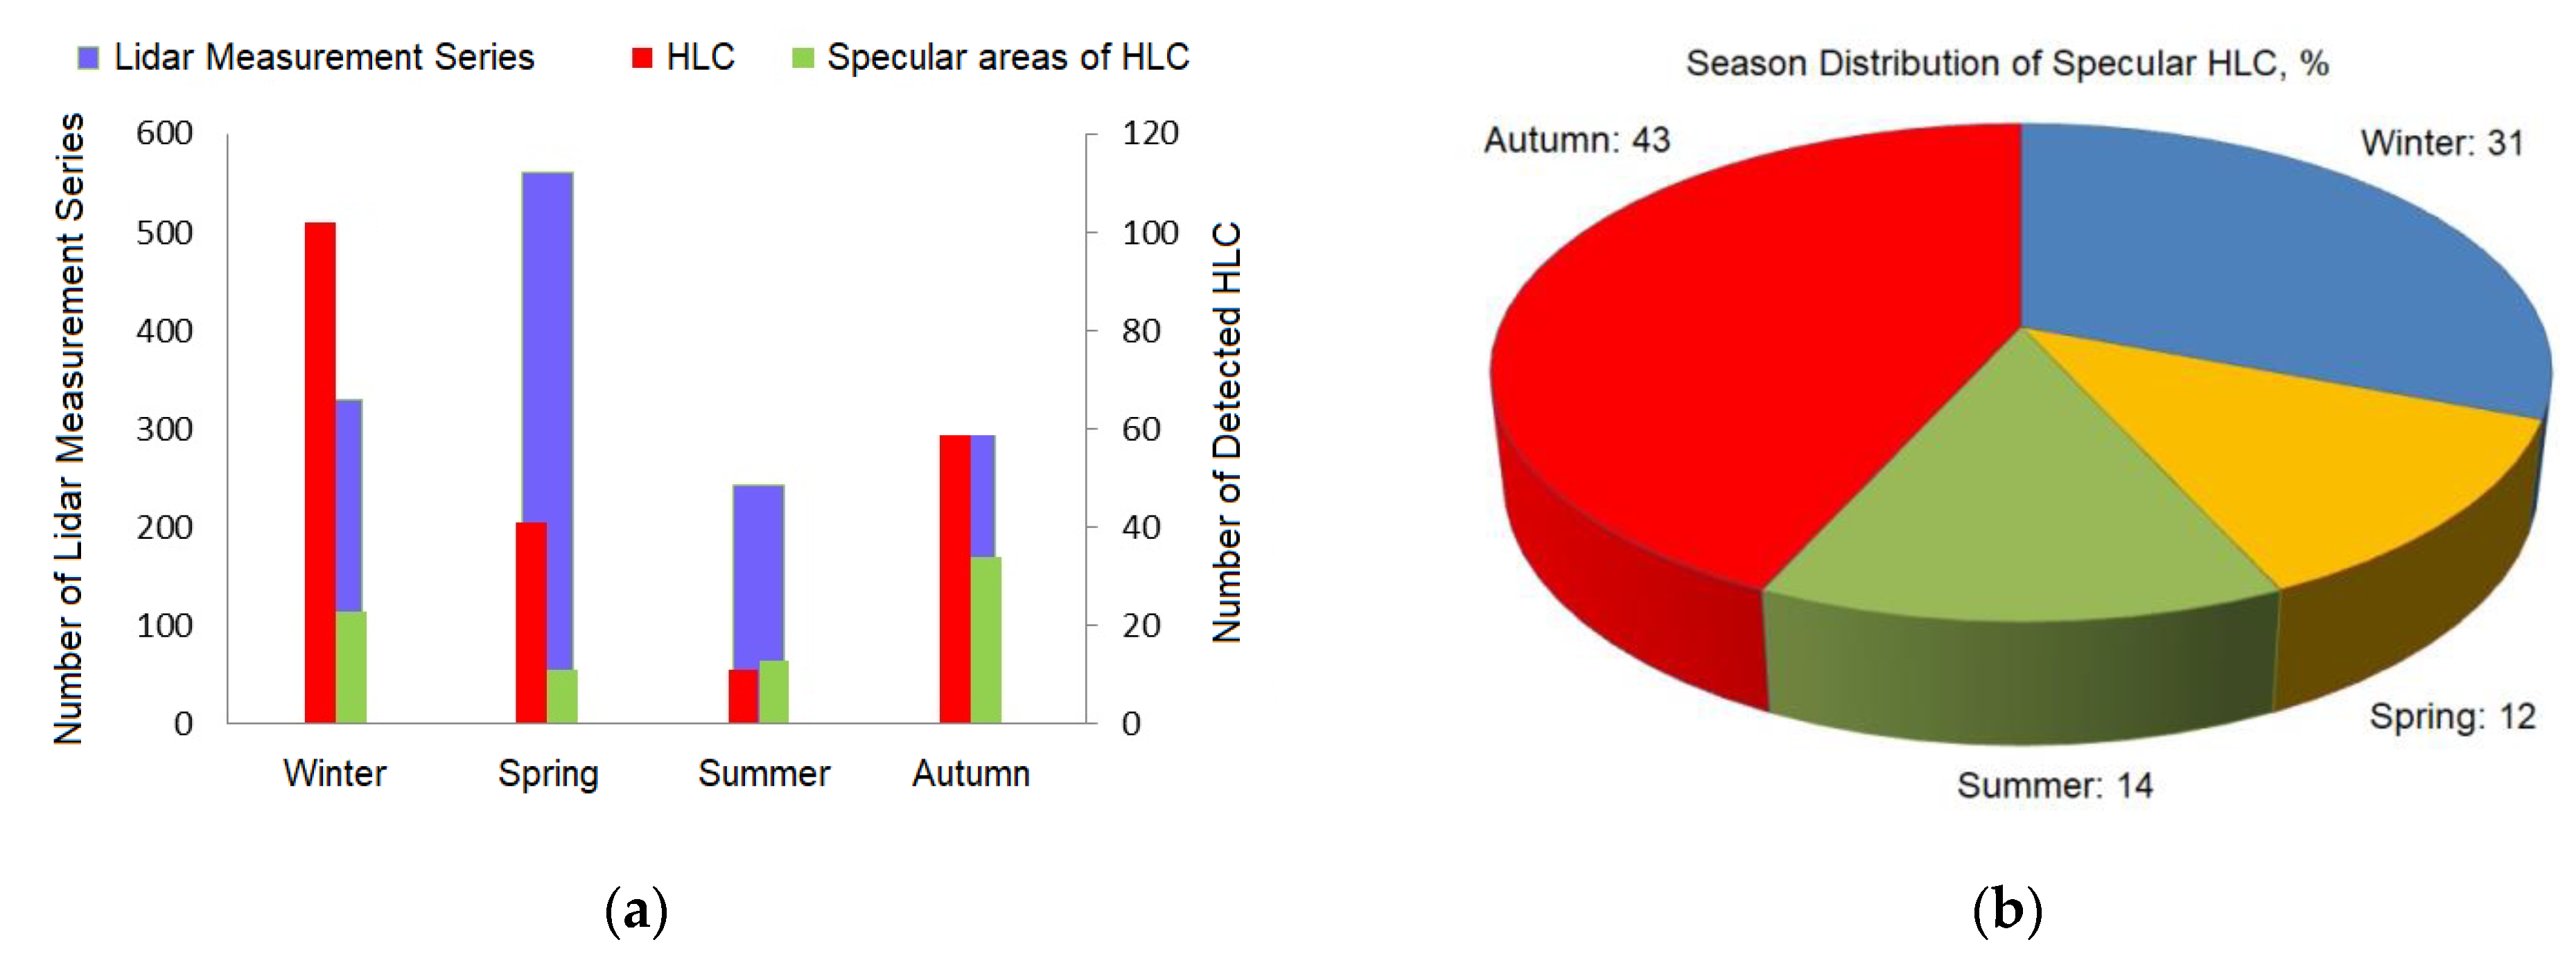
During the period of 2016 to 2020, about 1500 series of measurements (including measurements in cloudless conditions; one series of measurements usually takes about 17 min) were performed at the HAMPL in the mode of parallel accumulation of lidar signals [26]. Figure 5 shows the distributions of the measurement series by year and by season. Despite the predominance of the lidar measurement series in spring, the largest number of HLCs by absolute value was detected in winter and about 20% less were detected in autumn. At the same time, the largest number of specular areas of clouds was detected in autumn; on the contrary, the number was the smallest in spring. In summer, both the number of detected HLCs and the number of their specular areas were significantly smaller, but the second number exceeded the first one [26].
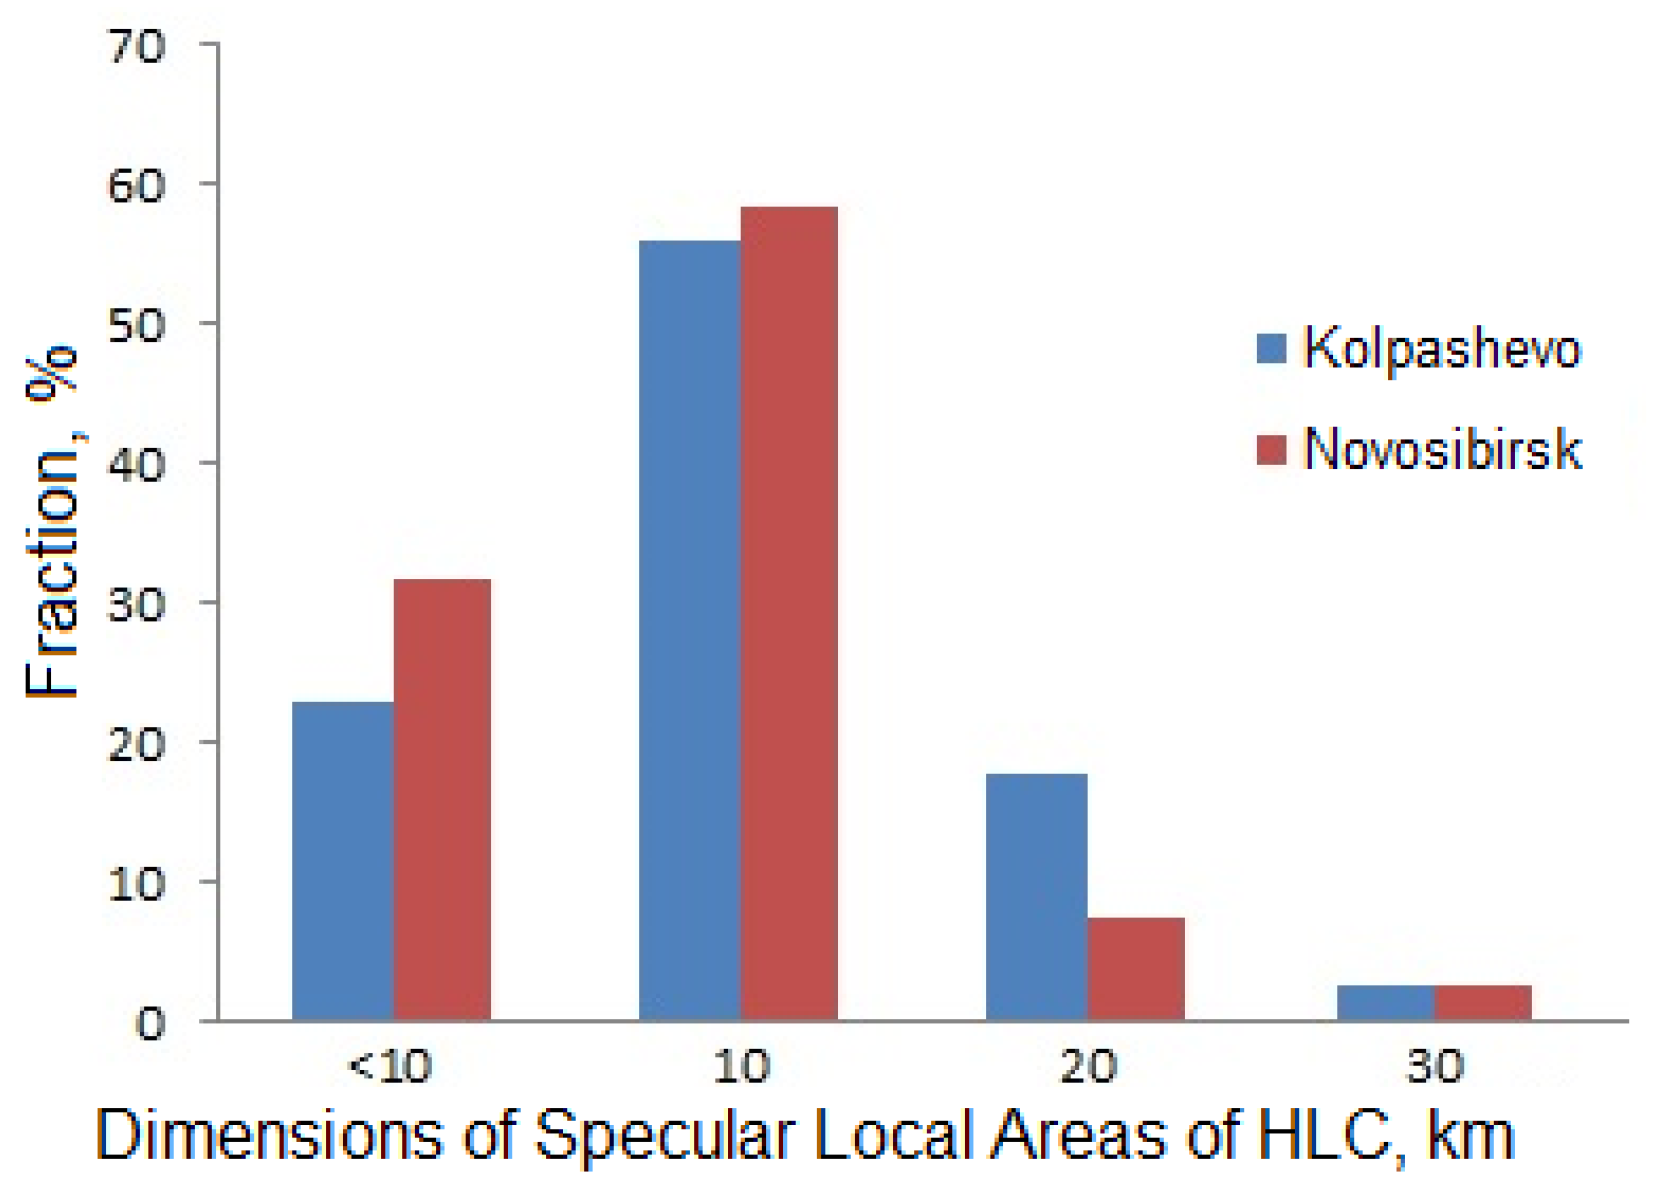
As was noted in Section 2.1, the parallel accumulation of lidar signals allows for long, continuous sessions of HLC sensing to be performed and then the specified time intervals to be selected for processing according to the given criteria. A comparison of the specular HLC local area detecting time and its altitude based on the lidar data with the wind speed at this altitude (based on the radiosonde data) provides the possibility to estimate the size of such areas. HLCs were detected during 231 series of the HAMPL measurements (see Figure 5); 81 specular areas of such clouds were identified, and their sizes were estimated. The distribution of HLC specular area size estimates is shown in Figure 6. As the data from the two aerological stations closest to the HAMPL location were used, the histogram shows data from both. The sizes of the HLC specular areas lay in the range from 4 to 30 km; the fraction of cases with the largest value was 2% of the total number.
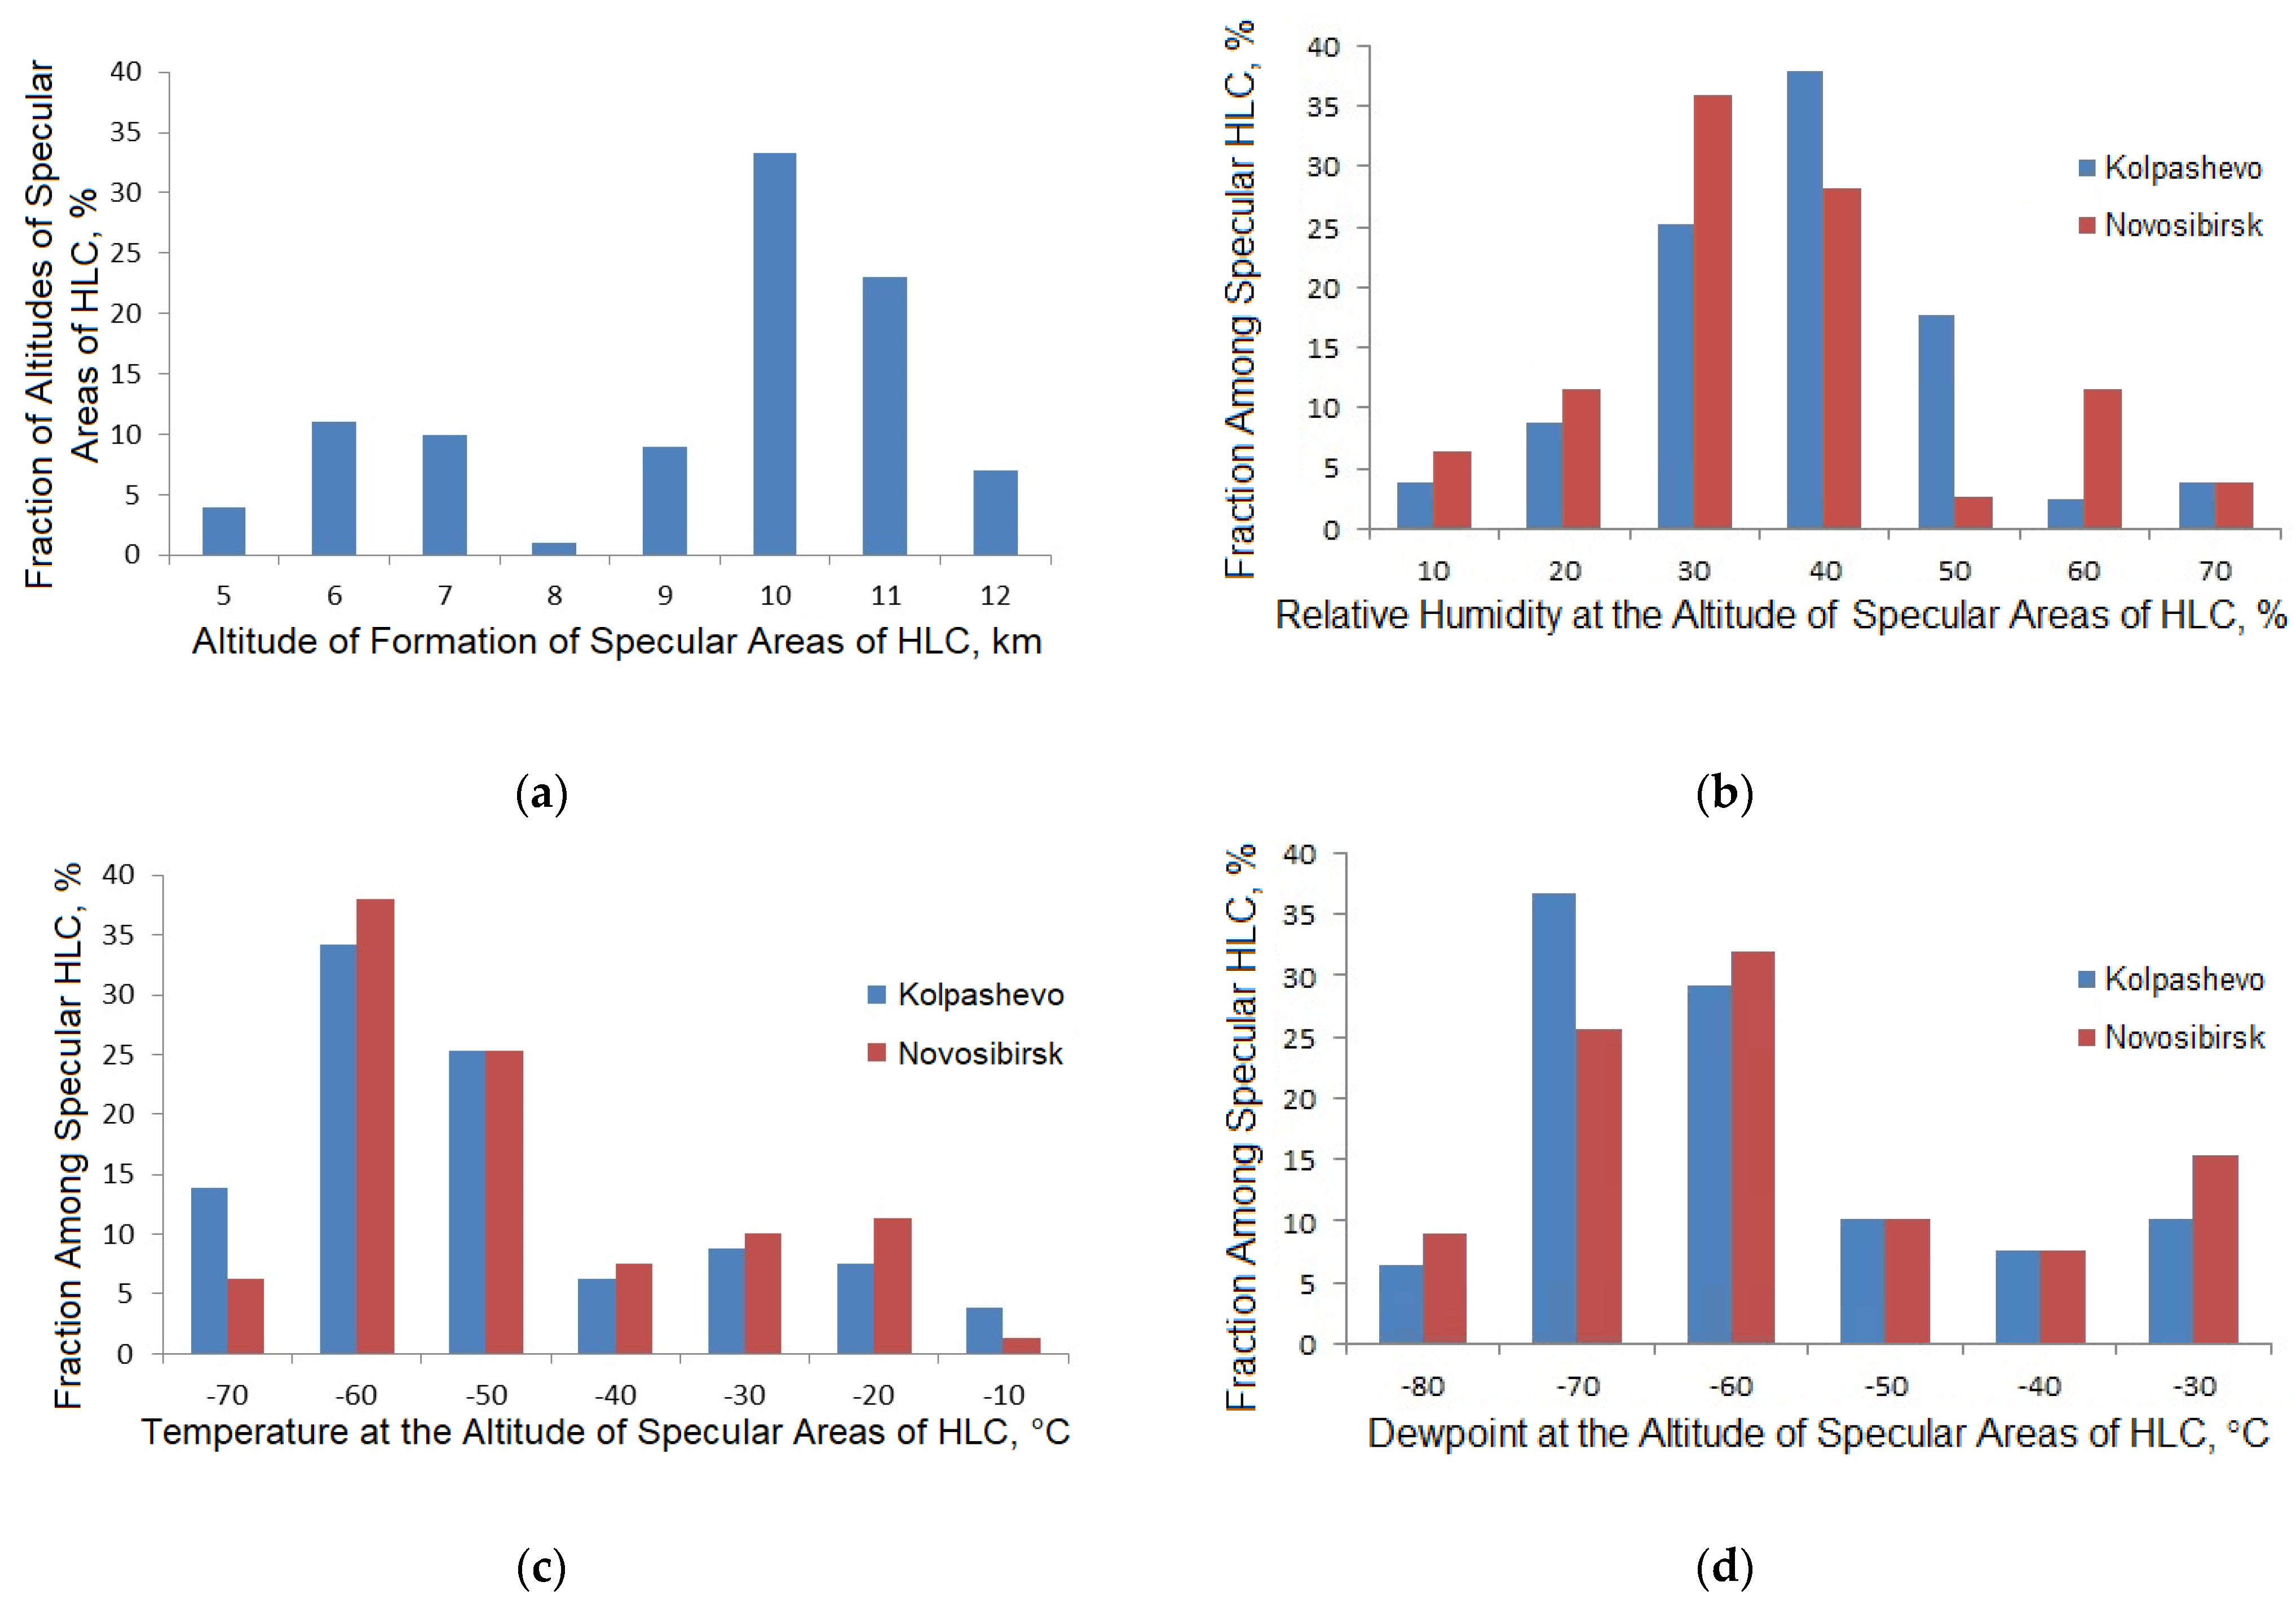
Figure 7 shows the distributions of the specular-HLC formation altitudes according to lidar measurements, as well as the values of relative humidity, air temperature, and dewpoint at these altitudes. Specular HLCs were observed most frequently at the air temperature and dew point of −60...−50 °C and −70...−60 °C, respectively, as well as at 30–40% relative air humidity [26]. Specular HLCs were recorded most frequently at the altitudes of 10–11 and 6–7 km. Most of the regular air traffic routes within a radius of 100 km from Tomsk are located at these altitudes [27]. Before the COVID-19 pandemic, about 200 planes flew over this region per day. Some contrail studies performed at HAMPL from 2016 were described in [28,29]. It is premature to estimate the relationship between the recurrence of specular HLCs and air traffic at their altitudes, because the accumulation duration of the array of recorded aircraft trajectories is much smaller than the ones of the lidar data array (these data have been continuously recorded from August 2019). We noted that the density of air traffic within a radius of 100 km from Tomsk from March to December 2020 was about 1.5–2 times lower than before the pandemic.
The closeness of the values of meteorological parameters according to the measurement data of both indicated aerological stations (see Figure 4) was not always observed. In addition, measurements on these stations were performed only twice a day, at 0:00 and 12:00 UTC (7:00 and 19:00 local time). Thus, a comparison of cloud characteristics determined from the lidar data with the vertical profiles of meteorological parameters often requires a choice: the data from which station and for what time it should be used.
As an illustration of the described difficulties in using radiosonde data when interpreting the results of lidar experiments, Table 2 presents the values of meteorological quantities corresponding to the lidar measurements performed on 1 June 2021 (see Section 2.1).
We noted a noticeable discrepancy between the values of relative and specific humidity, as well as the wind direction and speed according to the data of morning and evening measurements performed at the Kolpashevo and Novosibirsk aerological stations. An estimation of the drift parameters of the examined clouds was performed based on the vertical profiles of wind direction and speed. This was necessary for identifying and studying the aircraft contrails (for example, [28]), as well as for the time correction of the results of the complex, lidar-pyranometric experiments [23]. Concluding the description of the radiosonde data, let us summarize: it is important to find a source of vertical profiles of meteorological characteristics that correspond to the HAMPL location and provide a higher time resolution.

2.2.2. ERA5 Reanalysis

Previously, in the search for a source of a meteorological data alternative to the radiosonde measurements, the applicability of reanalysis to interpret data from the lidar experiments was tested. Such data sets consist of the results of measurements from many meteorological instruments around the globe and use different systems for processing the information. The ERA (short for “ECMWF ReAnalysis”) product (its ERA-Interim version [31]) was used for the reanalysis verification. For this purpose, the reanalysis data for Kolpashevo, Novosibirsk, and Tomsk were compared with the corresponding RAOB data. It was shown [28], that the temperature, the wind direction, and wind speed at the altitudes of HLC formation agreed well with each other for the indicated coordinate points and for both sources of vertical meteorological profiles.
ERA-Interim reanalysis data are available for the period from 1 January 1979 to 31 August 2019. This dataset includes vertical profiles for a number of meteorological parameters (such as temperature, relative humidity, U and V components of wind, etc.). It was superseded by the fifth generation ERA5 reanalysis, which provides high spatial resolution (0.25 × 0.25 °) and a frequent time step (1 h). It includes a continuous series of meteorological data for the period of more than 40 years (from 1979 to the present). The input data for the ERA5 reanalysis are the results of measurements from all over the globe (satellite radiometers; ground, ship, and airborne weather stations; moored buoys, radiosondes; and ground-based radars) [32]. The time series of the air temperature and its derivatives in the reanalysis of the ERA family were homogeneous for the Siberian territory, and could therefore be used to identify spatial heterogeneity caused by the local factors [33]. There are known works in which the ERA5 reanalysis was used to solve the issues of studying the atmosphere, including the verification of the ERA5 data applicability in various territories around the world [34,35,36]. Table 3 presents the example of the ERA5 reanalysis dataset. The notations used in the Table 3 are the same as in Table 2.
The HAMPL provides high temporal (2–3 min) and spatial (from 37.5 m) resolution; therefore, we considered it necessary to evaluate how correctly the ERA5 data can be used for processing and interpreting the results of the lidar measurements.

2.3. Evaluation of the Applicability of the ERA5 Reanalysis for Processing and Interpreting the Lidar Data

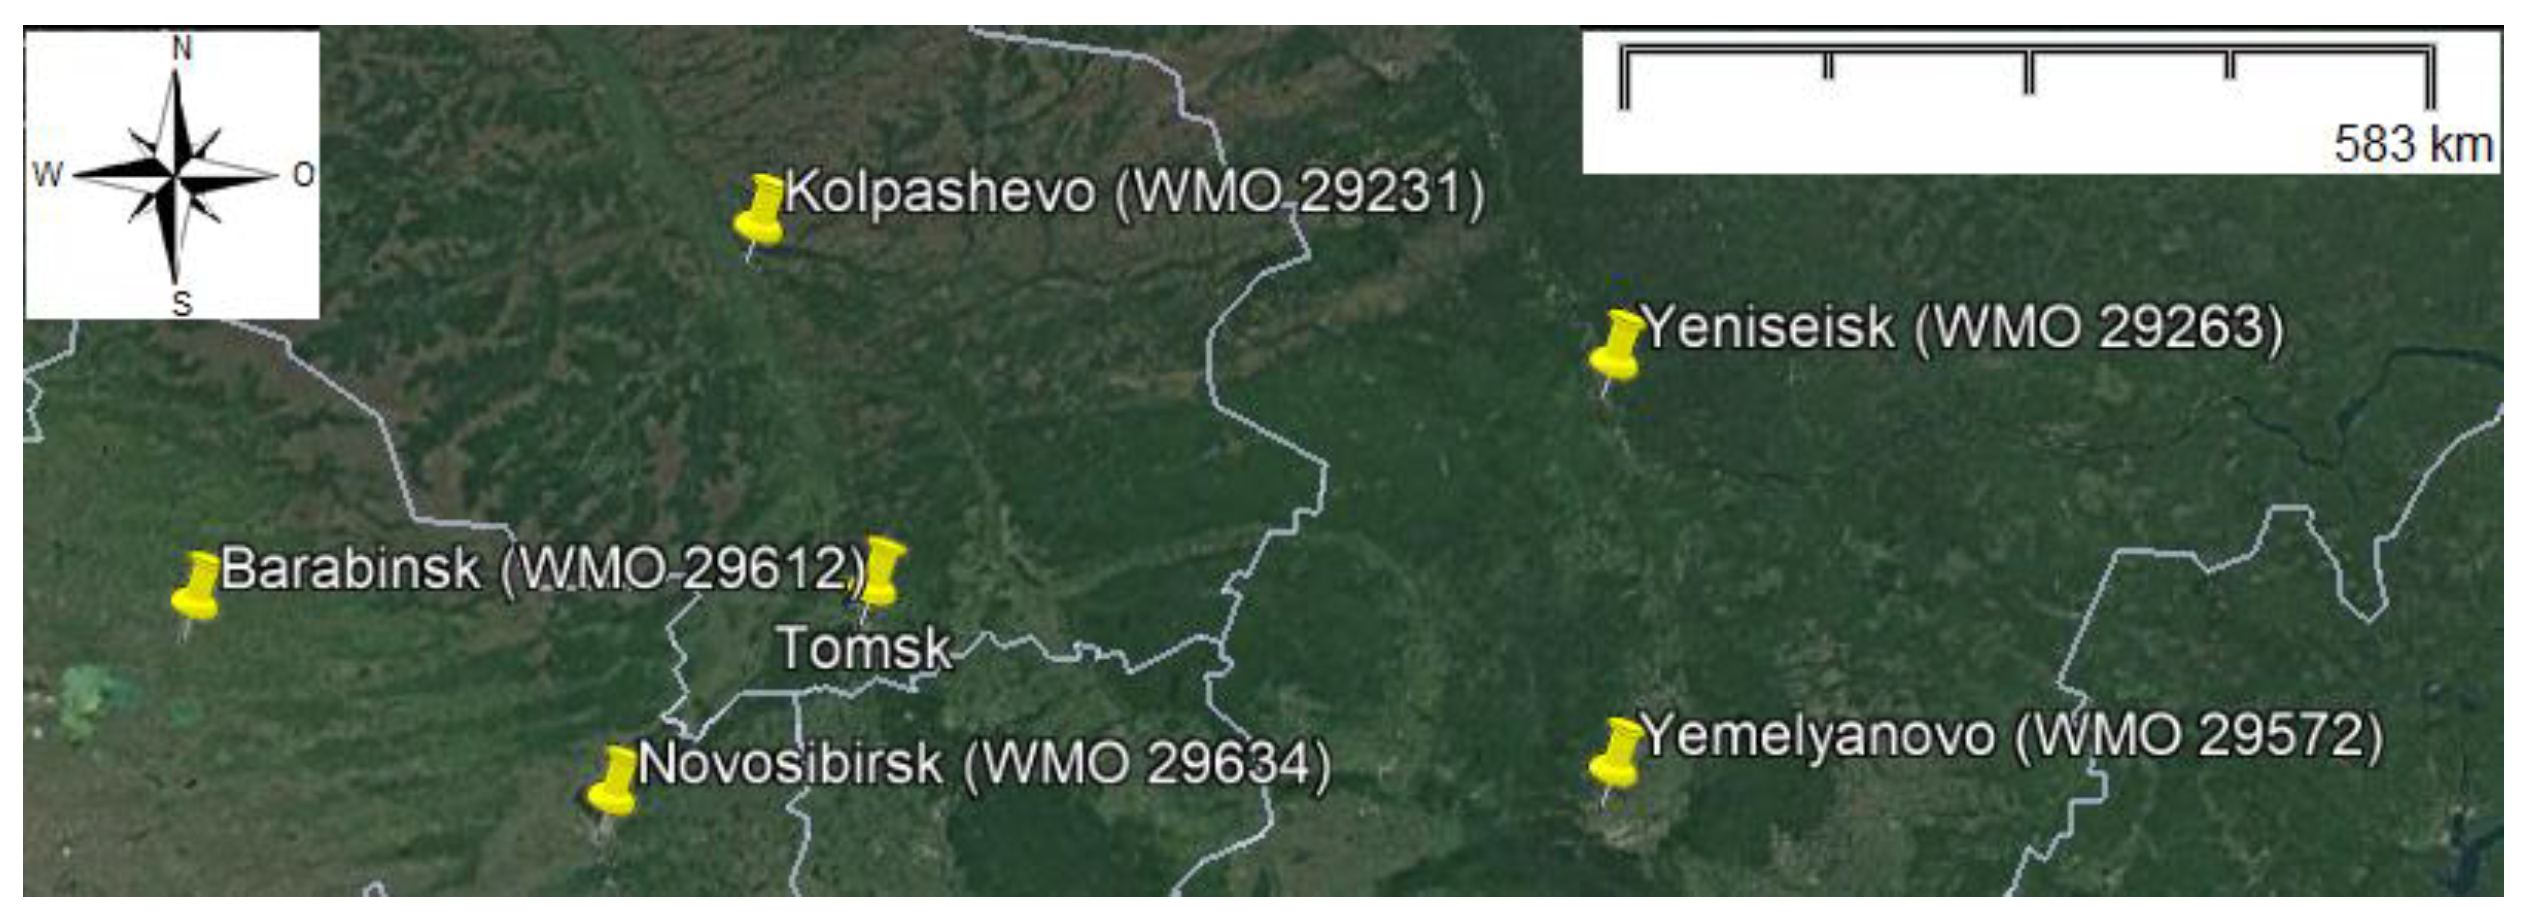
To assess the applicability of the ERA5 reanalysis for interpreting the results of the HAMPL measurements, the RAOB and ERA5 data were analyzed jointly for the coordinates of all aerological stations within a radius of 500 km from Tomsk. Figure 8 shows the location map of these stations, whereas their distances from the HAMPL location point are presented in Table 4.
The values of the temperature and the relative and specific air humidity, as well as the wind direction and speed, were analyzed. The first three of the listed characteristics affect the growth and morphological properties of ice crystals in the HLCs [38], and the wind characteristics are used to calculate the wind drift parameters of the examined clouds. The analysis was performed for the standard isobaric surfaces from 1000 to 50 hPa. This pressure range approximately corresponds to the altitudes from 0 to 20 km and includes the HAMPL operation range (0–15 km).
An array of the meteorological information combined data for all days from 1 January 2016 to 31 December 2020; two time moments per day (corresponding to the time of measurements at the aerological stations, 00:00 and 12:00 UTC). Statistical analysis of the obtained data was performed similarly to [34]. The vertical profiles of the standard deviations of the meteorological values from the ERA5 and RAOB data, as well as the average difference and the correlation coefficient of these values were obtained.
The standard deviation of the values was calculated by the expression:
R M S E = 1 N s i = 1 N s ( X i R A O B X i E R A 5 ) 2
The mean difference of the values showing the sign of deviations was calculated as follows:
B i a s = 1 N s i = 1 N s ( X i E R A 5 X i R A O B )
The correlation coefficient was determined by the expression:
C o r r ( E R A 5 , R A O B ) = ( X E R A 5 X E R A 5 ¯ ) ( X R A O B X R A O B ¯ ) ( X E R A 5 X E R A 5 ¯ ) 2 ( X R A O B X R A O B ¯ ) 2
In order to perform the analysis, a local database was created. It had an irregular step of the atmospheric pressure in the RAOB data and occasional omissions in them. To mitigate the effect of these features, a preliminary selection of data was made: vertical profiles from the ERA5 and RAOB data arrays for the same city and time were compared. Then, the nearest pressure from the RAOB data array was searched for each atmospheric pressure in the ERA5 data. If the pressure difference exceeded 7.5 hPa, then this pair of values was excluded from the further analysis. In addition, this pressure level in the RAOB data was excluded from comparison with the ERA5 data for other levels. Thus, as a result of the selection, there were pairs of values of the meteorological quantities based on the ERA5 and RAOB datasets that were obtained for further comparison with each other.

3. Results

Figure 9, Figure 10, Figure 11, Figure 12 and Figure 13 show the vertical profiles of the RMSE, Bias, and Corr values, as well as the corresponding distributions of deviations of the absolute and relative air humidity, the air temperature, the wind direction, and the wind speed based on the ERA5 [39] relative to the RAOB [25] data for 2016–2020 for the aerological stations specified in Table 4.
The analysis of the obtained vertical profiles of statistical characteristics describing accuracy of the recovery of the meteorological values by the ERA5 reanalysis is presented below.

4. Discussion

Using the standard deviation (RMSE) value as an accuracy measure for recovering the meteorological quantity by the ERA5 reanalysis, we note that the specific air humidity is recovered (Figure 9a) with an accuracy of 0.5–1 g/kg at isobaric levels of 1000–800 hPa, which corresponds to an altitude range of 0–2 km from sea level in the standard atmosphere. At the higher levels, up to the level of 450 hPa (about 6 km in the standard atmosphere), the accuracy is improved: the RMSE takes values in the range of 0.3–0.7 g/kg. However, the vertical profile behavior of the RMSE of specific humidity then changes sharply and takes values from 0.2 to 2.4 g/kg. At the same time, the correlation coefficient Corr, insignificantly fluctuating around unity below the altitudes of HLC formation (at isobaric levels above 450 hPa), also demonstrates a sharp deterioration of the relationship between the recovered and measured values of specific humidity above this level, reaching zero or even negative values there. The magnitude of the average difference Bias at the levels of 1000–800 hPa varies from −0.3 to 0, showing slight variations from −0.1 to 0 above this height, up to the very top of the indicated pressure range. According to Figure 9b, there is most often an underestimation of the specific humidity values from ERA5 when compared to the RAOB. The highest repeatability is in the deviations of specific humidity values (∆q) obtained from ERA5 reanalysis relative to similar values from RAOB data in the range of −0.2...0.1 g/kg at all the considered levels (0–2, 2–6, and over 6 km). With a probability of more than 5% there are ∆q values in the ranges of −0.4...0.2, −0.3...0.2, and −0.2...0.1 g/kg for the lower, middle, and upper levels, respectively. Thus, for the specific air humidity, the range of isobaric levels of the most reliable recovery at the considered coordinate points and for the considered time period is 800–450 hPa (2–6 km in the standard atmosphere). This range includes only a small part of the altitude range of HLC formation and therefore is not useful for interpreting the data of lidar studies of such clouds.
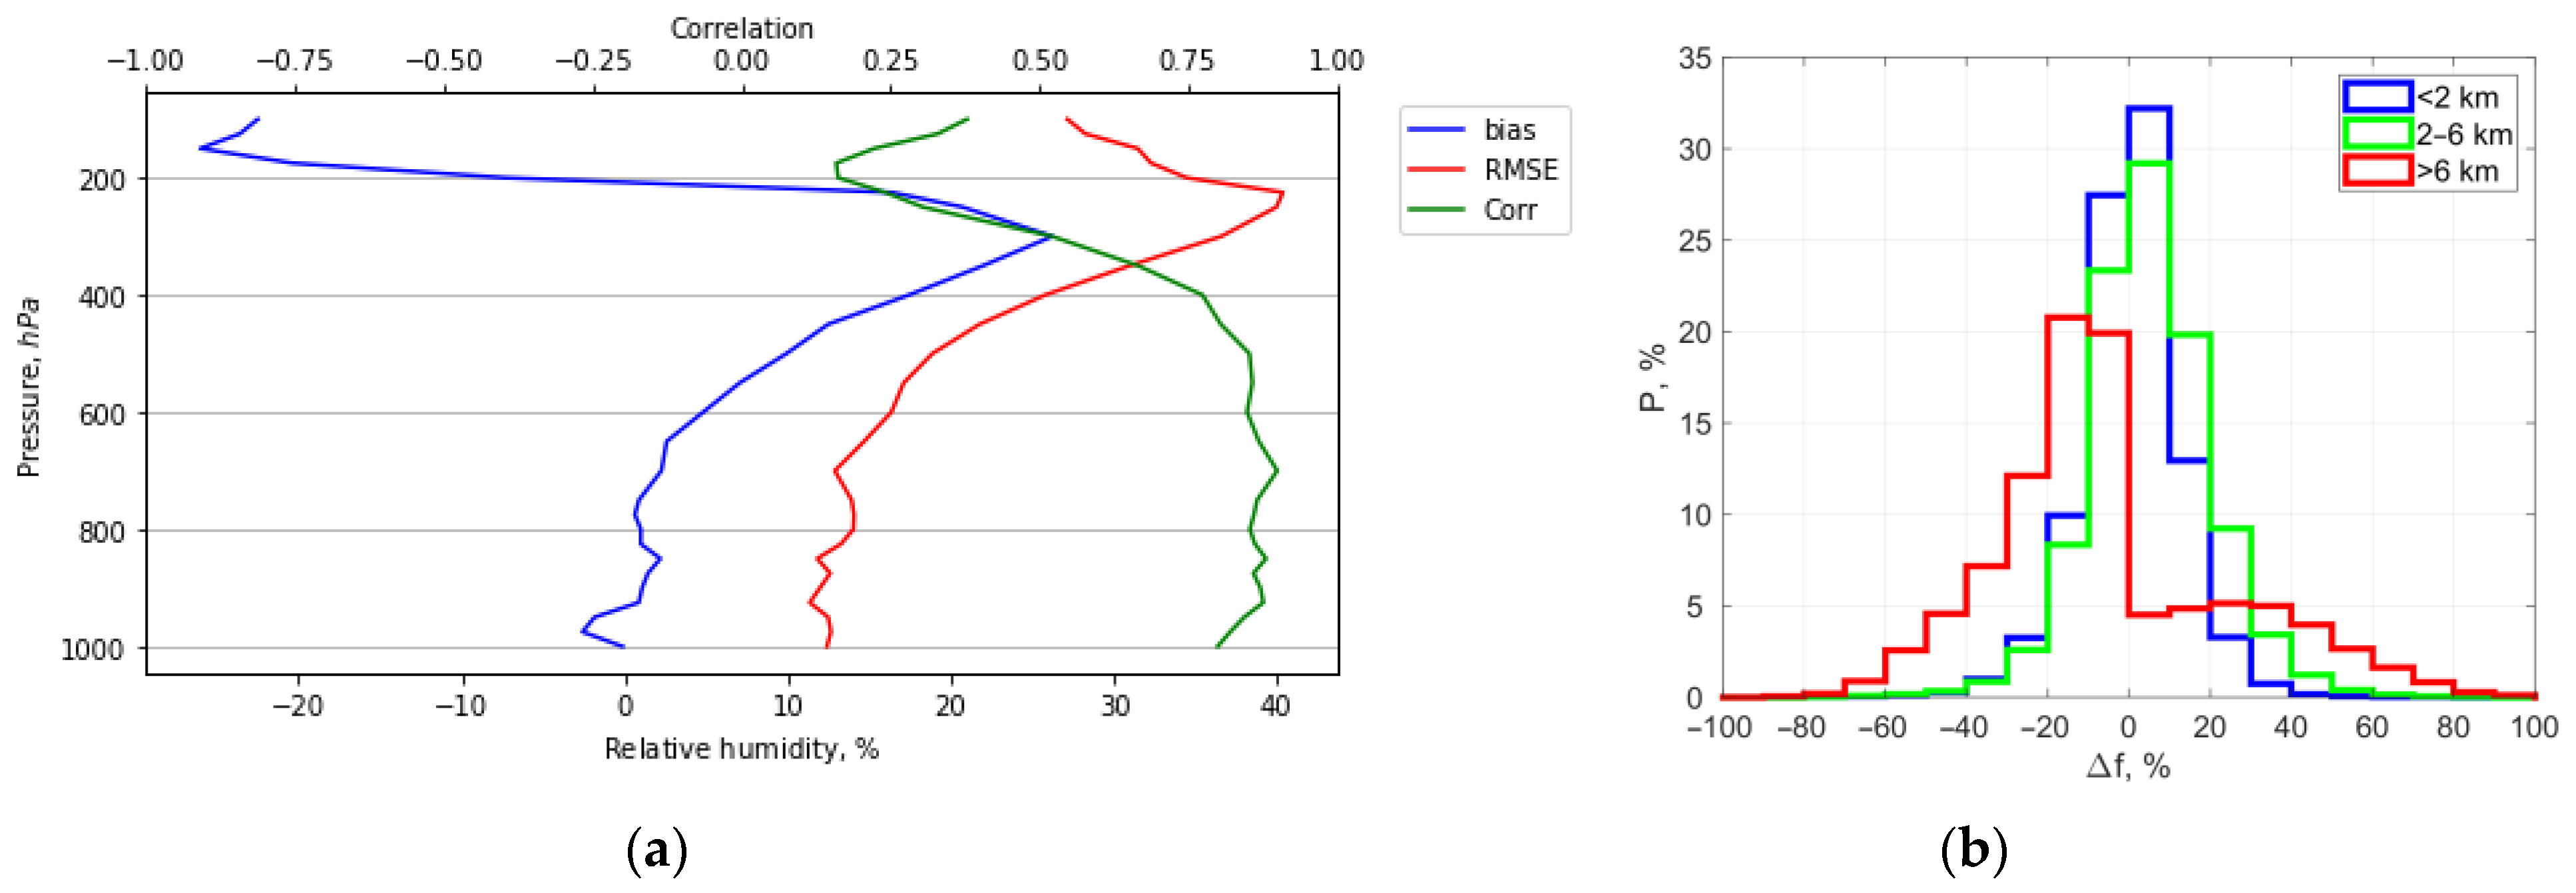
Relative humidity is characterized (Figure 10a) by smoother vertical profiles of the considered statistical characteristics. Nevertheless, it is impossible to call them applicable for the interpretation of the HLC lidar studies data. The lowest values of the RMSE (11–15%), as well as the Bias (−8...2%) are achieved at pressure levels of 1000–800 hPa, corresponding to the lower altitudes. The RMSE increases almost continuously with the isobaric levels increasing (up to the value of 200 hPa), reaching completely unacceptable values around 40%. The Bias behaves similarly, reaching a maximum value of 25% at a lower pressure level (300 hPa). The Corr value in the considered range of isobaric levels has the highest value of about 0.87 at about 700 hPa. For isobaric levels corresponding to the range of HLC formation altitudes (450–200 hPa), this value varies from 0.75 at the bottom of the range to 0.15 at its upper boundary. According to Figure 10b, the lower and middle levels (0–2 and 2–6 km) are usually characterized by an overestimation of the relative humidity from ERA5 compared to RAOB, and the upper level (more than 6 km) is characterized by the underestimation. The greatest repeatability is in the deviations of relative humidity values (∆f) obtained from the ERA5 reanalysis relative to similar values from the RAOB data in the ranges of 0–10% (for the lower and middle levels) and −20...−10% (for the upper level). With a probability of more than 5% ∆f values in the ranges of −20...20, −20...30, and −40...0% are observed for the lower, middle, and upper levels, respectively. Thus, the use of vertical profiles of relative humidity based on the ERA5 data for the interpretation of the HLC laser-sensing data seems to be incorrect.
Describing the accuracy of the temperature recovery (Figure 11a), we note the small RMSE values (0.8–2.8 °C) and extremely small fluctuations of the Corr values around unity in the entire considered range of isobaric levels, which is known to characterize the very high accuracy of the ERA5 data. Nevertheless, here we consider the fluctuations of the vertical profiles of the examined statistical characteristics in more detail. The vertical RMSE profile fluctuate with the greatest amplitude in the range of 0.9–2.8 °C at levels of 1000–800 hPa. At higher altitudes, up to an isobaric level of 450 hPa, the range of the temperature RMSE values is 0.9–1.4 °C, and 1.4–2.1 °C for pressure range from 450 to 200 hPa. The Bias value shows fluctuations with even smaller amplitude: 0–0.9 °C for isobaric levels of 1000–800 hPa, 0.2–0.3 °C for levels of 800–450 hPa, and 0.1–0.5 °C below 450 hPa. According to Figure 11b, the overestimation of air temperature values based on ERA5 data relative to RAOB data is most often observed. The highest repeatability is observed for deviations of air temperature values (∆t) obtained from the ERA5 reanalysis relative to similar values from the RAOB data in the range of 0–1 C at all the considered isobaric levels (0–2, 2–6, and more than 6 km). There is a more than 5% probability of ∆t values in the ranges −2...2, −1...2, and −2...2 °C for lower, middle, and upper levels, respectively. Obtained results demonstrate a very high accuracy of temperature recovering by ERA5 reanalysis in the entire considered range of altitudes, and therefore we evaluate these data as applicable for the analysis of the HLC laser sensing results. We emphasize that temperature is one of the most important meteorological parameters for analyzing the conditions of formation for the preferred orientation of ice particles in clouds. In addition, the shapes of such particles are also often associated specifically with temperature (e.g., [38]).
Analyzing the wind direction (Figure 12a), we note the unacceptably high RMSE values in the whole considered range of altitudes. Thus, at isobaric levels of 1000–800 hPa, this value takes values of 52–75°. Higher—up to 450 hPa—the RMSE fluctuations slightly decrease: the range of its values here is 42–57°, and at higher levels the values lie in the range of 35–50°. The vertical profile of the wind direction Bias is noteworthy: at isobaric levels of 1000–800 hPa, this value varies from −1 to 1°, and it varies from 0 to 3° at higher levels, which could be considered insignificant if the RMSE did not behave as described above. The Corr value at isobaric levels of 1000–800 hPa varies in the range of 0.63–0.77. At higher levels, up to a pressure of 450 hPa, as for the RMSE, the situation improves slightly: the Corr changes from 0.75 to 0.85. At higher altitudes, the variability of the Corr values is slightly greater: 0.74–0.86. According to Figure 12b, an overestimation of the wind direction values based on the ERA5 data 14 of 17 relative to the RAOB is usually observed. The greatest recurrence is in the deviations of wind direction values (∆D) obtained from the ERA5 reanalysis relative to similar values from the RAOB data in the range of 0–10° at all the considered levels (0–2, 2–6, and more than 6 km). With a probability of more than 5%, ∆D values change in the range from −30° to 30° for the lower and middle levels and takes values from −20° to 20° for the upper level. To summarize the analysis of the wind direction based on the ERA5 data, we conclude that, in the range of altitudes of HLC formation, the differences of the recovered values often differ significantly from those measured by radiosondes, and therefore their applicability to lidar data analysis is limited, although not impossible. A recommendation is to compare these ERA5 data with the results of the radiosonde observations closest in time and made at the stations closest to the HLC study location.
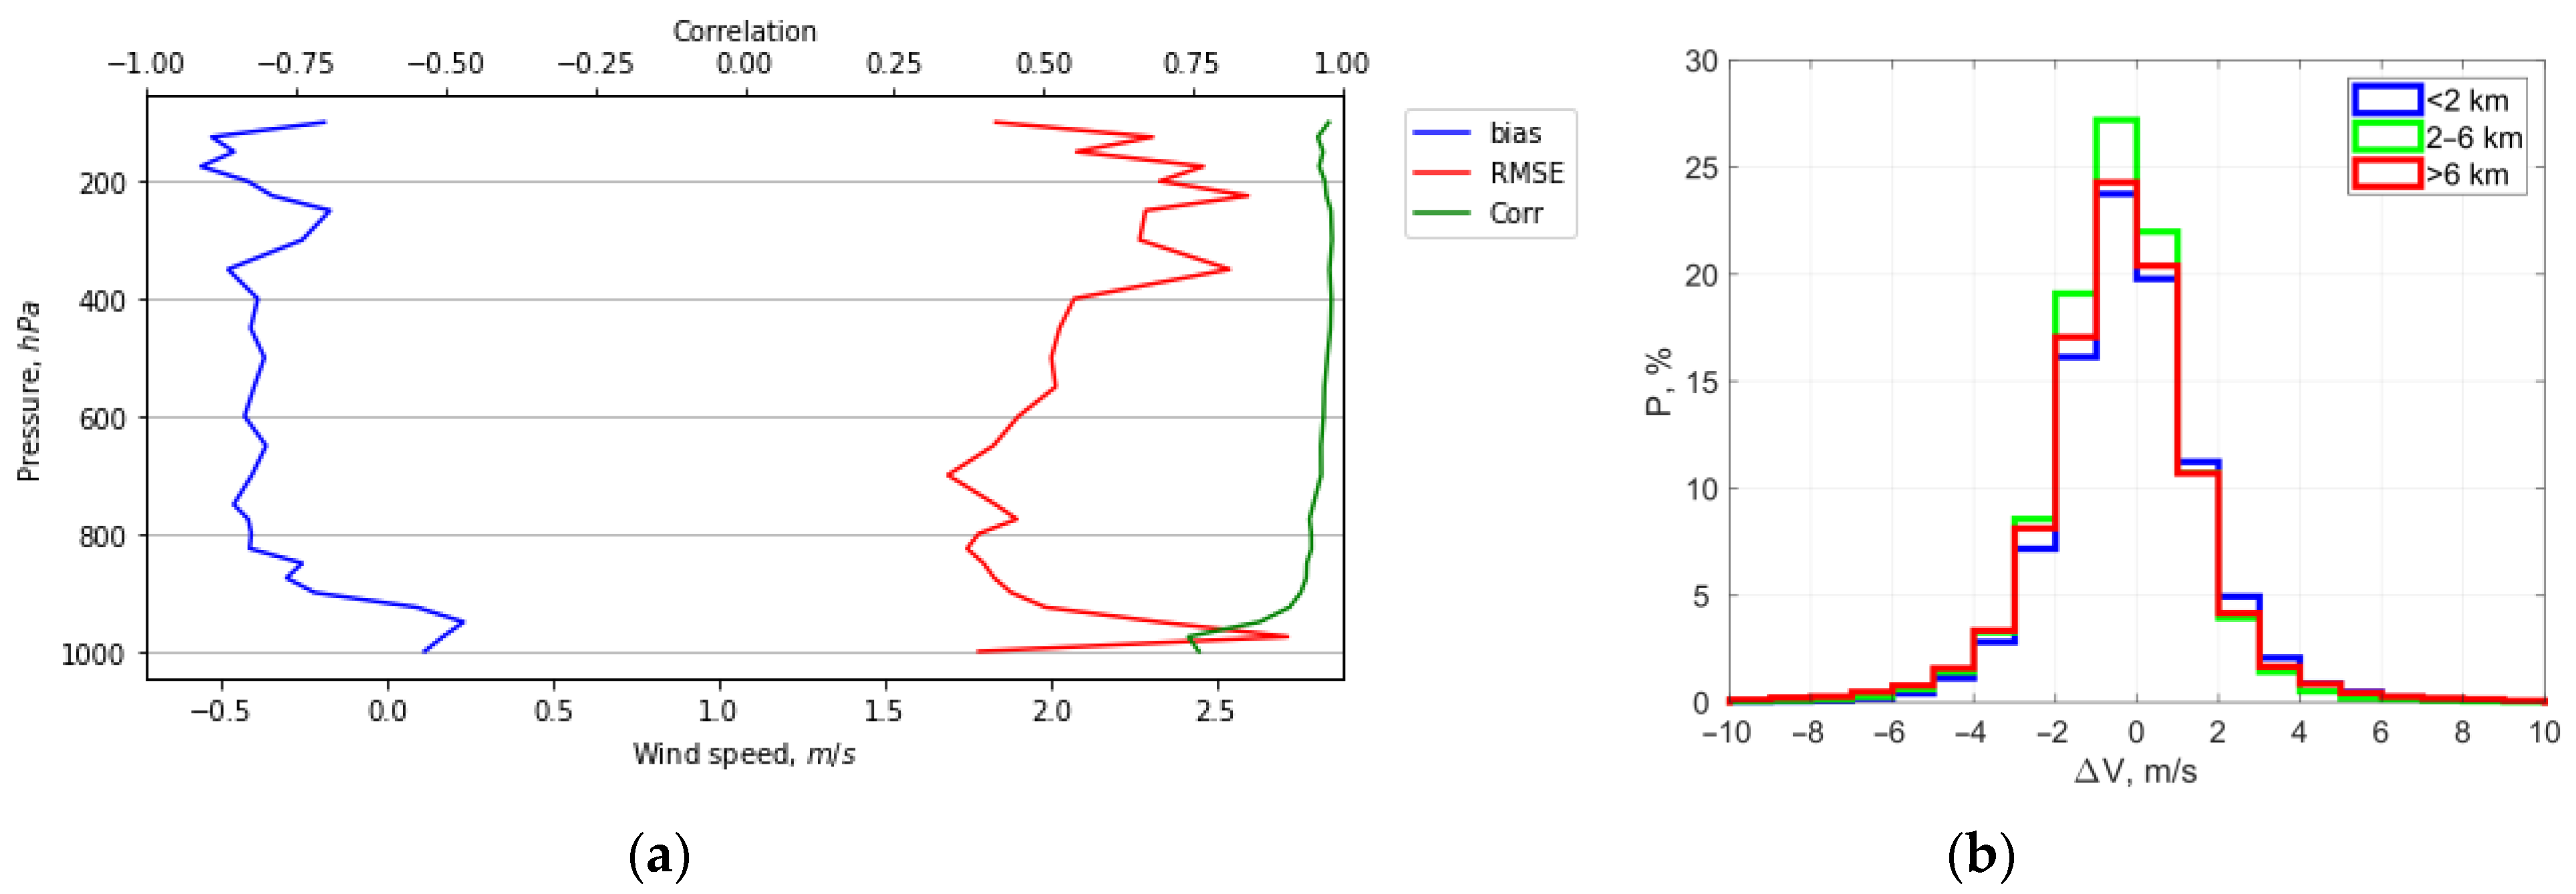
The wind speed (Figure 13a) is characterized by an even more pronounced difference in the behavior of the vertical profiles of all considered statistical quantities in three examined pressure intervals. In particular, the RMSE varies in the range of 1.8–2.8 m/s at isobaric levels of 1000–800 hPa. A similar situation is also observed at levels of 450–200 hPa: the RMSE takes values of 2–2.5 m/s. At the same time, for pressures of 800–450 hPa, the vertical profile of the RMSE shifts noticeably towards lower values, indicating a higher recovery accuracy of 1.7–2 m/s. It is remarkable that the correlation coefficient Corr drops to an unacceptable value of 0.75 only at isobaric levels of 1000–800 hPa. At higher layers, up to 450 hPa, this value increases all the time, reaching a value of 0.95. From 450 to 200 hPa, Corr is still close to 0.95 and only above 200 hPa does this value slightly decrease. An analysis of the Bias vertical profile behavior leads to a similar observation. At isobaric levels between 1000 and 800 hPa, the largest variations occur (from −0.5 to 0.2 m/s), and the area of highest accuracy (Bias values from −0.5 to −0.4) is in the level range of 800–450 hPa. In general, the whole range of variation of the Bias from −0.5 to 0.2 m/s does not cause any doubt about the accuracy of wind speed recovering. According to Figure 13b, there is usually a slight underestimation of the wind speed values based on the ERA5 data relative to RAOB. The highest repeatability is in the deviations of wind speed values (∆V) obtained from the ERA5 reanalysis relative to similar values from the RAOB data in the range −1...0 m/s at lower, middle, and upper levels (0–2, 2–6, and more than 6 km). Deviations of the wind speed values in the range of −3...2 m/s are observed at all levels with a probability of more than 5%. Thus, the accuracy of wind speed recovery by ERA5 reanalysis is acceptable for the range of altitudes of HLC formation.

5. Conclusions

The presented results show a promising application of the ERA5 reanalysis to determine the vertical profiles of temperature and with direction, which are extremely necessary for HLC studying. This fact allows the reanalysis data for Tomsk to be used for interpreting the results of experiments performed on the HAMPL. We should note that there are no regular radiosonde measurements in Tomsk, so the reanalysis seems to be a source of vertical profiles of meteorological quantities for the HAMPL coordinates. In addition, ERA5 data will improve the temporal resolution of meteorological information in the lidar–meteorological dataset from 12 h (RAOB) to 1 h (ERA5). Wind direction can also be used for such studies, but, as commented above, an additional comparison with the radiosonde observations may be necessary. Vertical profiles of the specific and relative humidity show significant discrepancies from those measured by radiosondes, and therefore we cannot conclude about correctness of their usage. Thus, the ERA5 reanalysis data on temperature and wind characteristics can be used for the interpretation of the results of lidar studies of high-level clouds, taking into account the indicated limitations. A comparison of the results of lidar data interpretation with the use of radiosonde and ERA5 reanalysis data will be made in future works.
Although the described results are obtained for the region presented in Figure 8, they can be extended to the whole of Western Siberia. However, we admit that a similar verification of the ERA5 data for other regions may show different results. In addition, we should keep in mind the limited time interval of the considered data sample: only meteorological data for 2016–2020 period were analyzed. We suppose that expanding the time range may also affect such analysis. The data sample used in this article, which combines measurements and calculations for each day during 5 years and for 5 cities, is certainly representative. Therefore, possible deviations of the results obtained from the extended data samples are not expected to be significant.

Author Contributions

I.B. (Ilia Bryukhanov), O.K., and I.S. developed the idea for this paper. I.B. (Ilia Bryukhanov), E.N., N.K., I.Z., A.S., and I.S. developed the experimental methods, constructed the HAMPL of TSU and performed lidar measurements. O.K., I.B. (Ilia Bryukhanov), M.P., E.N., K.P., and A.D. developed software for data processing, visualization, and validation. I.B. (Ilia Bryukhanov), M.P., O.K., K.P., V.B., and I.S. analyzed the measurement and computation data. I.B. (Ilia Bryukhanov), M.P., O.K., N.K., N.K., A.D., I.B. (Iurii Bordulev), V.K., V.B., and I.S. discussed results and wrote and edited the paper. All authors have read and agreed to the published version of the manuscript.

Funding

The work was performed with the financial support of the Russian Science Foundation, Grant No. 21-72-10089.

Data Availability Statement

Publicly available datasets were analyzed in this study. This data can be found here: [http://weather.uwyo.edu] and [https://cds.climate.copernicus.eu].

Conflicts of Interest

The authors declare no conflict of interest.

References

  1. Dmitrieva-Arrago, L.R.; Trubina, M.A.; Tolstyh, M.A. Role of Phase Composition of Clouds in Forming High and Low Frequency Radiaion. Proc. Hydrometeorol. Res. Cent. Russ. Fed. 2017, 363, 19–34. (In Russian) [Google Scholar]
  2. Liou, K.N. Influence of Cirrus Clouds on Weather and Climate Processes: A Global Perspective. Mon. Weather. Rev. 1986, 114, 1167–1199. [Google Scholar] [CrossRef]
  3. Wylie, D.P.; Menzel, W.P.; Woolf, H.M.; Strabala, K.I. Four Years of Global Cirrus Cloud Statistics Using HIRS. J. Clim. 1994, 7, 1972–1986. [Google Scholar] [CrossRef]
  4. Reichardt, J.; Reichardt, S.; Lin, R.F.; Hess, M.; McGee, T.J.; Starr, D.O. Optical-Microphysical Cirrus Model. J. Geophys. Res. Atmos. 2008, 113, D22201:1–D22201:17. [Google Scholar] [CrossRef] [Green Version]
  5. Stocker, T.F.; Qin, D.; Plattner, G.K.; Tignor, M.; Allen, S.K.; Boschung, J.; Nauels, A.; Xia, Y.; Bex, V.; Midgley, P.M. (Eds.) Climate Change 2013—The Physical Science Basis: Working Group I Contribution to the Fifth Assessment Report of the Intergovernmental Panel on Climate Change; Cambridge University Press: Cambridge, UK, 2014. [Google Scholar] [CrossRef] [Green Version]
  6. Shanks, J.G.; Lynch, D.K. Specular Scattering in Cirrus Clouds. In Proceedings of the Passive Infrared Remote Sensing of Clouds and the Atmosphere III, Paris, France, 25–28 September 1995; Lynch, D.K., Shettle, E.P., Eds.; International Society for Optics and Photonics, SPIE: Bellingham, DC, USA, 1995; Volume 2578, pp. 227–238. [Google Scholar] [CrossRef]
  7. Heymsfield, A.J.; Krämer, M.; Luebke, A.; Brown, P.; Cziczo, D.J.; Franklin, C.; Lawson, P.; Lohmann, U.; McFarquhar, G.; Ulanowski, Z.; et al. Cirrus Clouds. Meteorol. Monogr. 2017, 58, 2.1–2.26. [Google Scholar] [CrossRef] [Green Version]
  8. Mitchell, D.L.; Finnegan, W. Modification of Cirrus Clouds to Reduce Global Warming. Environ. Res. Lett. 2009, 4, 045102:1–045102:8. [Google Scholar] [CrossRef]
  9. Storelvmo, T.; Kristjansson, J.E.; Muri, H.; Pfeffer, M.; Barahona, D.; Nenes, A. Cirrus Cloud Seeding has Potential to Cool Climate. Geophys. Res. Lett. 2013, 40, 178–182. [Google Scholar] [CrossRef] [Green Version]
  10. Vorobyova, V.V.; Volodin, E.M. Numerical Simulation of Influence on Climate with the Help of Change of Properties of High-Level Clouds in Base of IVM RAS Model. Proc. Hydrometeorol. Res. Cent. Russ. Fed. 2017, 363, 5–18. (In Russian) [Google Scholar]
  11. Minnis, P.; Ayers, J.K.; Palikonda, R.; Phan, D. Contrails, Cirrus Trends, and Climate. J. Clim. 2004, 17, 1671–1685. [Google Scholar] [CrossRef]
  12. International Cloud Atlas. Available online: https://cloudatlas.wmo.int/en/homomutatus.html (accessed on 3 February 2022).
  13. Kärcher, B. Formation and Radiative Forcing of Contrail Cirrus. Nat. Commun. 2018, 9, 1824:1–1824:17. [Google Scholar] [CrossRef]
  14. Gierens, K.; Vázquez-Navarro, M. Statistical Analysis of Contrail Lifetimes from a Satellite Perspective. Meteorol. Z. 2018, 27, 183–193. [Google Scholar] [CrossRef]
  15. Rosenberg, G.V. Stokes Vector-Parameter. Adv. Phys. Sci. 1955, 56, 79–110. (In Russian) [Google Scholar]
  16. Samohvalov, I.V.; Kaul, B.V.; Nasonov, S.V.; Zhivotenyuk, I.V.; Bryukhanov, I.D. Backscattering Light Matrix of Reflecting High-Level Clouds Consisting of Crystal Mostly Horizontally-Oriented Particles. Atmos. Ocean. Opt. 2012, 25, 403–411. (In Russian) [Google Scholar]
  17. Guasta, M.D.; Vallar, E.; Riviere, O.; Castagnoli, F.; Venturi, V.; Morandi, M. Use of Polarimetric Lidar for the Study of Oriented Ice Plates in Clouds. Appl. Opt. 2006, 45, 4878–4887. [Google Scholar] [CrossRef] [PubMed]
  18. Hayman, M.; Spuler, S.; Morley, B.; VanAndel, J. Polarization Lidar Operation for Measuring Backscatter Phase Matrices of Oriented Scatterers. Opt. Express 2012, 20, 29553–29567. [Google Scholar] [CrossRef]
  19. Volkov, S.N.; Samokhvalov, I.V.; Cheong, H.D.; Kim, D. Investigation of East Asian Clouds with Polarization Light Detection and Ranging. Appl. Opt. 2015, 54, 3095–3105. [Google Scholar] [CrossRef] [PubMed]
  20. Kirillov, N.S.; Samokhvalov, I.V. Application of an Electro-Optical Shutter for Strobing of Lidar Signals. In Proceedings of the 20th International Symposium on Atmospheric and Ocean Optics: Atmospheric Physics, Novosibirsk, Russia, 23–27 June 2014; Romanovskii, O.A., Ed.; International Society for Optics and Photonics, SPIE: Bellingham, DC, USA, 2014; Volume 9292, pp. 92922D:1–92922D:5. [Google Scholar] [CrossRef]
  21. Samokhvalov, I.V.; Bryukhanov, I.D.; Nasonov, S.V.; Zhivotenyuk, I.V.; Stykon, A.P. Investigation of the Optical Characteristics of Cirrus Clouds with Anomalous Backscattering. Russ. Phys. J. 2013, 55, 925–929. [Google Scholar] [CrossRef]
  22. Samokhvalov, I.V.; Bryukhanov, I.D.; Ni, E.V. Temporal Variability of the Specularity of High-Level Clouds According to the Data on Laser Polarization Sensing. In Proceedings of the 26th International Symposium on Atmospheric and Ocean Optics, Atmospheric Physics, Moscow, Russia, 29 June–3 July 2020; Matvienko, G.G., Romanovskii, O.A., Eds.; International Society for Optics and Photonics, SPIE: Bellingham, DC, USA, 2020; Volume 11560, pp. 115604C:1–115604C:5. [Google Scholar] [CrossRef]
  23. Bryukhanov, I.D.; Zuev, S.V.; Samokhvalov, I.V. Effect of Specular High-Level Clouds on Scattered Solar Radiation Fluxes at the Zenith. Atmos. Ocean. Opt. 2021, 34, 327–334. [Google Scholar] [CrossRef]
  24. Chervyakov, M.Y. Zondirovanie Atmosfery: Uchebno-Metodicheskoe Posobie Dlya Studentov, Obuchayuschihsya po Napravleniyu 05.03.05 Prikladnaya Gidrometeorologiya; Nauka: Saratov, Russia, 2019. (In Russian) [Google Scholar]
  25. University of Wyoming. Available online: http://weather.uwyo.edu (accessed on 23 January 2022).
  26. Samokhvalov, I.V.; Bryukhanov, I.D.; Ni, E.V.; Zhivotenyuk, I.V.; Doroshkevich, A.A.; Stykon, A.P. Analysis of Occurrence Frequency and Forming Condition of Reflective High Level Clouds Using Polarized Laser Sensing Data. Trudy Voenno-Kosmicheskoy Akademii Imeni A. F. Mozhaiskogo 2021, 680, 342–345. (In Russian) [Google Scholar]
  27. Flightradar24: Live Air Traffic. Available online: https://www.flightradar24.com (accessed on 23 January 2022).
  28. Samokhvalov, I.V.; Bryukhanov, I.D.; Park, S.; Zhivotenyuk, I.V.; Ni, E.V.; Stykon, A.P. Optical Characteristics of Contrails According to Polarization Lidar Sensing Data. In Proceedings of the 24th International Symposium on Atmospheric and Ocean Optics: Atmospheric Physics, Tomsk, Russia, 2–5 July 2018; Matvienko, G.G., Romanovskii, O.A., Eds.; International Society for Optics and Photonics, SPIE: Bellingham, DC, USA, 2018; Volume 10833, pp. 108335J:1–108335J:6. [Google Scholar] [CrossRef]
  29. Samokhvalov, I.V.; Bryukhanov, I.D.; Shishko, V.A.; Kustova, N.V.; Nie, E.V.; Konoshonkin, A.V.; Loktyushin, O.Y.; Timofeev, D.N. Estimation of Microphysical Characteristics of Contrails by Polarization Lidar Data: Theory and Experiment. Atmos. Ocean. Opt. 2019, 32, 400–409. [Google Scholar] [CrossRef]
  30. University of Wyoming. Description of Sounding Columns. Available online: http://weather.uwyo.edu/upperair/columns.html (accessed on 23 January 2022).
  31. The European Centre for Medium-Range Weather Forecasts. Available online: https://www.ecmwf.int (accessed on 23 January 2022).
  32. ECMWF Confluence Wiki. ERA5: Data Documentation. Available online: https://confluence.ecmwf.int/display/CKB/ERA5%3A+data+documentation#ERA5:datadocumentation-Introduction (accessed on 23 January 2022).
  33. Gordov, E.; Schukin, G.G.; Itkin, D.M.; Karavaev, D.M.; Chichikova, E.F. Analysis of Regional Climatic Processes of Siberia: Approach, Data and Some Results. Vestnik Novosibirskogo Gosudarstvennogo Universiteta: Inf. Tehnol. 2011, 9, 56–66. (In Russian) [Google Scholar]
  34. Han, Y.; Yang, Q.; Nana, L.; Zhang, K.; Qing, C.; Li, X.; Wu, X.; Luo, T. Analysis of wind-speed profiles and optical turbulence above Gaomeigu and the Tibetan Plateau using ERA5 data. Mon. Not. R. Astron. Soc. 2021, 501, 4692–4702. [Google Scholar] [CrossRef]
  35. Mayer, J.; Mayer, M.; Haimberger, L. Consistency and homogeneity of atmospheric energy, moisture, and mass budgets in ERA5. J. Clim. 2021, 34, 3955–3974. [Google Scholar] [CrossRef]
  36. Zhu, J.; Xie, A.; Qin, X.; Wang, Y.; Xu, B.; Wang, Y. An assessment of ERA5 reanalysis for Antarctic near-surface air temperature. Atmosphere 2021, 12, 217. [Google Scholar] [CrossRef]
  37. Central Aerological Observatory (Scientific and Technical Center for Radio Sounding). Available online: http://cao-ntcr.mipt.ru/monitor/locator.htm (accessed on 23 January 2022).
  38. Um, J.; McFarquhar, G.M.; Hong, Y.P.; Lee, S.S.; Jung, C.H.; Lawson, R.P.; Mo, Q. Dimensions and Aspect Ratios of Natural Ice Crystals. Atmos. Chem. Phys. 2015, 15, 3933–3956. [Google Scholar] [CrossRef]
  39. Copernicus Climate Data Store. Available online: https://cds.climate.copernicus.eu (accessed on 23 January 2022).
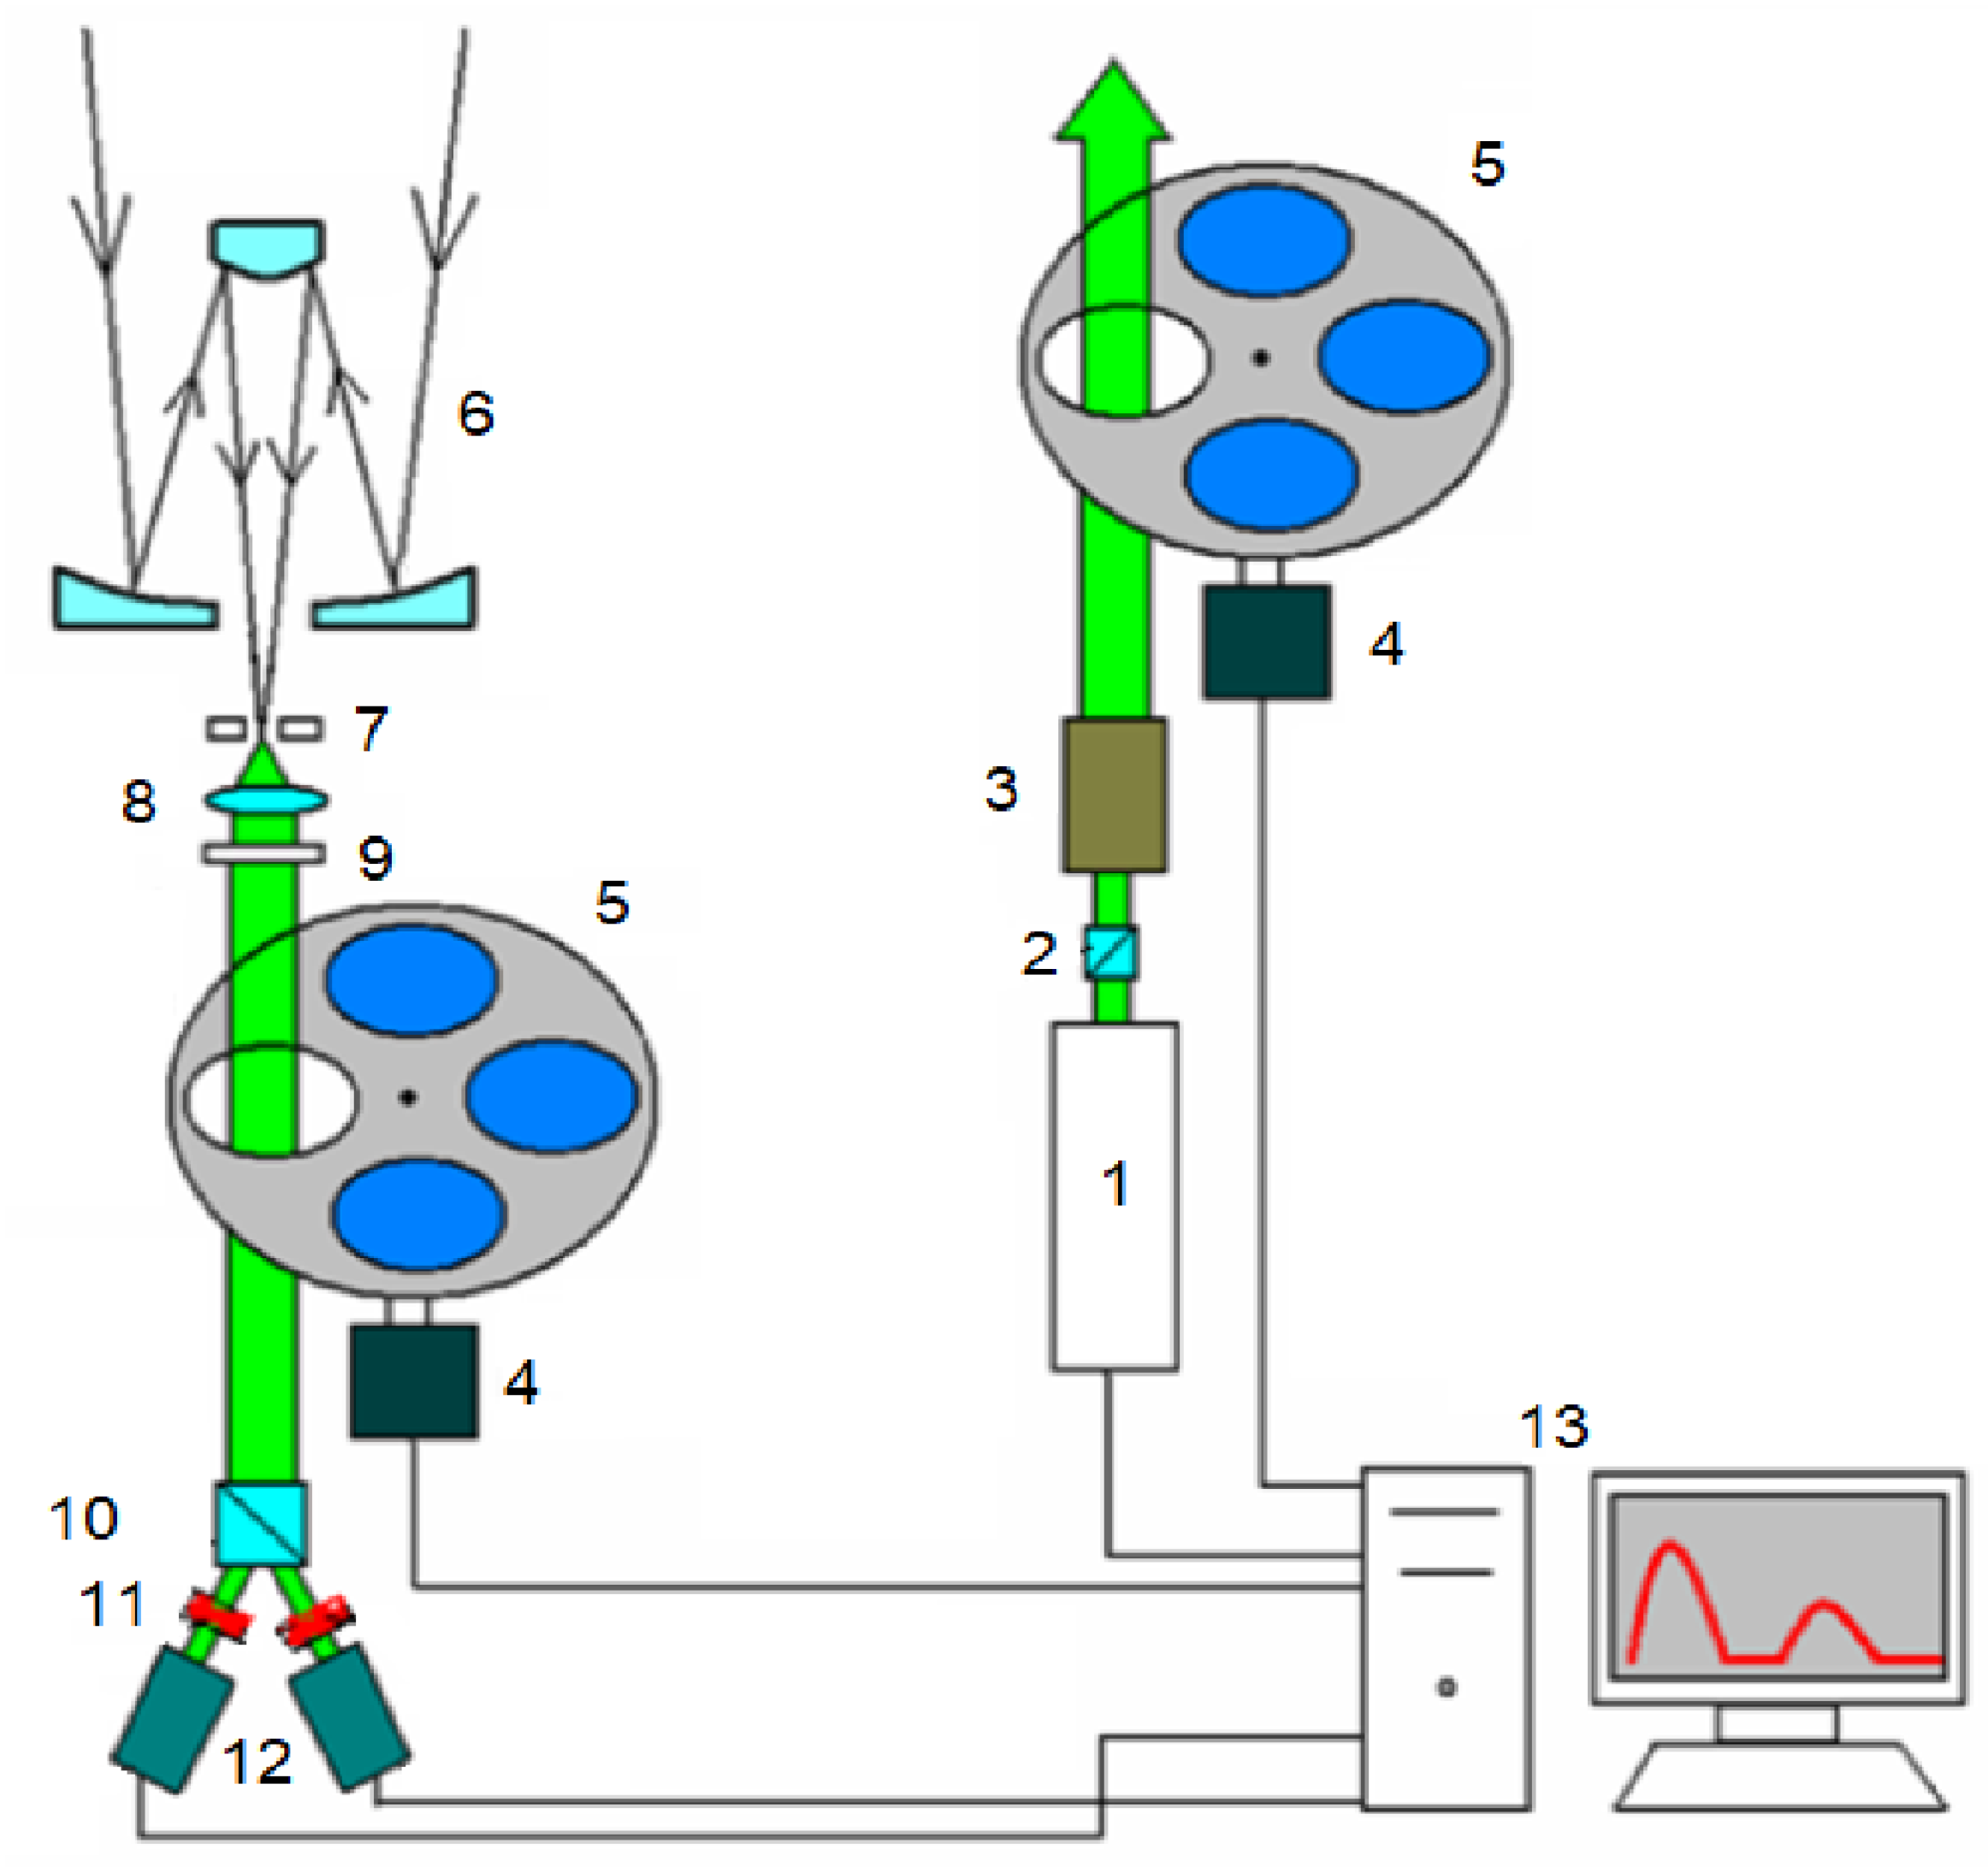
Figure 1. HAMPL block diagram: 1—laser; 2—Glan–Taylor prism; 3—collimator; 4—stepper motor; 5—polarization transformation unit; 6—Cassegrain telescope; 7—field stop; 8—lens; 9—interference filter; 10—Wollaston prism; 11—PMTs; 12—EOSs; 13—computer-based data recording and displaying equipment.
Remotesensing 15 00109 g001
Figure 2. Temporal dynamics of the vertical profile of the lidar signal intensity (6 January 2021; series of measurements was performed from 2:34 to 2:51 p.m.).
Remotesensing 15 00109 g002
Figure 3. Vertical profile of the lidar signal intensity (6 January 2021; series of measurements was performed from 2:34 to 2:51 p.m.).
Remotesensing 15 00109 g003
Figure 4. Vertical profiles of temperature (a) and wind direction (b) from data of the radiosonde observations (RAOB) and reanalysis (ERA5) for the Kolpashevo, Novosibirsk and Tomsk coordinates.
Remotesensing 15 00109 g004
Figure 5. Distribution of the number of measurement series with the parallel accumulation of photoelectron pulses at the HAMPL (a) and specular HLCs registered with it (b) by season (2016–2020).
Remotesensing 15 00109 g005
Figure 6. Distribution of HLC specular area sizes (2016–2020).
Remotesensing 15 00109 g006
Figure 7. Distribution of altitudes of the formation of HLCs with horizontally oriented ice particles detected with HAMPL (a) and corresponding values of relative humidity (b), air temperature (c), and dew point (d) at their altitudes based on the radiosonde observation data [25] (2016–2020).
Remotesensing 15 00109 g007
Figure 8. Location map of aerological stations closest to Tomsk according to the website [37]; the image was obtained with the geographic information system Google Earth Distribution of HLC specular area sizes (2016–2020).
Remotesensing 15 00109 g008
Figure 9. Vertical profiles of RMSE, Bias, and Corr for the values of specific humidity based on ERA5 [39] relative to RAOB [25] data for 2016–2020 (a) and the corresponding distribution of deviations Δq (b) for the coordinates of the specified aerological stations.
Remotesensing 15 00109 g009
Figure 10. Vertical profiles of RMSE, Bias, and Corr for the values of relative humidity based on ERA5 [39] relative to RAOB [25] data for 2016–2020 (a) and the corresponding distribution of deviations Δf (b) for the coordinates of the specified aerological stations.
Remotesensing 15 00109 g010
Figure 11. Vertical profiles of RMSE, Bias, and Corr for the values of temperature based on ERA5 [39] relative to the RAOB [25] data for 2016–2020 (a) and the corresponding distribution of deviations Δt (b) for the coordinates of the specified aerological stations.
Remotesensing 15 00109 g011
Figure 12. Vertical profiles of RMSE, Bias, and Corr for the values of wind direction based on ERA5 [39] relative to the RAOB [25] data for 2016–2020 (a) and the corresponding distribution of deviations ΔD (b) for the coordinates of the specified aerological stations.
Remotesensing 15 00109 g012
Figure 13. Vertical profiles of RMSE, Bias, and Corr for the values of wind speed based on ERA5 [39] relative to RAOB [25] data for 2016-2020 years (a) and the corresponding distribution of deviations ΔV (b) for the coordinates of the specified aerological stations.
Remotesensing 15 00109 g013
Table 1. Geometric and optical characteristics of the cloud registered in lidar measurements (6 January 2021; series of measurements was performed from 2:34 to 2:51 p.m.).
Border Altitudes, kmScattering Ratio ROptical Thickness τBSPM in a Single Strobe (h, km)
6.2–8.325.60.1 M ( 7.1 ) = ( 1.00 0.05 0.05 0.03 0.05 0.93 0.03 0.19 0.05 0.01 0.98 0.24 0.03 0.02 0.14 0.95 )
Table 2. Meteorological conditions [25] at the altitude of the HLC registered with HAMPL (1 June 2021).
TimeStationPRES, hPaHGHT, mTEMP, °CRELH, %MIXR, g/kgDRCT,
°
SKNT, kt
7 a.m.Kolp (29231)4196979–24.8490.6126027
7 a.m.Nsk (29634)4007340–26.5190.2031521
7 p.m.Kolp (29231)4256857–25.0400.4826537
7 p.m.Nsk (29634)4167104–22.1330.5226914
The following notations are used in the Table 2: PRES—atmospheric pressure (hPa); HGHT—geopotential height (m); TEMP—temperature (°C); RELH—relative humidity (%); MIXR—mixing ratio (g/kg); DRCT—wind direction (°); SKNT—wind speed (kt; 1 kt = 0.51 m/s) [30].
Table 3. Example of vertical profiles of meteorological characteristics [25] based on the ERA5 data (7 July 2020; 4 p.m.; HAMPL location, Tomsk).
PRES, hPaTEMP, °CRELH, %MIXR, g/kgDRCT,
°
SKNT, ktPRES, hPaTEMP, °CRELH, %MIXR, g/kgDRCT,
°
SKNT, kt
100024427.773196550−9110.3627716
97522447.4331910500−14190.4326217
95020497.3632010450−20190.2725819
92518547.3332010400−27310.2425519
90015617.3132012350−35410.1525223
87513687.2932012300−44690.1125131
85011777.2032112250−53730.0524533
8259726.2632812225−51290.0323327
8008584.9033312200−4890.0123116
7756644.8933112175−4720.0023312
7504694.6332914150−4610.002818
7000663.7232114125−4810.003534
650−3693.1631214100−5110.002406
600−5230.9430016
Table 4. Aerological stations located within a radius of 500 km from Tomsk.
Station LocationStation IDDistance from the Station to Tomsk, km
NovosibirskWMO 29634210
KolpashevoWMO 29231240
BarabinskWMO 29612430
YemelyanovoWMO 29572470
YeniseiskWMO 29263480
Disclaimer/Publisher’s Note: The statements, opinions and data contained in all publications are solely those of the individual author(s) and contributor(s) and not of MDPI and/or the editor(s). MDPI and/or the editor(s) disclaim responsibility for any injury to people or property resulting from any ideas, methods, instructions or products referred to in the content.