1. Introduction
In recent years, with the improvement of the average precision of LiDAR, the application of LiDAR in cars and robots has been receiving improved research interest (
Figure 1). Consequently, the question of how to use LiDAR for target detection has become an important research topic.
LiDAR has its own numbering and a fixed vertical angle. To obtain a full range of environmental information, LiDAR performs rotational motion at a constant angular speed and emits lasers to gather information through the reflected points. In addition to the distance of the reflected points, information regarding the occurrence time and horizontal angle (Azimuth) is recorded. In this manner, the coordinates of all reflected points form a point cloud.
As 3D (three-dimensional) data, the point cloud includes both depth and geometric information. However, due to its unordered, sparse, and non-uniform distribution, it is a special challenge to efficiently use this information for object detection.
Based on the aforementioned characteristics of the point cloud, its object detection methods can be classified into three categories: (1) point-based methods [
1,
2,
3,
4], (2) voxel-based methods [
5,
6,
7,
8], and (3) projection-based methods [
9,
10,
11,
12,
13,
14].
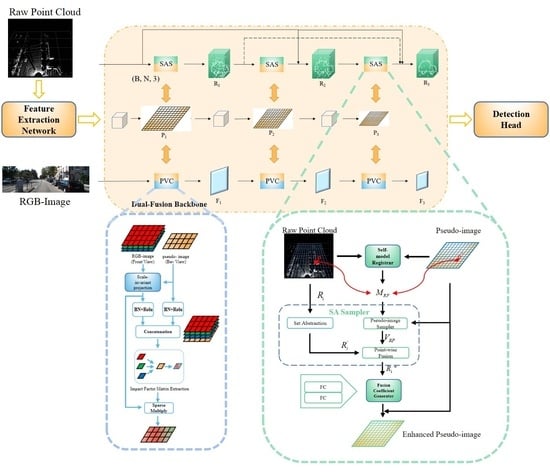
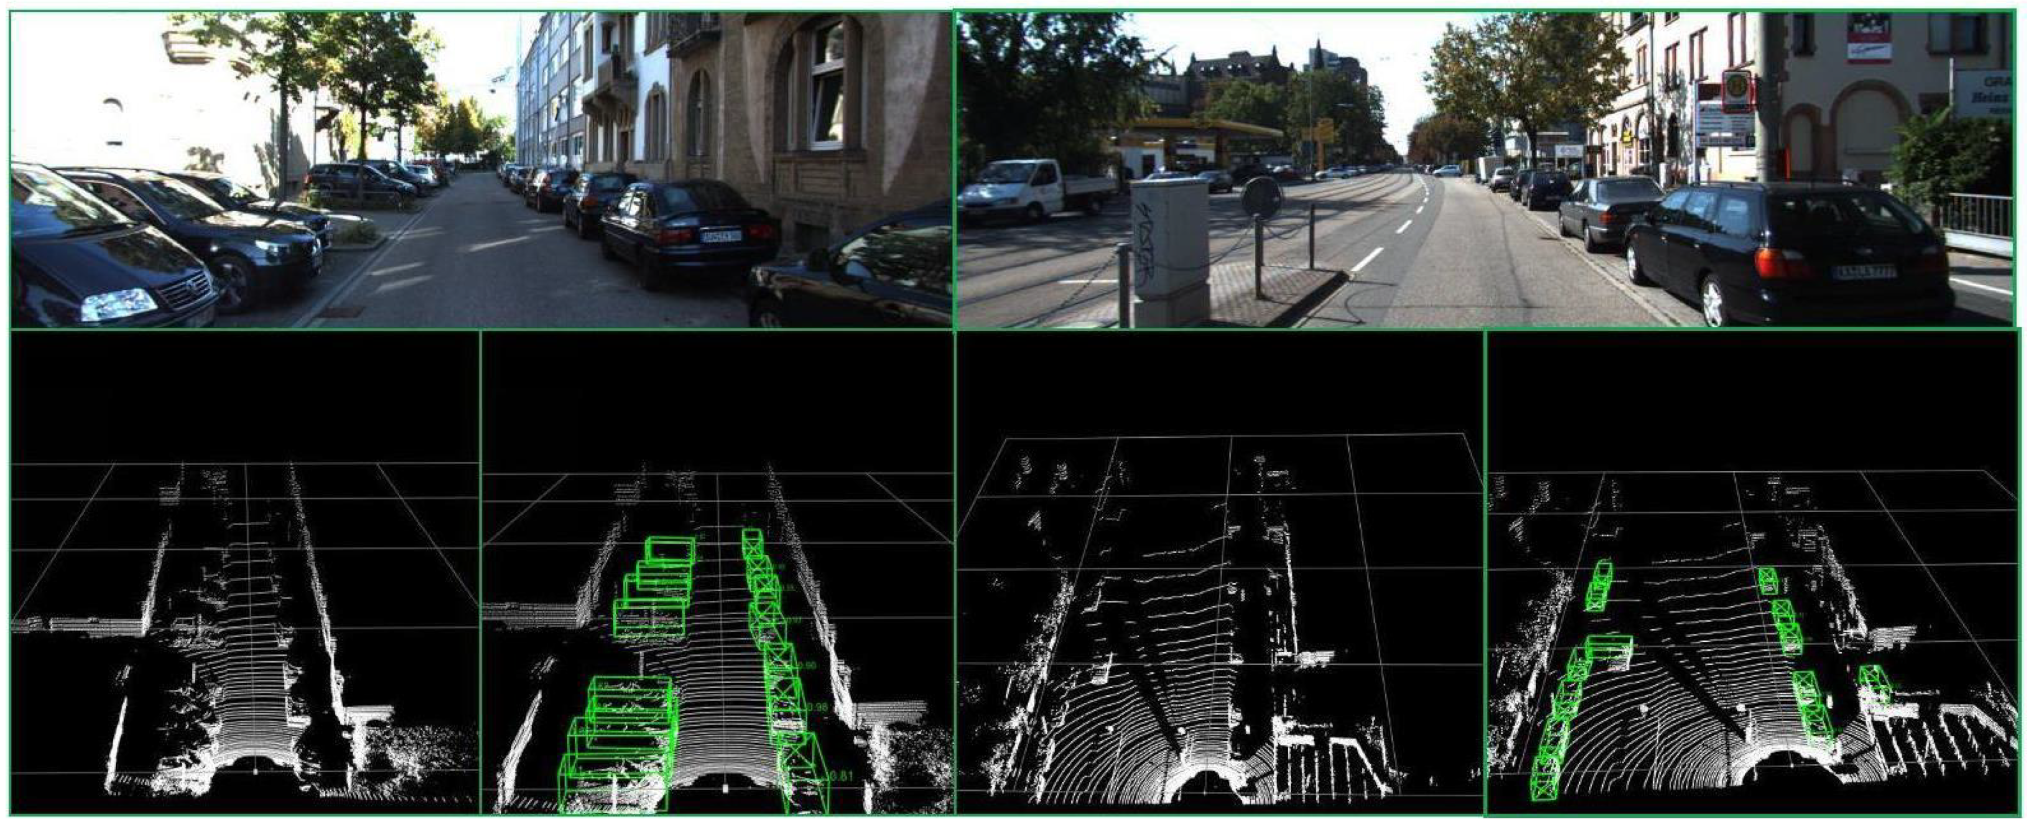
Figure 1.
Visualization of detection results. The top of the figure is the RGB image from the camera. The lower left part of the figure shows the original point cloud. The lower right part of the figure shows the detection results. The experiment is based on the KITTI dataset [
15].
Figure 1.
Visualization of detection results. The top of the figure is the RGB image from the camera. The lower left part of the figure shows the original point cloud. The lower right part of the figure shows the detection results. The experiment is based on the KITTI dataset [
15].
However, a point cloud is less effective in detecting distant objects and small objects because of its missing color information. Thus, researchers have considered fusing RGB images into a point cloud to improve detection precision. According to the different fusion levels for the objects, the fusion strategies can be classified into three categories: (1) early fusion [
16,
17,
18,
19,
20], (2) deep fusion [
21,
22,
23,
24], and (3) late fusion [
25,
26,
27].
Currently, the detection of 3D objects is focused on large-scale objects, such as cars. As large-scale objects, cars have more feature points and are easier to detect. However, in practical application scenarios, small objects (pedestrians and cyclists) are the most easily ignored because of factors such as occlusion and distance.
The existing fusion network also presents some problems in need of improvement. F-pointnet [
28] does not make use of point cloud information, so the effects of illumination and occlusion make the missed detection more serious. PMPF [
20] is still ineffective in finding the relationship between pixels and point cloud key points. The proposed method in [
14] lacks the use of multi-scale intermediate feature maps, which makes it impossible to effectively use the context semantic information. Consequently, we hope for a strategy to efficiently fuse the information of point cloud and RGB images and utilize multi-scale information, thereby improving detection average precision (AP).
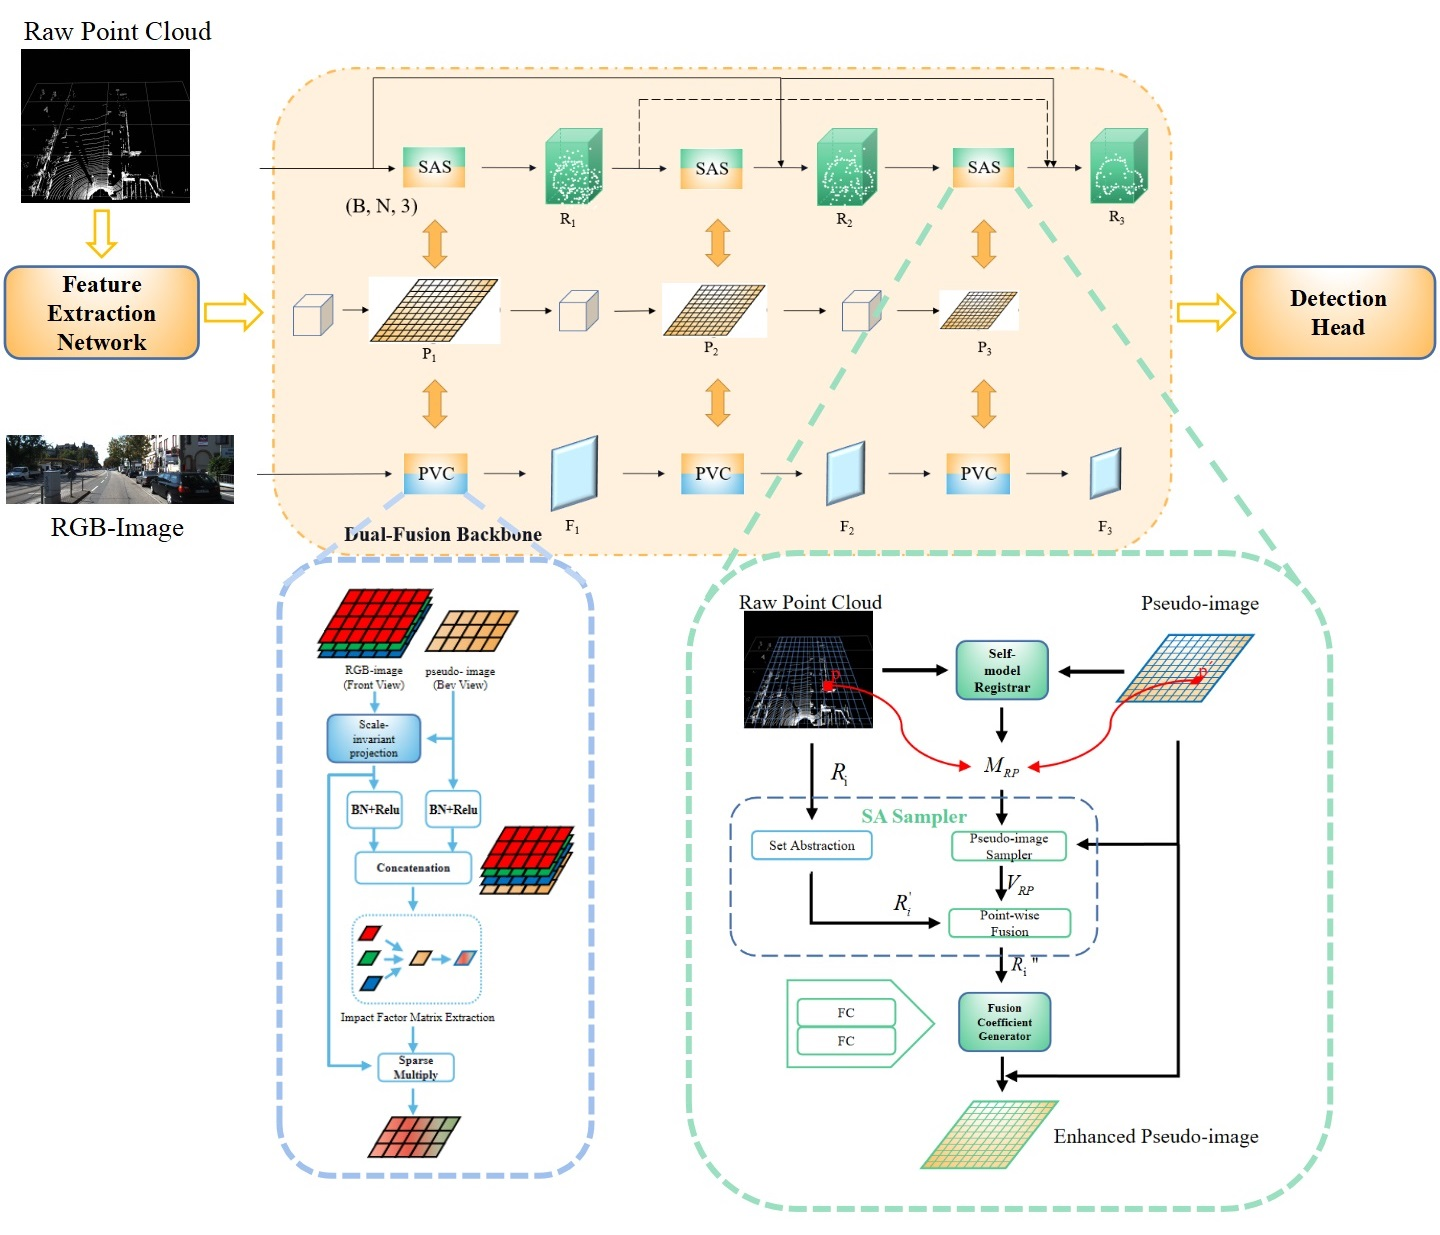
In this study, inspired by the deep fusion strategy and oriented to practical industrial needs, we propose a novel one-stage small model 3D object detection network, FusionPillars. It is designed to improve the detection precision of small objects by supplementing the spatial information and color information of the pseudo-image through cross-fusion and self-fusion. FusionPillars proposes two fusion modules: the Set Abstraction Self (SAS) fusion module and Pseudo View Cross (PVC) fusion module.
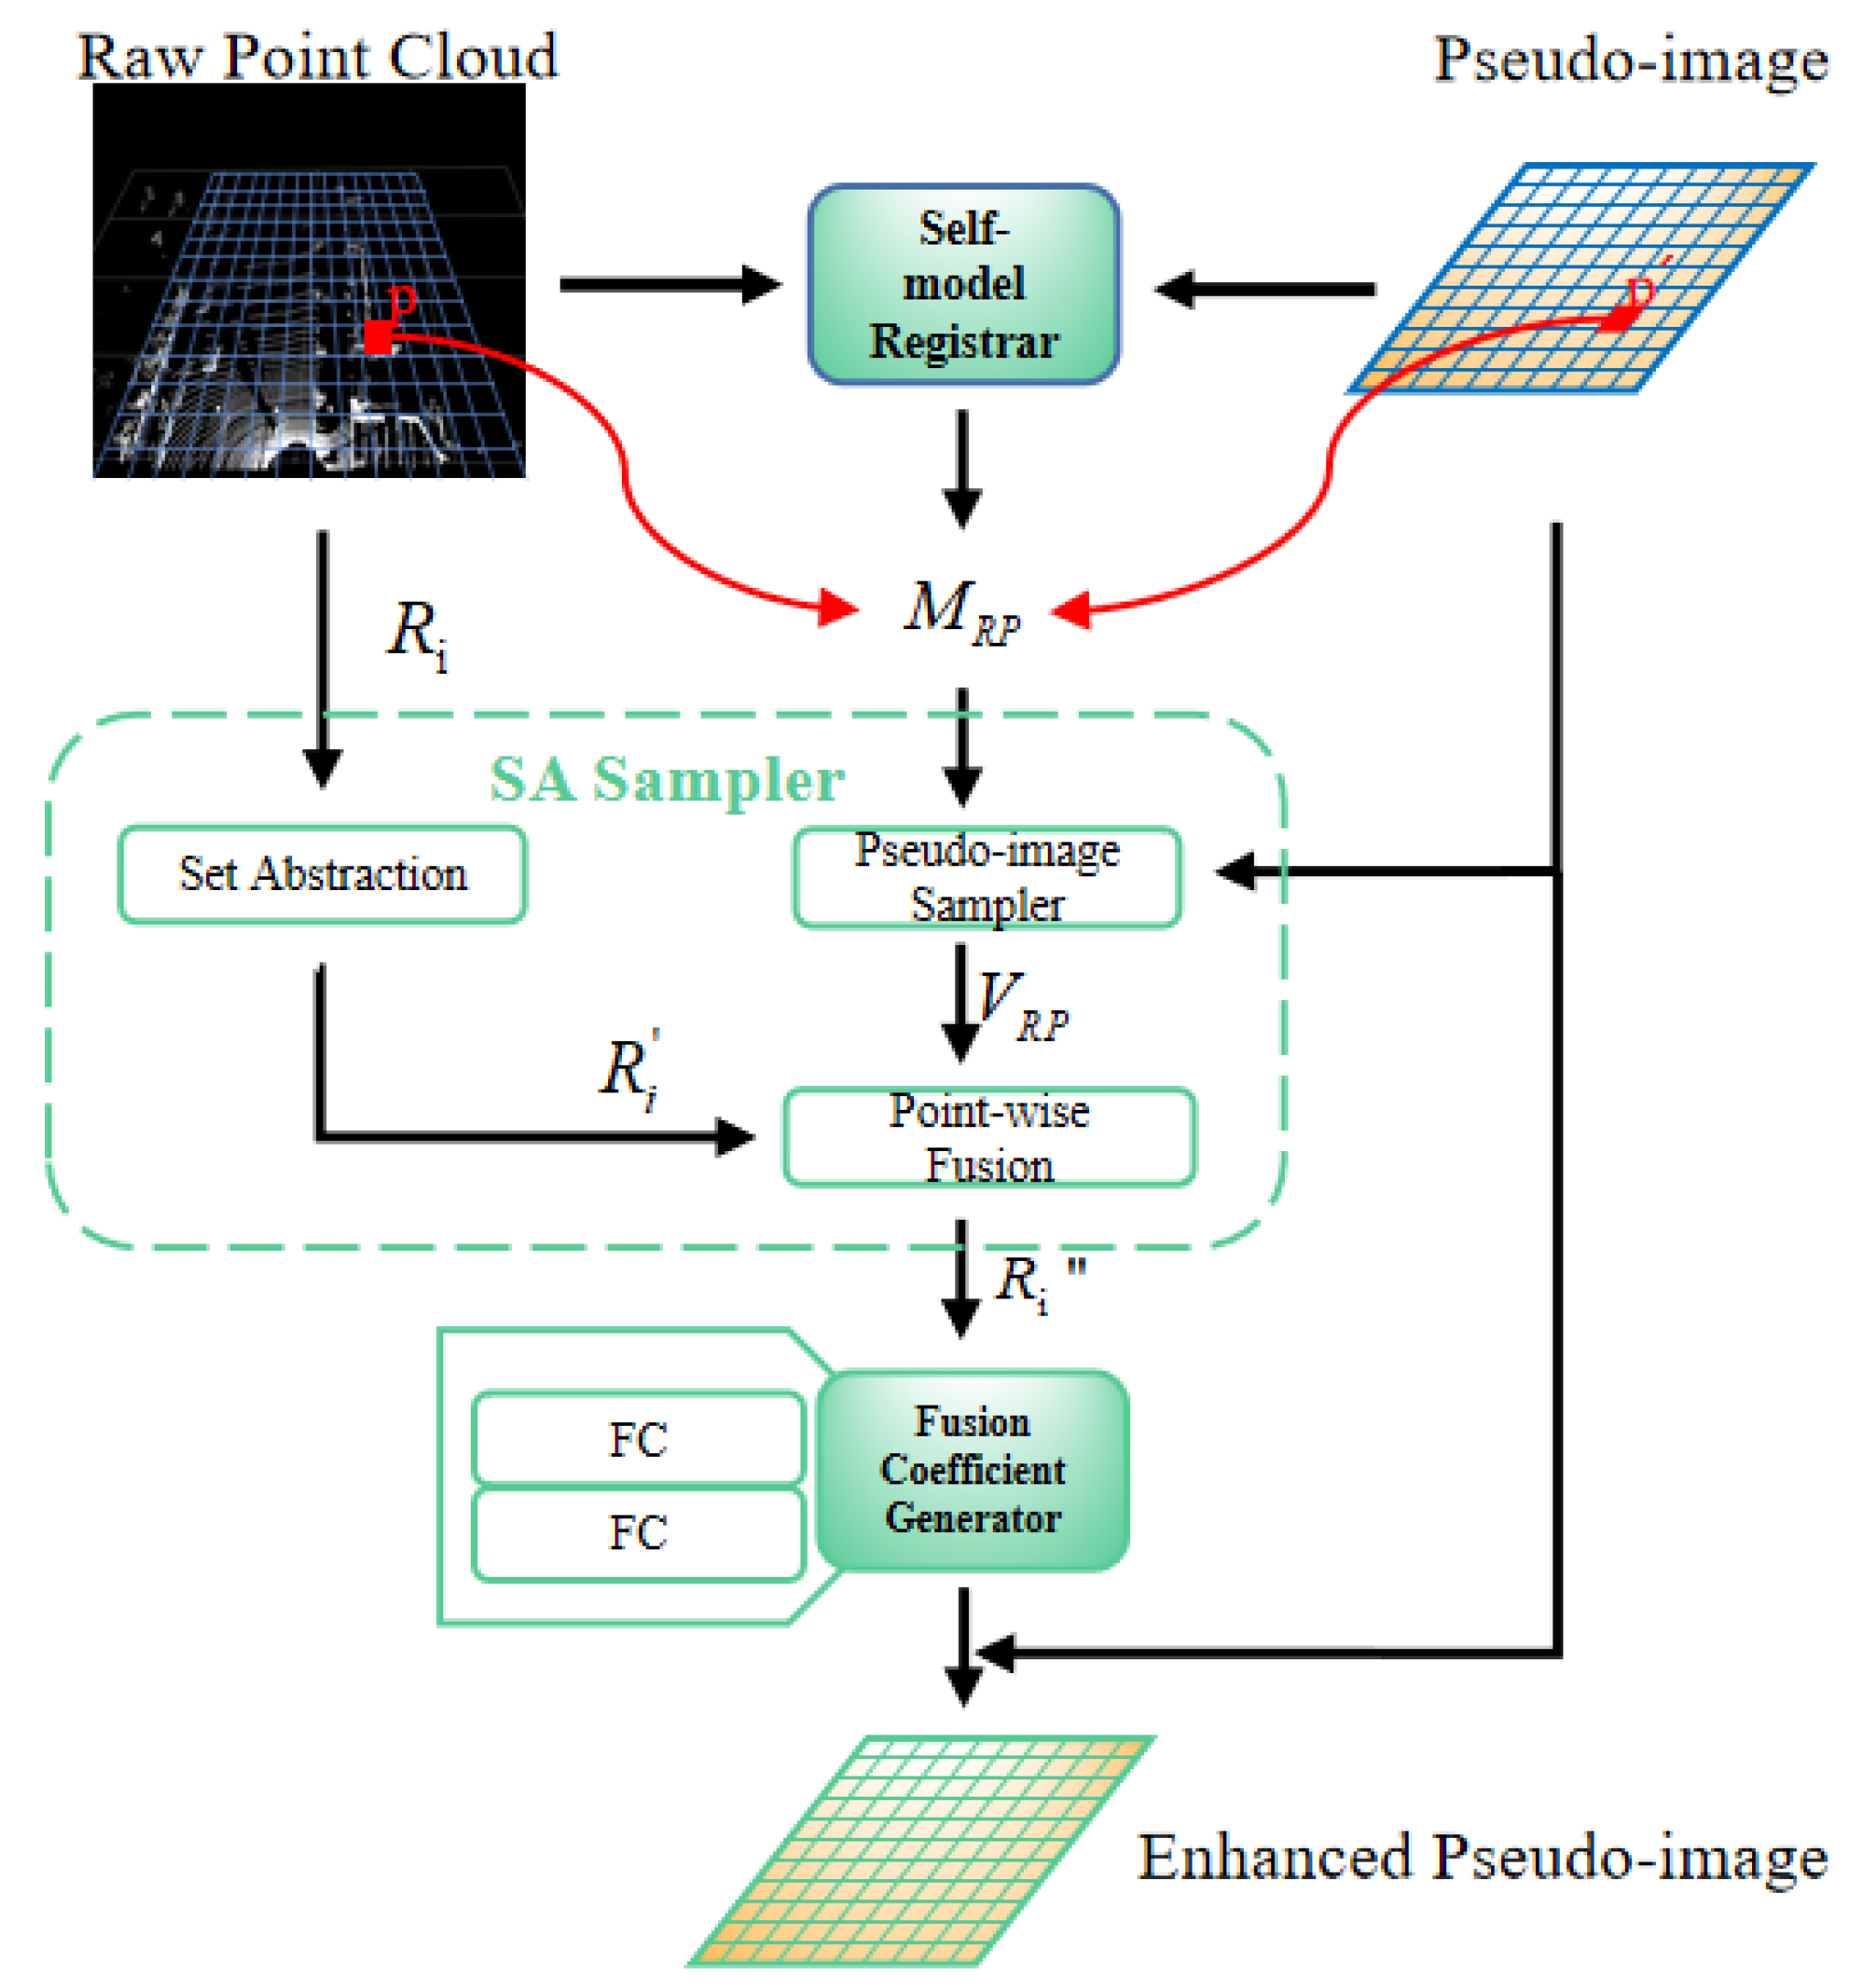
In the point-based branch, the most direct motivation of the SAS fusion module is to exploit the advantages of the voxel-based method and the point-based method. Point-based methods enable the complete utilization of structural information of the object. Voxel-based methods employ spatial convolution to extract multi-scale and multi-level local feature information efficiently. At the same time, the SAS fusion module effectively reduces the impact of the disadvantages of the two methods. Set Abstraction [
2] down-samples point clouds to effectively reduce memory resource consumption. Furthermore, the self-fusion of two different point cloud representations compensates for the lack of voxel-wise features (pseudo-image) and enables features to more strongly represent the spatial information of small objects.
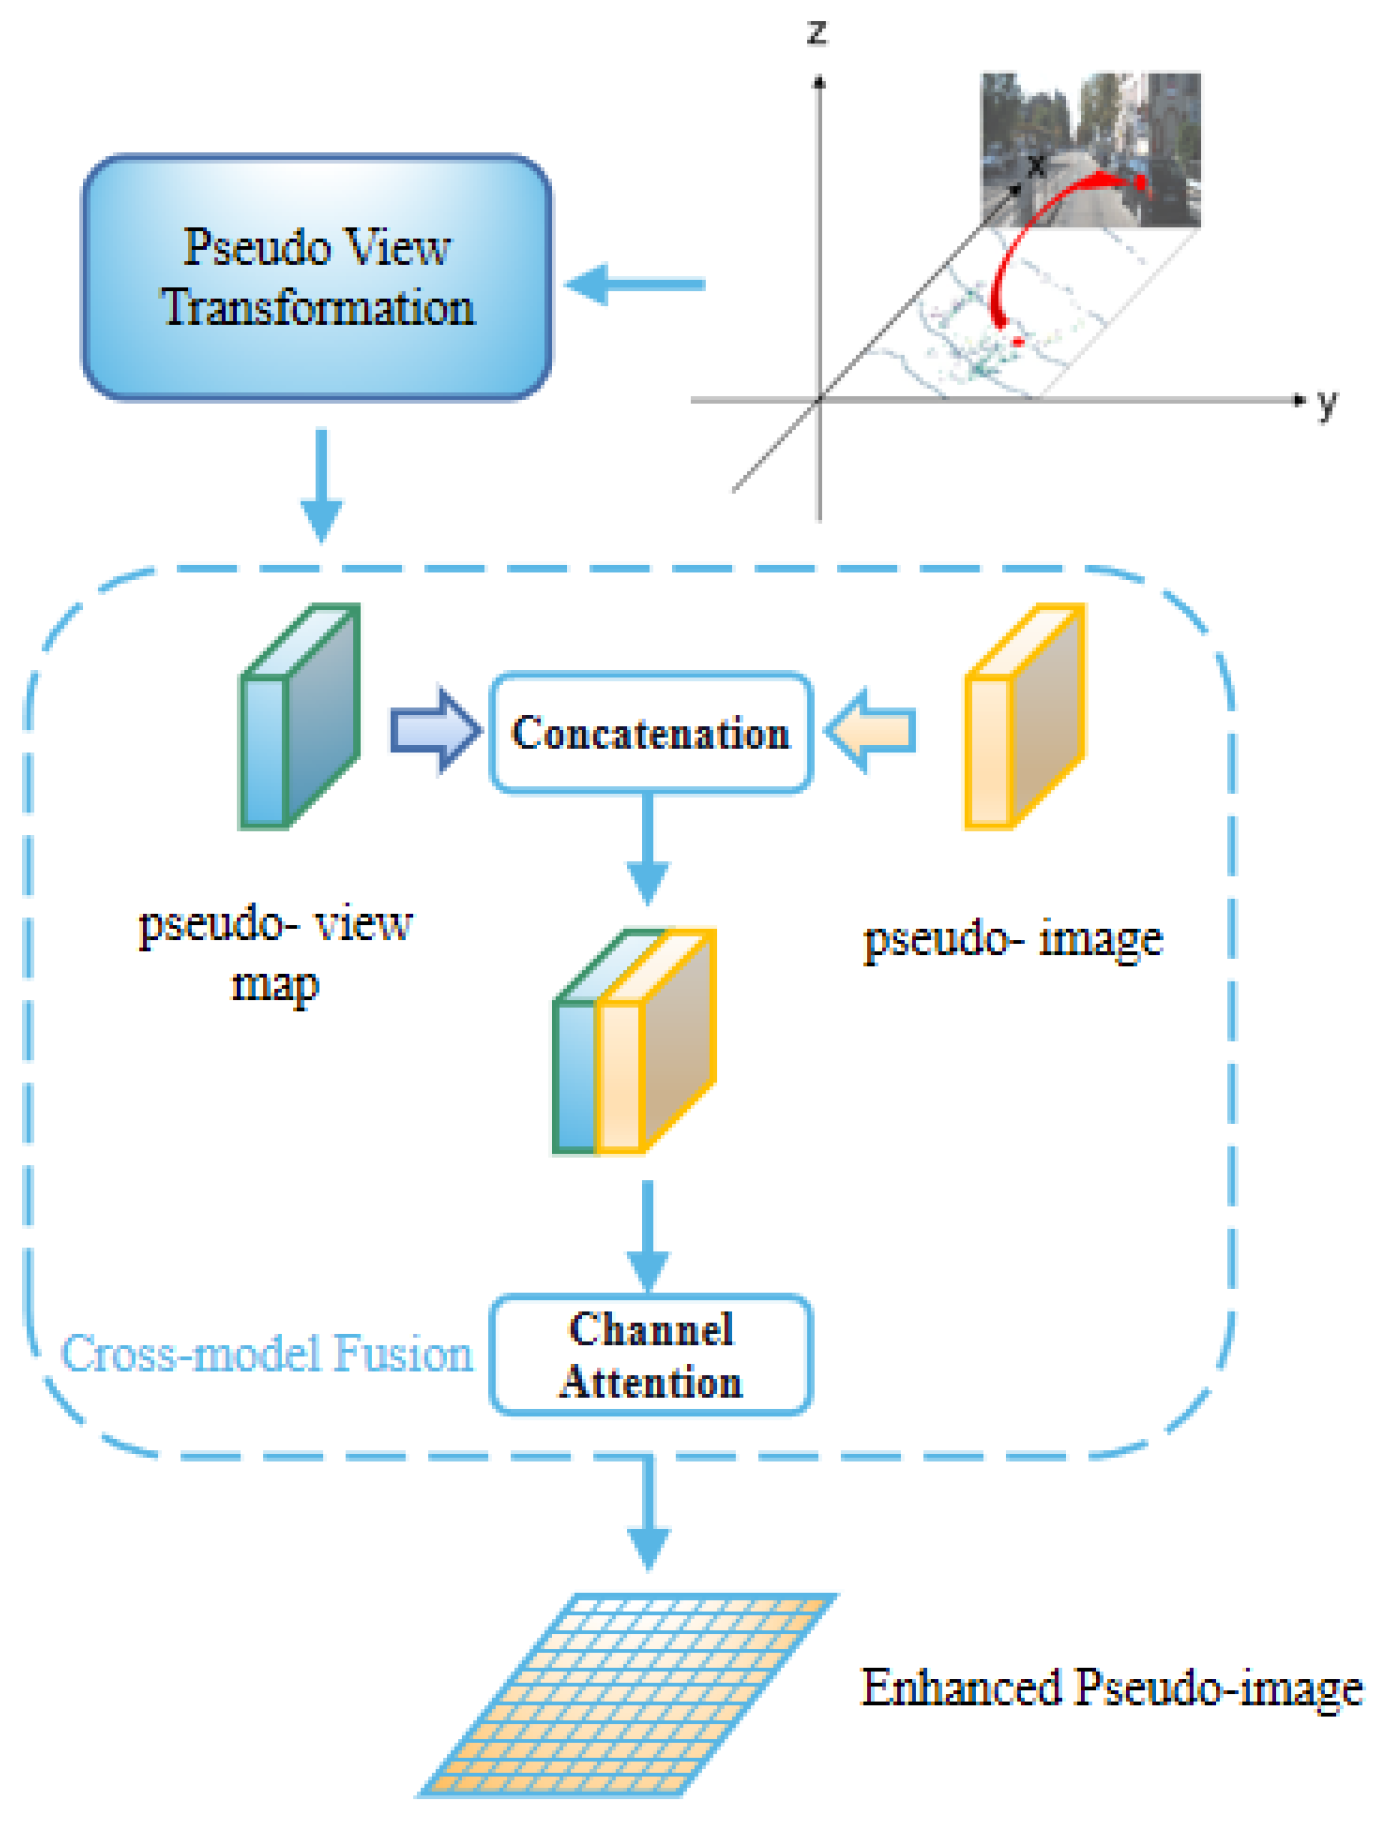
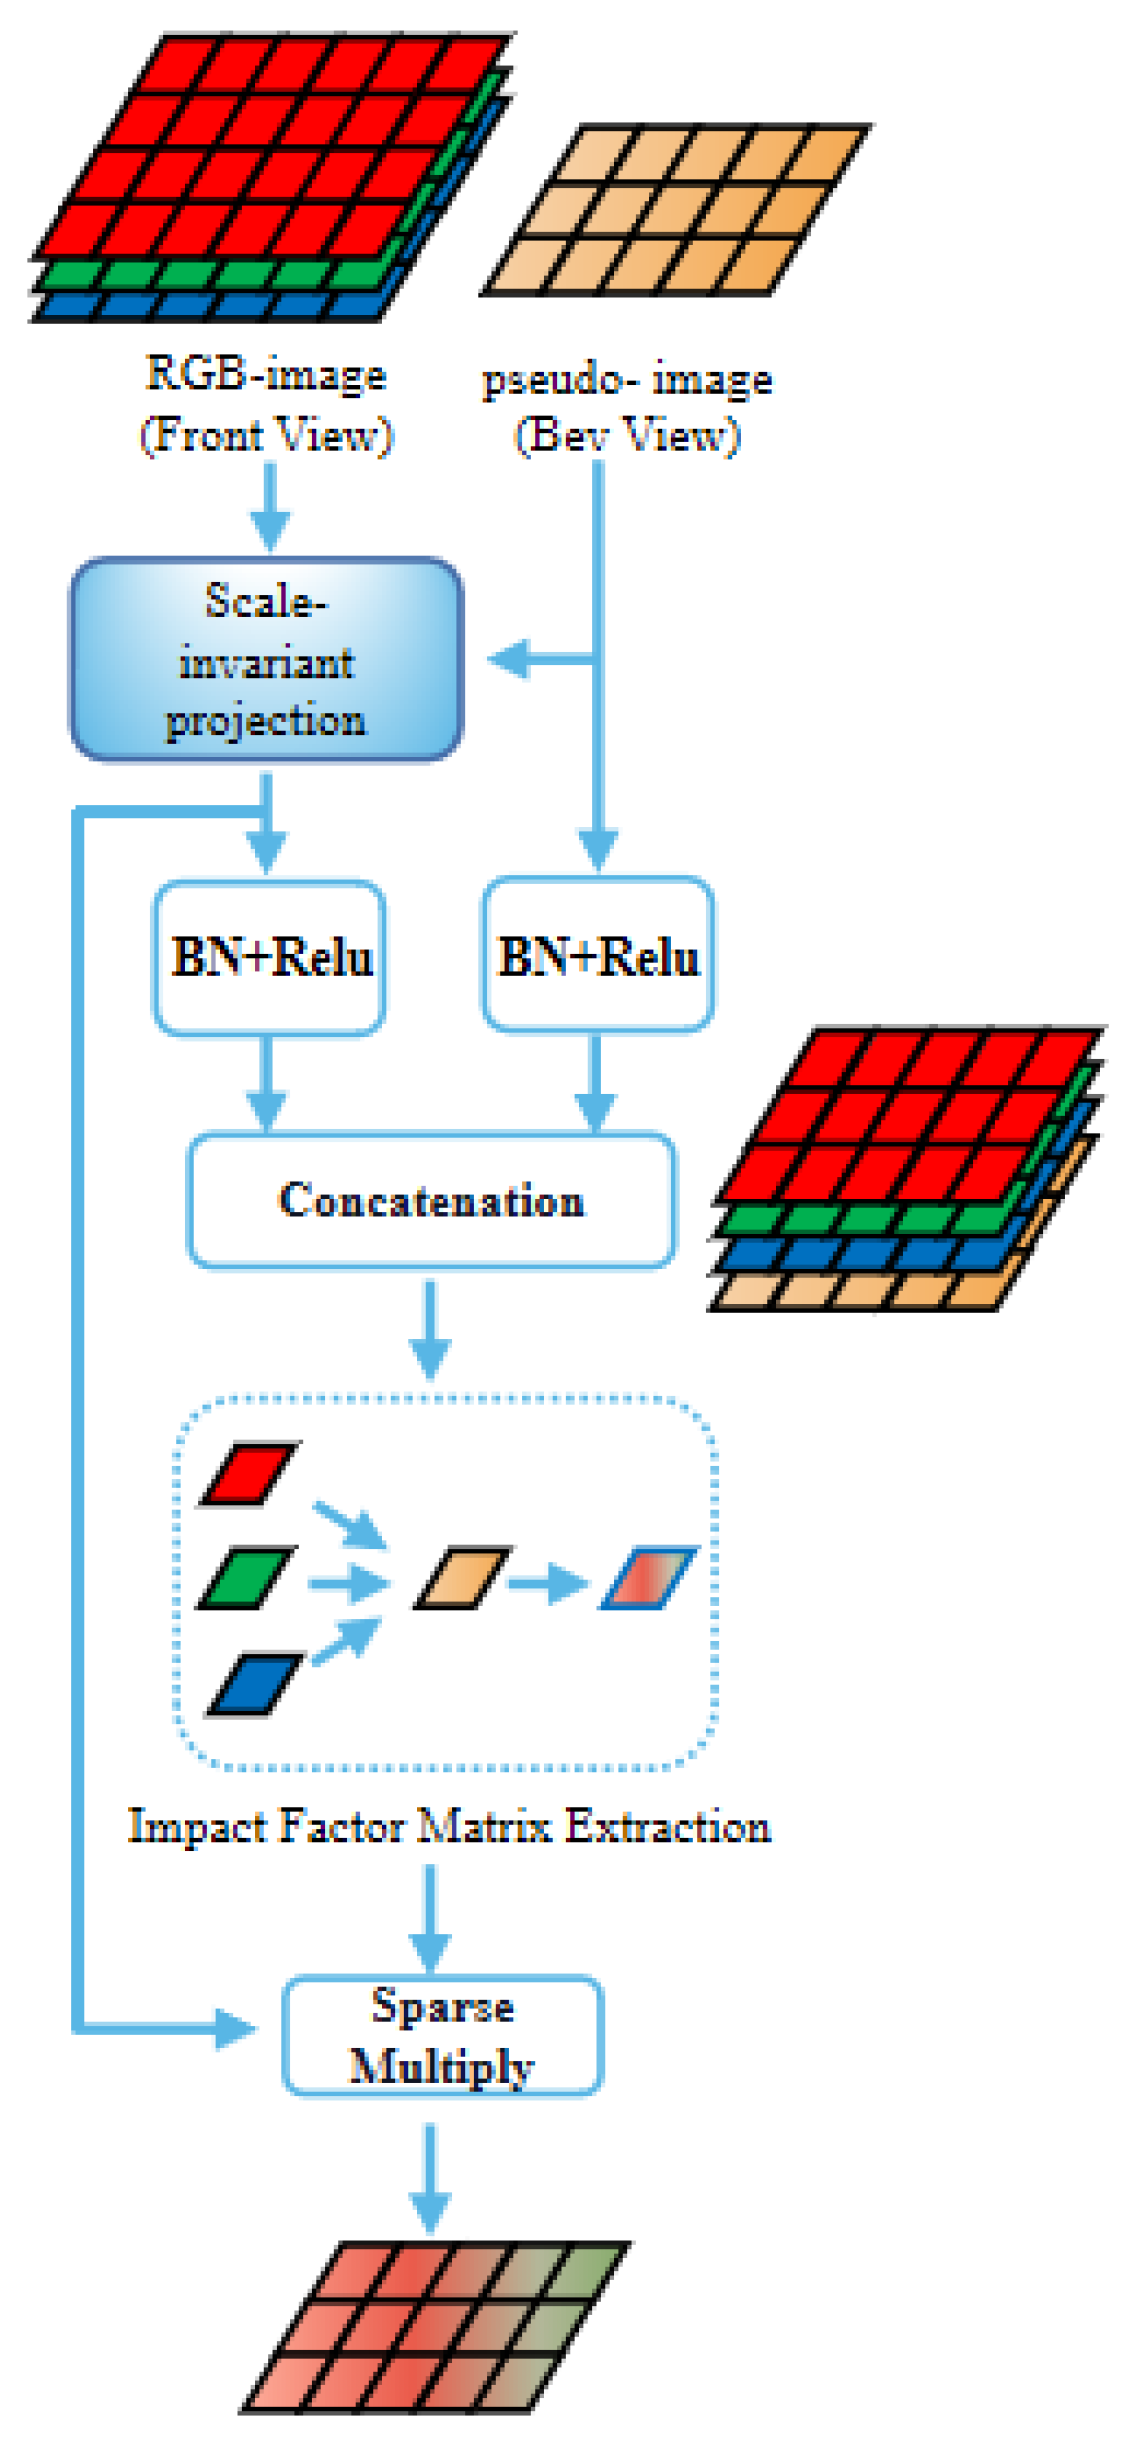
In the image-based branch, to utilize the color information from RGB image and the depth information from the point cloud, the PVC module cross-fuses the data of the point cloud and the image. Specifically, through the pseudo-conversion of the images’ view, we realize the registration of the pseudo-image and the RGB image; then, cross-fusion is used to supplement the color information of the image into the pseudo-image. Now, the pseudo-image contains both depth information and color information.
In summary, the contributions of this study are as follows:
The SAS fusion module performs self-fusion by using the point-based method and voxel-based method to strengthen the spatial expression of the pseudo-image.
The PVC fusion module cross-fuses the pseudo-image and the RGB image through the pseudo-conversion of the view angle to strengthen the color expression of the pseudo-image.
We aggregate the SAS and PVC modules in the proposed network called FusionPillars, a one-stage end-to-end trainable modal that performs well on the KITTI dataset, with a particularly pronounced improvement in detection precision for small objects.
4. Experiment
In this section, we present the experimental data, including the experiment environment, the experimental dataset, the experimental settings, and the experimental results.
4.1. Experiment Environment
The following is the experimental environment:
CUDA: 10.2
Pytorch: 1.10.2
Python: 3.6
GPU: GeForce RTX 2080Ti
4.2. Experiment Dataset
The KITTI dataset [
15] is the largest computer vision algorithm evaluation dataset for autonomous driving scenarios in the world. All of our experiments are based on the KITTI dataset. The KITTI dataset provides us with samples of lidar point cloud and images, which contains 7481 training samples and 7518 test samples. Among them, the training samples are divided into two parts, namely, the training set composed of 3712 samples and the validation set composed of 3769 samples. The dataset includes three categories: car, pedestrian, and cyclist. Additionally, based on the size, the occlusion level, and the truncation of each category, the dataset is stratified into three levels of difficulty level: easy, mod., and hard. Average Precision (AP) and mean Average Precision (mAP) are used as the evaluation indicators in this study. To ensure a fair comparison, we adopted a comprehensive evaluation scheme.
4.3. Experimental Settings
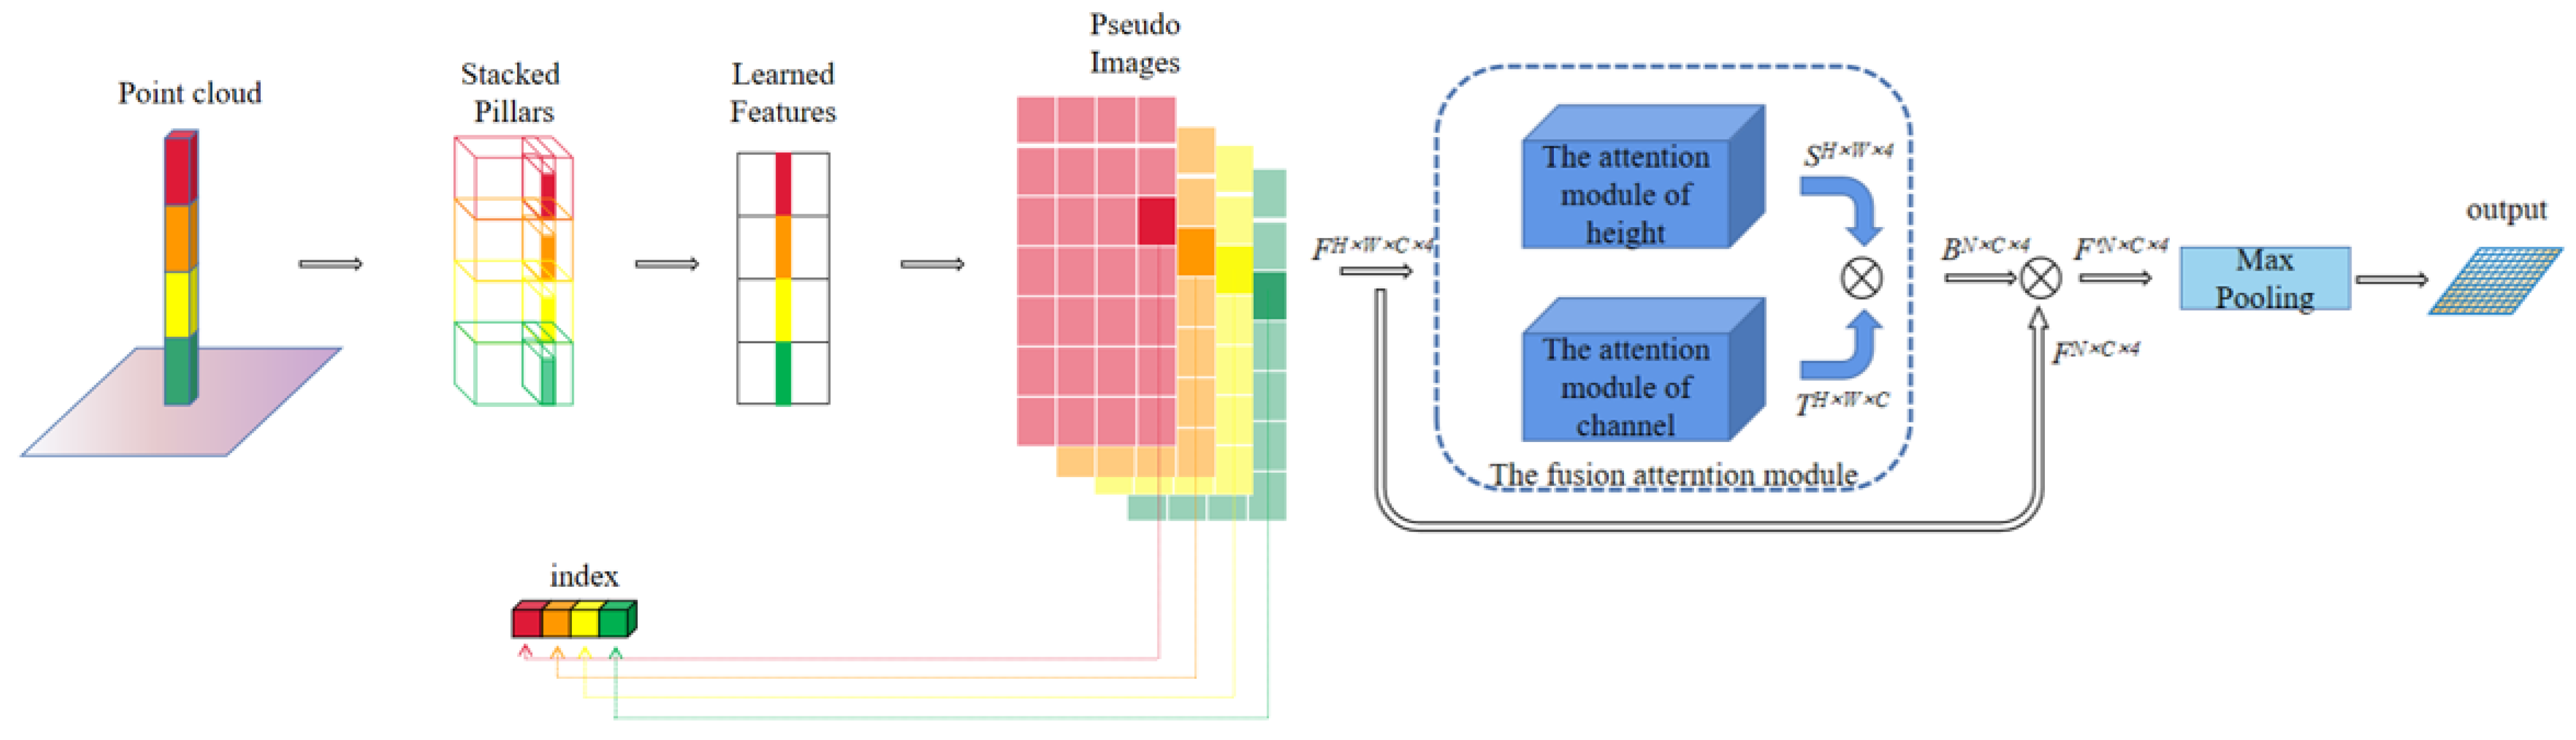
For the feature extraction network, we used the PointPillars setting to set the grid size to 0.4 m ∗ 0.4 m, the maximum number of pillars: P = 12,000, and the maximum number of points per pillar: . For the point-based branch, three set abstraction layers subsample the raw point cloud with sizes of 4096, 1024, and 256. For the voxel-based branch, the enhanced pseudo-images are down-sampled using the 3 ∗ 3 convolution, and the number of channels after convolution is set as 64, 128, and 256, successively. The number of transposed convolution output channels is 128.
The detection range is [(0, 70), (−40, 40), and (−3, 1)]m, respectively. For the car, its anchor has a width, length, and height of (1.6, 3.9, 1.5). Matching uses positive and negative thresholds of 0.6 and 0.45. For the pedestrian and the cyclist, their anchor sizes are (0.6, 0.8, 1.73) and (0.6, 1.76, 1.73), respectively. Additionally, 0.5 and 0.35 are the positive and negative matching thresholds they shared.
4.4. Experimental Results
In this section, our method is compared with typical methods based on the KITTI dataset. Our network detects three categories (cars, pedestrians, and bicycles) and obtains reports that contain different AP at three difficulty levels (easy, moderate, and hard).
4.5. Evaluation Indicators
The IoU indicates the coincidence degree between the network prediction object frame and the original real object frame:
In this study, the IoU threshold is set as three different values of 0.7, 0.5, and 0.25. On this foundation, the results can be classified into four categories: TP (True Positives), TN (True Negatives), FP (False Positives), FN (False Negatives).
Additionally, the precision represents the correct ratio of all predicted objects:
Recall is defined as the proportion of all positive samples in the test set that are correctly identified, i.e.,
AP is the area under the precision-recall curve. To verify the effectiveness of our algorithm, mAP is used as the main evaluation indicator in this paper to compare with existing algorithms.
4.5.1. Results with Single-Modal Networks
In
Table 1, compared with the 3D detection networks of the single point cloud including MV3D [
38], TANet [
39], Point-GNN [
40], and LSNet [
41]. Our network achieves the best results in detecting small objects (pedestrians and cyclists). The mAP (mean Average Precision) of small objects under all difficulties has been improved greatly.
On the BEV benchmark, compared to the one-stage classic network, PointPillars, mAP is improved by an average of 2.66%. Among them, for small objects, the mAP is improved by 2.97% on average. Additionally, the mAP for cyclists with easy difficulty exhibits the maximum improvement (5.27%). Compared to the two-stage classic network PointRCNN, the mAP is improved by an average of 11.50%. Among them, for small objects, the mAP is improved by 11.30% on average. Additionally, the AP for cyclists with easy difficulty is improved the most (13.70%).
On the 3D benchmark, compared to the one-stage classic network, PointPillars, mAP is improved by an average of 2.65%. Among them, for small objects, the mAP is improved by 3.04% on average. Additionally, the performance of cyclists with easy difficulty is boosted from 71.82% to 80.62%. Compared to the two-stage classic network PointRCNN, AP is improved by an average of 3.81%. Among them, for small objects, the mAP is improved by 4.76% on average. Additionally, the performance for pedestrians with hard difficulty is boosted the most (6.79%).
In order to prove the innovation and effectiveness of FusionPillars, we made a further comparison with PointPillars on all benchmarks. Based on
Table 2, we can see that our network has a particularly strong detection effect on small objects. The detection AP of pedestrians has improved by an average of 1.36%, and the maximum improvement is 4.44% (easy, BEV). The detection precision of cyclists has improved by an average of 3.81%, and the maximum improvement is 8.80% (easy, 3D).
4.5.2. Results with Multi-Modal Networks
FusionPillars is a one-stage multi-modal network. So, in this section, we compare FusionPillars with other fusion networks (LIDAR and RGB images).
Firstly, we compare it with other one-stage fusion networks (FusionRCNN [
24], F-PointNet [
28], HDNet [
42], Cont-Fuse [
43], and MVX-Net [
44]) to demonstrate that FusionPillars are the better performing one-stage fusion network.
As can be seen from
Table 3, FusionPillars achieves the best performance for various difficulty objects. Among them, compared with the latest algorithm, MVX-Net, its mAP is improved by 3.0%, 2.1%, and 7.4%, respectively, on the BEV benchmark; its mAP is improved by 3.8%, 3.0%, and 7.8%, respectively, on the 3D benchmark.
Table 4 shows the comparison results with the two-stage fusion networks (AVOD-FPN [
9], IPOD [
45], F-ConvNet [
46], PointPainting [
17], and H
23D-RCNN [
13]) under the BEV benchmark. The two-stage fusion network has one more refinement stage compared to the one-stage network, including FusionPillars, and it has the advantage of high average precision and the disadvantage of slow speed. As can be seen from the table, although FusionPillars is only a one-stage network, it achieves the best detection of small objects in several indicators, and it is not weaker than most two-stage fusion networks for the detection of car objects.
4.6. Ablation Studies
We have conducted extensive experiments on the 3D benchmark of the KITTI dataset. We verify the validity of SAS modules and PVC modules by comparing mAP. The result of PointPillars is set as a baseline.
As can be seen from
Table 5, on the 3D benchmark, SAS modules improve the mAP of individual objects. Compared to the baseline, the mAP of pedestrians is boosted by 0.27%, and the mAP of cyclists is boosted by 0.45%. In the SAS module, we also design dense connections. Combined with dense connections, the detection capability of SAS modules is further strengthened, with mAP for cars, pedestrians, and cyclists increasing to 76.75%, 48.96%, and 61.52%, respectively.
In the case of a single PVC module, compared with the baseline, our network improves the mAP of three types of objects from 0.01% to 2.09%. The detection mAP of cyclists is significantly improved (2.09%), and that of pedestrians is improved by 0.39%.
After the combination of the two modules, all the detection results have been further boosted. Finally, the mAP of FusionPillars for three types of objects are boosted to 77.42%, 49.12%, and 63.95%, respectively.
To verify the effectiveness of the improved feature extraction network and detection head in FusionPillars, we conducted additional ablation studies (
Table 6) based on
Table 5. Where
✘ represents the use of the corresponding module in the original PointPillars, and
✔ represents the use of the improved module from other papers. The deployment of improved network architecture improved by 0.72%, 0.54%, and 1.32% in each of the three object categories.
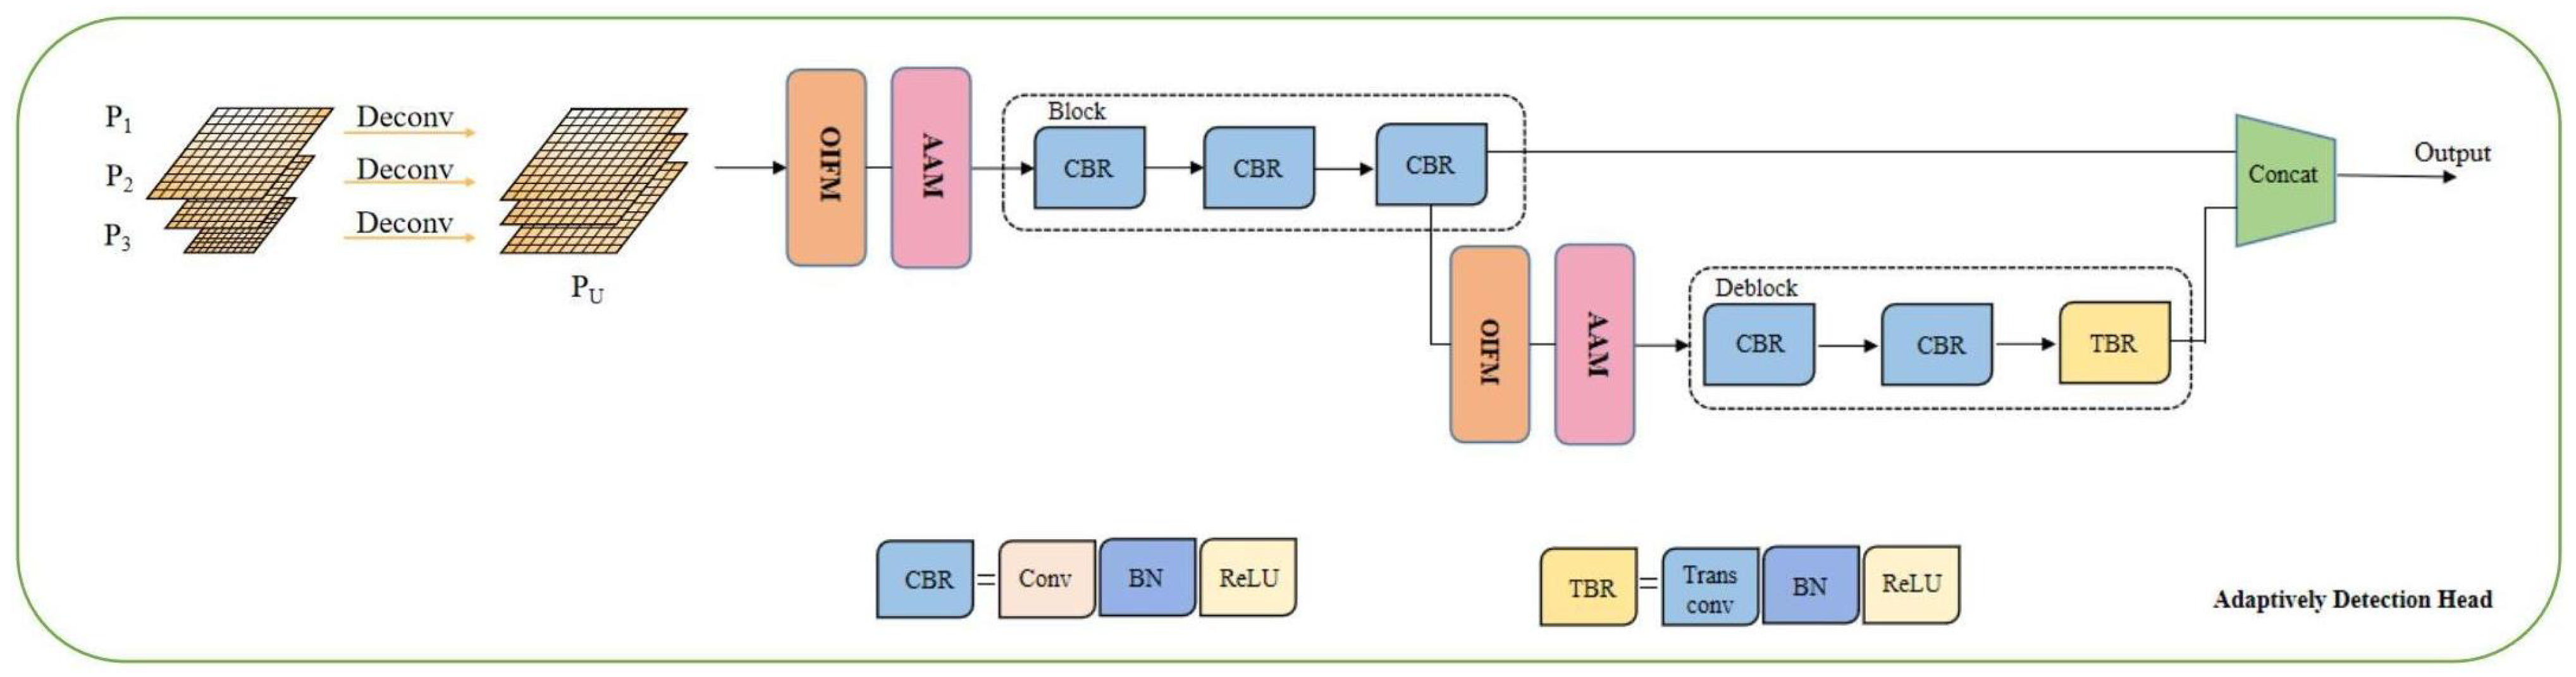
SAS modules and PVC modules can be deployed at different depths of the feature map, which means that the network can continuously deepen the pyramid backbone structure as long as the resolution allows.
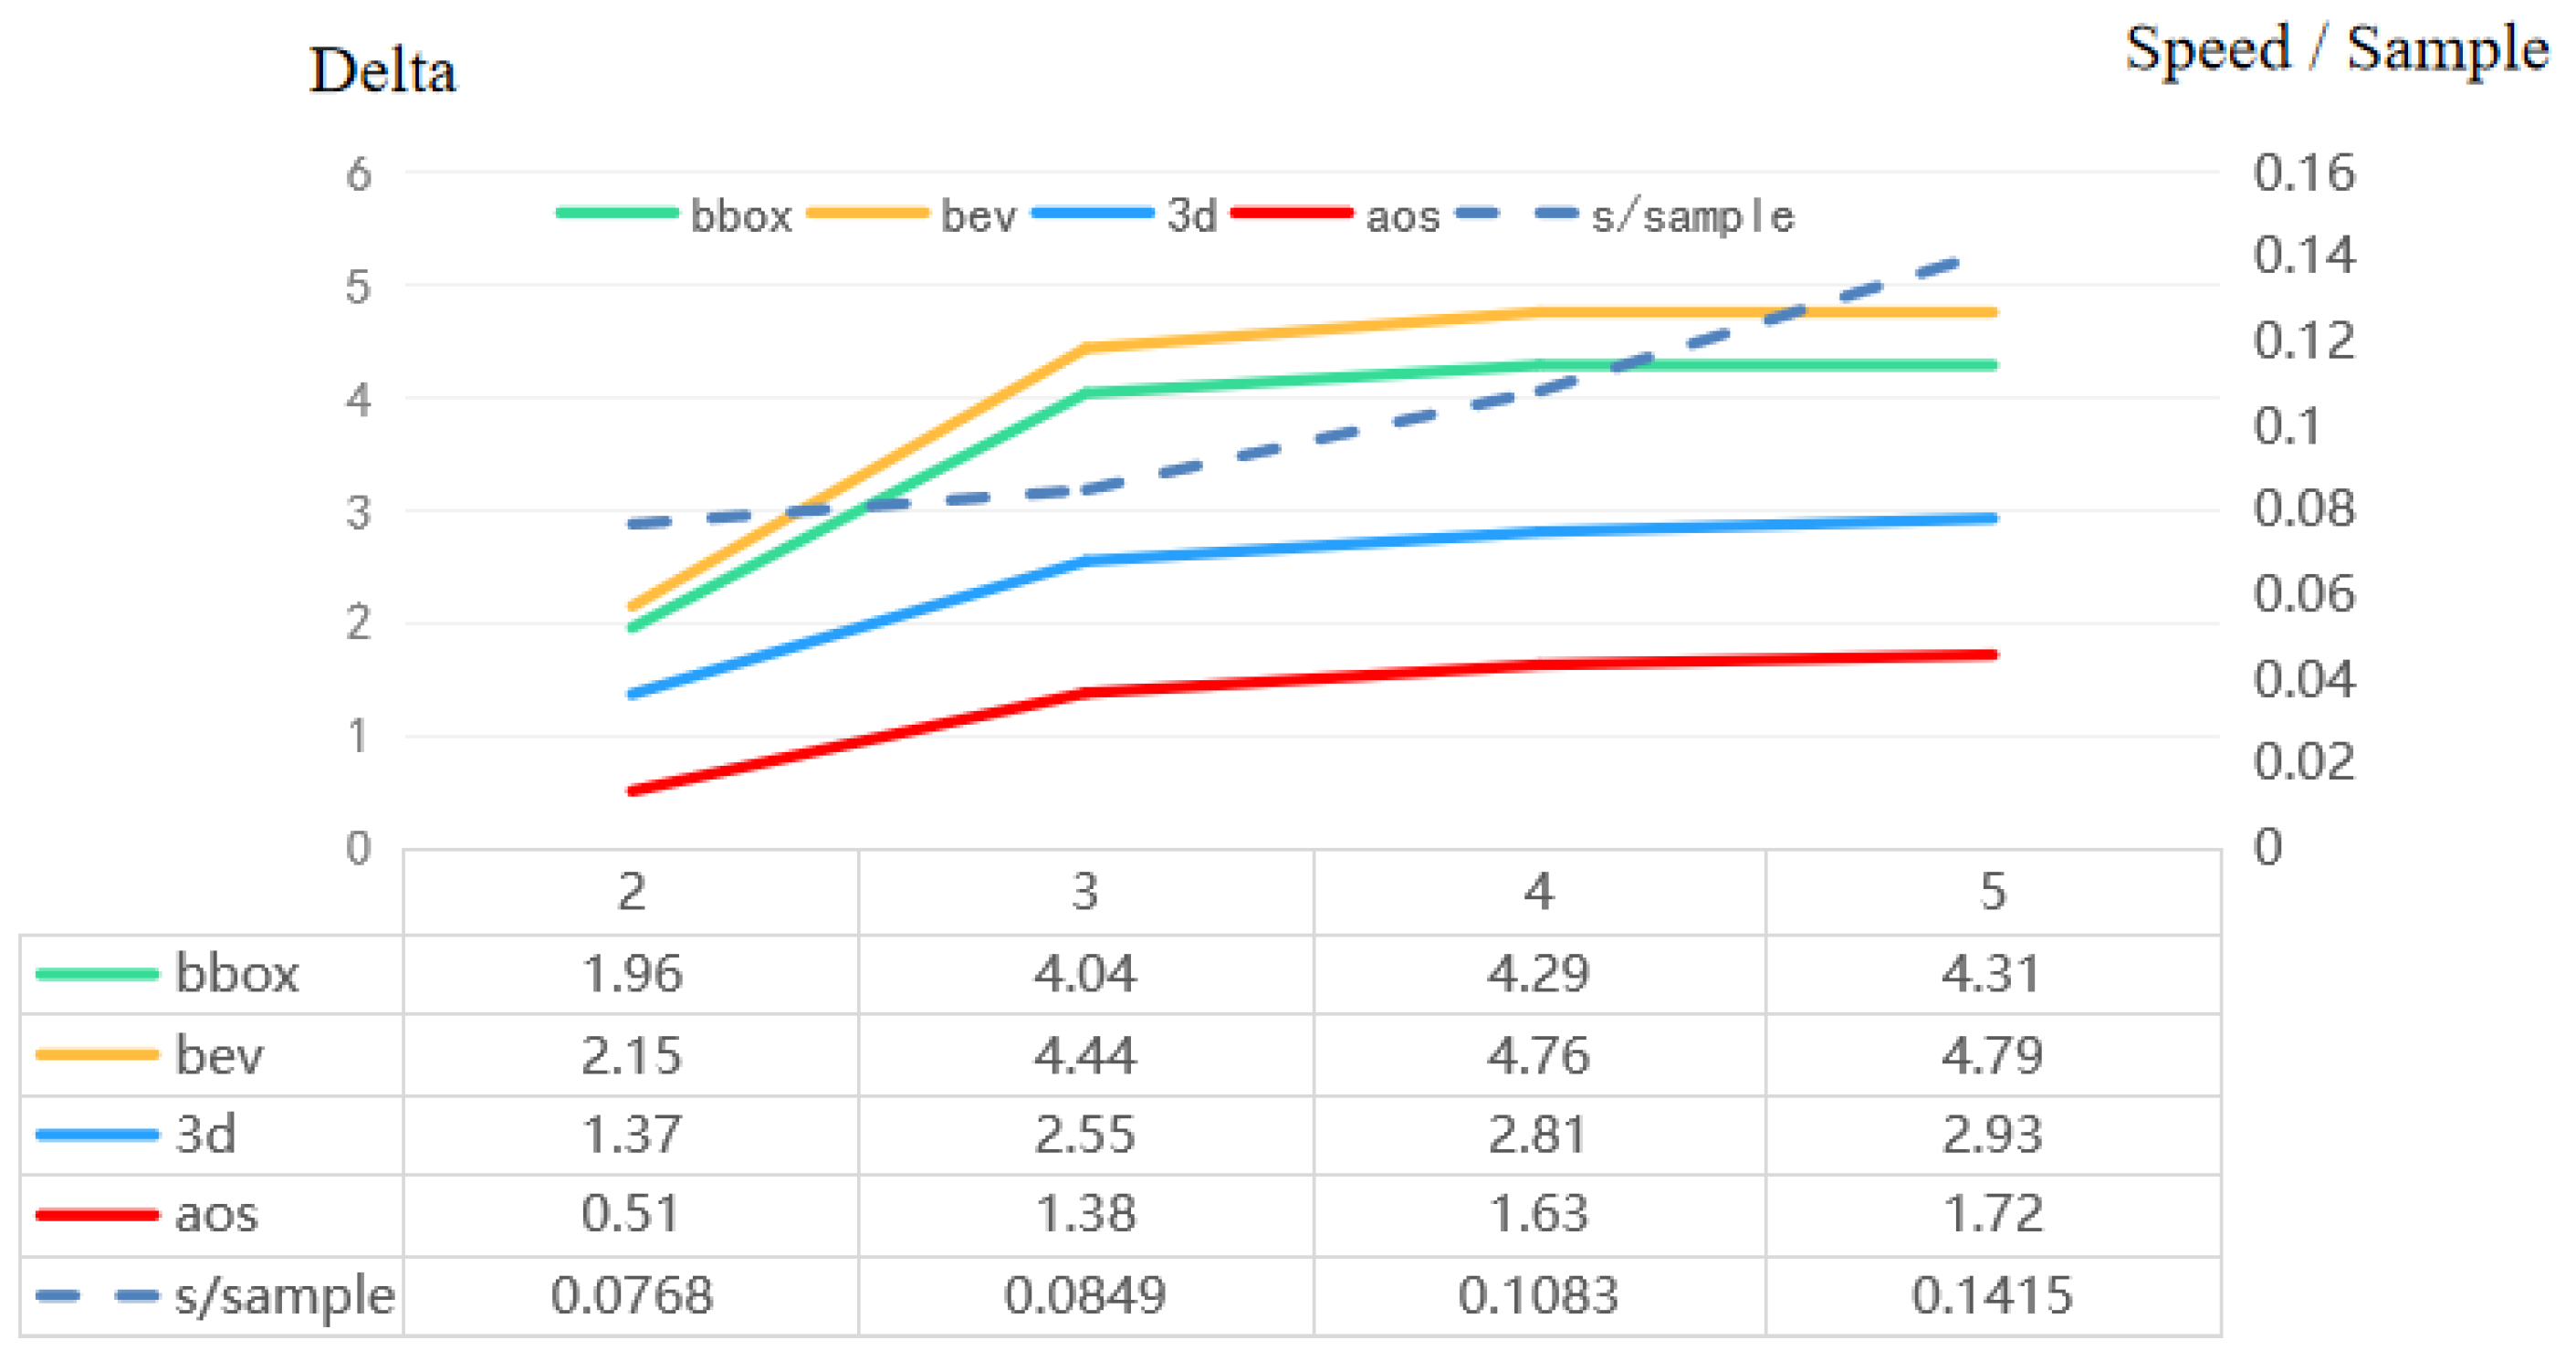
Figure 8 analyzes the detection speed and improvement of AP by different layers. We choose (pedestrians, easy) as an indicator to analyze the impact of pyramid layers on the network. The four solid lines represent the detection AP under the four benchmarks (BBOX, BEV, 3D, AOS), and the dotted line represents the time to detect each sample. From the trend of solid line and dotted line, it can be seen that from the third layer, although increasing the number of layers can improve the detection AP, the improvement is limited and tends to be flat; at the same time, the time consuming for detecting each sample increase significantly. The reasons are analyzed as follows. The detection of large objects depends on the small-scale feature map at the pyramid backbone, because the small-scale feature map contains more obvious feature information of large objects. Unlike the big objects, most of the semantic information of small objects is stored in the large feature map. The smaller the feature map is, the weaker the small object is. Therefore, in order to give consideration to the detection AP and speed, we set the number of pyramid layers of the branch to 3.
4.7. Effectiveness Analysis
This subsection analyzes the effectiveness of the method by analyzing comparative and ablation experiments.
The motivation of the method is supplementing object features and improving the ability to expressions in order to expect to improve small object detection average precision. As can be seen from
Table 1 and
Table 4, we not only have particularly significant improvement in small objects, but also the detection average precision of large objects is guaranteed. Among them, there are some results that we did not achieve the best performance. The reason for this is that some networks are two-stage networks. The two-stage networks refine the proposal in the second stage to obtain the final detection results, and although the detection average precision is improved, the detection speed becomes slower. Our network, FusionPillars, is a one-stage network that is only faster, but also performs better.
The comparison experiment (
Table 2) between FusionPillars and baseline illustrates that the introduction of multi-modality indeed complements the features of the object, improves the information representation of the feature map, and achieves the improvement of small object detection average precision.
Comparative experiments (
Table 3) with other classical 1-stage fusion networks illustrate the superior performance of FusionPillars.
In addition, the progressive improvement of the ablation studies (
Table 5) demonstrates the effectiveness of the two main fusion modules (PVC module and SAS module) operating independently and operating jointly for the network. The experimental data in
Table 6 show the effectiveness of introducing the improved network.
5. Conclusions
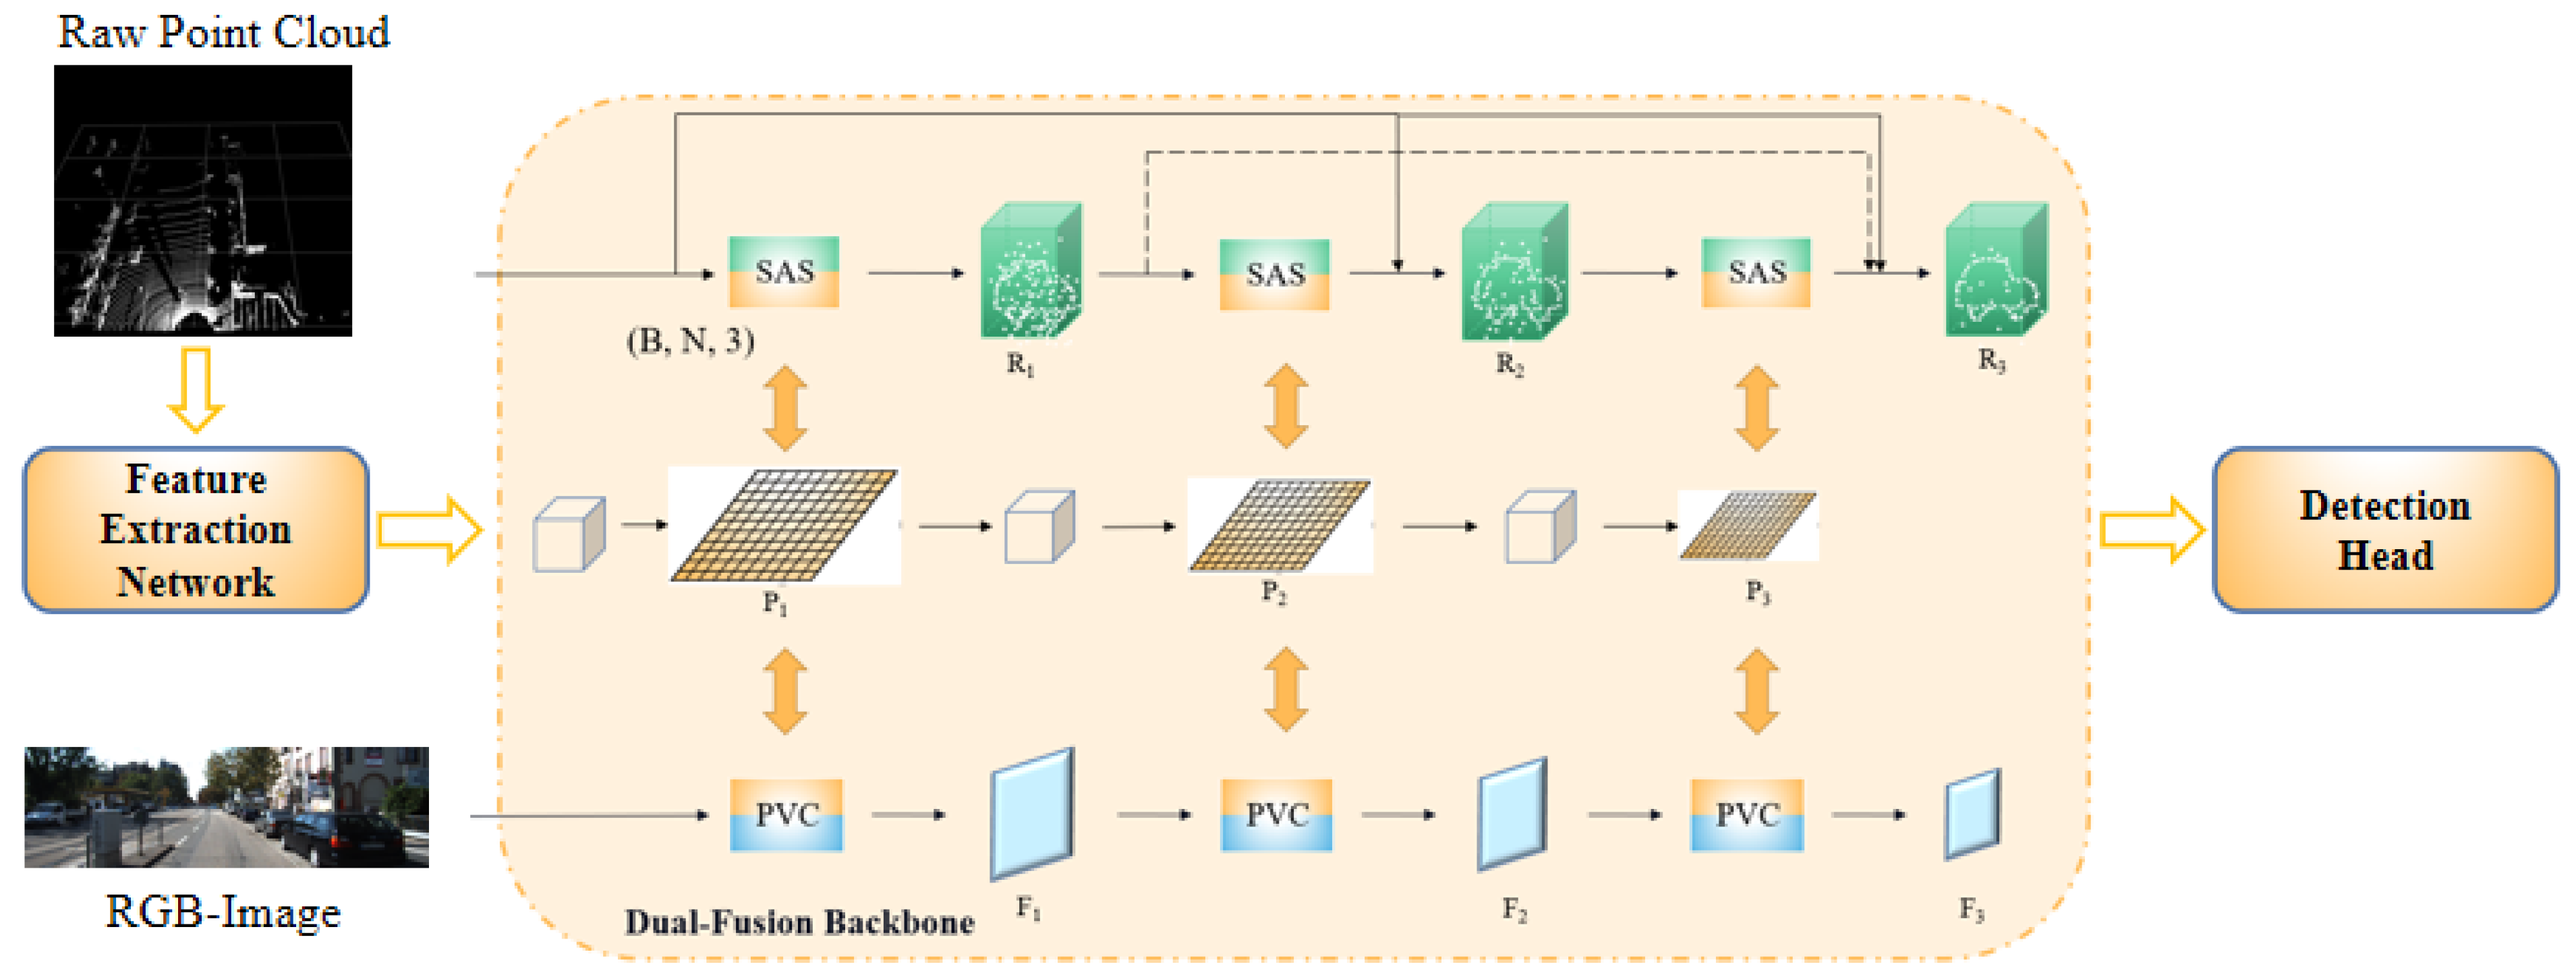
In this paper, we propose a novel one-stage multi-modal detection network, FusionPillars. It consists of a feature extraction network, a dual-fusion backbone, and a detection head. The feature extraction network preprocesses the raw point cloud to generate a pseudo-image. The dual-fusion backbone includes the SAS module and the PVC fusion module. The SAS Fusion Module self-fuses point-wise features and voxel-wise features, enhancing the spatial representation of the pseudo-image. The PVC fusion module cross-fuses the pseudo-image and RGB image, and the semantic information of the RGB image is given to the pseudo-image so that the pseudo-image has color expression capability. These two modules effectively enhance the feature expression ability of small objects of the pseudo-image by performing self-fusion and cross-fusion of point clouds and images. A large number of experiments have verified the effectiveness of the SAS fusion module and PVC fusion module.
For a long time, the biggest challenge faced by multi-modal network researchers has been how to overcome the differences in two or more different data characteristics. So in the next step, our research focus will still be on finding the relationships between data with different characteristics in order to achieve better fusion methods to improve detection accuracy.


