Article

Analysis of Spatial and Temporal Variation in Water Coverage in the Sub-Lakes of Poyang Lake Based on Multi-Source Remote Sensing

1
Shandong Electric Power Engineering Consulting Institute Corp., Ltd., Jinan 250013, China
2
School of Earth Science and Engineering, Hohai University, Nanjing 211100, China
3
Jiangsu Province Engineering Research Center of Water Resources and Environment Assessment Using Remote Sensing, Hohai University, Nanjing 211100, China
4
Key Laboratory of Watershed Geographic Sciences, Nanjing Institute of Geography and Limnology, Chinese Academy of Sciences, Nanjing 210008, China
5
China Institute of Water Resources and Hydropower Research, Beijing 100038, China
*
Author to whom correspondence should be addressed.
These authors contributed equally to this work.
Remote Sens. 2023, 15(11), 2788; https://doi.org/10.3390/rs15112788
Submission received: 1 April 2023 / Revised: 23 May 2023 / Accepted: 24 May 2023 / Published: 26 May 2023

Abstract

:
As the largest freshwater lake in China, Poyang Lake is an internationally important wetland and the largest migratory bird habitat in Asia. Many sub-lakes distributed in the lake basin are seasonal lakes, which have a significant impact on hydro-ecological processes and are susceptible to various changes. In this study, using multi-source remote sensing data, a continuous time-series construction method of water coverage suitable in Poyang Lake was developed. That method combined the downscaling of the MNDWI (modified normalized difference water index) with the ISODATA (iterative self-organizing data analysis technique algorithm), and its accuracy can be up to 97% in the months when Landsat 8 is available or 87% when it is unavailable. Based on that method, the increasing variation in water coverage was observed in the sub-lakes of Poyang Lake during 2013–2020 to be within a range of 200–690 km2 normally. The center of the sub-lakes always remained inundated (>80% inundation frequency), while the surrounding areas were probably kept dry for seven months (except for June to September). The dominant influencing factors of water coverage variations were different in different hydrological periods (wet season and dry–wet season: discharge; dry season: temperature and wind speed; wet–dry season: temperature and precipitation). In addition, “returning farmland to lakes” affected the increase in the water area in the sub-lakes. This study is helpful for the management of water resources and the protection of migratory birds in the Poyang Lake region.

1. Introduction

Poyang Lake is the largest freshwater lake in China, and it is also the only member of the World Network of Lakes for Life in China and one of the first wetlands included in the list of internationally important wetlands [1,2,3]. Due to the uneven sediment deposition in the lake basin over a long period of time, when the water level recedes during the dry season, the water surface is separated from the main lake body, naturally forming many lakes within lakes (“sub-lakes”) with special hydrological processes and ecological characteristics. The topographical features and hydrological processes of these sub-lakes provide superior habitats for the development of wetland ecosystems, are important habitats and food sources for wintering migratory birds, and play an irreplaceable role in maintaining the integrity of the wetland ecosystem and species diversity of Poyang Lake [4,5]. Research on the water surface changes at Poyang Lake has been of wide interest to many scholars [6,7,8]. Hu et al. [9] provided statistics on the number and area of the sub-lakes in the Poyang Lake basin, analyzed the distribution and landform characteristics of the sub-lakes, and revealed the level of relationship between the sub-lakes and Poyang Lake. Taking the sub-shaped lakes (Bang Lake and Sha Lake) of Poyang Lake as the research object, Li et al. [10] conducted a comprehensive analysis of the transformation relationship and exchange flux of groundwater in the sub-lakes using hydrological, thermodynamic, and hydrodynamic methods. Wu et al. [11] used water level observation data to explore the water level change and hydrological exchange process at Poyang Lake and three typical saucer lakes; the study showed that the main lake and the saucer lake show strong seasonal and spatial correlations between water level changes and hydrological exchange processes. Liu et al. [12], based on long-term remote sensing images, analyzed the spatio-temporal variation characteristics of seasonal lakes and their influencing factors and ecological effects. Wang et al. [13], taking the free connected sub-lake Bang Lake and locally controlled sub-lake Dahuchi Lake of Poyang Lake as a case, and based on the remote sensing cloud computing platform of the Google Earth Engine (GEE), used the pixel binary model to estimate aquatic vegetation coverage from 2000 to 2019, and analyzed the temporal and spatial differentiation characteristics.
Currently, many water extraction methods have been proposed by researchers, such as the single-band method, image classification method, band ratio method, density segmentation method [14] and spectrum method [15], among which the single-band method and band ratio method are widely used due to their simplicity and relatively reliable results [16,17]. However, the accuracy of the traditional single-band and band ratio methods depends on the threshold selection and is susceptible to subjective influence. Nowadays, the single-band method and band ratio method are beginning to be combined with the ISODATA method [18,19,20], Otsu method [21,22] and random forest [23,24,25], which greatly reduce the influence of subjective experience on the extraction of water bodies. In addition, there are limitations to the spatial and temporal continuity of a single remote sensing sensor, and in recent years, researchers have proposed a number of downscaling methods that use low-resolution remote sensing data to decompose water surface information for water body extraction. Wu et al. [26] proposed a new downscaling method based on the normalized difference water index (NDWI)’s statistical regression algorithm in 2015, which is very feasible for small-scale lake water surface extraction; however, compared to the direct extraction of water surfaces by medium and high-resolution satellites, its accuracy still needs to be improved.
Therefore, considering the frequent rainfall in the Poyang Lake basin, satellite data are often unavailable at medium and high resolutions. Thus, this study develops a kind of construction method using multi-source remote sensing data to keep the time series continuous. This method can be used for the water surface information extraction of sub-lakes, combined with the downscaling model based on the MNDWI and the water body extraction method based on the ISODATA. This study constructs the time series data of the water coverage of sub-lakes at the month scale from 2013 to 2020, and analyzes the spatial and temporal variation in water area. Finally, the influencing factors of water area change are analyzed, which is important for the comprehensive understanding of the water resources of Poyang Lake and the effective guidance on migratory bird protection work in Poyang Lake.

2. Study Area and Data
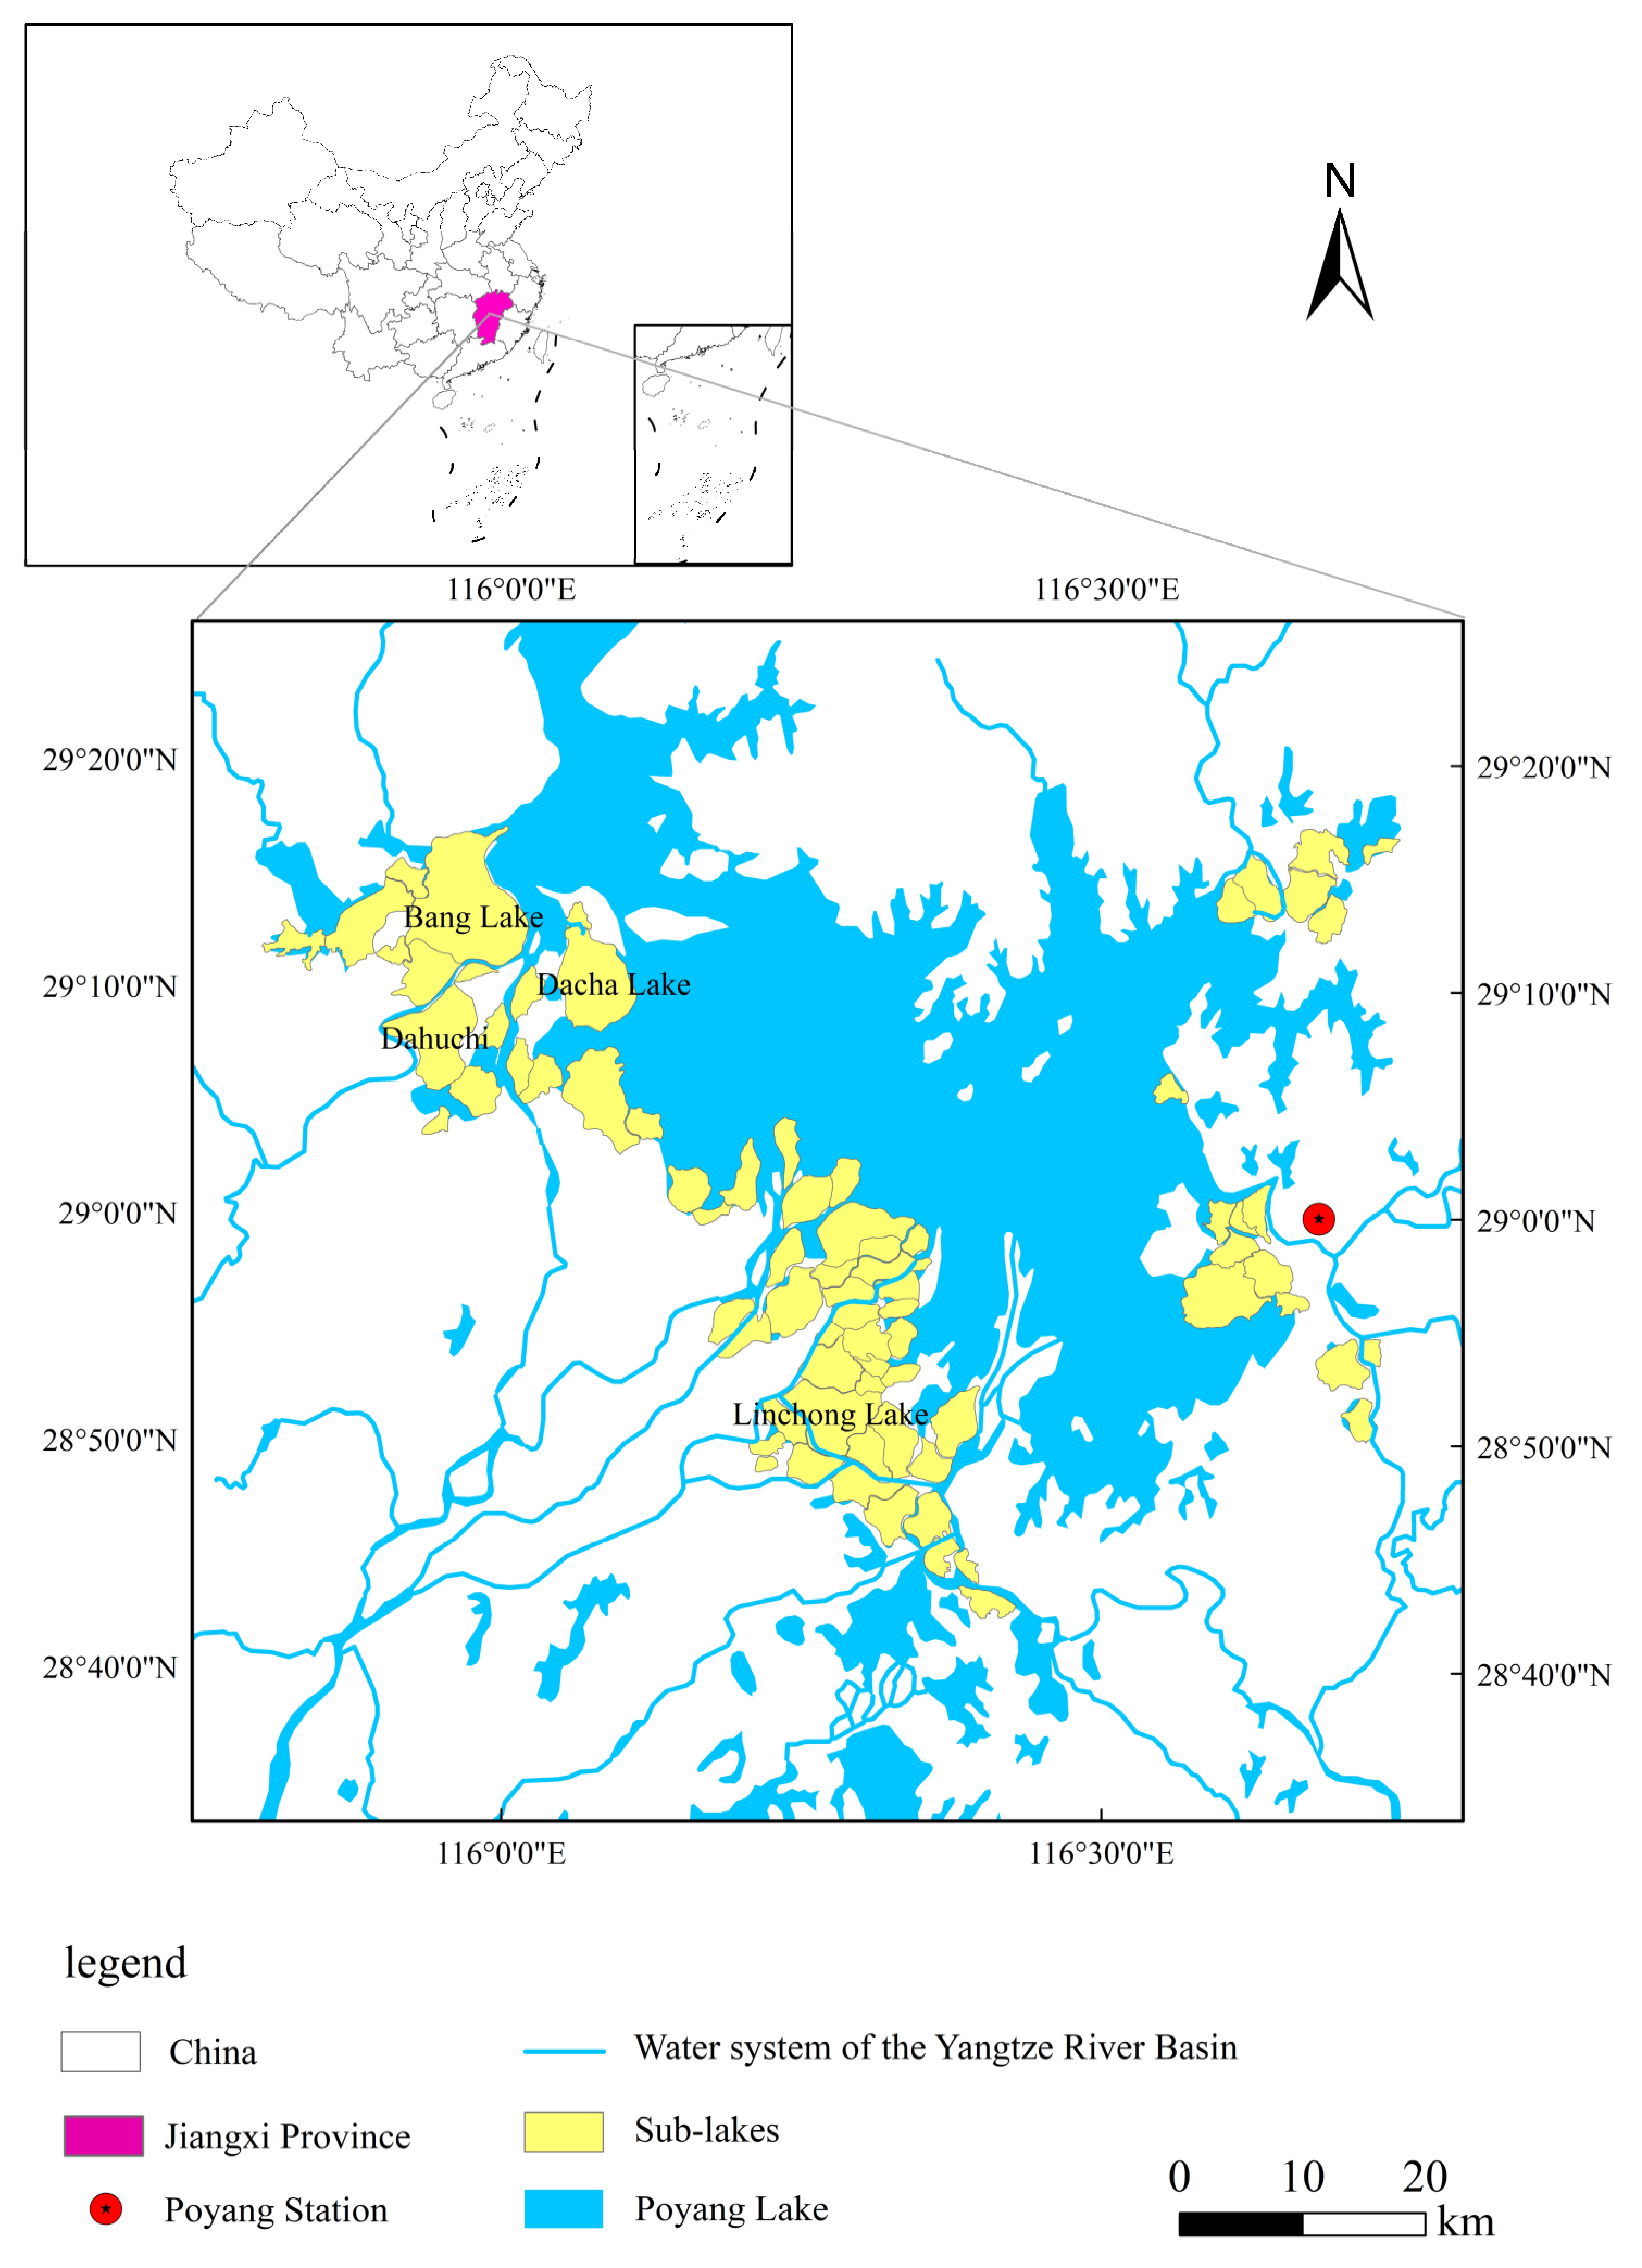
2.1. Study Area

Poyang Lake is the largest freshwater lake in China, located in South China. Poyang Lake is a seasonal lake connected to the Yangtze River with a drastic variation in water levels and coverage in different hydrological seasons. The water level of Poyang Lake changes drastically; during the dry season, the lake basin breaks away from the main lake body and its beach is exposed, forming many sub-lakes. Due to the uniqueness of the sub-lake’s topography and lake’s hydrological rhythm, the hydrological process is very complicated. Sub-lakes usually have the characteristics of small area and scattered distribution, mainly located in the east, south and west of Poyang Lake, such as Bang Lake, Linchong Lake, Dahuchi, and Dacha Lake [27,28] (Figure 1). Among them, the Bang Lake has a large area, is largely in its natural state, has an abundance of migratory birds, and is the core conservation depression of the Poyang Lake National Nature Reserve, so it is the most representative. At the same time, it allows convenient observation, so Bang Lake was selected as the verification area. The climate in Poyang Lake is a semitropical monsoon climate with a continuous period of precipitation in the wet season. The sub-lakes have the largest vegetation biomass and the richest species diversity in Poyang Lake’s wetland. At the same time, they also provide a superior habitat for migratory birds and play a pivotal role in maintaining the ecosystem function of Poyang Lake’s wetland.

2.2. Data

2.2.1. Remote Sensing Data

In this study, Landsat 8 data and MODIS data were used for the construction of time series information for the water area of the sub-lakes, and GF-1 data were used as validation data for the extraction results. The land use classification data for analyzing human activity factors are GlobeLand30 data. The data involved in this paper are shown in Table 1.
(1)
Landsat 8 data
The Landsat remote sensing data used in this study were Landsat 8 OLI, atmospheric apparent reflectance data for 2013–2020 (https://earthexplorer.usgs.gov/, accessed on 13 July 2021), with a spatial resolution of 30 m. The selection criteria for the images were coverage of the study area and good quality (the cloud cover in the study area is less than 2%), with a total of 65 scenes, of which 45 scenes were used for water surface information extraction in Landsat in the available months, and 20 scenes were used for the construction of the downscaling model.
(2)
MODIS data
The MODIS data used in this study are MOD09 apparent reflectance data from 2013–2020 (http://ladsweb.nascom.nasa.gov, accessed on 29 December 2021). The selection criteria for the images were coverage of the study area and good quality (The cloud cover in the study area is less than 2%), with a total of 66 scenes, of which 20 scenes of them were used for the construction of downscaling model and 46 scenes of them were used for the reconstruction of the time series.
(3)
GF-1 data
The GF-1 satellite is the first satellite of the High Resolution Earth Observation System in China, and the data used in this study were acquired by PMS, which has panchromatic image with a spatial resolution of 2 m and multispectral image with a spatial resolution of 8 m (https://scene.thxpace.com/image/#/search, accessed on 23 September 2021). In this study, the 2 m fused image of GF-1 on 19 November 2015 (Landsat8 available) and 16 March 2014 (Landsat8 unavailable), which are similar dates to the date of the image used for water surface information construction, were selected as the validation data for the time series reconstruction method in this study. Based on the validation reference, 300 points were randomly selected as validation points within the study area.
(4)
GlobeLand30 data
For resolution reasons, the land use classification data were GlobeLand 30 data (www.globallandcover.com/, accessed on 27 March 2022), which are global land cover data developed in China with a spatial resolution of 30 m [29,30]. At present, the data versions for 2000, 2010 and 2020 have been published, so we chose 2010 and 2020 as the years for our land use change study. The overall accuracy of GlobeLand30 V2010 data is 83.50%, and the Kappa coefficient is 0.78; the overall accuracy of GlobeLand 30 V2020 data is 85.72%, and the Kappa coefficient is 0.82. The data were used to analyze changes in land use types between different years.

2.2.2. Ground Observations

Ground observations were used to analyze the influence of natural factors on the change in water area. The meteorological data were derived from Poyang Station which is one of the standard meteorological stations of China. The data obtained from the station mainly included the daily temperature, wind speed and precipitation. The discharge data were derived from the Hydrology Bureau of Jiangxi Province (http://www.jxssw.gov.cn/, accessed on 23 December 2022). Due to the limitations of the data provider, the time period of the data is 2014–2017 and 2019. The station used is the Waitan Station which monitors the discharge from the Ganjiang River into the lake, including the daily discharge data.

3. Methods

3.1. Reconstruction Methods for Continuous Time Series

Firstly, for the months when Landsat 8 was available, the MNDWI was calculated using Landsat data. Secondly, for the months when Landsat 8 was unavailable due to cloud and rain, MODIS data were used to calculate the MNDWI at a high spatial resolution of 30 m using a downscaling model. The main steps of this method are the following: (1) in order to ensure a match between different resolution data, the low-resolution MNDWI image was resampled to the same resolution as that of the high-resolution MNDWI image via the nearest neighbor method; (2) based on each pixel, a linear regression model was established between the resampled MNDWI value and the corresponding high-resolution MNDWI value; (3) the low-resolution MNDWI values used to supplement the unavailable Landsat8 were considered independent variables, and the established regression model was used for downscaling to obtain higher-resolution MNDWI results; the ISODATA based on the MNDWI was used to extract the water surface of the sub-lake. Using that method, we could construct the time series dataset of water coverage in sub-lakes at a spatial resolution of 30 m at the month scale from 2013 to 2020. The flowchart of our method is shown in Figure 2.

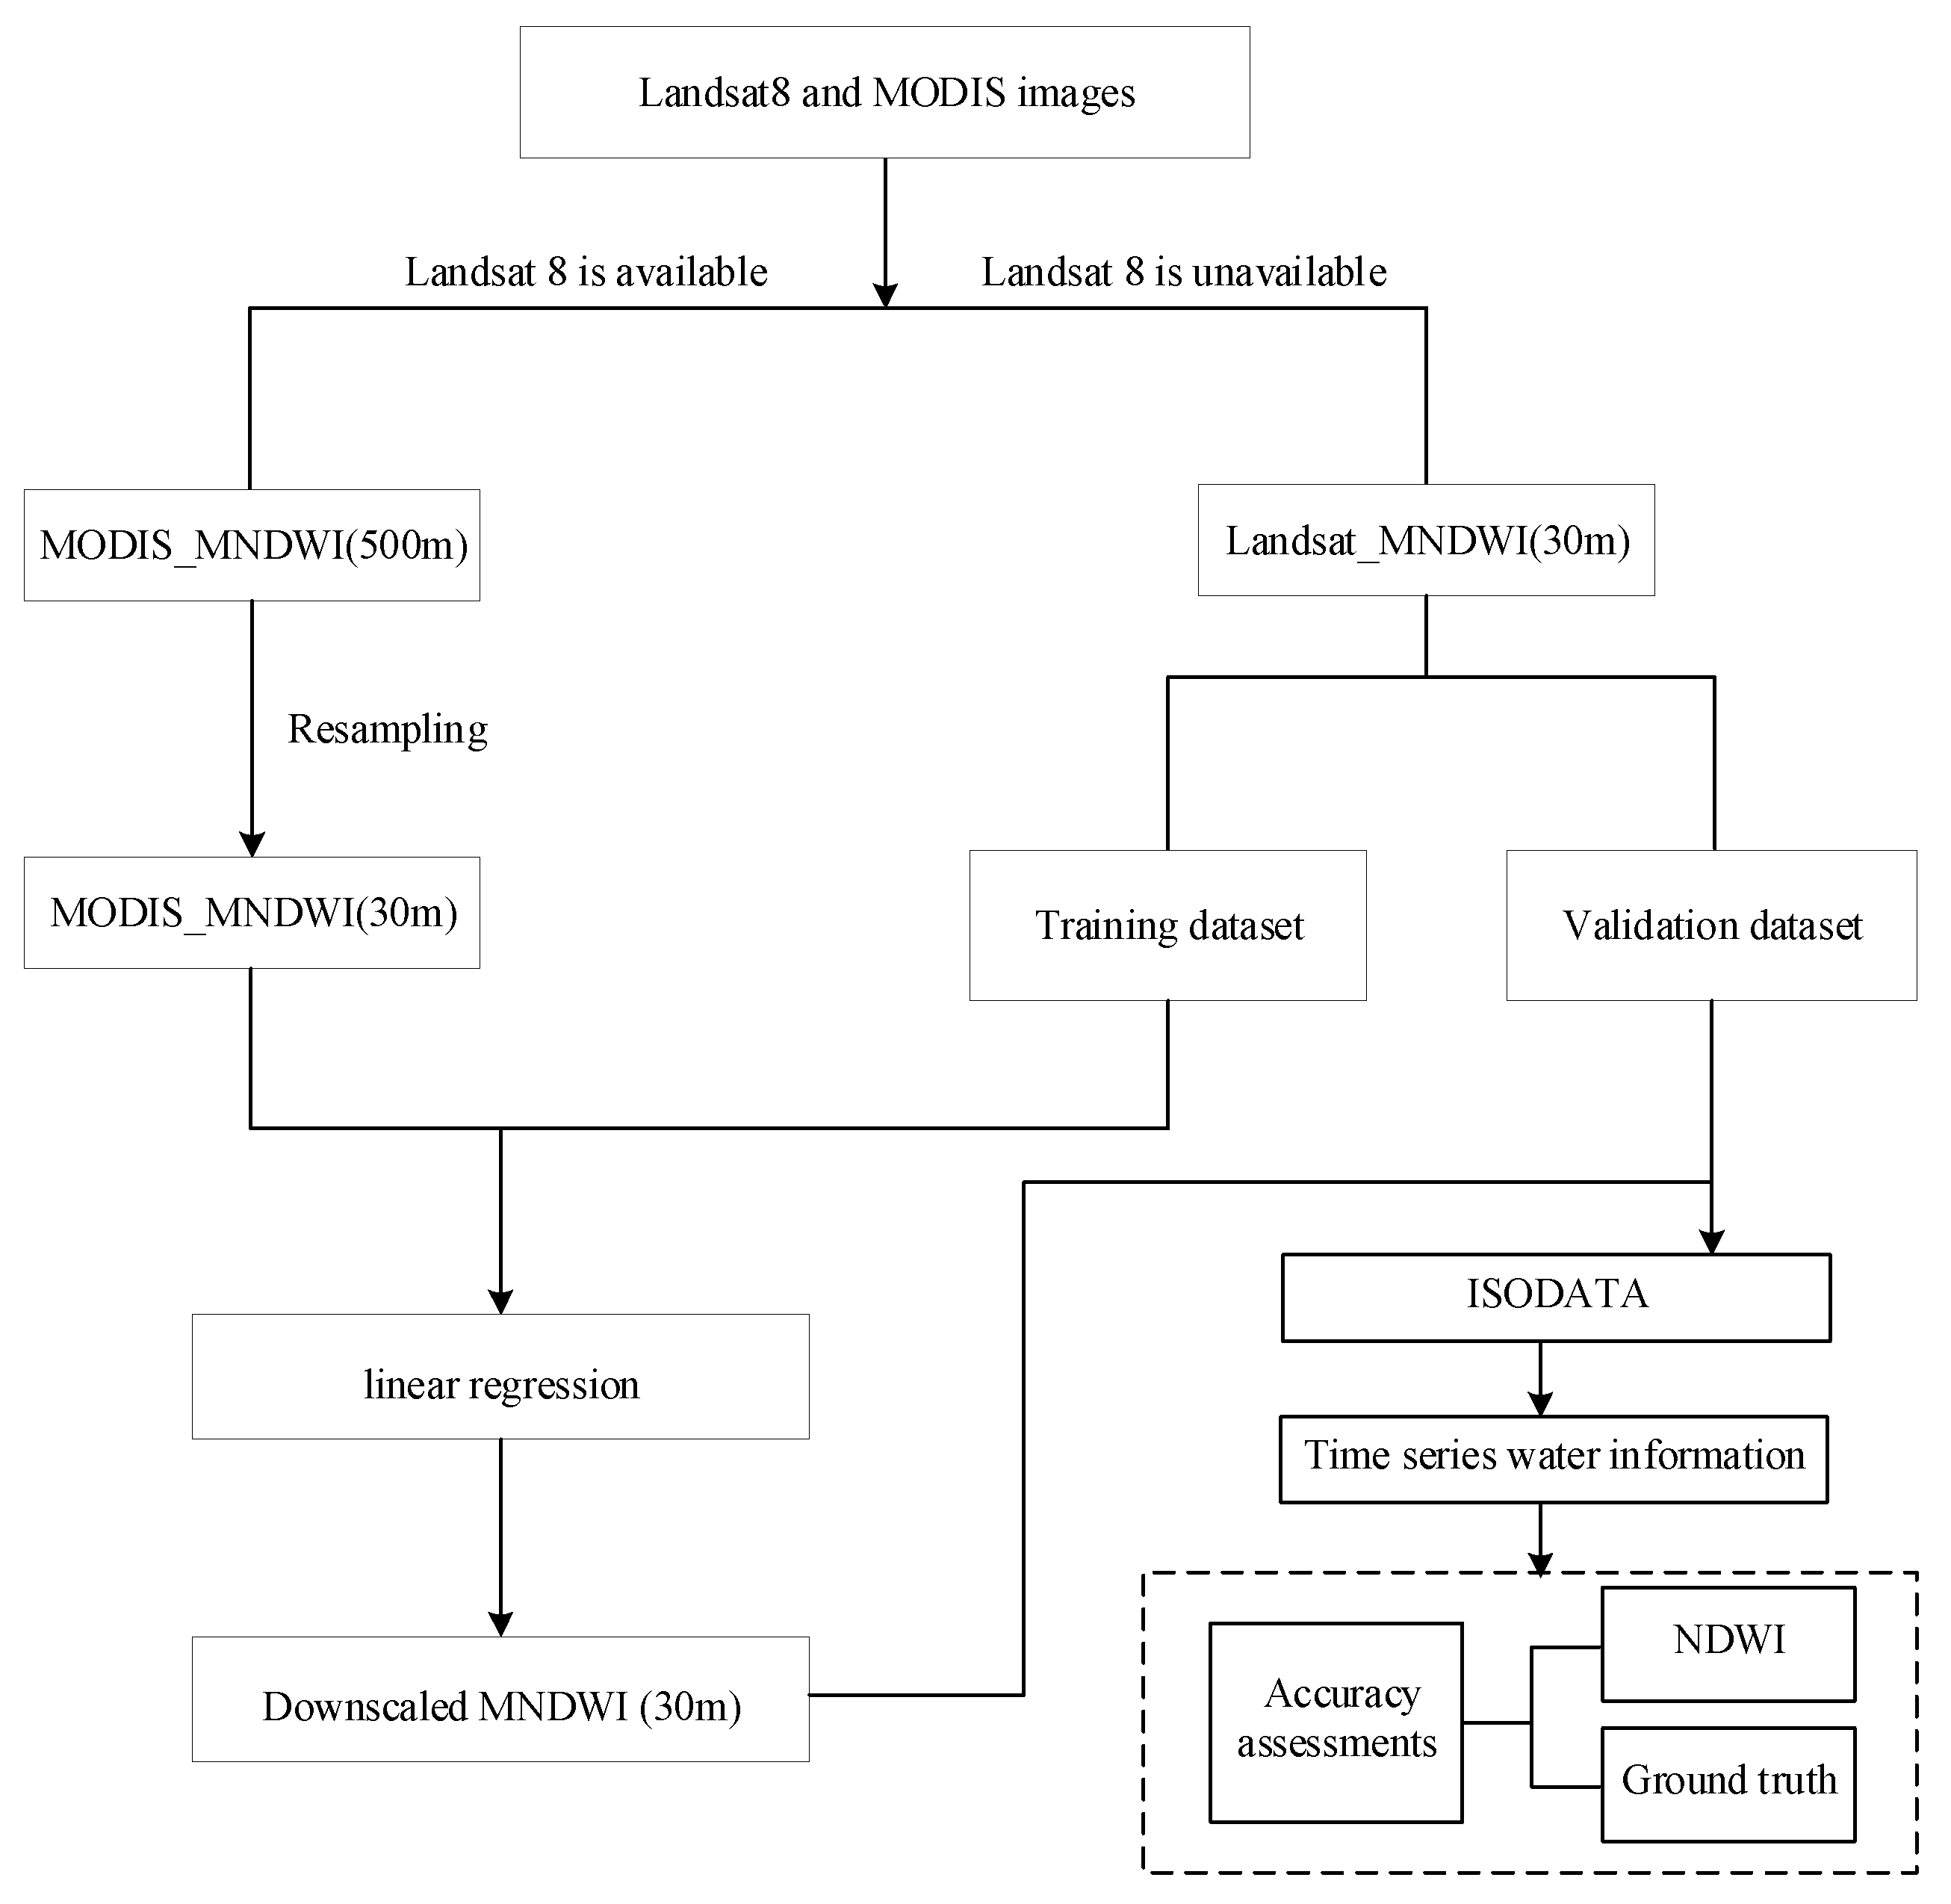
3.2. Water Surface Extraction Method in Available Months for Landsat 8

The water index, MNDWI, which has a better suppression effect on residential and soil noise, was used for the water area extraction of the sub-lakes [31]. The equation is as follows:
MNDWI = Green SWIR Green + SWIR
where Green is the reflectance of the green band; SWIR is the reflectance of the short-wavelength infra-red band.
For the months when Landsat 8 was available, water extraction was performed using the ISODATA based on this index. That method is an unsupervised classification algorithm that continuously splits and merges by introducing parameters, and iterates based on parameters such as initial cluster centers and a set number of categories to eventually obtain a more desirable classification result, which can reduce the subjectivity of threshold determination [18,19,20].

3.3. Water Surface Extraction Method in Unavailable Months for Landsat 8

In the months when Landsat data were unavailable, we considered the downscaling method proposed by Wu et al. [11]. based on NDWI to obtain a higher resolution from low-resolution data. The equation of NDWI is as follows:
NDWI = Green NIR Green + NIR
where Green is the reflectance of the green band; NIR is the reflectance of the near-infrared band.
The NDWI mainly takes advantage of the strong absorption of water in the NIR band and the strong reflectance of vegetation. It extracts the water information in images by suppressing vegetation and highlighting water, and the effect is better. However, since the reflectivity of the green band is much higher than that of the NIR band, when using the NDWI to extract water, only vegetation was considered while ignoring the two important features of buildings and soil, so the results of extracting water were often confused with soil and building information. The MNDWI uses SWIR instead of NIR, which has a good suppression effect on noise in residential areas and soil. Therefore, a downscaling model based on the MNDWI was established by combining Landsat and MODIS data in adjacent months. Firstly, based on Landsat (30 m) and MODIS (500 m) satellite images, a linear regression model based on the MNDWI was established using the downscaling method; it was applied to MODIS_MNDWI (500 m) from 2013 to 2020 for downscaling to obtain Downscaled_MNDWI with a spatial resolution of 30 m. The equation of the downscaled method is as follows:
MNDWI i , j , t F i n e = a i , j MNDWI i , j , t C o a r s e + b i , j
where MNDWI i , j , t F i n e and MNDWI i , j , t C o a r s e , respectively, represent the MNDWI value of a high-resolution image and the MNDWI value of a low-resolution image at time t and the pixel position (i, j); a i , j and b i , j are correlation regression coefficients.
Finally, based on the MNDWI images, the ISODATA was used to extract the water area.

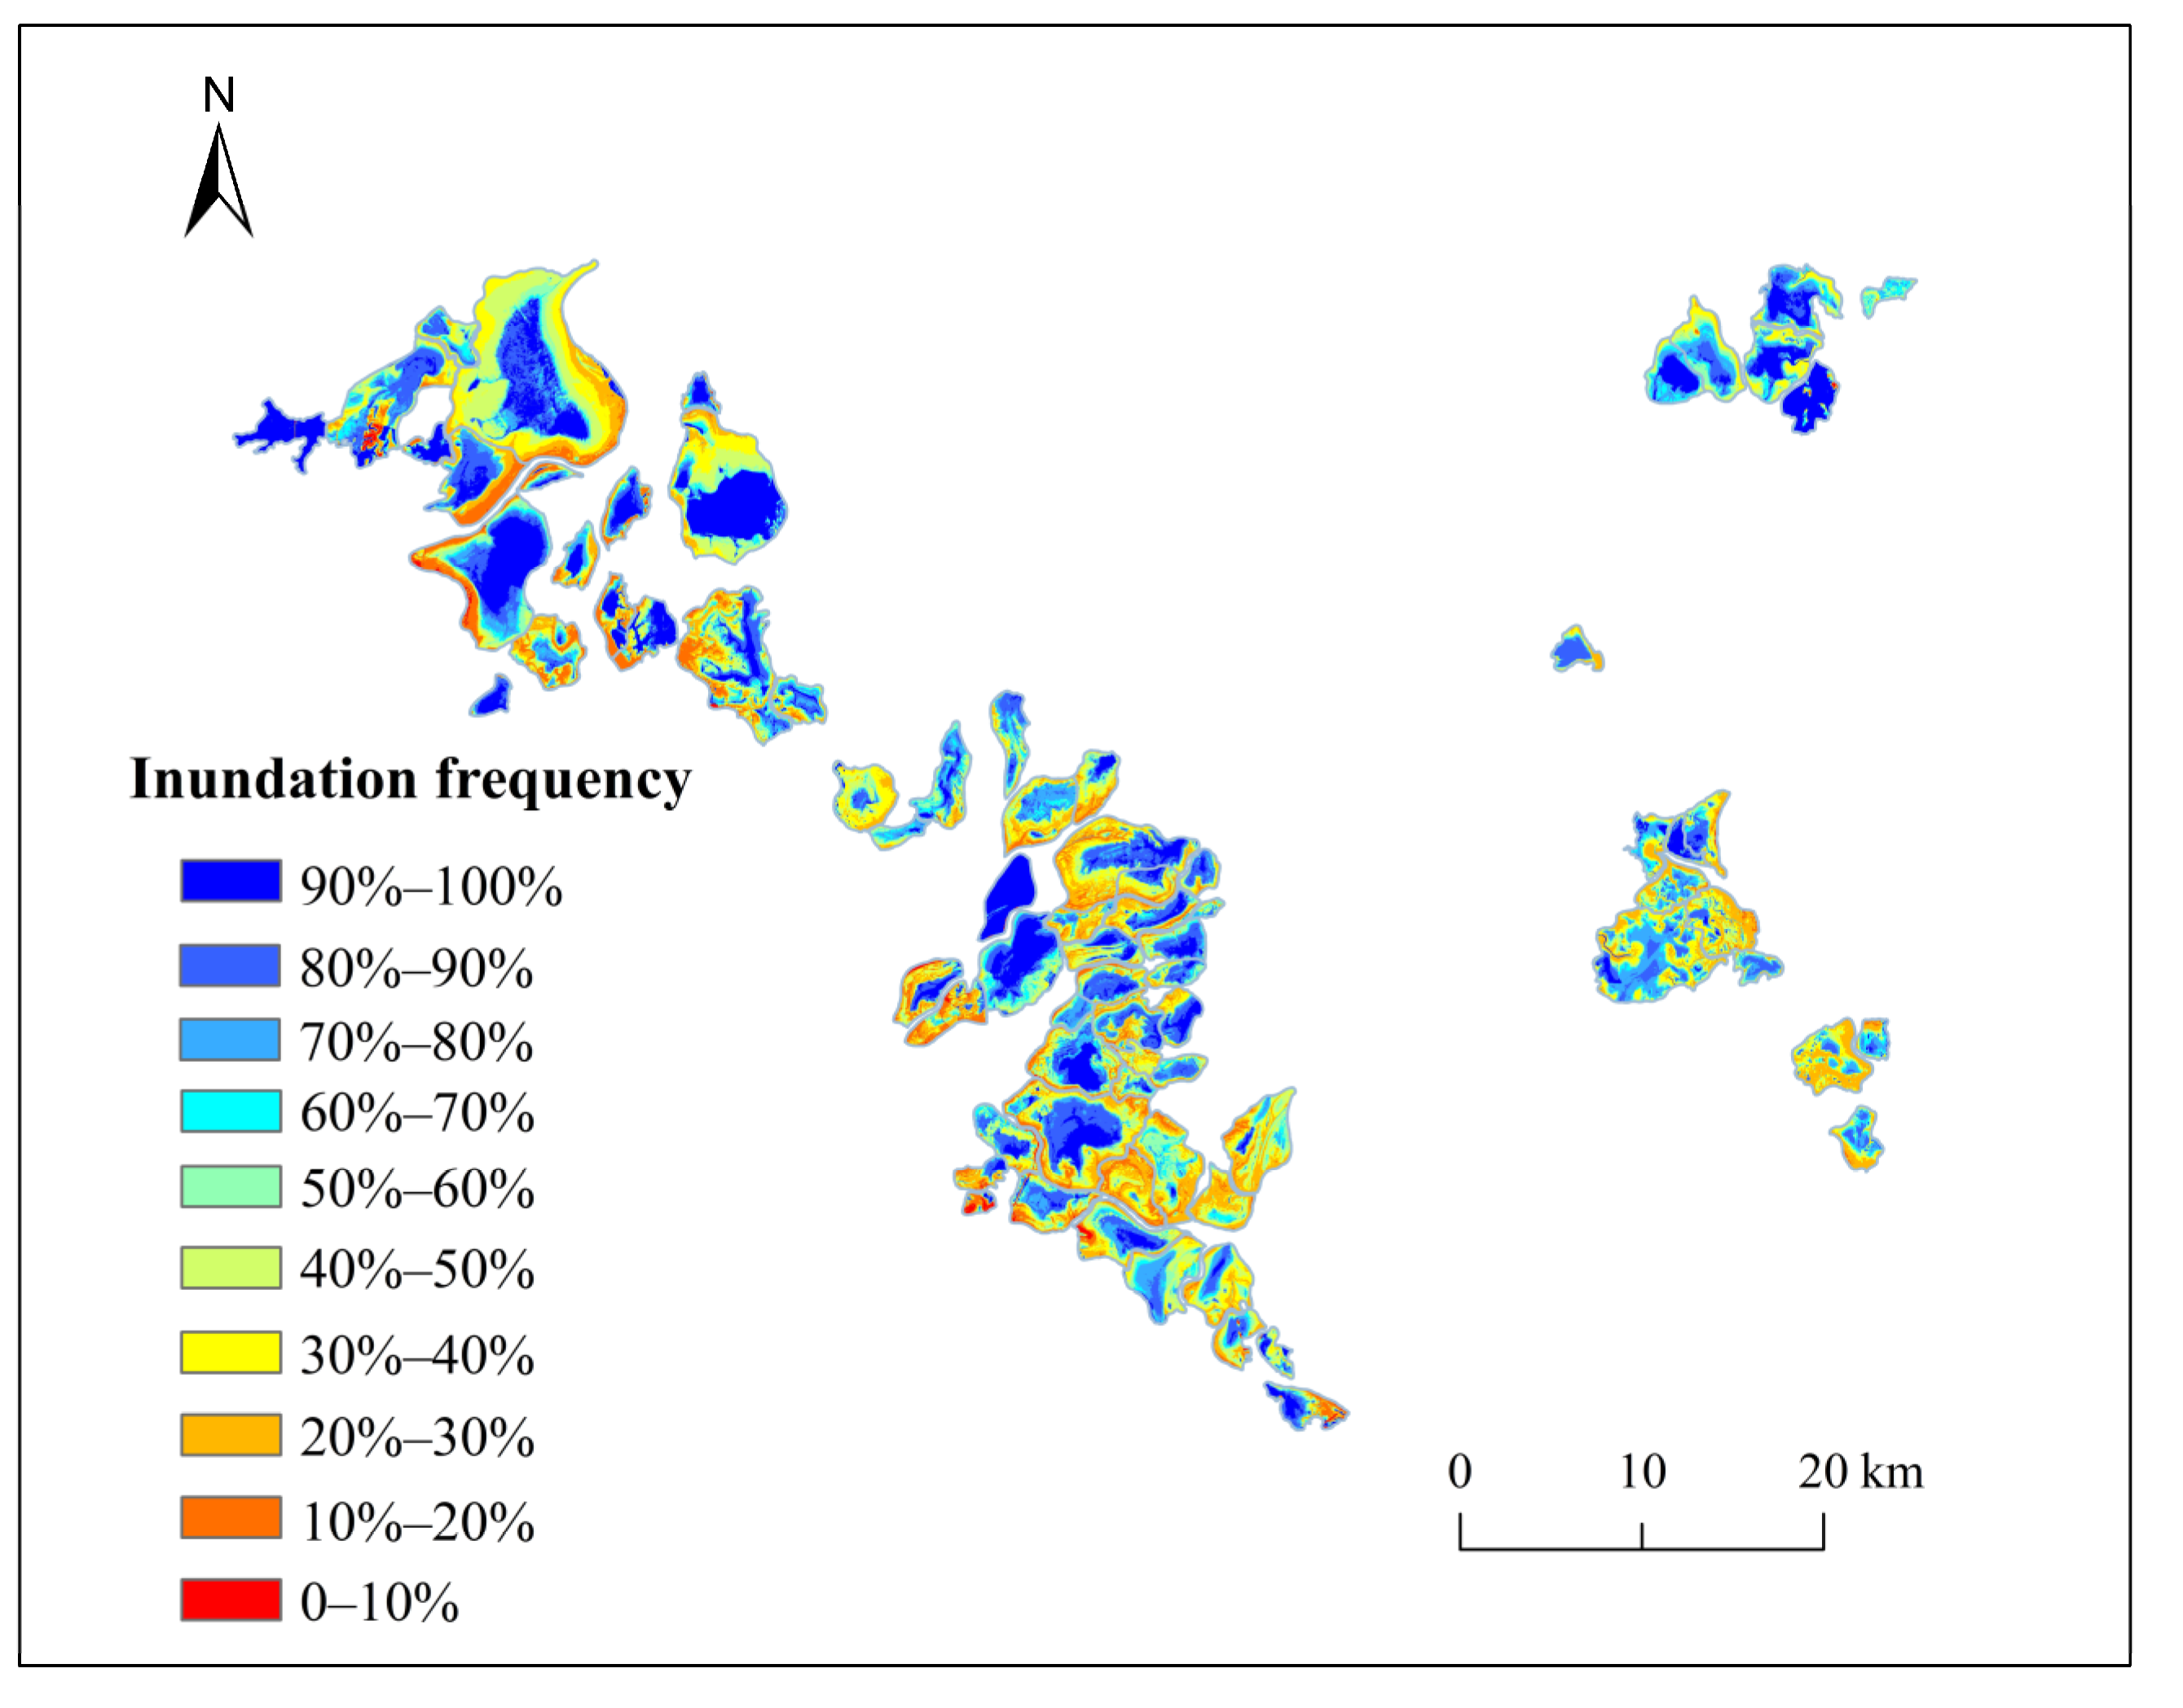
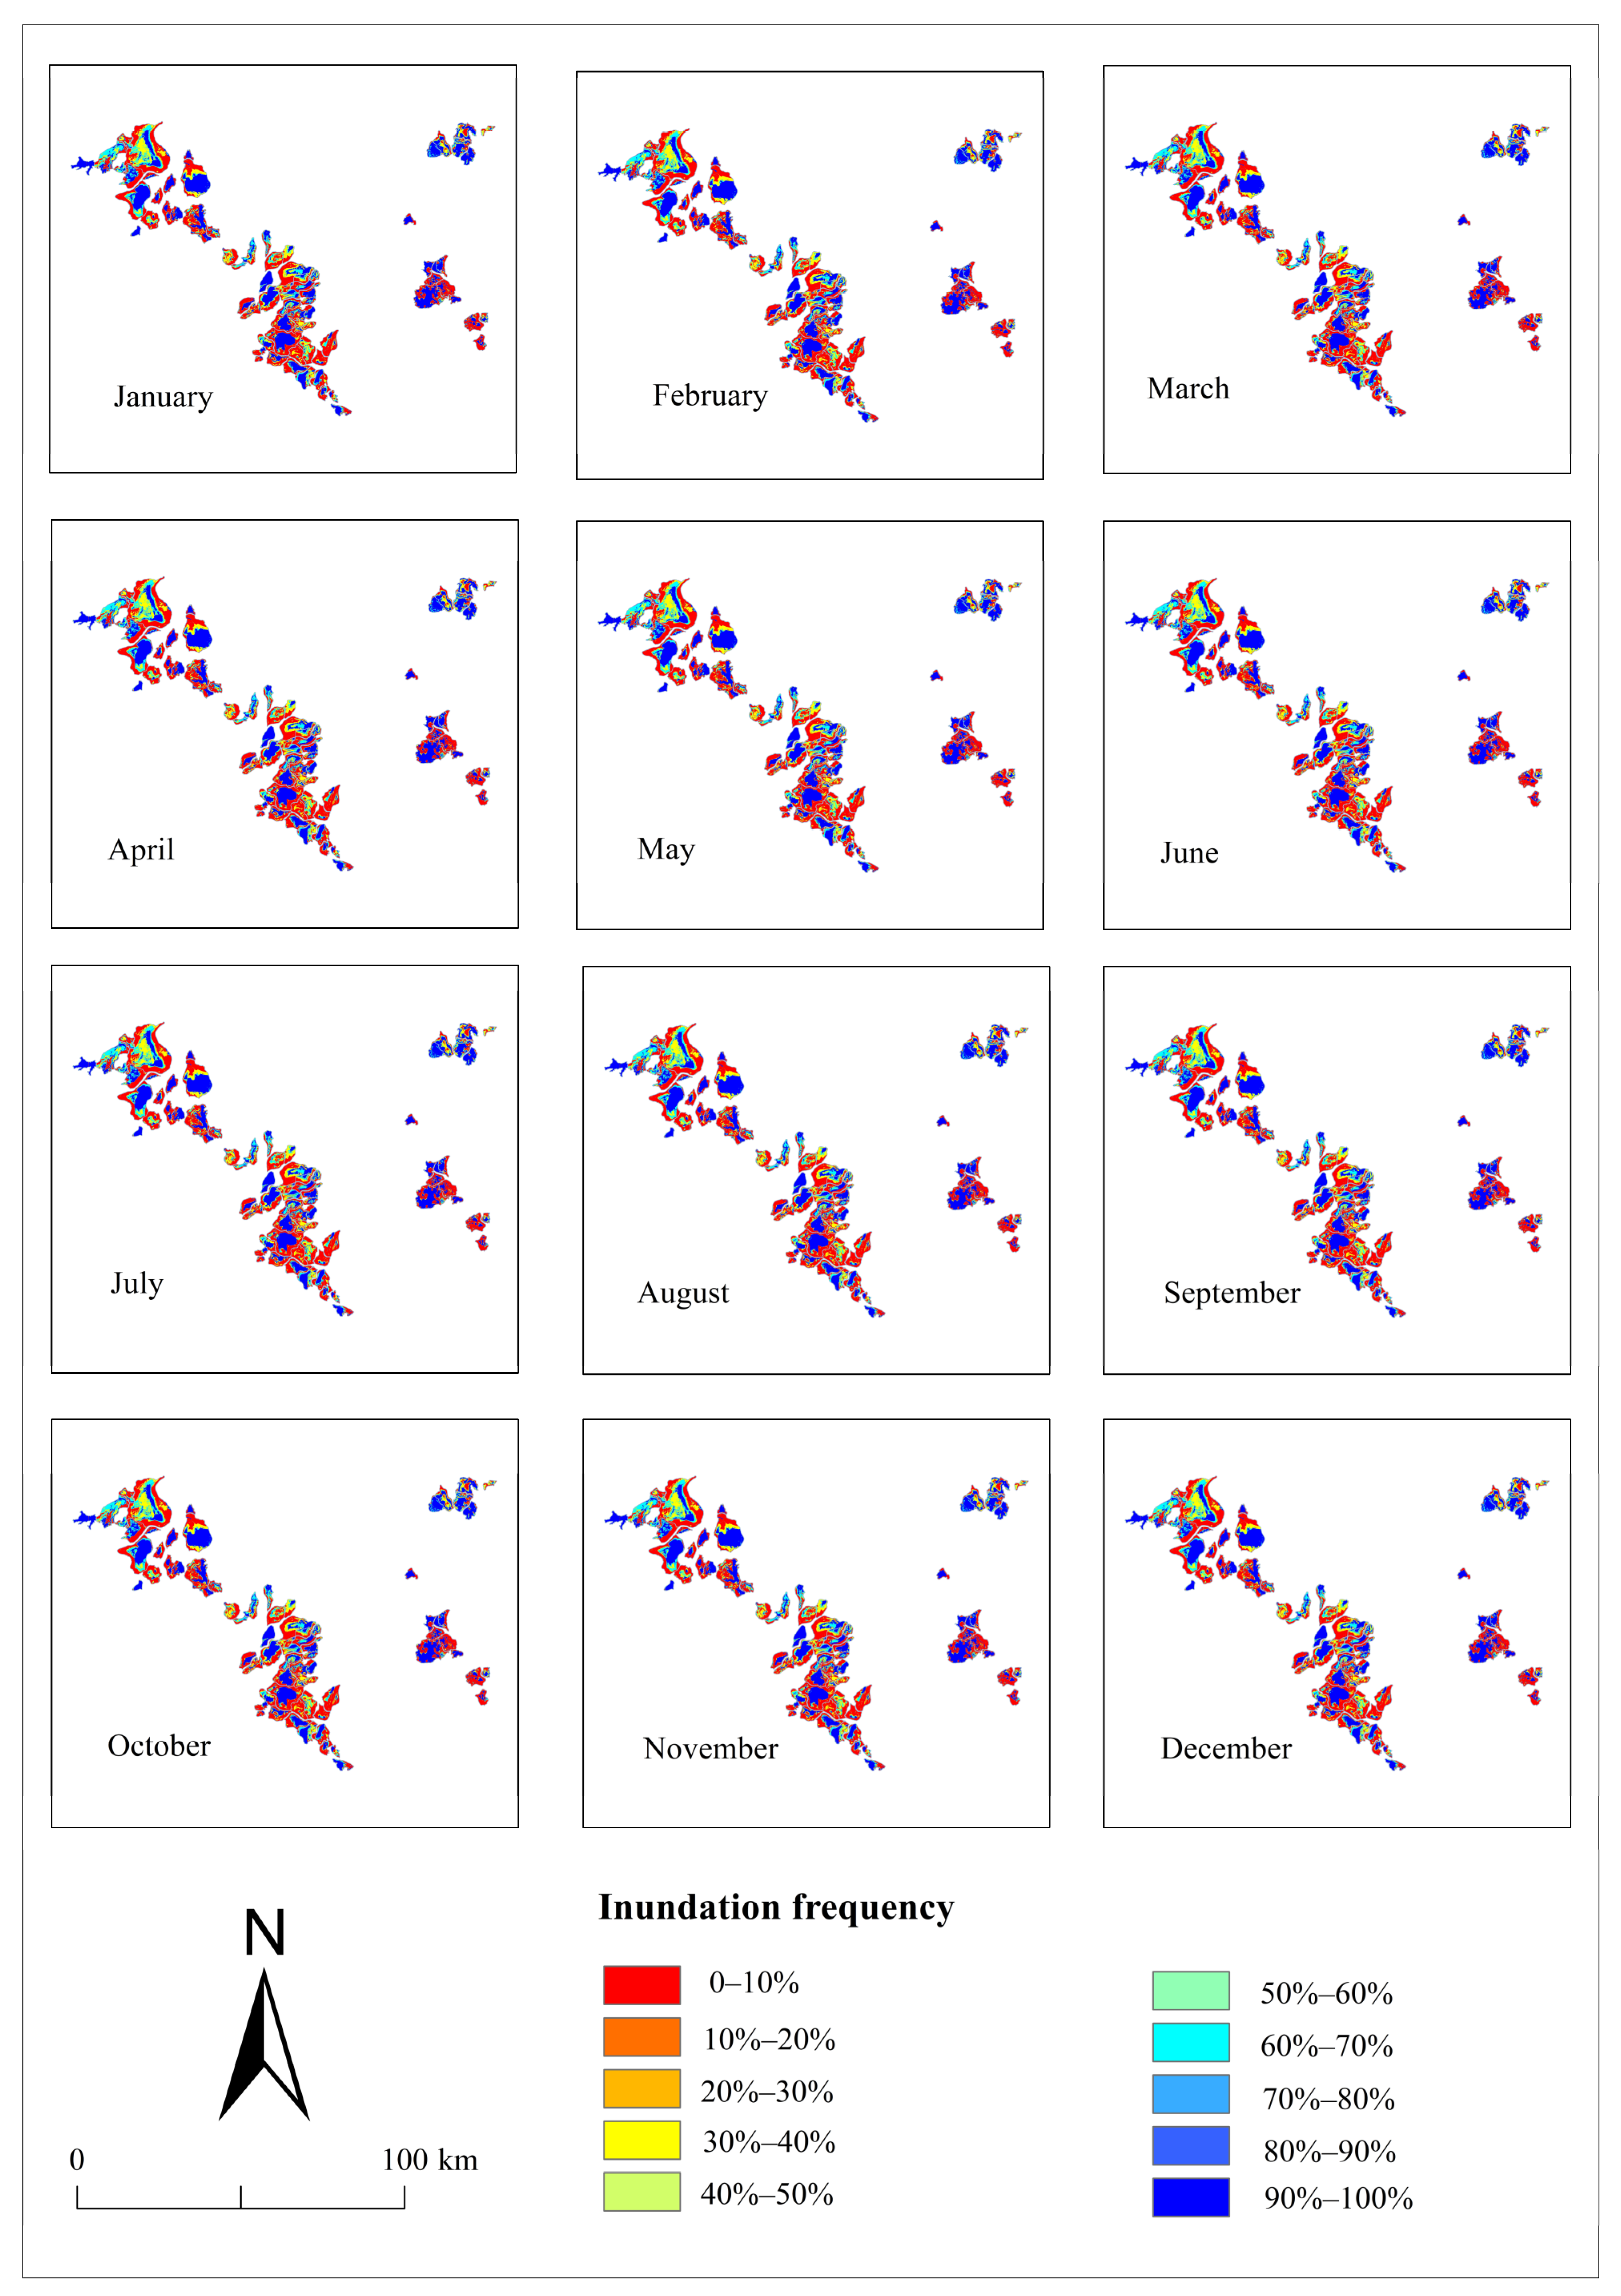
3.4. Inundation Frequency Method

For the same area, the relative value of the inundation ratio is used to describe the variation of the lake surface in different periods, which can prevent the uncertainty caused by a single observation. Therefore, in order to analyze the annual spatial variation of the water surface of sub-lakes accurately, based on the obtained extraction results of water surface information, the inundation frequency (IF) is used to describe the spatial distribution and variation characteristics of the water surface. The expression of IF is
F m = 1 N m t = 1 N m w m , t × 100 %
F y = 1 12 m = 1 12 F m × 100 %
where F(m) and F(y) represent the monthly average and annual average inundation frequency, respectively; m represents a certain month in a year; y represents a certain year; Nm represents the total number of days covered by remote sensing images in month m; wm,t represents the water coverage state of the pixel, generally using 0 for no water and 1 for water. For land, IF is 0%; for perennial lake areas, IF is 100%; for seasonal lakes, the value of IF ranges from 0 to 100%, with higher values indicating longer inundation in a certain time period.

3.5. Analysis Method of Influencing Factors

3.5.1. Multiple Linear Regression Analysis

Multiple linear regression analysis predicts or estimates the dependent variable via the optimal combination of multiple independent variables, which is more effective and more realistic than using only one independent variable for prediction or estimation [32]. Before the establishment of a multiple regression model, the data should be normalized. The normalization method used in this study was linear normalization (Max-Min) [33,34,35,36].

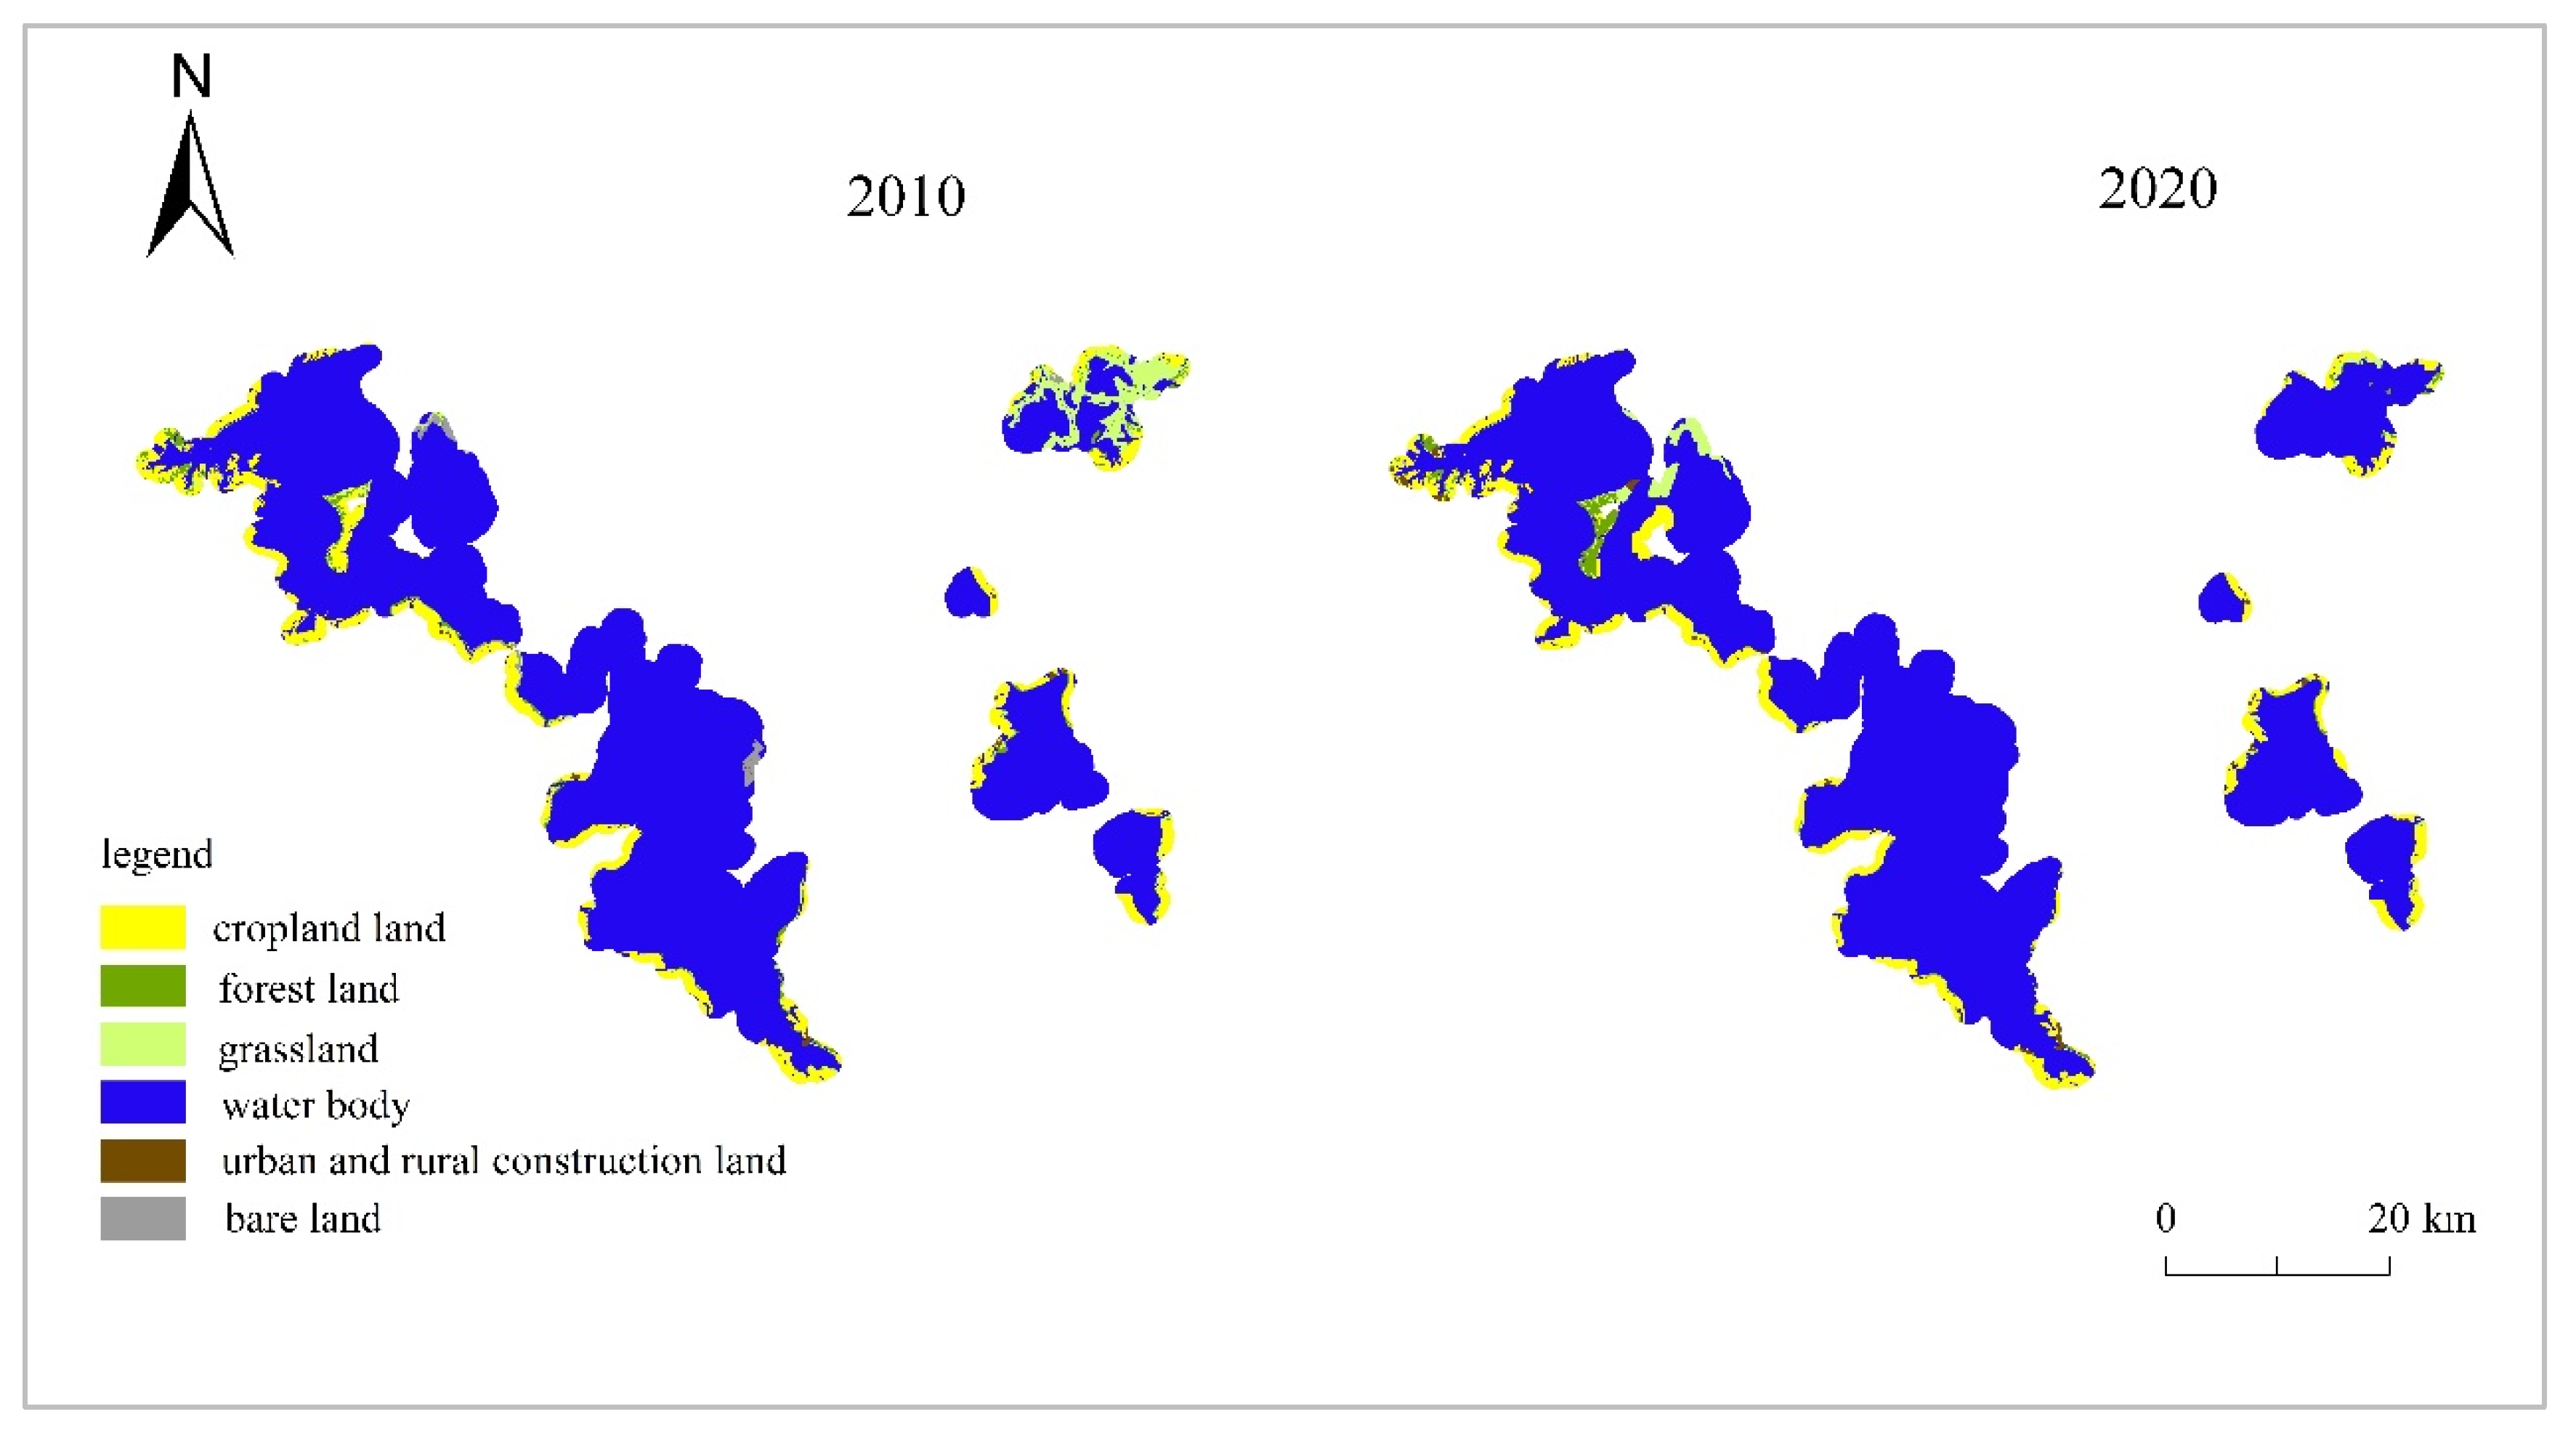
3.5.2. Dynamic Analysis of Land Use

The dynamic degree of land use (K) represents the change rate of a certain land use type in a certain period of time; the larger the value of this indicator, the more intense the degree of land use change, and the smaller the value, the slower the change [37]. The equation for land use dynamic degree is as follows:
K = A t 2 A t 1 A t 1 · 1 t
where A t 1 and A t 2 represent the area of a certain land use type in the starting and ending years of the study, respectively, in km2; t represents the number of years between the start year and the end year, in a. Taking the vector area of each sub-lake as the center, a buffer zone is established within 1 km, and the land use in 2010 and 2020 is classified. On this basis, statistics on the land use types in the buffer zone are determined, and the dynamic degree of land use (K) is calculated. In order to more intuitively reflect the mutual conversion relationship between various land use types, we used the statistical analysis tools in ArcGIS to calculate the land use transfer matrix from 2010 to 2020.

4. Results

4.1. Accuracy Verification

In order to ensure the applicability of the water surface extraction method, the Bang Lake was selected as the verification area. In the available months of Landsat 8, one of the construction results (20 November 2015) was selected and compared with the extraction results of the NDWI threshold method, MNDWI threshold method [38], and MNDWI_ISODATA. The method used in this study to determine the threshold was Otsu [21,22]; it is considered the best algorithm for threshold selection in image segmentation. It is simple to calculate and is not affected by image brightness and contrast, so it has been widely used in digital image processing. The reference value is the extraction result of the GF-1 image using the ISODATA, and the image date is adjacent. The comparison results are shown in Figure 3.
Using the confusion matrix method, the accuracy evaluation results obtained are shown in Table 2.
Compared to the other three methods in Table 2, the MNDWI_ISODATA method has a lower misclassification error and omission error, and has the highest overall accuracy and Kappa coefficient, which makes it suitable for the extraction of the sub-lake.
In order to evaluate the accuracy of the downscale method based on the MNDWI, taking Bang Lake as the verification area, the data construction results on 14 March 2014 were selected, and the GF-1 water surface extraction results of the nearby date were used for verification. The results were compared with those of MODIS and downscaled MODIS based on the NDWI (Downscaled_MODIS_N), and the extraction result is shown in Figure 4.
Compared to the water surface extraction results of the original MODIS images (Table 3), those of the MODIS’s downscaled base on the MNDWI showed a significant improvement in the misclassification error and omission error, especially the omission error. At the same time, the overall accuracy of the water surface extraction increased from 73% to 87% and the Kappa coefficient improved from 0.46 to 0.75; it also outperformed that of the downscaled MODIS based on the NDWI, and the results were accurate and reliable.

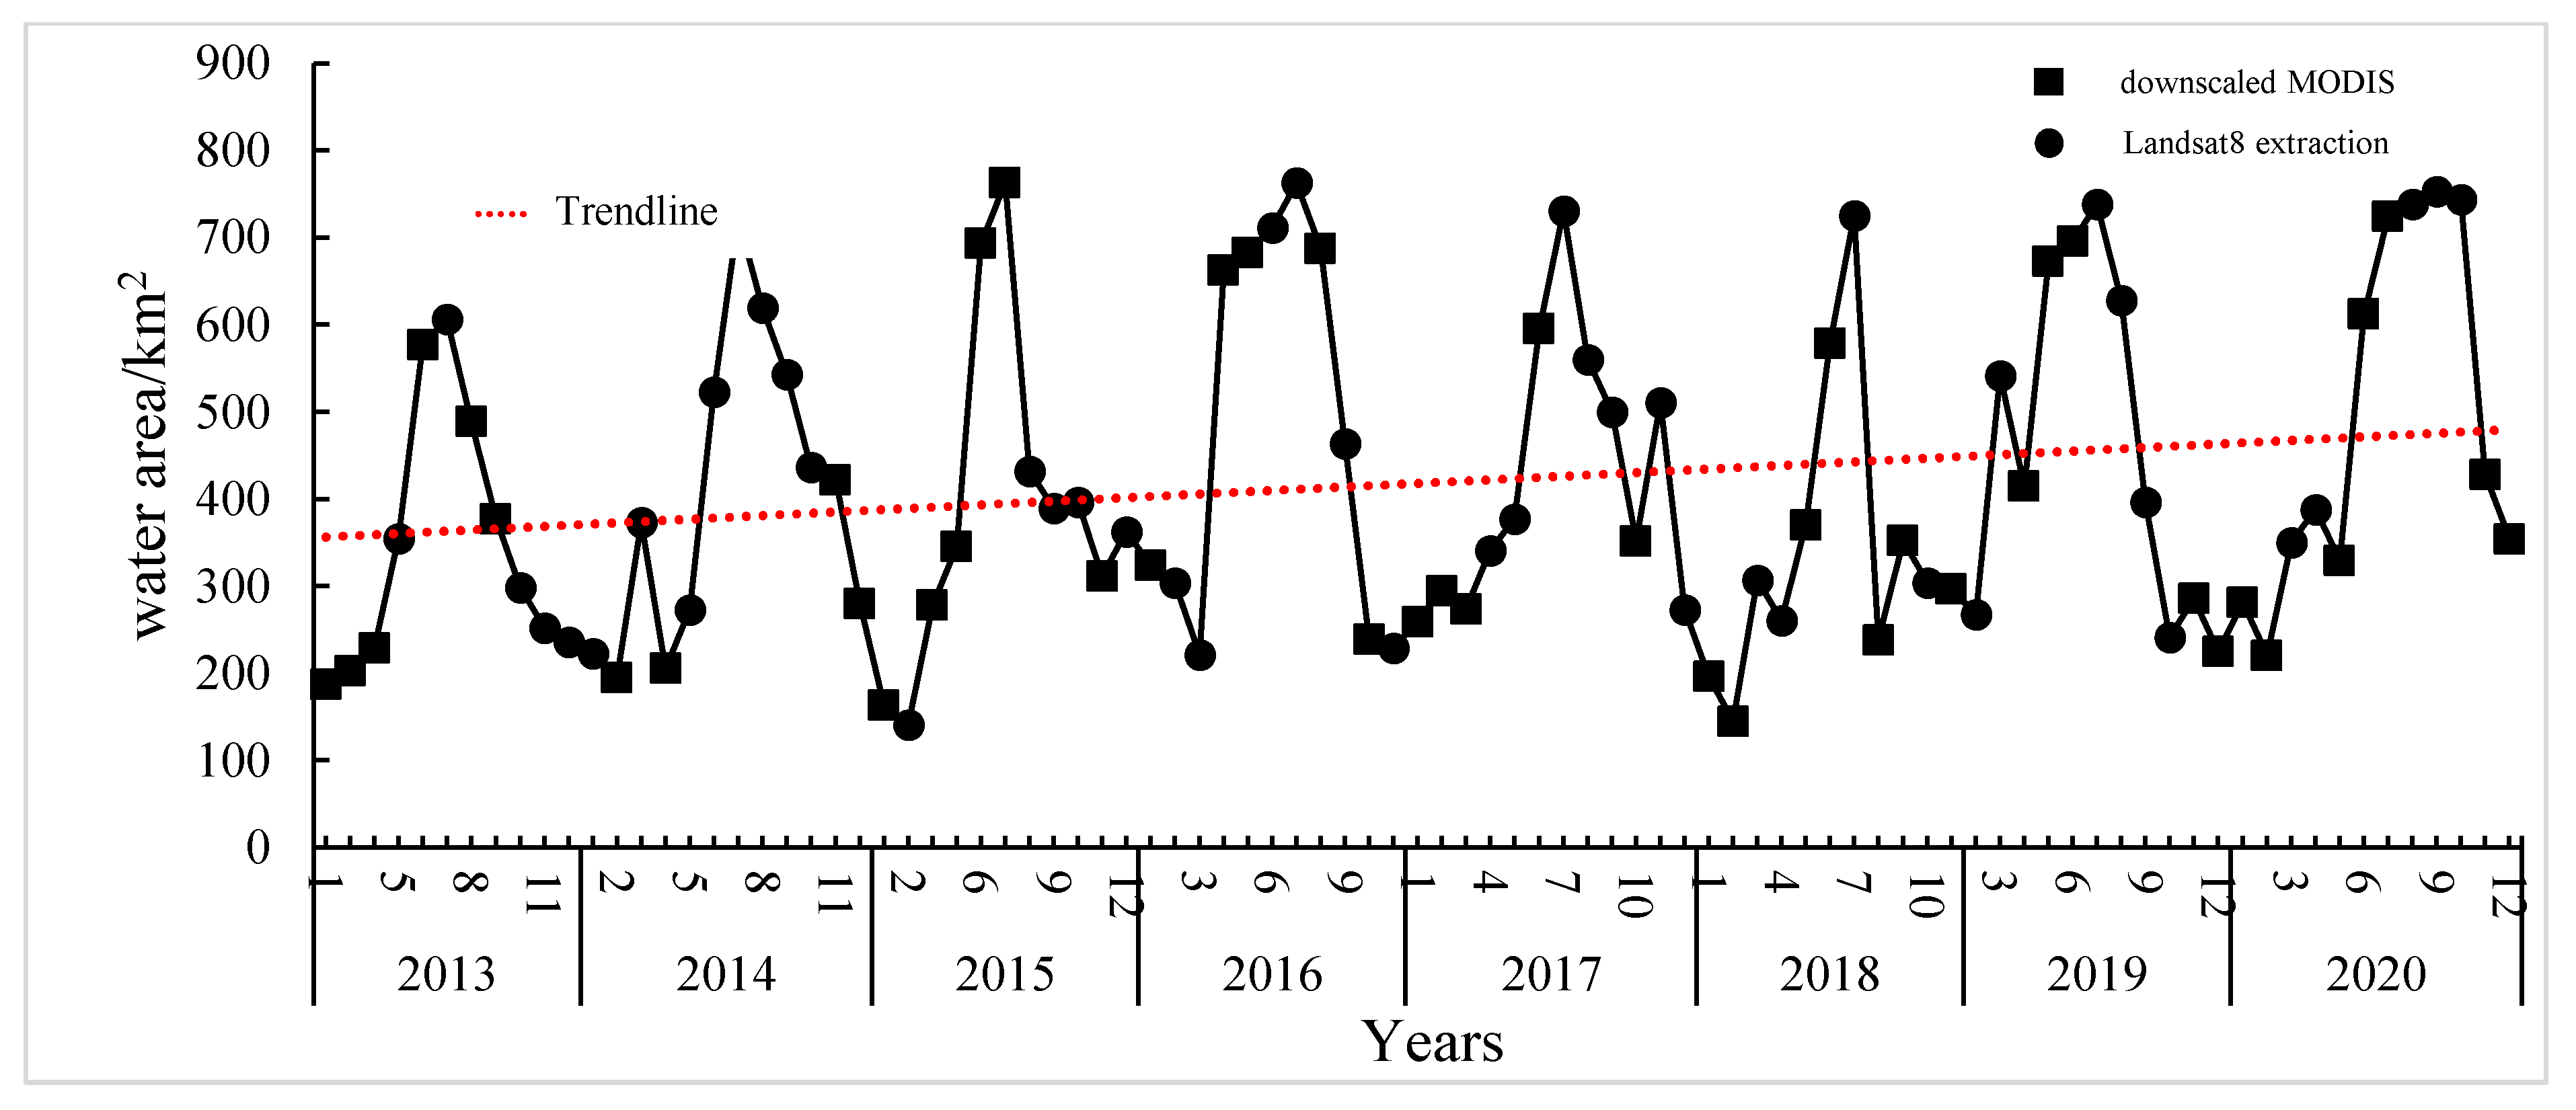
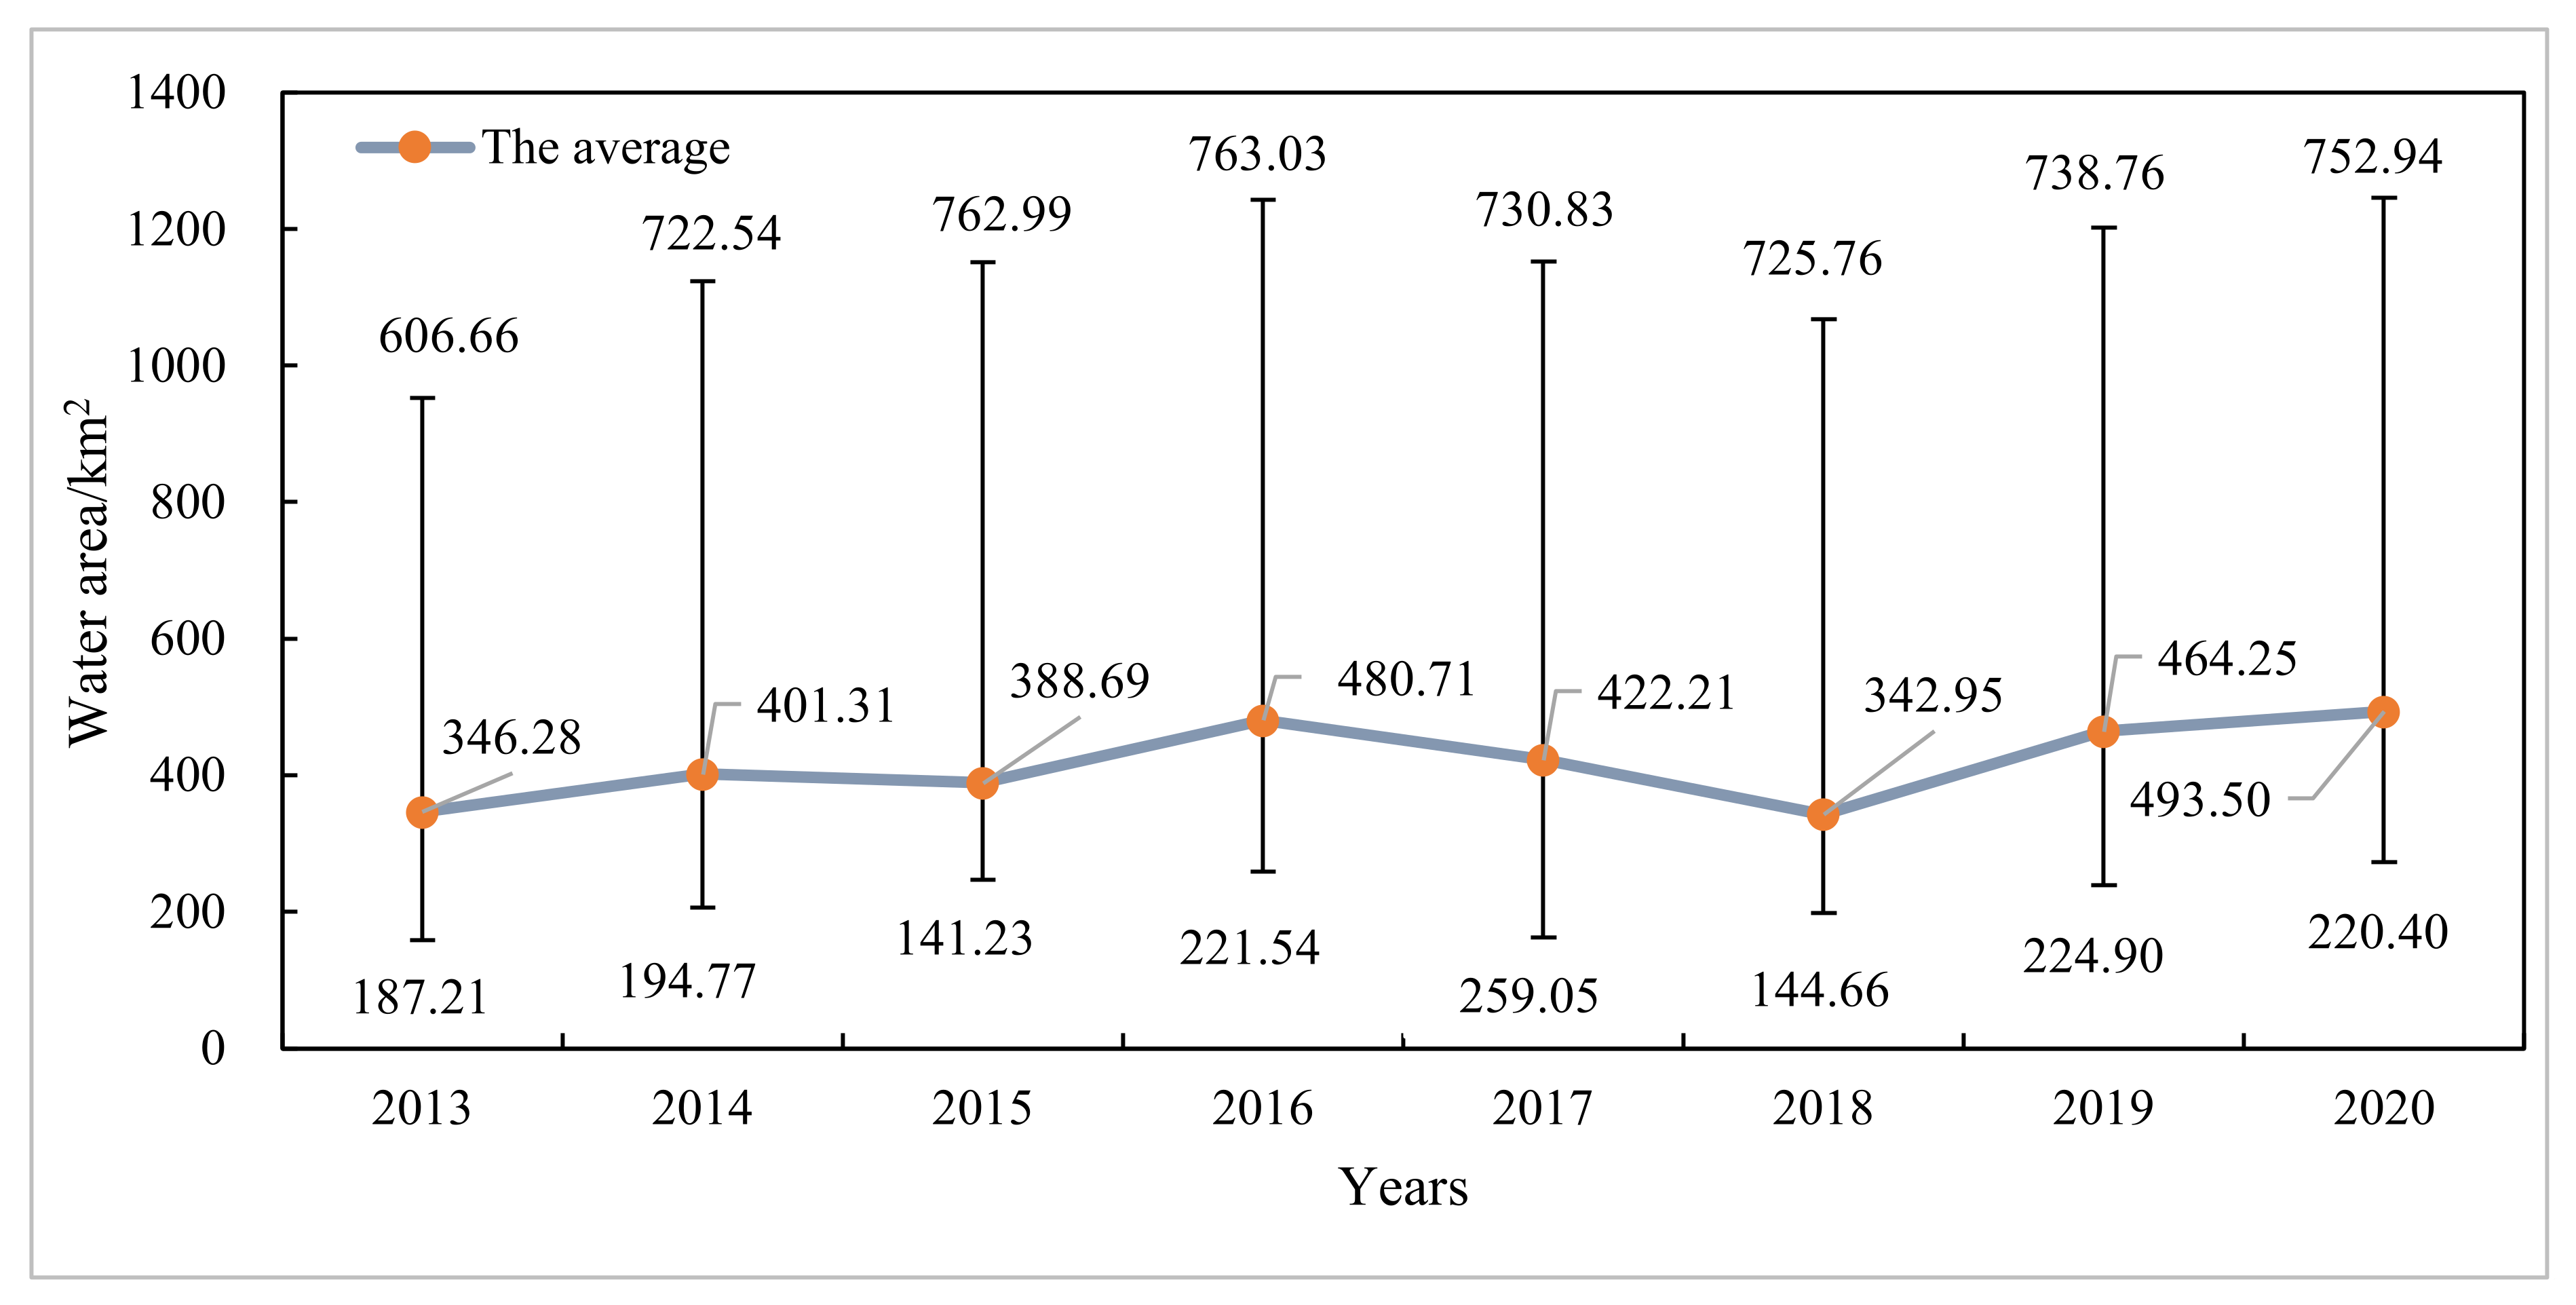
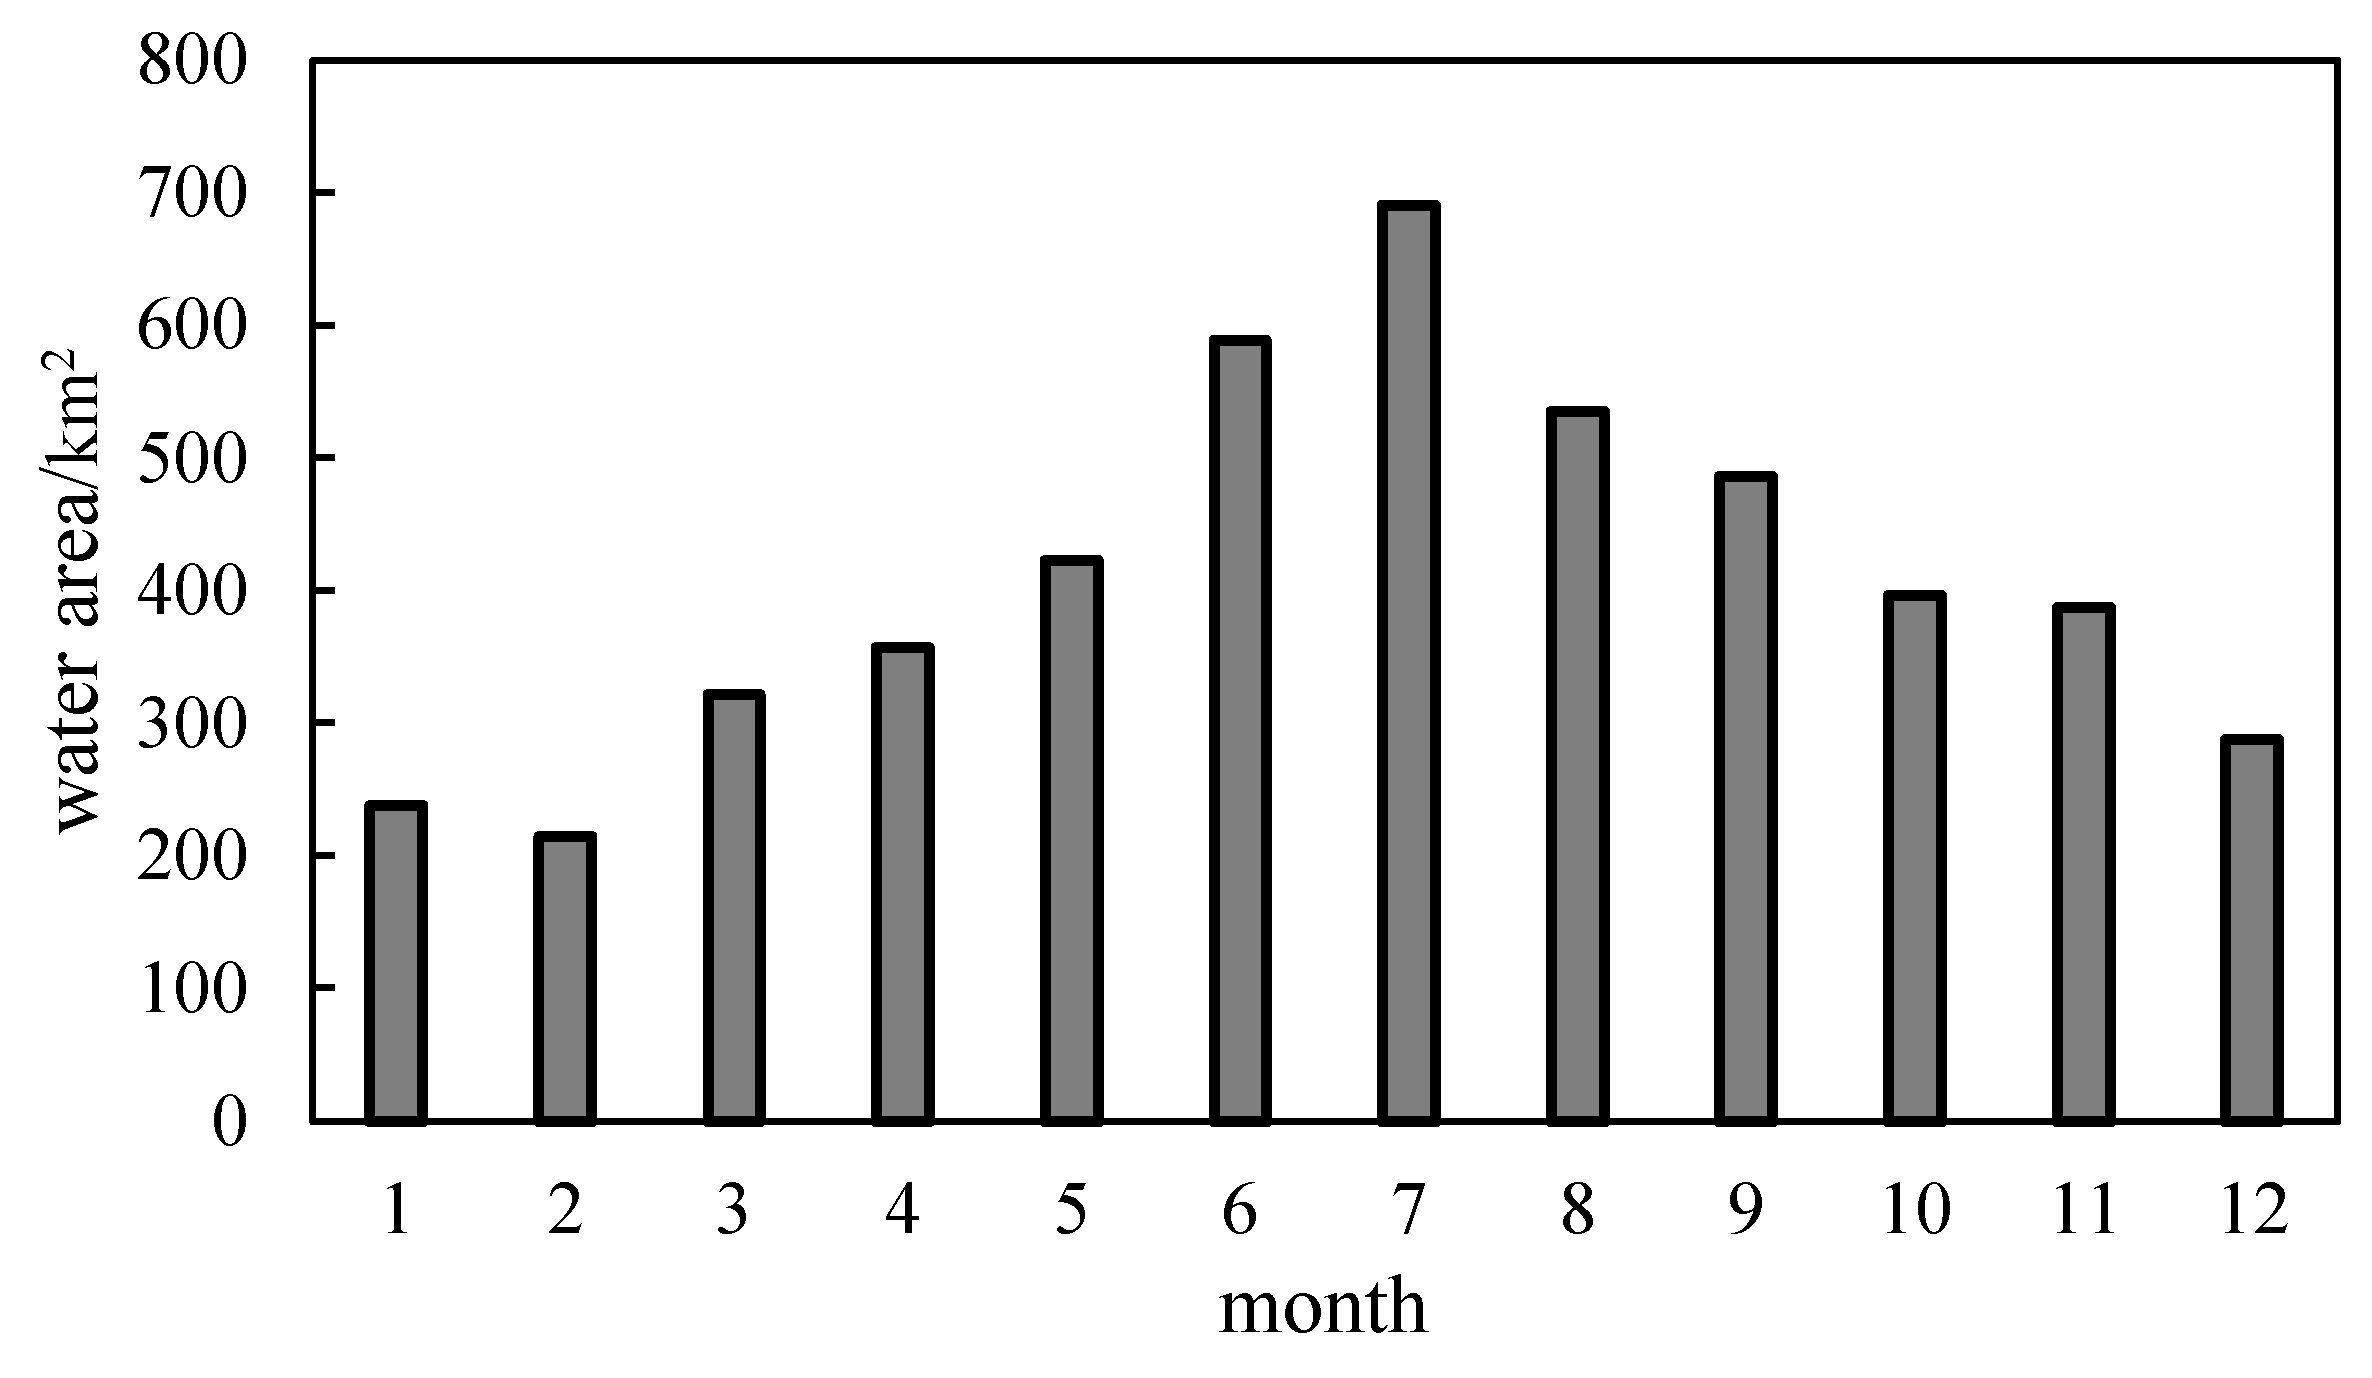
4.2. Characteristics of Temporal Variation in the Water Area of a Sub-Lake

Figure 5 shows water area information data from 2013 to 2020. The water surface area showed a slightly increasing trend, and the range of water surface area change was between 141.23 km2 and 763.03 km2. The maximum and minimum values were found in July 2016 and February 2015, with the maximum water area being about 5.4 times the minimum water area. Compared to other years, the trend in lake area in 2013 was relatively flat, with the water area in autumn (September to November) being lower than the value for the same period in all years, and the maximum water area for the year was the smallest of all years, so it is presumed that a severe drought may have occurred in that year. From April to August in 2016, the sub-lake remained in a high water state in that all water areas were more than 662 km2, which was a high level compared to that of other years, presumably due to extreme weather conditions or the back-up of the Yangtze River floods; the water area in August 2018 was the smallest of all Augusts, being only 238.15 km2, which was more unusual; in September and October 2020, the water surface area of the sub-lake was much higher compared to that of the same period in previous years, indicating that extreme precipitation events were likely to have occurred in that year.
Figure 6 shows the highest, lowest and average values of the lake’s water area from 2013 to 2020. The average annual water surface area of the lake from 2013 to 2020 showed a trend of expansion, with values varying from 346.28 km2 to 493.50 km2. Among them, the change in the maximum water area value is relatively flat and exhibits an upward trend overall, with the highest water area exceeding 600 km2 every year. Among the maximum values of the water area in different years, the area value in 2016 is the largest and the area in 2013 is the smallest, at 763.03 km2 and 606.66 km2, respectively, while the maximum is about 1.26 times the minimum. The minimum values also changed, becoming more flat, showing an overall increasing trend, with the minimum water area being below 259.05 km2 each year. Among the minimum values of water area in different years, 2017 had the maximum area of 259.05 km2, which is approximately 1.83 times the minimum area of 141.23 km2 in 2015.
Figure 7 shows the monthly average water area from 2013 to 2020, the smallest water area in January and February, and the largest water area in July. Among them, the average water area in spring (March–May) is 366.86 km2; in summer (June–August), it is 604.64 km2; in autumn (September–November), it is 423.10 km2; in winter (December–February), it is 246.44 km2, and the water area in summer is more than twice that in winter. The sub-lake water area shows a clear seasonal variation (following a single-peak distribution). In the first half of the year, due to the increase in precipitation in the basin, the monthly average water area increased slowly; it reached a peak in July (about 690 km2), and then declined rapidly, and by December, the water area was below 290 km2. Generally speaking, the relatively low value of water area occurs at the beginning, middle and end of the year. At this time, it generally reaches the minimum value of the year and the range of change is small.

4.3. Spatial Variation Characteristics of the Water Area of the Sub-Lake

The distribution of the multi-year surface inundation frequency of the sub-lakes shows that the sub-lakes in the southern region, such as Linchong Lake, are less inundated and remain exposed for longer than are those in the northern region, such as Dahuchi (Figure 8 and Figure 9). The frequency of water surface inundation in many sub-lakes varies dramatically within the year and shows a clear pattern of spatial variation and seasonal characteristics. The frequency of water surface inundation during the wet season (June to August) is four to five times higher than that during the dry season (December to February). During the wet season, both large and small sub-lakes are full of water and integrated with the main lake body; during the dry season, the sub-lakes exist independently of each other, except for some water in the center of the sub-lake, while the other parts are in a state of depletion. In general, the areas with a frequency of inundation of more than 80% are mainly artificial lakes (reservoirs), Dahuchi, Dacha Lake and other perennial water areas; those with a frequency of inundation in the range of 50% to 80% are mainly the edges of the sub-lakes, which are usually covered by water from June to August each year; the area with a frequency of inundation in the range of 20~50% is located between the edge of the lake and the center of the lake, which are exposed in February to May each year; the areas with a frequency of inundation of less than 20% are mainly the lake area outside the perennial water area, which is dry for seven months of the year.

5. Discussions

5.1. Natural Factors

In order to explore the influence of different natural factors on the water area in different seasons, according to the monthly average inundation frequency in Figure 9, Poyang Lake is divided into the wet season (June–August), dry season (December–February), wet–dry transition season (September–November) and dry–wet transition season (March–May). In the wet season and the transition season, the precipitation, temperature, wind speed and discharge are considered independent variables, and the area of the sub-lake is considered the dependent variable to establish a multiple regression model. In the dry season, considering that the sub-lakes are separated from the main lake body and there is no interaction between the water volume of the Yangtze River and that of the five rivers [38], the discharge has little impact on the water area and the discharge is not regarded as the influencing factor. Accordingly, precipitation, temperature and wind speed are used as independent variables, and the area of the dish-shaped lake is used as the dependent variable to establish a multiple regression model.
The regression model equation for the water area of the sub-lake in the wet season is as follows: water area = 0.10 × precipitation + 0.36 × temperature + 0.38 × wind speed + 0.60 × discharge. Obviously, precipitation has little impact on water area. Temperature and wind speed have a greater impact on changes in water area, and discharge has the greatest impact on the area of the sub-lake. This phenomenon is possibly related to the fact that the wet season is the main flood season of the Yangtze River and that the water intrusion of the Yangtze River to Poyang Lake has increased the discharge into the lake [40]. The regression model equation for the water area of the sub-lake in the dry season is as follows: water area = 0.07 × precipitation + 0.33 × temperature + 0.46 × wind speed. In the dry season, obviously, there is a greater impact of the temperature and wind speed on the water area. The regression model equation for the sub-lake water area in the wet–dry season is as follows: water area = 0.66 × precipitation + 0.79 × temperature − 0.24 × wind speed − 0.24 × discharge. Obviously, during the wet–dry transition season, precipitation and temperature are the main factors of changes of the sub-lake water area [41]. The regression model equation for the sub-lake water area in the dry–wet transition season is as follows: water area = 0.10 × precipitation + 0.19 × temperature − 0.007 × wind speed + 0.63 × discharge. The discharge plays an important role in the change in the water area and is the main source of the volume of the sub-lake during the wet–dry transition season.
From the equations of the four periods, it can be seen that the water area of the sub-lakes in the wet season and the dry–wet transition season is mainly affected by the discharge, in the dry season it is mainly affected by temperature and wind speed, and in the wet–dry transition season it is mainly affected by temperature and precipitation.

5.2. Human Activity Factors

The changes in the sub-lake water area are not only affected by natural factors, but also by human activities. Land use change is an important indicator that reflects human social and economic activities [42,43]. The classification of land use in 2010 and 2020 is shown in Figure 10. The dynamic degree of land use (K) of each land use type is calculated. Table 4 shows the results.
It can be seen from Table 4 that among the land use types in the area around the sub-lake, the area of cropland is the largest, followed by that of grassland and forest land. From 2010 to 2020, the area of urban and rural construction land and water area showed an increasing trend, and urban and rural construction land is increasing at the fastest rate, while the area of cropland, forest, grassland and bare land showed a decreasing trend, and the area of bare land is decreasing at the fastest rate, followed by the area of grassland. The land use transfer matrix from 2010 to 2020 was calculated (Table 5). It can be seen from Table 5 that the cropland area has decreased by 4.92 km2, the forest land area has decreased by 0.92 km2, the grassland area has decreased by 30.03 km2, the water area has increased by 41.67 km2, the construction land area has increased by 3.39 km2, and the bare land are has decreased by 9.16 km2. In the mutual conversion of various land types, the area of the water body converted into farmland is 3.38 km2, the area of grassland converted into a water body is 33.28 km2, the area of forest land converted into a water body is 6.27 km2, and the area of bare land converted into a water body is 6.18 km2. The relevant data show that due to human activities such as the reclamation of lakes and economic development, water consumption has increased dramatically, and Poyang Lake is facing a severe situation of water area shrinkage and ecological function degradation. On 20 October 1998, the State Council of China introduced the policy of “returning farmland to lakes” [44,45,46], which has increased the flood discharge and storage capacity of the middle and lower reaches of the Yangtze River. However, there is still the problem of an insufficient scale of returning farmland to lakes, and unable to solve the problem of insufficient flood storage capacity in the middle and lower reaches of the Yangtze River. Combined with the actual background and statistical data, it can be seen that the sub-lake water area has shown a growing trend in the past 10 years, which is consistent with the conclusions drawn in this paper; most of the growing water body is transformed from grassland, woodland and bare land. This is closely related to the local policy of “returning farmland to lakes”. The policy of “returning farmland to lakes” means that once the surrounding polders are submerged, they will no longer be used as polders, the original cropland and forest land area will be changed into a new lake body, and humans will no longer restore the polder.

5.3. The Potential Applicability of Our Method

Traditional time series water extraction is mostly based on a single remote sensing sensor, which leads to limitations to spatiotemporal continuity and extraction accuracy. In this paper, joint processing of multi-source remote sensing data is performed realize the complementary advantages of different remote sensing data. In the research of the extraction of time series water information in the sub-lakes, the Landsat 8 data at a high spatial resolution and the MODIS data at a high temporal resolution are combined to realize the fusion of different data at a high spatio-temporal resolution using the downscaling model of the MNDWI. Then the water area is extracted via the ISODATA method based on the MNDWI, and the time series water area of sub-lake are obtained accordingly.
Obviously, the reliability of our method for the construction of the time series water area lies in the applicability of the water remote sensing index (MNDWI in our study) and the performance of the extraction method (ISODATA in our study) [47,48,49,50]. Compared to the traditional water index, as the NDWI, the MNDWI can prevent confusion around the value of the area of buildings, soils and water [31]. At the same time, the MNDWI inherits the ratio operation, which can eliminate the influence of terrain differences to a greater extent. Accordingly, the MNDWI can solve the problem of easy shadow confusion around water information [51]. Thus, our method can be used for the extraction of water area in the mountainous region (e.g., Poyang Lake basin). However, when water turbidity is high or water is rich in aquatic vegetation, the MNDWI also has certain limitations [52]. Similarly, our method is possibly limited in terms of the extraction of water area for turbid or eutrophic water. Generally, our method should be revised for the different kinds of water quality through the selection of the appropriate water remote sensing index.
Compared to the threshold method (e.g., the Otsu method), the ISODATA method allows the obtention of more reliable performance when the distinction between the water body and the background features is not obvious [22,53]. In order to avoid misclassification error and omission error, when using the ISODATA method for classification, it is generally necessary to set the number of classifications to 3 to 4 times the final number of classifications [54]. However, for larger areas and more data, the ISODATA method may become very time-consuming [55]. Therefore, when our method is used to extract the water area at a larger spatial scale (e.g., the national or global scale), the efficiency of our method may be limited.
Finally, limited by the launch time of Landsat 8 satellite, the water area was extracted after 2013 [56]. To acquire the information from before 2013, other data from the previous satellite sensors (e.g., Landsat 5) can be introduced to our model in the future study [57]. Considering multi-source remote sensing satellites, our downscaling method can be used in higher-resolution remote sensing imagery (such as sentinel-2) for months when optical images are unavailable.

6. Conclusions

This paper takes Poyang Lake as the study area, and develops a time series construction method for water coverage information based on multi-source remote sensing images. Using Landsat 8 and MODIS images, water surface information at the month scale from 2013 to 2020 was obtained. On this basis, the spatio-temporal variation characteristics of the sub-lakes and their influencing factors were explored, and the conclusions are as follows:
(1) For the months when Landsat 8 is available, the MNDWI is calculated using Landsat data, and for the months when Landsat 8 data are unavailable due to cloud and rain, MODIS data are used to calculate the MNDWI at a high spatial resolution of 30 m using a downscaling model. Then, the ISODATA based on the MNDWI is used to extract the water surface of the sub-lake. Using that method, we could construct the time series dataset of water coverage in sub-lakes at a spatial resolution of 30 m at the month scale. The time series construction method of water coverage based on multi-source remote sensing images has a better performance than that of other methods. In the months when Landsat data are available, the overall accuracy and Kappa coefficient are 98% and 0.94, respectively. In the months when Landsat data are unavailable, the overall accuracy and Kappa coefficient are 87% and 0.75, respectively.
(2) From 2013 to 2020, the water area of the sub-lake in Poyang Lake showed an increasing trend between 2013 and 2020, with the maximum water area being more than 600 km2 and the minimum water area being less than 259 km2 each year. The sub-lake water area shows a clear seasonal variation (following a single-peak distribution). The frequency of water surface inundation changes dramatically during the year, and shows obvious spatial variation and seasonal characteristics. The frequency of water surface inundation in the wet season (June–August) is 4–5 times larger than that in the dry season (December–February). The pattern of spatial change during the dry–wet transition season is one in which the perennial water area gradually expands to the surrounding area, and during the wet–dry transition season, the surrounding area gradually shrinks from the perennial water area. During the wet season, both large and small sub-lakes are full of water and integrated with the main lake body. During the dry season, the sub-lakes exist independently of each other. The areas with a frequency of inundation of more than 80% are mainly artificial lakes (reservoirs), including Dahuchi, Dacha Lake and other perennial water areas. The areas with a frequency of inundation in the range of 50% to 80% are mainly the edges of the sub-lakes, which are usually covered by water from June to August each year. The area with a frequency of inundation in the range of 20~50% is located between the edge of the lake and the center of the lake, which are exposed in February to May each year; the areas with a frequency of inundation of less than 20% are mainly the lake area outside the perennial water area, which is dry for seven months of the year.
(3) In the analysis of the factors influencing water area changes, among the natural factors, the water area of the sub-lakes in the wet season and the dry–wet transition season is mainly influenced by the discharge, in the dry season it is mainly affected by temperature and wind speed, and in the wet–dry transition season it is mainly affected by temperature and precipitation. In terms of human activities, the policy of “returning farmland to lakes” is the main factor contributing to the increase in the sub-lake water area.

Author Contributions

Conceptualization, X.P.; methodology, X.P., T.L. and G.W.; software, C.W.; formal analysis, T.L. and G.W.; validation, W.X. and T.L.; investigation, C.W., Y.W., Q.W. and Z.X.; data curation, W.X., T.L. and H.S.; data analysis, W.X. and T.L.; writing—original draft preparation, W.X., T.L. and C.W.; writing—review and editing, X.P.; visualization, W.X. and T.L.; supervision, X.P. and G.W.; funding acquisition, X.P. and Y.Y. All authors have read and agreed to the published version of the manuscript.

Funding

This research was funded by the National Nature Science Foundation of China: 41701487; National Nature Science Foundation of China: 42230112; National Nature Science Foundation of China: 41871354; National Nature Science Foundation of China: 42071346; the State Scholarship Fund of China.

Data Availability Statement

The data used in this study were obtained from the following platforms: the USGS for Landsat data (https://earthexplorer.usgs.gov/, accessed on 13 July 2021), the LAADS of NASA for MODIS products (http://ladsweb.nascom.nasa.gov, accessed on 29 December 2021), the High Resolution Earth Observation System in China for GF-1 data (https://scene.thxpace.com/image/#/search, accessed on 23 September 2021), GlobeLand 30 for land use data (www.globallandcover.com/, accessed on 27 March 2022) and the Hydrology Bureau of Jiangxi Province for ground observations (http://www.jxssw.gov.cn/, accessed on 23 December 2022).

Acknowledgments

We would like to thank the USGS for providing Landsat data (https://earthexplorer.usgs.gov/, accessed on 13 July 2021), the LAADS of NASA for providing MODIS products (http://ladsweb.nascom.nasa.gov, accessed on 29 December 2021), the High Resolution Earth Observation System in China for providing GF-1 data (https://scene.thxpace.com/image/#/search, accessed on 23 September 2021), GlobeLand 30 for providing land use data (www.globallandcover.com/, accessed on 27 March 2022) and the Hydrology Bureau of Jiangxi Province for providing Ground observations (http://www.jxssw.gov.cn/, accessed on 23 December 2022). We also thank the anonymous referees for their insightful comments and suggestions.

Conflicts of Interest

Authors C.W., Y.W. and Q.W. are employed by Shandong Electric Power Engineering Consulting Institute Corp. LTD. The remaining authors declare that the research was conducted in the absence of any commercial or financial relationships that could be construed as potential conflicts of interest.

References

  1. Liu, H.; Zheng, L.; Jiang, L.; Liao, M. Forty-years water body change of Poyang Lake and its ecological impact based on Landsat and HJ-1 A/B observations. J. Hydrol. 2020, 589, 125161. [Google Scholar] [CrossRef]
  2. Wu, G.; Liu, Y. Capturing variations in inundation with satellite remote sensing in a morphologically complex, large lake. J. Hydrol. 2015, 523, 14–23. [Google Scholar] [CrossRef]
  3. Shankman, D.; Liang, Q. Landscape changes and increasing flood frequency in China’s Poyang Lake region. Prof. Geogr. 2003, 55, 434–445. [Google Scholar] [CrossRef]
  4. Xia, S.; Yu, X.; Liu, Y.; Jia, Y.F.; Zhang, G.S. Current issues and future trends of Poyang Lake wetland. Resour. Environ. Yangtze Basin 2016, 25, 1103–1111. [Google Scholar]
  5. Sun, Y.; Huang, S.; Li, J.R.; Li, X.; Ma, J.; Wang, H.; Lei, T. Monitoring seasonal changes in the water surface areas of Poyang Lake using Cosmo-Skymed time series data in PR China. In Proceedings of the 2016 IEEE International Geoscience and Remote Sensing Symposium (IGARSS), Beijing, China, 10–15 July 2016. [Google Scholar]
  6. Li, H. Changes of Water Level in Main Lake Area of Poyang Lake and in Dish-shaped Sub-lake and Their lmpacts on Water Quality. Resour. Environ. Yangtze Basin 2018, 27, 1298–1306. (In Chinese) [Google Scholar]
  7. Tan, Z.; Melack, J.; Li, Y.; Liu, X.; Chen, B.; Zhang, Q. Estimation of water volume in ungauged, dynamic floodplain lakes. Environ. Res. Lett. 2020, 15, 054021. [Google Scholar] [CrossRef]
  8. Liu, X.; Tan, Z.; Fan, H. Seasonal distribution of sub-lakes on tail-streams of Ganjiang River. Yangtze River 2021, 52, 66–72. (In Chinese) [Google Scholar]
  9. Hu, Z.; Zhang, Z.; Liu, Y.; Ji, W.; Ge, G. The function and significance of the Shallow-Lakes in the Poyang Lake wetland ecosystem. Jiangxi Hydraul. Sci. Technol. 2015, 41, 317–323. [Google Scholar]
  10. Li, Y.; Yao, J.; Tan, Z.; Zhang, Q. Interactions between Typical Sub-lakes and Groundwater in Floodplains of Poyang Lake. J. China Hydrol. 2019, 39, 1–7. (In Chinese) [Google Scholar]
  11. Wu, G.; Liu, Y. Seasonal Water Exchanges between China’s Poyang Lake and Its Saucer Shaped Depressions on River Deltas. Water 2017, 11, 884. [Google Scholar] [CrossRef]
  12. Liu, H.; Yuan, H.; Wang, S.; Zheng, L.; Liao, M. Spatiotemporal Dynamics of Water Body Changes and Their Influencing Factors in the Seasonal Lakes of the Poyang Lake Region. Water 2021, 13, 1539. [Google Scholar] [CrossRef]
  13. Wang, H.; Chen, W.; He, L.; Li, H. Responses of aquatic vegetation coverage to interannual variations of water level in different hydrologically connected sub-lakes of Poyang Lake, China. Ying Yong Sheng Tai Xue Bao = J. Appl. Ecol. 2022, 33, 191–200. [Google Scholar]
  14. Birkett, C.M. Surface water dynamics in the Amazon Basin: Application of satellite radar altimetry. J. Geophys. Res. Atmos. 2002, 107, LBA-26-1–LBA-26-21. [Google Scholar] [CrossRef]
  15. Rundquist, D.; Lawson, M.; Queen, L.; Cerveny, R. The Relationship Between the Timing of summer-Season Rainfall Events and Lake-Surface Area. Water Resour. Bull. 1987, 23, 493–508. [Google Scholar] [CrossRef]
  16. Sherjah, P.Y.; Sajikumar, N. Delineation of water body from Sentinel 2 MSI imagery—A comparative study. IOP Conf. Ser. Mater. Sci. Eng. 2021, 1114, 012029. [Google Scholar] [CrossRef]
  17. Imhoff, M.L.; Vermillion, C.; Story, M.H. Monsoon flood boundary delineation and damage assessment using space borne imaging radar and Landsat data. Photogrammertic Eng. Remote Sens. 1987, 4, 405–413. [Google Scholar]
  18. Dhothi, M.K.; Saghri, J.A.; Ahmad, I.; Ul-Mustafa, R. DISODATA: A Distributed Algorithm for Unsupervised Clasification of Remotely Sensed Data on Network of Workstations. J. Parallel Distrib. Comput. 1999, 59, 280–301. [Google Scholar] [CrossRef]
  19. Ulug, R.; Karsloglu, M.O. A new data-adaptive network design methodology based on the k-means clustering and modified ISODATA algorithm for regional gravity field modeling via spherical radial basis functions. J. Geod. 2022, 96, 91. [Google Scholar] [CrossRef]
  20. Verma, A.K.; Garg, P.K.; Hari Prasad, K.S. Sugarcane crop identification from LISS IV data using ISODATA, MLC, and indices based decision tree approach. Arab. J. Geosci. 2017, 10, 16. [Google Scholar] [CrossRef]
  21. Buma, W.G.; Lee, S.; Seo, J.Y. Recent Surface Water Extent of Lake Chad from Multispectral Sensors and GRACE. Sensors 2018, 18, 2082. [Google Scholar] [CrossRef]
  22. Otsu, N. A threshold selection mehod from grey level histogram. IEEE Trans. Syst. Man Cybern. 1979, 9, 62–66. [Google Scholar] [CrossRef]
  23. Leo, B. Random Forests. Mach. Learn. 2001, 45, 5–32. [Google Scholar]
  24. Canovas-Garcia, F.; Alonso-Sarria, F.; Gomariz-Castillo, F.; Oñate-Valdivieso, F. Modification of the random forest algorithm to avoid statistical dependence problems when classifying remote sensing imagery. Comput. Geosci. 2017, 103, 1–11. [Google Scholar] [CrossRef]
  25. Phan, T.N.; Kuch, V.; Lehnert, L.W. Land Cover Classification using Google Earth Engine and Random Forest Classifier—The Role of Image Composition. Remote Sens. 2020, 12, 2411. [Google Scholar] [CrossRef]
  26. Wu, G.; Liu, Y. Downscaling Surface Water Inundation from Coarse Data to Fine-Scale Resolution: Methodology and Accuracy Assessment. Remote Sens. 2015, 7, 15989–16003. [Google Scholar] [CrossRef]
  27. Zhou, W.; Wan, J.; Jiang, J. Effects of Water Level Changes in Poyang Lake on Its Ecosystem; Science Press: Beijing, China, 2011. [Google Scholar]
  28. Wu, G.; Liu, Y. Satellite-based detection of water surface variation in China’s largest freshwater lake in response to hydro-climatic drought. Int. J. Remote Sens. 2014, 35, 4544–4558. [Google Scholar] [CrossRef]
  29. Brovelli, M.A.; Molinari, M.E.; Hussein, E.; Chen, J.; Li, R. The First Comprehensive Accuracy Assessment of GlobeLand30 at a National Level: Methodology and Results. Remote Sens. 2015, 7, 4191–4212. [Google Scholar] [CrossRef]
  30. Shafizadeh-Moghadam, H.; Minaei, M.; Feng, Y.; Pontius, R.G. GlobeLand30 maps show four times larger gross than net land change from 2000 to 2010 in Asia. Int. J. Appl. Earth Obs. Geoinf. 2019, 78, 240–248. [Google Scholar] [CrossRef]
  31. Liu, H.; Hu, H.; Liu, X.; Jiang, H.; Liu, W.; Yin, X. A Comparison of Different Water Indices and Band Downscaling Methods for Water Bodies Mapping from Sentinel-2 Imagery at 10-M Resolution. Water 2022, 14, 2696. [Google Scholar] [CrossRef]
  32. Nimon, K.F.; Oswald, F.L. Understanding the Results of Multiple Linear Regression: Beyond Standardized Regression Coefficients. Organ. Res. Methods 2013, 16, 650–674. [Google Scholar] [CrossRef]
  33. Panda, S.K.; Nag, S.; Jana, P.K. A smoothing based task scheduling algorithm for heterogeneous multi-cloud environment. In Proceedings of the 2014 International Conference on Parallel, Distributed and Grid Computing, Solan, India, 11–13 December 2014; pp. 62–67. [Google Scholar]
  34. Panda, S.K.; Jana, P.K. Efficient task scheduling algorithms for heterogeneous multi-cloud environment. J. Supercomput. 2015, 71, 1505–1533. [Google Scholar] [CrossRef]
  35. Panda, S.K.; Jana, P.K. A multi-objective task scheduling algorithm for heterogeneous multi-cloud environment. In Proceedings of the 2015 International Conference on Electronic Design, Computer Networks & Automated Verification (EDCAV), Shillong, India, 29–30 January 2015; pp. 82–87. [Google Scholar]
  36. Patro, S.G.K.; Sahu, K.K. Normalization: A preprocessing stage. arXiv 2015, arXiv:1503.06462. [Google Scholar] [CrossRef]
  37. Fang, L.; Dong, B.; Wang, C.; Yang, F.; Cui, Y.; Xu, W.; Peng, L.; Wang, Y.; Li, H. Research on the influence of land use change to habitat of cranes in Shengjin Lake wetland. Environ. Sci. Pollut. Res. 2020, 27, 7515–7525. [Google Scholar] [CrossRef]
  38. Xu, N.; Peng, G. Significant Coastline Changes in China during 1991–2015 tracked by Landsat data. Sci. Bull. 2018, 63, 883–886. [Google Scholar] [CrossRef]
  39. Maxwell, A.E.; Warner, T.A. Thematic Classification Accuracy Assessment with Inherently Uncertain Boundaries: An Argument for Center-Weighted Accuracy Assessment Metrics. Remote Sens. 2020, 12, 1905. [Google Scholar] [CrossRef]
  40. Tang, H.; Yuan, S.; Xiao, Y.; Chen, J. Fluvial processes of Poyang Lake and estuaries of “Five rivers”. Sci. Sin. (Technol.) 2017, 47, 805–813. (In Chinese) [Google Scholar]
  41. Bing, J. The Evolution Trend and Regulation Effect of the Yangtze River- Poyang Lake Relationship; Wuhan University: Wuhan, China, 2018. (In Chinese) [Google Scholar]
  42. Mariye, M.; Maryo, M.; Li, J. The Study of Land Use and Land Cover (LULC) Dynamics and the Perception of Local People in Aykoleba, Northern Ethiopia. J. Indian Soc. Remote Sens. 2022, 50, 775–789. [Google Scholar] [CrossRef]
  43. Sarif, M.O.; Gupta, R.D. Spatiotemporal mapping of Land Use/Land Cover dynamics using Remote Sensing and GIS approach: A case study of Prayagraj City, India (1988–2018). Environ. Dev. Sustain. 2022, 24, 888–920. [Google Scholar] [CrossRef]
  44. Wu, F.; Deng, X.; Lu, H.; Peng, S.; Zou, J. Supervision and Analysis of Water Quality in Dongting Lake Recovery Area. J. Soil Water Conserv. 2003, 17, 134–136. (In Chinese) [Google Scholar]
  45. Jiang, L.; Yu, X.; Zhao, H.; Zhou, Y. China’s wetlands restoration around Poyang Lake, middle Yangtze: Evidences from landsat TM/ETM images. In Proceedings of the IEEE International Geoscience & Remote Sensing Symposium, Seoul, Republic of Korea, 29 July 2005. [Google Scholar]
  46. Zhou, F.; Zhao, A. Study on Re-use of Resources in the Region of Farmland-returning to Lake in Poyang Lake. J. Shangrao Norm. Coll. 2005, 25, 100–104. [Google Scholar]
  47. Fluet-Chouinard, E.; Lehner, B.; Rebelo, L.M.; Papa, F.; Hamilton, S.K. Development of a global inundation map at high spatial resolution from topographic downscaling of coarse-scale remote sensing data. Remote Sens. Environ. 2015, 158, 348–361. [Google Scholar] [CrossRef]
  48. Galantowicz, J. High-resolution flood mapping from low-resolution passive microwave data. In Proceedings of the IEEE International Geoscience and Remote Sensing Symposium, Toronto, ON, Canada, 24–28 June 2002. [Google Scholar]
  49. Aires, F.; Papa, F.; Prigent, C. A long-term, high-resolution wetland dataset over the amazon basin, downscaled from a multiwavelength retrieval using SAR data. J. Hydrometeorol. 2013, 14, 594–607. [Google Scholar] [CrossRef]
  50. Wang, D. Remote Sensing Analysis of Water Volume Changes in Qinghai Lake in the Past 30 Years Based on GEE; Northwest University: Kirkland, WA, USA, 2020. [Google Scholar]
  51. Yu, J.K.; Huang, Y.S.; Feng, X.Z. Study on water Bodies Extraction and Classification from SPOT Image. J. Remote Sens. 2001, 5, 214–219. [Google Scholar]
  52. Rad, A.M.; Kreitler, J.; Sadegh, M. Augmented Normalized Difference Water Index for improved surface water monitoring. Environ. Model. Softw. Environ. Data News 2021, 140, 105030. [Google Scholar] [CrossRef]
  53. Ball, G.H.; Hall, D.J. ISODATA, A Novel Method of Data Analysis and Pattern Classification; Stanford Research Institute: Menlo Park, CA, USA, April 1965. [Google Scholar]
  54. El-Zaart, A. Images thresholding using ISODATA technique with gamma distribution. Pattern Recognit. Image Anal. 2010, 20, 29–41. [Google Scholar] [CrossRef]
  55. Xia, H. An improved parallel remote sensing ISODATA algorithm. Sci. Surv. Mapp. 2016, 41, 6–13. [Google Scholar]
  56. Naik, B.C.; Anuradha, B. Time Series Analysis of Water Feature Extraction using Water Index Techniques from Landsat Remote Sensing Images. In Proceedings of the 2019 Third International conference on I-SMAC (IoT in Social, Mobile, Analytics and Cloud) (I-SMAC), Palladam, India, 12–14 December 2019. [Google Scholar]
  57. Pickens, A.H.; Hansen, M.C.; Hancher, M.; Stehman, S.V.; Tyukavina, A.; Potapov, P.; Marroquin, B.; Sherani, Z. Mapping and sampling to characterize global inland water dynamics from 1999 to 2018 with full Landsat time-series. Remote Sens. Environ. 2020, 243, 111792. [Google Scholar] [CrossRef]
Figure 1. Study area of Poyang Lake and a diagram of the sub-lake.
Remotesensing 15 02788 g001
Figure 2. Flowchart of downscaling and water extraction.
Remotesensing 15 02788 g002
Figure 3. Extraction results from the water surface of Bang Lake.
Remotesensing 15 02788 g003
Figure 4. Comparison of the results of water area downscaling extraction for Bang Lake.
Remotesensing 15 02788 g004
Figure 5. Folded graph of the change in water area of the sub-lake from 2013 to 2020.
Remotesensing 15 02788 g005
Figure 6. Interannual variation in the water area of the sub-lake from 2013 to 2020.
Remotesensing 15 02788 g006
Figure 7. Monthly average water area of the sub-lake from 2013 to 2020.
Remotesensing 15 02788 g007
Figure 8. Multi-year average inundation frequency for the sub-lakes (2013–2020).
Remotesensing 15 02788 g008
Figure 9. Spatial variation in monthly mean inundation frequency of the sub-lakes.
Remotesensing 15 02788 g009
Figure 10. Land use classification in 2010 and 2020.
Remotesensing 15 02788 g010
Table 1. Study data.
Data NameParameterSpatiotemporal ResolutionData Use
Remote sensing dataLandsat 8b3: 0.53–0.59 μm16 d, 30 mModeling, construction
b5: 0.85–0.88 μm
b6: 1.57–1.65 μm
MODISb4: 0.545–0.565 μm1 d, 500 mModeling, construction
b6: 1.628–1.652 μm
GF-1panchromatic: 0.45–0.90 μm4 d, 2 m (panchromatic);Validation
b2: 0.52–0.59 μm4 d, 8 m (Multispectral)
b4: 0.77–0.89 μm
GlobeLand30Land use data1 a, 30 mAnalysis of influencing factors
Table 2. Evaluation of the accuracy of the water body extraction results.
Sub-LakeExtraction MethodsME/%OE/%OA/%Kappa
Coefficient
Bang LakeNDWI threshold method2.031.2296.750.8981
MNDWI threshold method3.66096.340.8912
NDWI_ISODATA0.812.0397.150.9072
MNDWI_ISODATA1.630.4197.970.9368
ME is the misclassification error, OE is the omission error and OA is the overall classification accuracy [39].
Table 3. Precision evaluation of MODIS and downscaled MODIS water surface extraction results.
Data TypeME/%OE/%OA/%Kappa Coefficient
MODIS10.8116.2272.970.4599
Downscaled_MODIS7.215.1187.390.7476
Downscaled_MODIS_N12.619.0178.380.5673
Table 4. Statistics of land use types and their changes from 2010 to 2020.
Year2010 (km2)2020 (km2)Dynamic Degree of Land Use (K) (%)
Land Use Types
cropland141.81136.89−0.35
forest19.5018.58−0.47
grassland54.8724.807−5.48
waterbody1127.9171169.5870.37
urban and rural construction land3.1476.53710.787
bare land9.340.19−9.80
Table 5. Transfer matrix of land use, 2010–2020 (in km2).
2010CroplandForestGrasslandWaterbodyUrban and Rural Construction LandBare LandTotal
2020
cropland121.901.301.0112.480.200.01136.90
forest7.068.711.940.850.020.0118.59
grassland1.222.169.828.590.032.9024.72
waterbody9.107.1241.871105.020.286.191169.58
urban and rural construction land2.510.220.220.972.610.006.53
bare land0.020.000.010.010.000.150.19
total141.8119.5154.871127.923.149.261356.51
Disclaimer/Publisher’s Note: The statements, opinions and data contained in all publications are solely those of the individual author(s) and contributor(s) and not of MDPI and/or the editor(s). MDPI and/or the editor(s) disclaim responsibility for any injury to people or property resulting from any ideas, methods, instructions or products referred to in the content.

