Article

R-MFNet: Analysis of Urban Carbon Stock Change against the Background of Land-Use Change Based on a Residual Multi-Module Fusion Network

1
School of Computer Science and Technology, Henan Polytechnic University, Jiaozuo 454000, China
2
School of Surveying and Land Information Engineering, Henan Polytechnic University, Jiaozuo 454000, China
3
Center for Environmental Remote Sensing, Chiba University, Chiba 2638522, Japan
4
Chinese Academy of Natural Resources Economics, Beijing 101149, China
5
Faculty of Architecture, The University of Hong Kong, Hong Kong 999077, China
*
Author to whom correspondence should be addressed.
Remote Sens. 2023, 15(11), 2823; https://doi.org/10.3390/rs15112823
Submission received: 13 April 2023 / Revised: 26 May 2023 / Accepted: 26 May 2023 / Published: 29 May 2023
(This article belongs to the Special Issue Convolutional Neural Network Applications in Remote Sensing II)

Abstract

:
Regional land-use change is the leading cause of ecosystem carbon stock change; it is essential to investigate the response of LUCC to carbon stock to achieve the strategic goal of “double carbon” in a region. This paper proposes a residual network algorithm, the Residual Multi-module Fusion Network (R-MFNet), to address the problems of blurred feature boundary information, low classification accuracy, and high noise, which are often encountered in traditional classification methods. The network algorithm uses an R-ASPP module to expand the receptive field of the feature map to extract sufficient and multi-scale target features; it uses the attention mechanism to assign weights to the multi-scale information of each channel and space. It can fully preserve the remote sensing image features extracted by the convolutional layer through the residual connection. Using this classification network method, the classification of three Landsat-TM/OLI images of Zhengzhou City (the capital of Henan Province) from 2001 to 2020 was realized (the years that the three images were taken are 2001, 2009, and 2020). Compared with SVM, 2D-CNN, and deep residual networks (ResNet), the overall accuracy of the test dataset is increased by 10.07%, 3.96%, and 1.33%, respectively. The classification achieved using this method is closer to the real land surface, and its accuracy is higher than that of the finished product data obtained using the traditional classification method, providing high-precision land-use classification data for the subsequent carbon storage estimation research. Based on the land-use classification data and the carbon density data corrected by meteorological data (temperature and precipitation data), the InVEST model is used to analyze the land-use change and its impact on carbon storage in the region. The results showed that, from 2001 to 2020, the carbon stock in the study area showed a downward trend, with a total decrease of 1.48 × 10 7 t. Over the course of this 19-year period, the farmland area in Zhengzhou decreased by 1101.72 km 2 , and the built land area increased sharply by 936.16 km 2 . The area of land transfer accounted for 29.26% of the total area of Zhengzhou City from 2001 to 2009, and 31.20% from 2009 to 2020. The conversion of farmland to built land is the primary type of land transfer and the most important reason for decreasing carbon stock. The research results can provide support, in the form of scientific data, for land-use management decisions and carbon storage function protections in Zhengzhou and other cities around the world undergoing rapid urbanization.

Graphical Abstract

1. Introduction

Global climate change is an increasingly severe issue, posing a significant challenge to human survival and sustainable development [1]. Ecosystems can help mitigate the greenhouse effect and regulate the global climate by continuously absorbing carbon dioxide through the photosynthesis of surface plants [2,3]. The core issue of climate regulation and low-carbon development is land use. Changes in land-use/cover play a vital role in maintaining ecosystem carbon stock services by changing ecosystem structures and functions, both of which directly affect vegetation carbon stocks through changes in the soil environment and the return of plant residues to the soil [4,5], becoming essential elements of current climate change research [6,7,8]. Since 2009, China has been the world’s largest carbon emitter, and currently contributes about 27% of global carbon emissions; it therefore exerts a critical influence in maintaining the global carbon emission balance and carbon sequestration balance [9]. In March 2021, the country introduced the carbon peak and carbon neutrality program as part of the Fourteenth Five-Year Plan. Therefore, under the goal of “double carbon”, it is essential to conduct regional carbon stock studies to ensure a carbon balance and to formulate carbon reduction policies at the national and regional levels.
Zhengzhou City is located in the southern part of the Yellow River Basin, where the main vegetation types are farmland, woodland, and grassland. The Zhengzhou Yellow River Wetland National Nature Reserve in Henan Province provides a habitat for tens of thousands of species of plants and animals. The surface cover in the region is dominated by crop cultivation, with farmland accounting for about 70% of the total area. The ecosystem is relatively homogeneous, and human activities have a significant impact on the regional ecological environment. For the all-round development of Zhengzhou, the Fourteenth Five-Year Plan for the Ecological Environmental Protection of Zhengzhou City (http://www.zhengzhou.gov.cn/, accessed on 12 April 2023) [10] was formulated; this plan proposes a clear and active response to climate change, taking carbon reduction as the key strategic direction and providing an action guide for ecological environmental protection work.
The methods currently used for calculating carbon stock include field surveys and model simulations [11,12]. Compared with the traditional field survey method, the model simulation method can assess carbon stock changes at different scales and visualize the assessment results spatially [13,14,15]; this method is widely used at the regional scale. Among the many assessment models, the InVEST model is widely used for its low data requirements, fast operation speeds, and high accuracy [16,17,18]. In recent years, the InVEST model has been used to investigate the effects of land-use change on carbon stocks from different perspectives (e.g., urbanization, policy protection) and scales (such as administrative divisions and watersheds). Hou used it and the PLUS model to explore and predict the characteristics of ecosystem carbon stocks and their relationships with land-use patterns from 2000 to 2020 and 2020 to 2040. The results show that carbon stocks exhibit a decreasing trend followed by an increasing trend. Change in land-use type is the main factor leading to changes in carbon stocks, and the rapid expansion of building land leads to decreases in carbon stocks [19]. Yang used this model combined with the PLUS model to predict the characteristics of land use and carbon stocks in Xian under different future scenarios and studied the effects of land-use changes on carbon stocks; the final results showed that the expansion of construction land and the transfer of high-carbon-density land reduced the carbon stocks in Xian by 2.49 × 10 6 t from 2000 to 2015. Under the natural growth scenario, carbon stocks continue to decline, while, under the ecological protection scenario, carbon stocks increase [20]. The above studies show that the impact of land-use change on carbon stocks mainly depends on the ecosystem type and the mode of transfer between different land-use types.
The Invest model is used to study carbon storage. Most previous scholarship uses the input carbon density data in order to study the driving factors of carbon density; such studies use these factors to modify the carbon density to obtain the carbon density data suitable for the study area. However, such works overlook another highly important aspect, which is high-precision land-use/cover data. Most previous studies are based on finished product data, but these finished product data are generally large in scale, and their accuracy is not ideal in specific research areas. Therefore, the idea of using deep learning methods to classify remote sensing images in small areas emerged; higher-precision land-use/cover data can better reflect the real surface structure, which will undoubtedly improve the accuracy of estimations of carbon storage.
The most basic task of land-use change research is to classify the land features from remote sensing images. At present, the most commonly used traditional machine learning classification methods include SVM, KNN, random forest, multi-source logistic regression (MLR), etc. However, these traditional methods only extract the shallow feature information of remote sensing images and fail to learn the abstract features, meaning that they cannot achieve high classification accuracy [21]. Because of these problems, deep learning has begun to be used in remote sensing image classification because of its ability to extract deeper features of remote sensing images. Deep learning techniques can automatically learn the target change features and overcome the problems, such as poor stability and poor feature extraction abilities, that are encountered in traditional classification methods. Currently, the use of deep learning algorithms to classify remote sensing images is a significant trend [22,23,24,25,26,27]. Some common network models are the stacked auto-encoder (SAE), convolutional neural networks (CNN), and CNN-based remote sensing image classification methods. At first, a one-dimensional convolutional kernel was used, such as the one-dimensional convolutional neural network proposed by Hu [28]. Later, a group of scholars constructed two-dimensional convolutional neural networks (2D-CNN) and three-dimensional convolutional neural networks (3D-CNN), introducing deeper network structures such as the “residual link”. Zheng used an improved 3D-CNN to classify hyperspectral image features [29]. Qiao used the residual network (ResNet) and added a double attention mechanism to classify remote sensing scenes, and this method has higher accuracy than the convolutional neural network [30]. Xu introduced atrous convolutions to enhance the receptive field of feature extraction based on Resnet, in order to capture richer multi-scale detail features [31]. Li improved the U-Net by adding the SFAM module and the ASPP module, using this method to classify typical crops [32].
However, the classification effect achieved using these residual networks is still not ideal, partly because the residual network causes gradient explosion as the depth increases; therefore, if the depth of the network is arbitrarily increased, it may be counterproductive. Another reason is that the complexity of remote sensing images prevents deep learning networks from learning more features. Based on these two considerations, we designed and used a pre-activated residual network module, which not only increases the depth of the network but also does so without requiring additional computation. In response to the complexity of remote sensing images, the CBAM attention mechanism is introduced; this can accelerate model fitting and further improve the segmentation of image target edges. In addition, a multi-scale feature extraction and fusion module is added to the model; it can extract the features of different receptive fields and introduce residual connections into the module, so that it can learn more low-level and high-level features. The network designed in this article uses feature fusion modules as the basis for constructing a residual network. Multiple modules work together to maximize the learning of remote sensing image features, thereby improving the edge information loss of large and small linear targets that is caused by the loss of target feature information in previous convolutional neural networks. This is particularly evident in the building classification. The residual multi-module fusion network (R-MFNet) proposed in this article can accurately classify each kind of ground object, laying a data foundation for the subsequent accurate statistical analysis of the area and of the spatial distribution of various land-use types; moreover, this network can further improve the accuracy of carbon storage estimations. This paper not only proposes a CNN network that can fully extract the characteristics of remote sensing images, but also provides a new research basis for further improving the accuracy of carbon storage estimations.

2. Materials and Methods

2.1. Research Area

Zhengzhou (112°42′–114°14′ E and 34°16′–34°58′ N) City is located in the central north of Henan Province in the south of the North China Plain; the city has a total land area of 7446 km 2 . The city borders Kaifeng to the east, Luoyang to the west, Xinxiang and Jiaozuo to the north, and Pingdingshan and Xuchang to the south. The terrain and landforms of Zhengzhou City are rich and varied, with the topography being low in the east and high in the west. Zhengzhou has four distinct seasons and a distinct rainy and dry season. The Yellow River and the Huai River are the 2 major water systems in the city, and there are 124 rivers of various sizes. There are many types of soils and rich reserves of natural resources. The soil in the urban area of Zhengzhou is mainly within the scope of agricultural areas, which are divided into 4 soil types, 9 subtypes, 17 soil genera, and 51 soil species, including cinnamon soil, tidal soil, aeolian sand soil, and paddy soil. It is mainly composed of brown soil and tidal soil. Thirty-six kinds of minerals, including coal, oil and stone, and refractory clay, have been identified, and this area is one of the largest oil and stone bases in China. Zhengzhou is the capital of Henan Province, the core city of the Central Plains City Cluster. Note that the Central Plains urban agglomeration is the core area for development and strengthening in the urbanization strategy of Henan Province. The state will actively cultivate and develop urban agglomeration to become an important region, promoting the uniform development of land space and rapid economic development [33]. It is an essential central city in the central region with a high political and economic status. The location map of Zhengzhou is shown in Figure 1.

2.2. Data Source

2.2.1. Land-Use Data

The remote sensing image data selected in this paper were Landsat data from geospatial data cloud sites, http://www.gscloud.cn/search (accessed on 12 April 2023). Due to the influence of the quality of the Landsat data, images from the same month could not be collected. To ensure the reliability of the experiment, the data were collected in late spring or early summer, which are periods with fewer clouds, and the years 2001, 2009, and 2020 were selected. The image data size was 4545 × 2706 pixels, where the background was outside the administrative boundary. To select training samples of various land types, the determination of the type of land use required was based on the land-use characteristics of Zhengzhou and subsequent estimates of carbon storage, and it was then combined with the reference framework established by the National Remote Sensing Monitoring Coverage Classification System and the types of features needed for carbon storage. The land-use types were classified into six categories, farmland, woodland, water body, grassland, built land, and other land [34], and their specific interpretation criteria are shown in Table 1.
We selected samples from the image and labeled them manually. The advantage of this is that we could obtain any desired samples. We used a portion of the labeled samples for training and a portion for validation, with a ratio of 30% and 70%, respectively; we provide the sample selection details for 2020 in Table 2.
To improve the classification accuracy and make the different land-use categories more easily distinguished, we introduced three indices: N D V I , N D W I , and N D B I . The N D V I was introduced to improve the classification accuracy of woodland, grassland, and other land types. The N D W I was introduced to distinguish water bodies from other types. The N D B I was introduced to improve the model’s ability to distinguish between buildings and other objects. The three indices are calculated using Equations (1)–(3):
N D V I = N R E D / N + R E D
N D W I = G R E E N N / G R E E N + N
N D B I = S N / S W I R + N
where N is the near-infrared band,   R E D is the red band, G R E E N is the green band, and S is the short-wave infrared band. After exponential calculations and band fusion, the Landsat data added N D V I , N D W I , and N D B I to the original band. The band fusion data were the original image data for deep learning classification.

2.2.2. Carbon Density Data

The measured carbon density data can effectively improve the accuracy of carbon stock estimation. Still, there is a lack of measured data based on land-use types in Zhengzhou, so the data determination in this paper was completed in two stages: (1) collecting the data from the National Ecological Science Data Center (http://www.cnern.org.cn/, accessed on 12 April 2023) and referring to the literature [35,36,37]; since there is little research on carbon storage in Zhengzhou, the carbon density data of nearby areas were collected. (2) Since the data in Zhengzhou were obtained from the results of national studies and some local studies, they were not the actual measurement results; moreover, the carbon density values vary with climate, soil properties, and land use, so they needed to be corrected. The carbon density is affected by many factors, such as the type of vegetation, soil moisture, climate conditions, etc. However, the influence of elevation, terrain, and other factors is relatively small, and the aforementioned factors are usually affected by precipitation and temperature. Therefore, when revising the carbon density value of Zhengzhou, the influence of temperature and precipitation needed to be be considered comprehensively. The literature review shows that both the vegetation carbon density and the soil organic carbon density have significant positive correlations with annual precipitation, but the correlation with the annual average temperature is not strong and the formula is highly generalized. Therefore, the formula used by Alam was used to correct the precipitation factor (corrected for the effect between the annual mean precipitation and biomass carbon density and soil organic carbon density) [38]. Meanwhile, the formula used by Giardina and Chen was used as the formula to correct the temperature factor (corrected for the effect between the annual average temperature and biomass carbon density; the influence between the annual average temperature and the soil carbon density was not considered) [39,40]:
C S P = 3.398 × A P + 1996.1   R 2 = 0.11
C B P = 6.7981 e 0.00541 A P   R 2 = 0.70
C B T = 28 A T + 398   R 2 = 0.47 , p < 0.01
where C S P is the soil carbon density obtained from the annual precipitation, C B P and C B T are the carbon density of biomass based on annual precipitation and the annual mean temperature, respectively, A P is the average annual precipitation (mm), and A T is the average annual temperature (°C). The mean annual temperature and precipitation of Zhengzhou and the whole country were substituted into the above equations (9.38 °C/15.64 °C and 677.3 mm/624.79 mm for the national scale and Zhengzhou between 2001 and 2020, respectively), and the data were collected from statistical yearbooks. The ratio of the two is the correction factor. The collected carbon density data at the national scale were multiplied by the correction factor to calculate the carbon density of Zhengzhou.
K B P = C B P C B P
K B T = C B T C B T
K B = K B P × K B T = C B P C B P × C B T C B T
K S = C S P C S P
where K B P and K B T are the correction factors of the precipitation factor and the temperature factor for biomass carbon density, respectively, and C B P and C B P are the biomass carbon density data obtained from annual precipitation in Zhengzhou and national scale, respectively. C B T and C B T are the biomass carbon density data based on the annual mean temperature in Zhengzhou and the national scale, respectively. C S P and C S P are the soil carbon density data based on the annual mean temperature in Zhengzhou city and at the national scale, respectively. K B and K S are the biomass carbon density correction coefficients and soil carbon density correction coefficients, respectively. The carbon density values of different land-use types revised by annual precipitation and annual mean temperature in Zhengzhou are shown in Table 3. C a b o v e represents the carbon density of aboveground organisms, including all living vegetation above the surface (bark, trunks, branches, and leaves, etc.). C b e l o w represents the carbon density of underground organisms, mainly referring to the carbon storage of plant roots. C s o i l represents the carbon density of soil, generally referring to the carbon storage of mineral soil and organic soil. C d e a d represents the carbon density of dead organic matter, generally referring to the carbon storage of litter and dead plants.

2.3. Methods

In this study, the coding and decoding paths are bridged by the residual atrous spatial pyramid pooling structure (R-ASPP), which uses multiple parallel atrous convolutions to extract the multi-scale receptive field features of the target region and improve the classification accuracy of the model for features with significant scale changes. To solve the problem of remote sensing image data being rich in spatial information but subject to redundant geographic features interfering with the deep neural network model, a strategy of introducing a convolutional block attention module (CBAM) into the network is proposed. Additionally, an improved residual block is introduced to fuse deep features with shallow features, enhancing the propagation ability of features, and further improving the operation speed of the model while avoiding the problem of gradient disappearance in training.

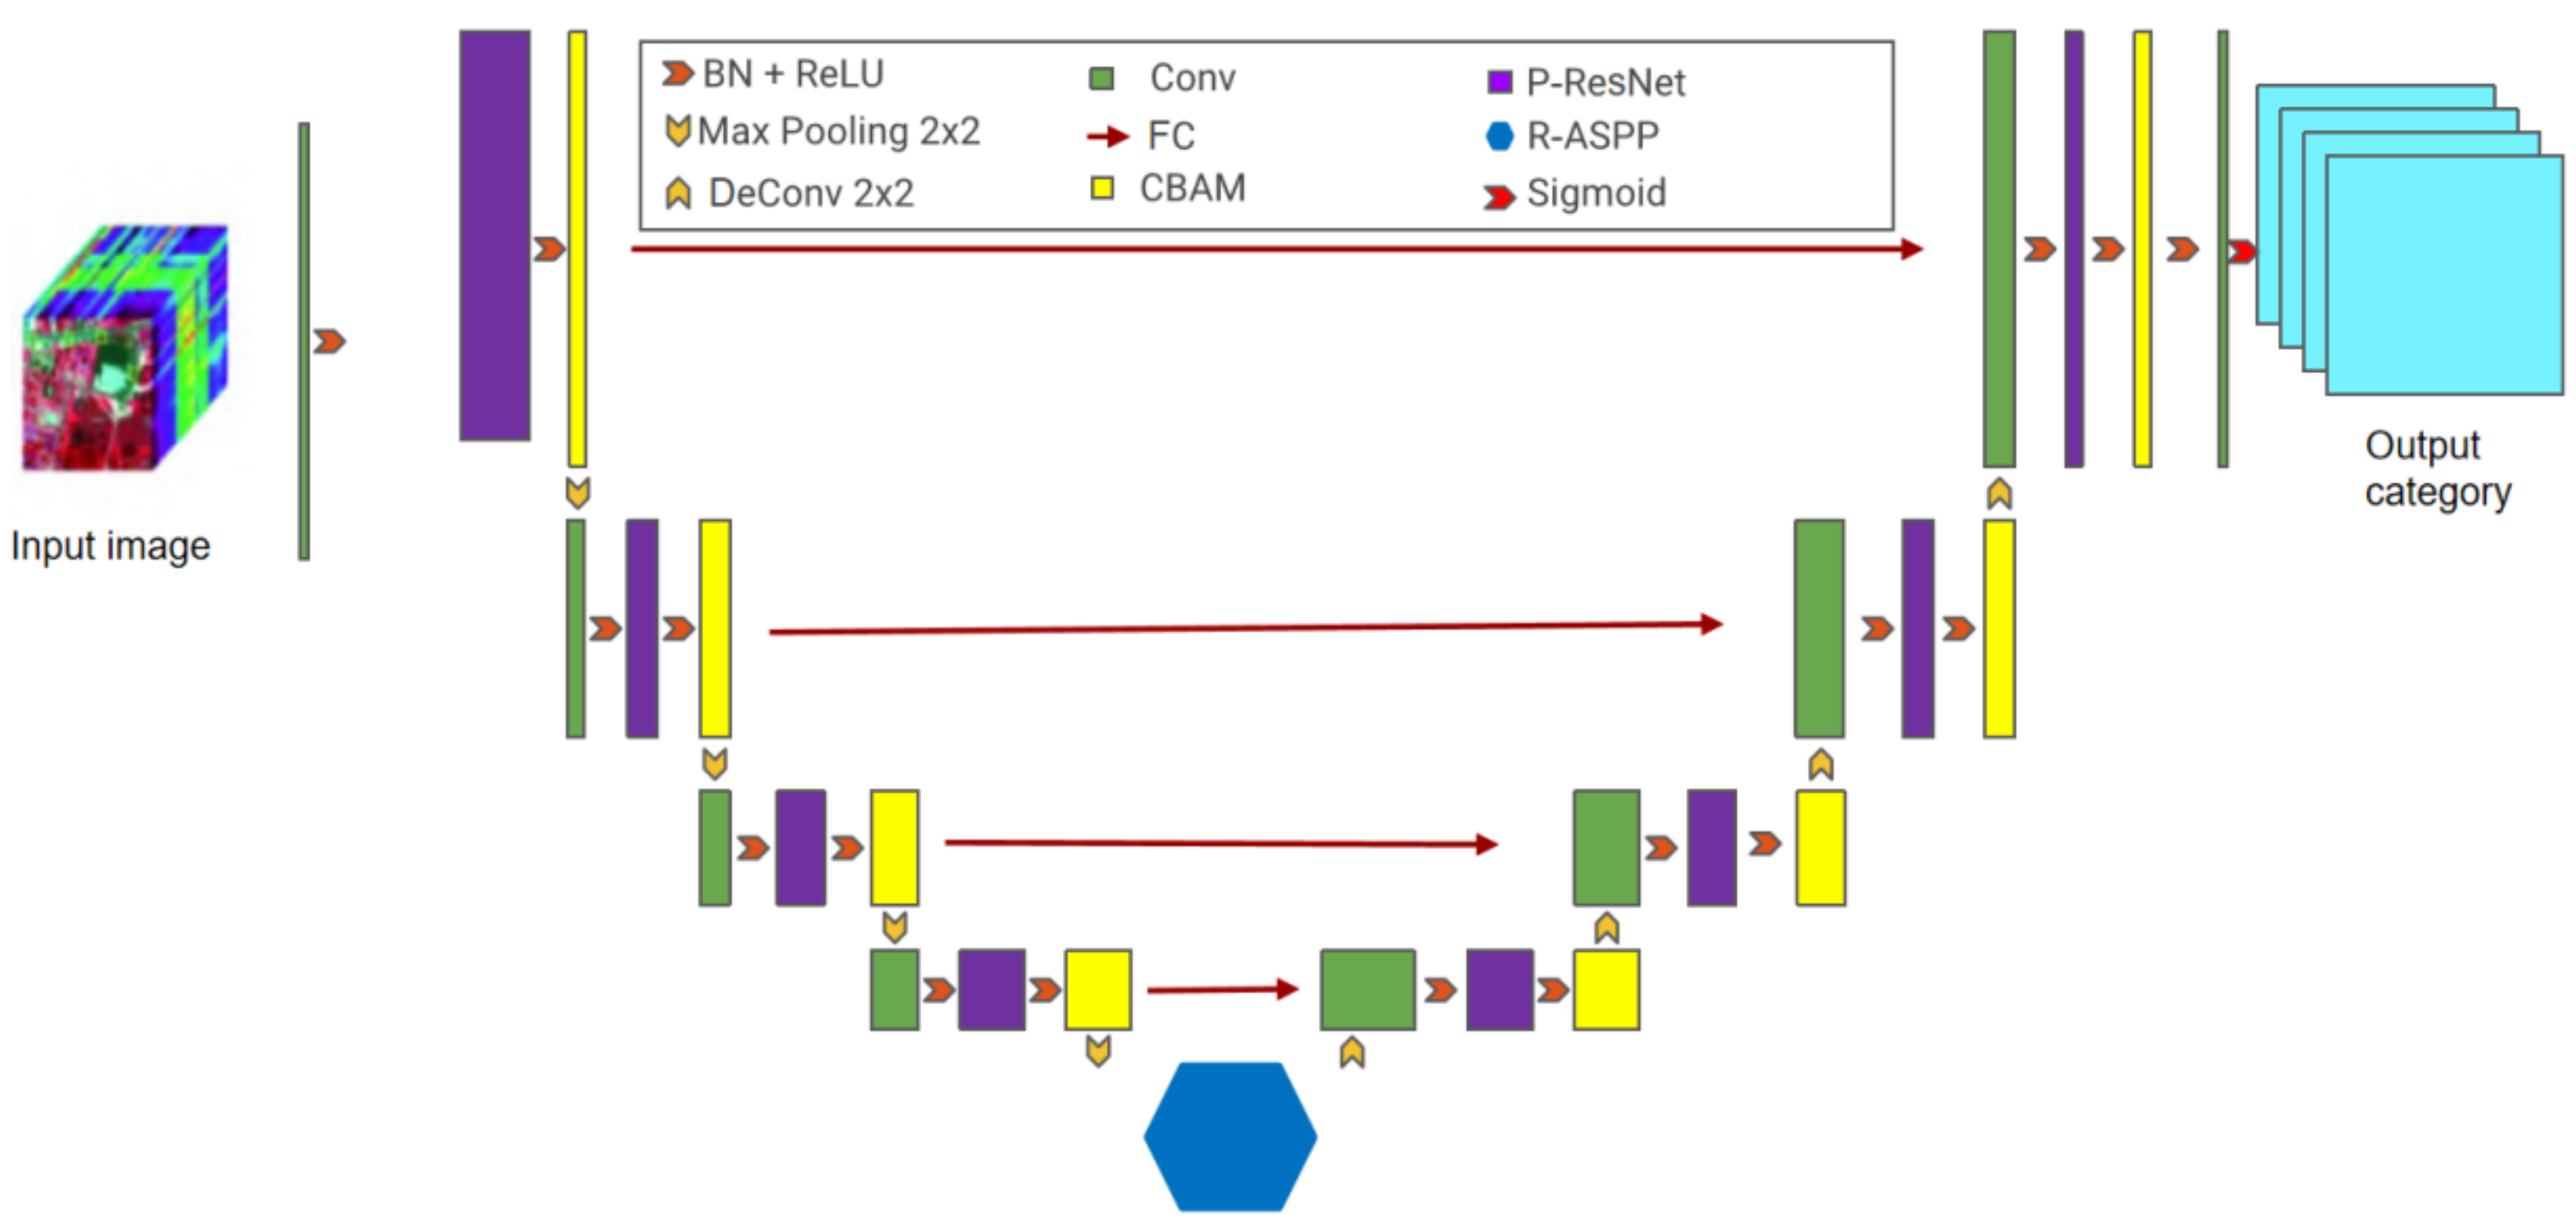
2.3.1. Network Structure

The overall architecture of the improved classification model proposed in this paper is shown in Figure 2. It uses BN processing and the ReLU activation function after each convolutional layer, effectively preventing overfitting or underfitting during the training process. The coding path of the network consists of four downsampling modules and one modified ASPP module, each of which contains a modified residual block and an attention module. The decoding path of the network consists of four up-sampling modules, each of which also includes an improved residual block and an attention module to recover the resolution of local features to the input image size. The encoding path and the decoding path are bridged using an improved ASPP module, which extracts multi-scale features of ground objects from the high-level features learned from the encoding path and then transmits these features to the decoding path. The output of the encoding path incorporates the remote sensing image features learned by the attention and pre-activated residual modules. Each module takes advantage of its respective structures to reduce the loss of information during forward propagation and to extract the more fully abstracted features needed for classification. The final layer of the decoding path uses a sigmoid function to project the multichannel feature mapping onto the target region to generate the final classification result.

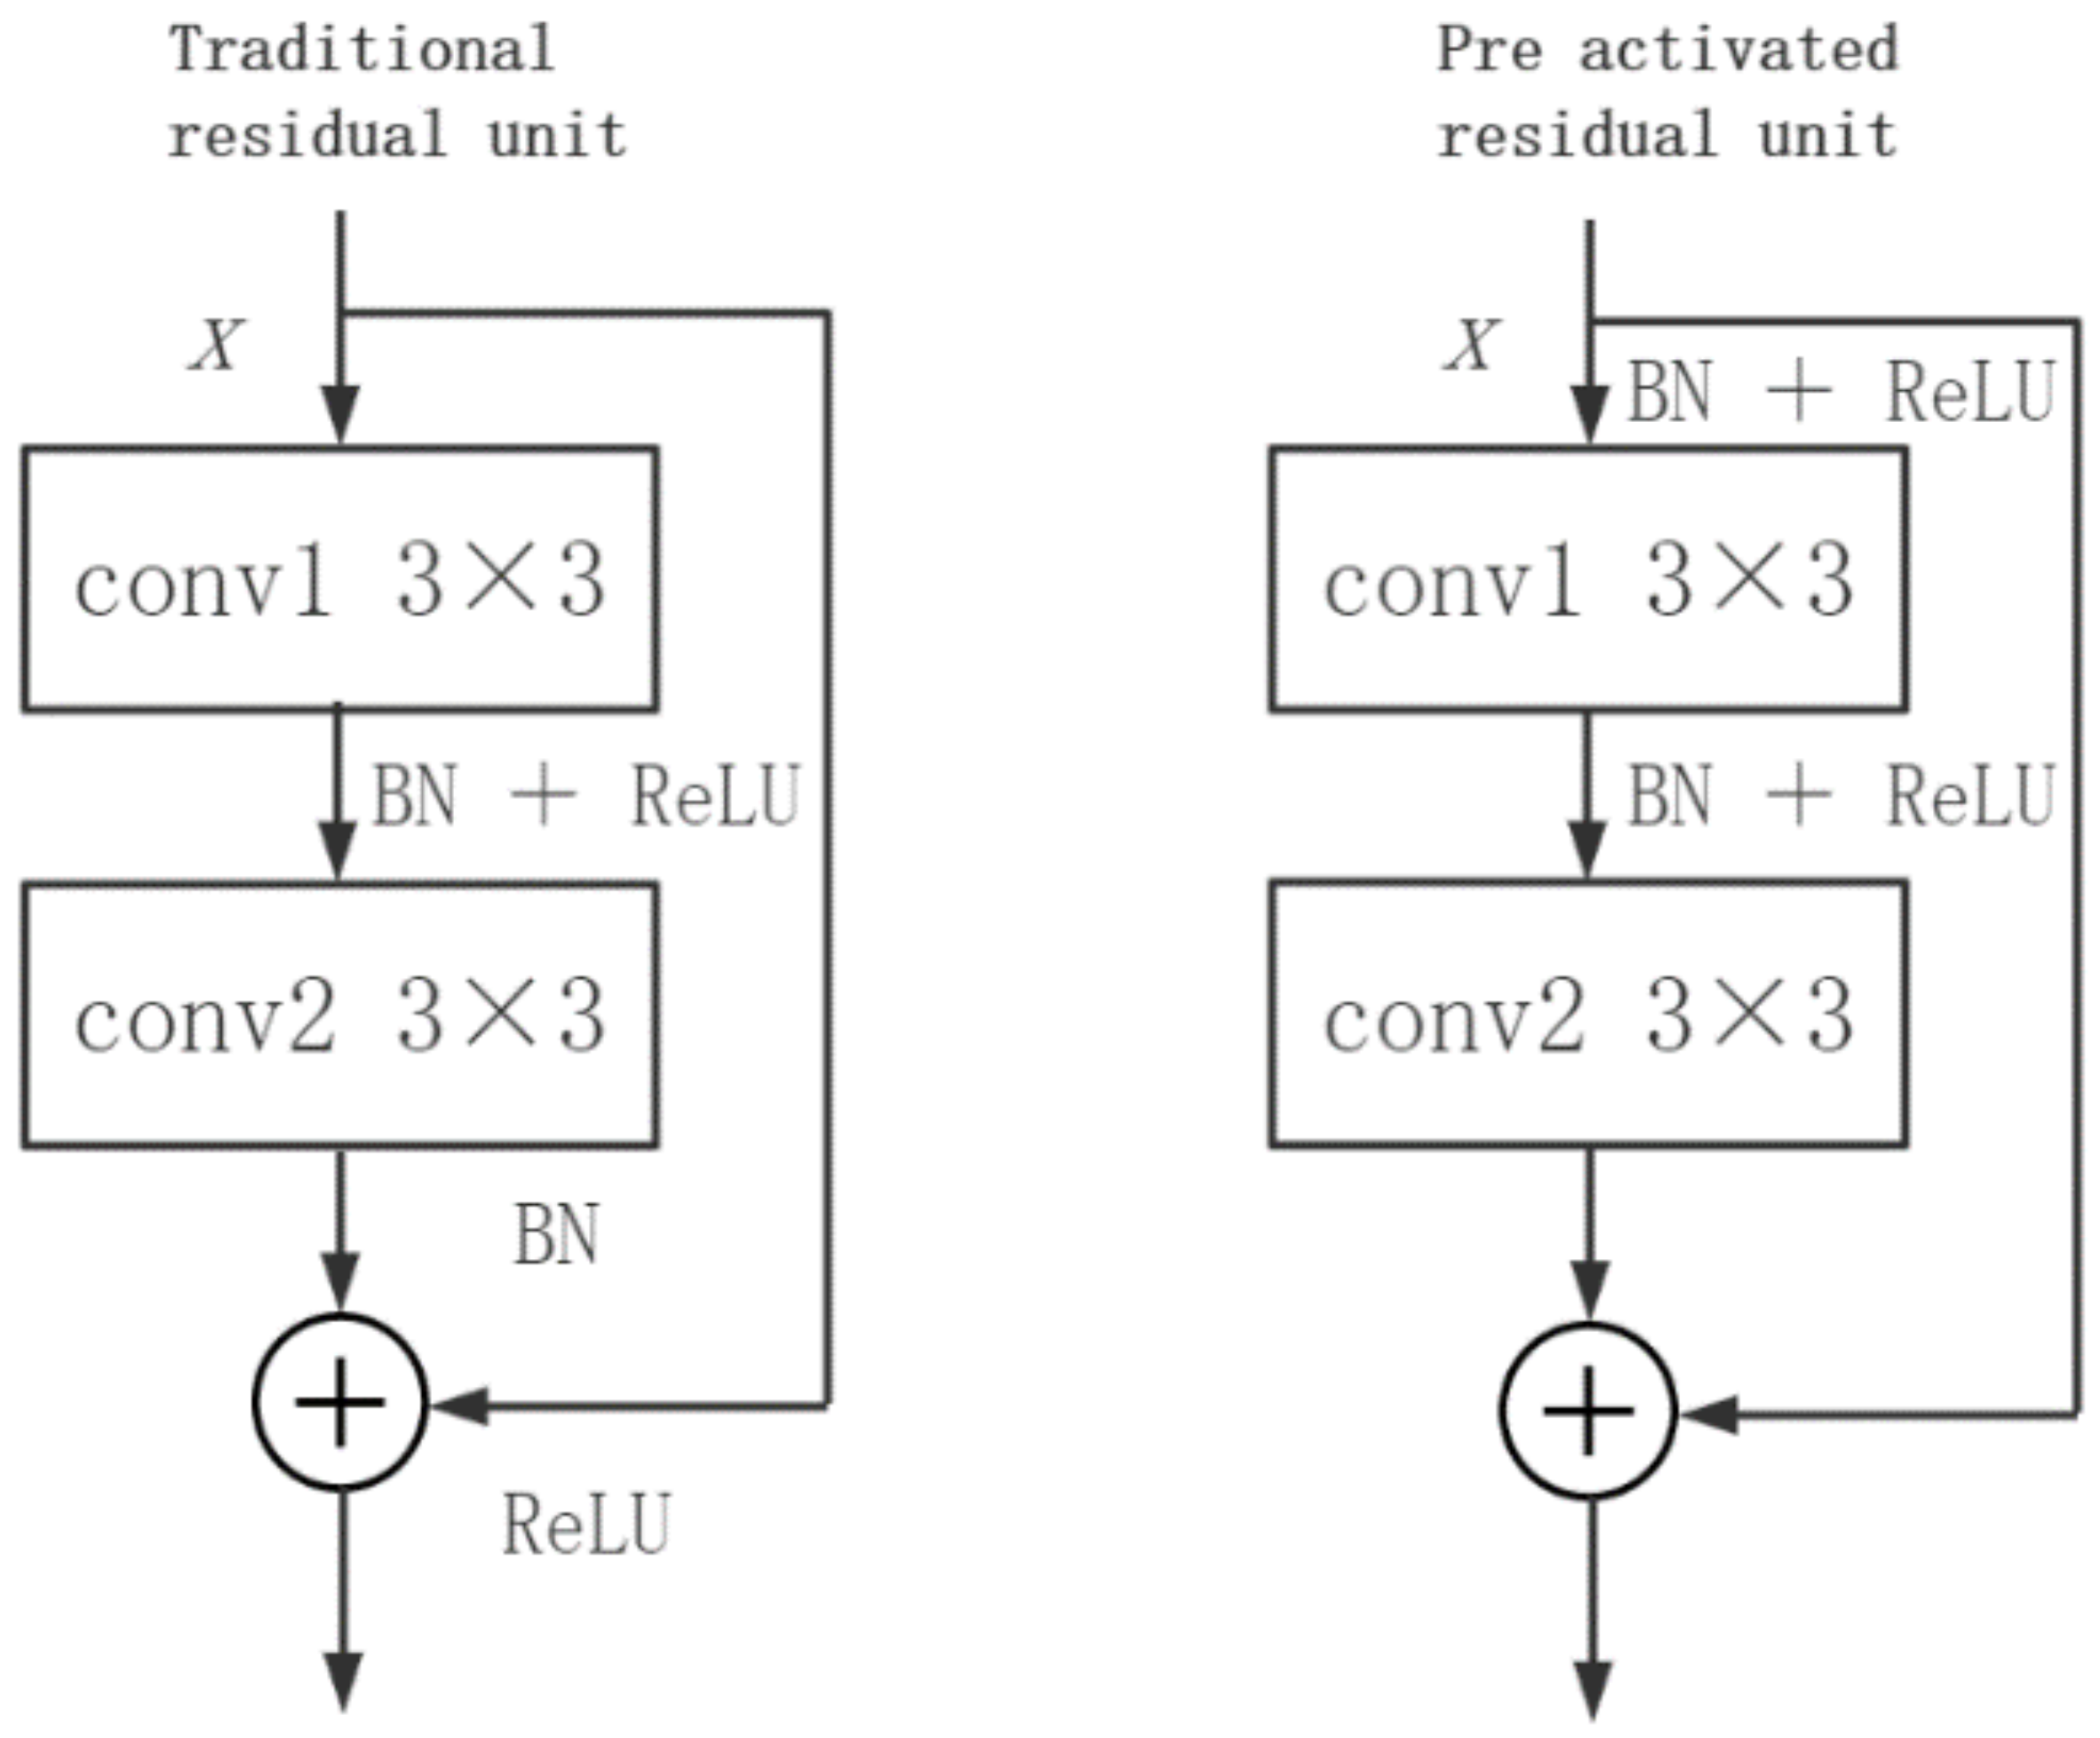
2.3.2. Pre-Activated Residual Network Module

The expressiveness of the network is enhanced with the increase in the network depth. For the problem of gradient disappearance caused by deepening the network depth with the residual unit, He added the rectified linear unit (ReLU) activation layer to the residual unit to obtain a network with improved convergence performance and pixel classification performance [41].
By observing the position of the activation function in Figure 3, it is clear that the activation function (Relu and BN) is placed before the convolutional layers. Compared with the traditional concept of post-activation, the pre-activation residual unit module simplifies the model and makes it converge faster. ReLU is a nonlinear activation function which activates the remote sensing data processed by BN algorithm through the ReLU activation function and adds it to the convolutional layers before each convolutional operation. The BN algorithm can play the role of regularization to improve feature complexity. The addition of the BN layer means that the data input to the ReLU activation layer in backward propagation can produce more pronounced gradients, enhancing the propagation of features, breaking the interference of higher learning rate settings on the ReLU function activation neurons, and allowing the network to converge faster while avoiding the problem of gradient disappearance. Therefore, with the pre-activation module, the feature information of various features can be freely propagated forward and backward in the whole network.

2.3.3. Attention Mechanism Module

The feature representation of the network becomes richer as the network deepens, but much spatial information is lost due to cascaded convolution and downsampling operations. For this reason, this network adds attention modules in the coding and decoding paths, which propagate spatial information in the coding layer to the decoding layer and reduce the loss of information during forward propagation. The attention module used by the network is composed of two attention modules, which correct the input data in both the space and the channel. When the location information of the input feature map is of higher importance in both channel and spatial correction, it will achieve higher activation, thus encouraging the network to learn more compelling features.
CBAM is a convolutional attention mechanism module, which is a comprehensive combination of a channel attention module (CAM) and a spatial attention module (SAM) [42]. Figure 4 shows its structure.
We have made some improvements to the CBAM attention mechanism by incorporating residual connections to enable it to learn and integrate more information. The mechanism consists of two main operational steps: CAM first performs maximum pooling and average pooling operations on the input features, then tiles and inputs the feature map into a multilayer perceptron (MLP) with a two-layer network, sums the output results, and activates them through the sigmoid activation function to obtain the channel attention features. They are multiplied by the input features and residual connected with the input features. The resulting features are used as the input of the SAM module. After the SAM module takes effect, it multiplies the residual connected features of CAM and performs residual connections with the input features to obtain the final output features.
The attention mechanism is applied to the entire residual network to promote the effective flow of image information in the network, enabling the network to capture key information and improving its ability to recognize ground objects.

2.3.4. Residual ASPP Module

There are four kinds of atrous convolution parallel sampling with different sampling rates in the ASPP structure. Atrous convolution can expand the receptive field of the feature map without losing the image resolution, meaning that the target can be precisely located. However, the limitation of ASPP is also reflected in the atrous convolution. Atrous convolution with a high sampling rate is good for recognizing large objects but loses the useful information of small objects; meanwhile, atrous convolution with a low sampling rate can obtain the position information of small objects but loses more of the contour edge information of large objects. The parallel combination of atrous convolution with different sampling rates can compensate for the information missing from atrous convolution to some extent. However, the effective content of the missing information still needs to be effectively utilized. Given the limitations of ASPP and the characteristics of images in Zhengzhou, we propose a residual ASPP module to supplement the information lost in the ASPP feature extraction process to achieve better classification results. The improved residual ASPP is derived from the combination of the residual block and ASPP. The residual block is used to make up for the deficiencies of ASPP by adding a shortcut connection to the four different sampling rates of ASPP, which is helpful in supplementing the information missed after the atrous convolution. The improved structure of ASPP is shown in Figure 5. The specific calculation formula is as follows:
Y = C o n c a t I poobing   X , H 1.3 X , H 6.3 X , H 12.3 X , H 18.3 X
where Concat is the concatenation operation, H r . n X represents the perforated convolution of an n-size convolution kernel and a sampling rate r, where H r . n X = F x + x . Here, F(x) is the output of the lower branch, x is the output of the upper branch, and I poobing   is the image feature of the image pooling branch in Figure 5, which is the average pooling feature of the input feature map.

2.4. Other Related Methods

2.4.1. Carbon Stock Estimation

The carbon module in the InVEST model is used to analyze changes in carbon storage in the ecosystem of Zhengzhou. The working principle of this module is calculating the carbon storage of Zhengzhou by combining the land-use/land cover data and the corresponding carbon density table of each land type. The model divides the carbon storage of the regional ecosystem into four categories; some studies ignore the dead organic carbon, and only calculate the other three types of carbon pools. In addition, the model also includes the fifth carbon pool. Considering the previous research experience and the data acquisition situation, the fifth carbon pool is not included in this study [43,44]. The calculation of the basic carbon pool meets the expectations of this study and can directly serve the research purposes. We add up the total amount from the four carbon pools to represent the total carbon reserves of the study area, as follows:
C i = C i , a b o v e + C i , b e l o w + C i , s o i l + C i , d e a d
C total = i = 1 n C i × S i
where i is the i-th land class, and C i is the carbon density of the i-th land class. C i , a b o v e is the aboveground biomass carbon density of the i-th land class, C i , b e l o w is the below-ground biomass carbon density of the i-th land class, C i , s o i l is the soil organic matter carbon density of i-th land class, C i , d e a d is the carbon density of the dead organic matter of the i-th land class, C total is the total regional carbon stock, S i is the total area of the i-th land class, and n represents the total number of land classes, i.e., 6 in this study.

2.4.2. Carbon Stock Changes Due to Land-Use Change

Due to the differences in carbon density between different land-use types, if there is mutual conversion between them, the carbon storage change caused by their change can be obtained by multiplying the area of conversion between them by the carbon density value due to their change. The specific method can be achieved using the land-use matrix obtained above, which is calculated as follows:
T i j = S i j × Δ c i j
where T i j is the total amount of carbon stock change caused by the transfer from the i-th land class to the j-th land class. S i j is the area transferred from land class i to land class j . Δ c i j is the difference between the carbon density corresponding to land class j and the carbon density of land class i .

3. Results

R-MFNet was used to classify three images of Zhengzhou from different years (2001, 2009, and 2020). In order to show the effect of model improvement, some control experiments were set up, including SVM and a deep learning model (2D-CNN) with a good classification effect, as well as a deep residual network model (Resnet). The model does not include an attention mechanism or a feature fusion module. The overall accuracy and Kappa coefficient are used to express the classification effect, which are two indicators commonly used in remote sensing to represent the classification quality. The accuracy evaluation of the different models is shown in Table 4; it shows the image classification results in 2020 with the highest Kappa coefficient.
According to the classification performance of the model, we can see that the R-MFNet model proposed has the best classification accuracy, but there are also some misclassifications. In order to obtain more accurate classification data for the land-use types, we correct our own training samples by means of a field survey and observation of the accurate classification results of our predecessors. The classification accuracy of the model is continuously improved by deleting the error points and increasing the training sample points of land-use types with fewer classification results. The higher the classification accuracy is, the more beneficial it is to the subsequent estimation of carbon reserves. The final accuracy evaluation after multiple corrections is shown in Table 5. This result provides a high-precision land-use-type map for the subsequent carbon reserve estimations
The R-MFNet network proposed in this paper has good feature extraction abilities because of its network structure characteristics, and its classification results are more consistent with the actual land type. In order to verify the advantages of the model in reducing the loss of land type information, we selected an area from the Landsat image of Zhengzhou in 2020, including built land, water bodies, and farmland. To ensure the universality of the results, we selected regions randomly and compared their classification results with SVM, 2D-CNN, and Resnet, as shown in Figure 6. The sample diagram for marking is shown in Figure 6b.
It can clearly be seen from Figure 6 that the classification effect of 2D-CNN is the worst, possibly because the loss of target information is relatively severe due to its small number of network layers, simple structure, and weak feature learning ability, which manifests in two forms: the first is that the information of linear objects such as roads cannot be detected, the second is that the connection boundary between land-use types is too ideal, and its ability to control noise is too poor. Additionally, the edge contour detection of large buildings is not meticulous, and there are some inaccurate classifications of water bodies. The classification effect of the Resnet model is better than that of 2D-CNN, possibly because its residual structure supplements the target information to be detected, and the connection boundary between various types of land use has been improved. However, it still shows some missing detections of target objects, and there are still a small number of inaccurate classifications of water bodies; nevertheless, its ability to detect non-building linear objects such as roads and dirt roads near cultivated land has been improved. SVM is a commonly used remote sensing image classification method; most of the existing land-use-type product data used for carbon stock estimation using the InVEST model are based on this classification method. SVM produces more accurate object detection results, and the edge detection information of objects is obvious. Compared with the three other types of network, due to its residual structure and feature fusion module, the R-MFNet model proposed in this paper learns more effective information. Both large buildings and linear objects show good classification results, with the lowest level of misclassification, and the model has some advantages in noise suppression and object edge contour detection. Its classification results are the most consistent with the real land-use type. The R-MFNet network exhibits more sufficient detection of information, as shown in the two elliptical marks in Figure 6; this is the result of its network structure. It still exhibits strong feature learning ability even when the sample size is reduced.
When comparing the classification results, we designed a residual network based on our proposed network that does not include the pre-activation residual module, residual attention module, and residual ASPP module, and which is similar to U-Net. Compared to the network proposed in this article, it is a weak classifier, but, compared to U-Net, it is a strong classifier. We also selected an area from 2020 that includes six types of land use and compared them using some classic models, including U-net, 1D-CNN, and HybirdSN. The results are shown in Table 6.
From Table 6, it can be seen that, compared to other classic classification networks, the network proposed in this article has the highest accuracy in both the final results (OA values and Kappa coefficients) and for each land type.

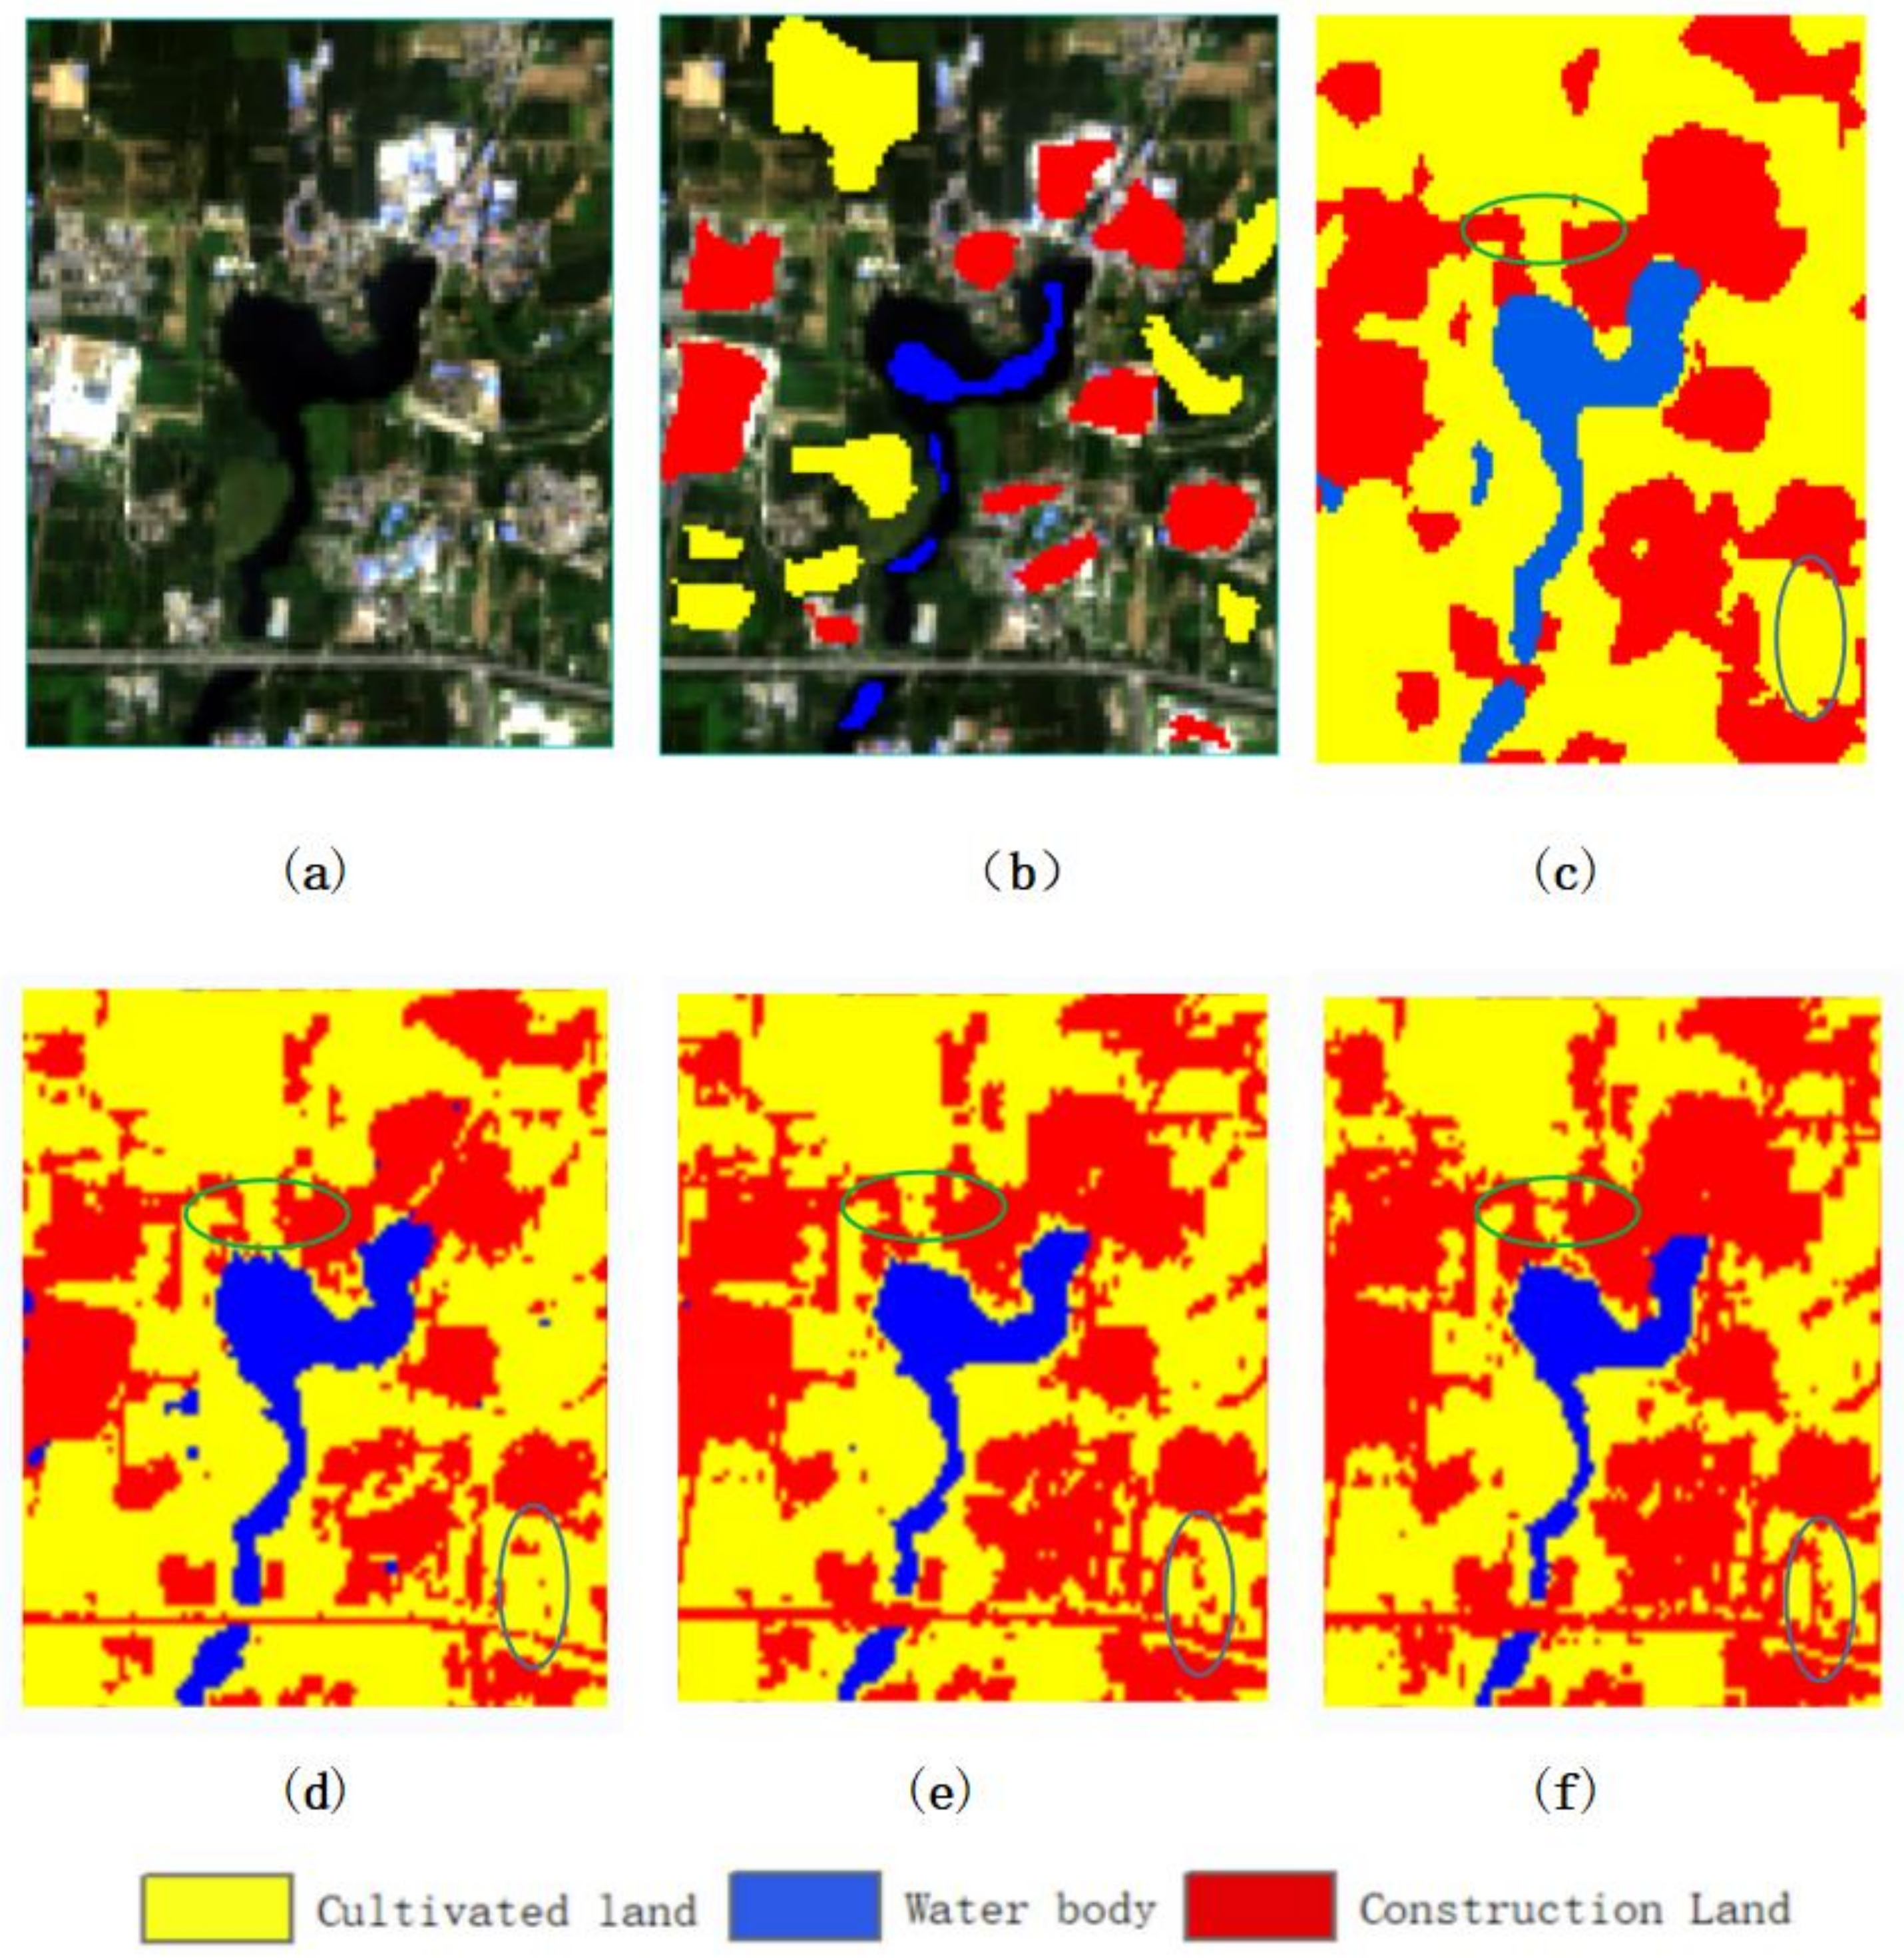
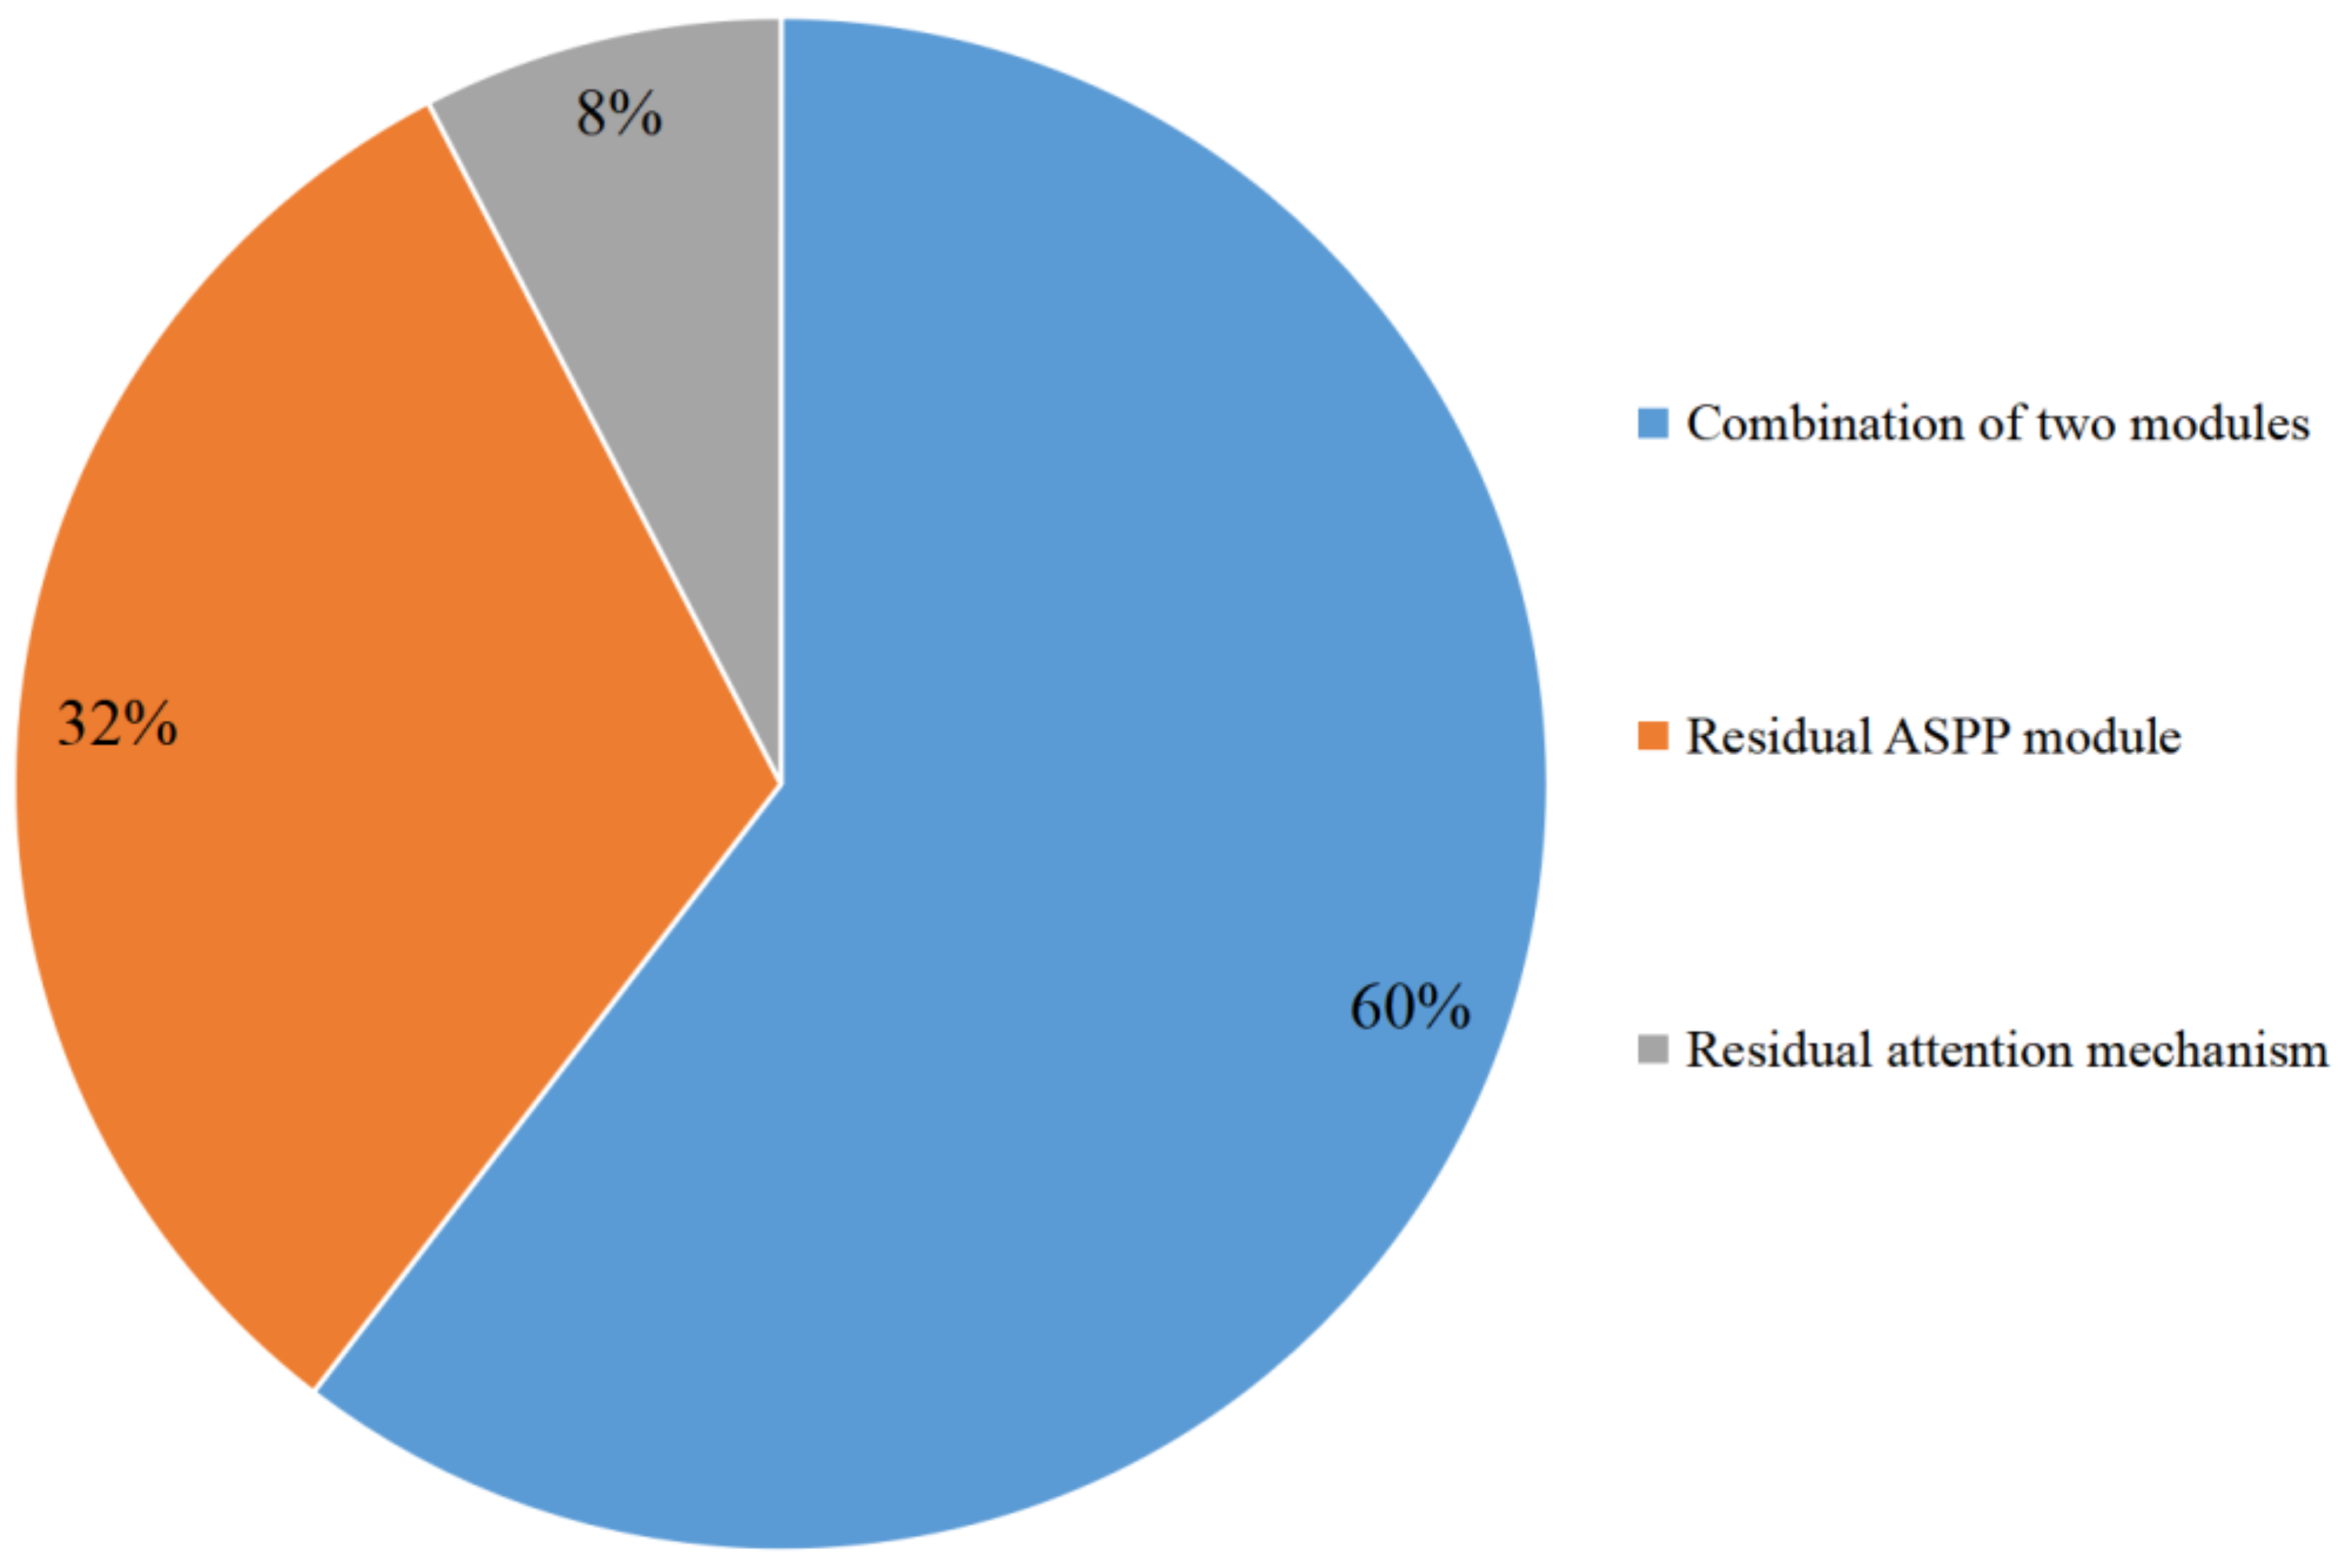
3.1. Ablation Experiment for the Residual Multi-Module Fusion Network

The main purpose of pre-activation residual units is to increase the efficiency of the network, and our focus is on the introduction of residual attention mechanism and a residual ASPP structure. To verify their impact on the network, we added an ablation experiment section to the paper, using a network without the residual attention and residual ASPP components as the baseline method. We separately explored the impact of these two components on the network performance. For the ablation experiments, we replaced the corresponding components with convolutional layers with the same number of parameters to ensure that the total number of parameters in the network remained unchanged.
Table 7 shows the classification accuracy of the remote sensing images obtained by combining two different modules: (1) using both the residual attention module and the residual ASPP module; (2) using only the residual ASPP module; (3) using only the residual attention module; (4) not using either module. By comparing and analyzing the OA values of Table 7, it was found that using only the residual ASPP module increased the accuracy by 1.64%, using only the residual attention module increased the accuracy by 0.39%, and using both modules simultaneously increased the accuracy by 2.5%. The different combinations of various modules have the same effect on the improvement in the Kappa coefficient as on the OA value; that is, the contribution of the residual ASPP module to the network is higher than that of the residual attention module, and the highest accuracy is achieved by using both modules simultaneously. The improved accuracy values (OA) obtained using the above combination methods are visualized to obtain the contribution levels of different modules, as shown in Figure 7.

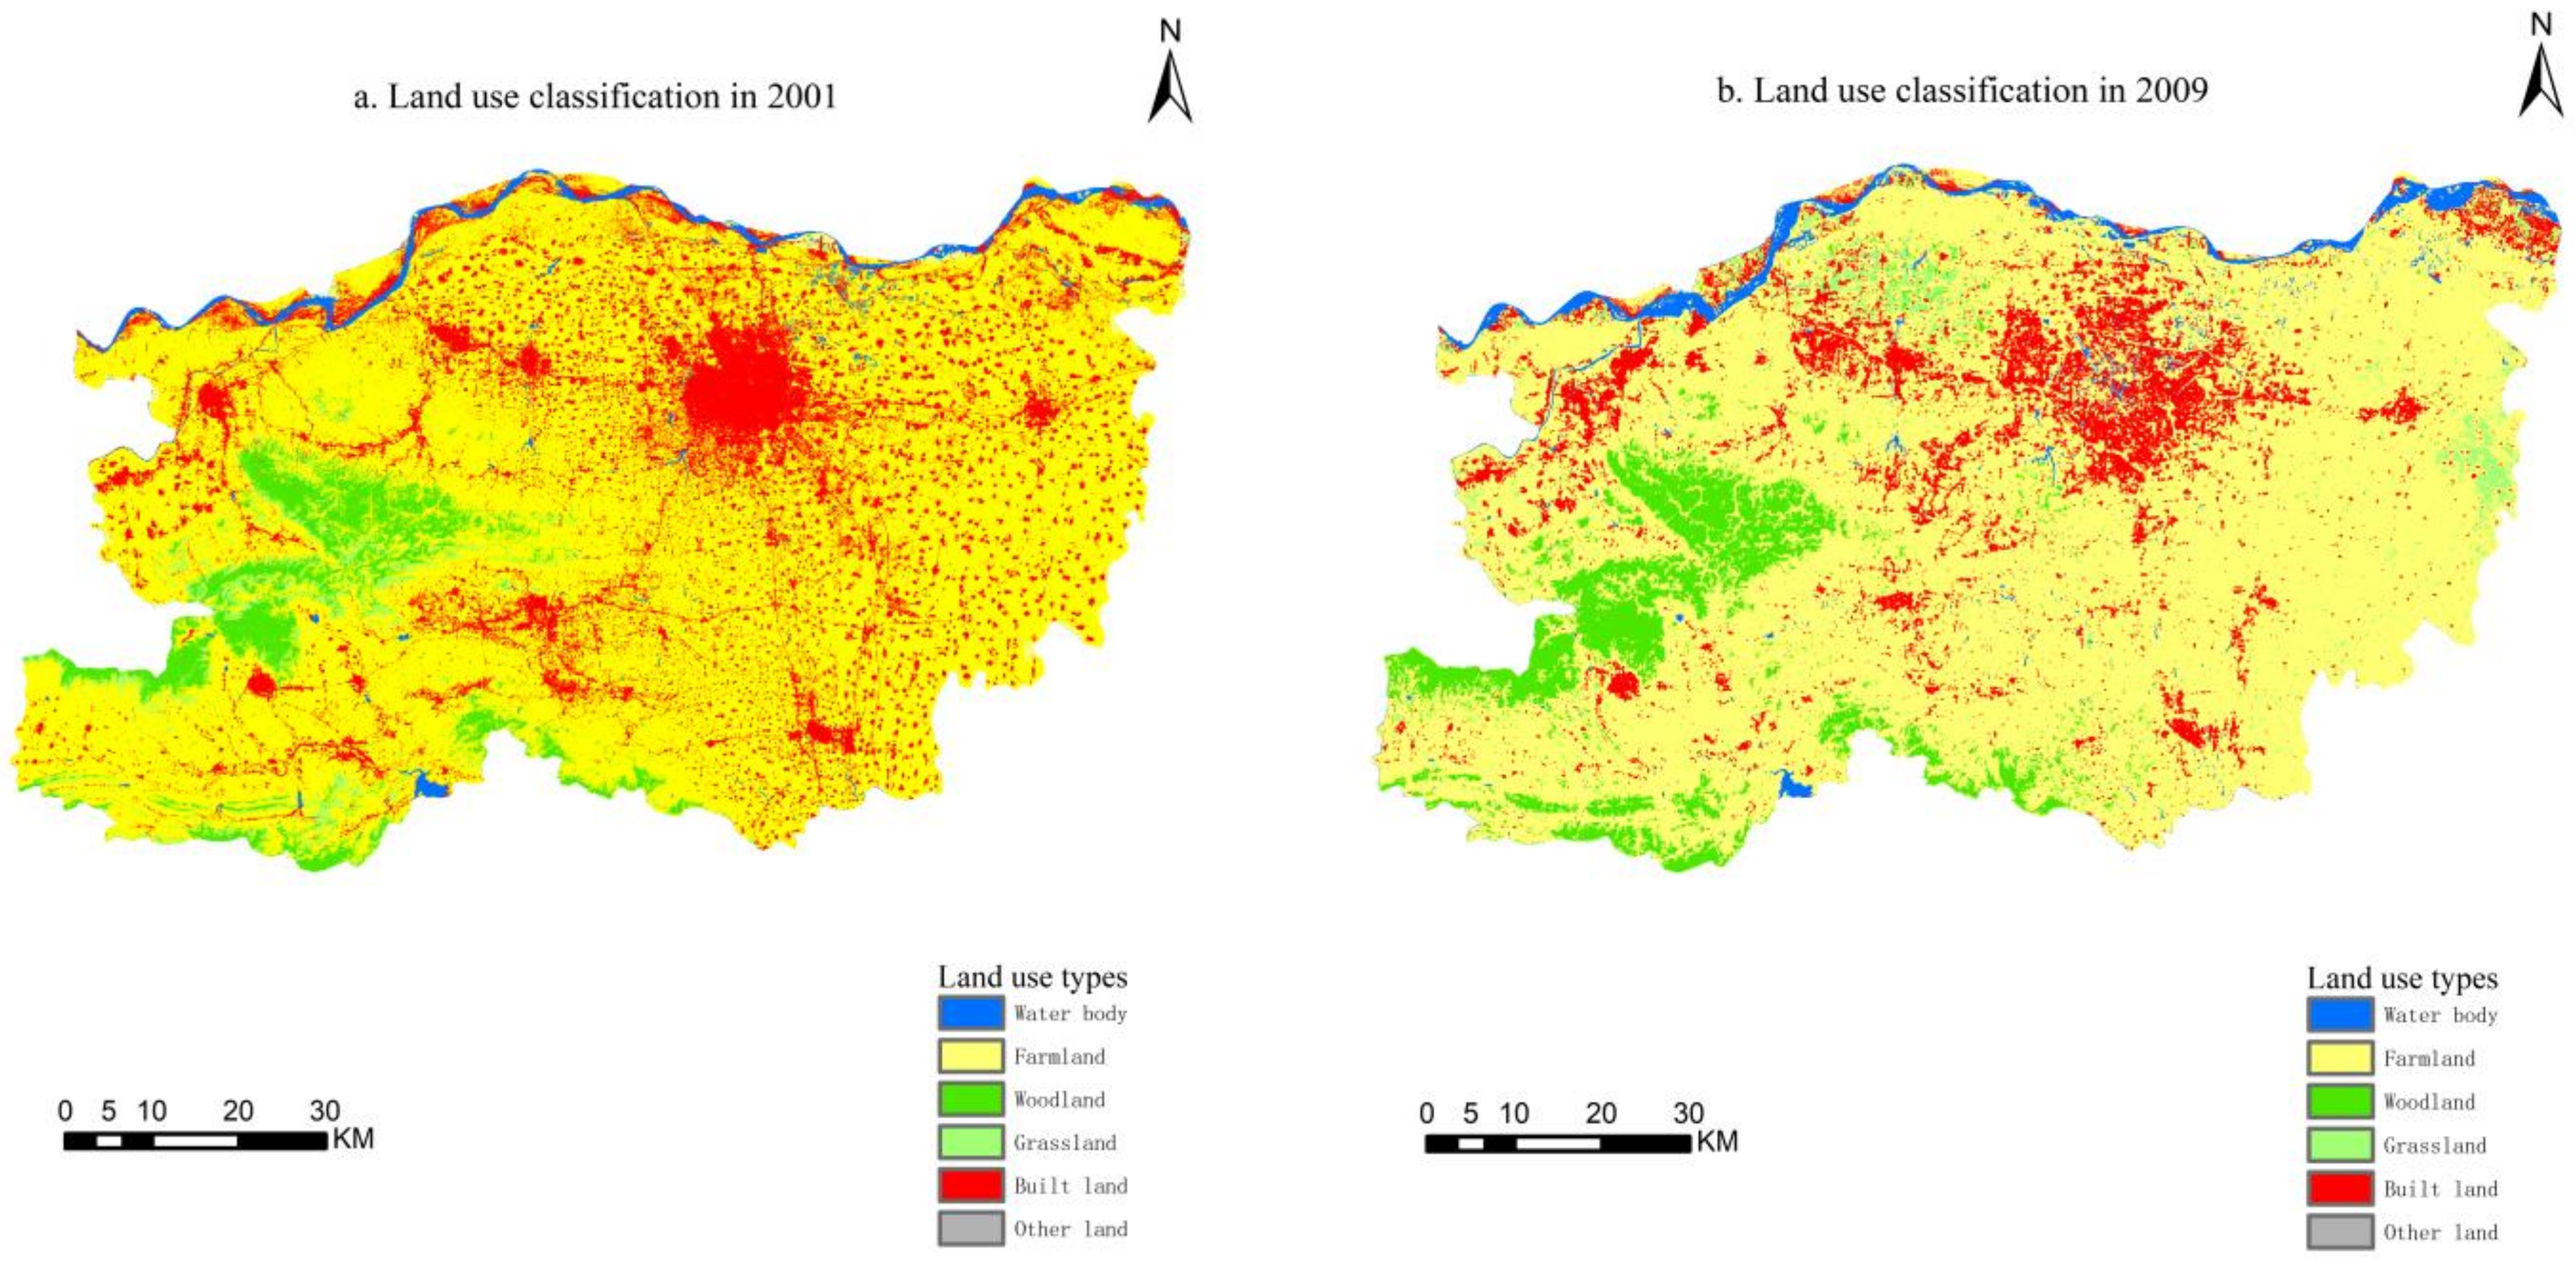
3.2. Spatial and Temporal Distribution of Land-Use Change

Figure 8 shows that, from 2001 to 2020, the structural change in land use in Zhengzhou was dominated by built land and farmland, followed by woodland and water bodies, and the distribution of each land-use type also has strong spatial heterogeneity. Woodland is concentrated in the western part of Zhengzhou and the mountainous and hilly areas in the southwest and is distributed in blocks in the western part, while presenting a linear distribution in the southwestern part. The farmland area is relatively large, with most of it distributed in the plain area around buildings, in the northern and eastern parts of Zhengzhou, and in some mountainous areas. The water body areas mainly comprise the Yellow River and the tributaries that feed into the Yellow River, and a small number of reservoirs and mountainous rivers. Built land is mainly distributed in the central area of Zhengzhou, with a more aggregated spatial distribution range and showing a marked point distribution. The area made up of grassland and other land is small, and the other land is mostly beaches and bare land exposed during the dry period, while grassland is scattered among the other land types. With the rapid promotion of urbanization in the 21st century, the spatial distribution structure of land-cover types in Zhengzhou City in 2009 (Figure 8b) and 2020 (Figure 8c) changed drastically, with built land expanding rapidly and showing a planar distribution across the whole space, while the spatial distribution of farmland shrunk significantly. The spatial distribution pattern of woodland and grassland in the southwest mountainous area is fragmented, and an overall spatial distribution pattern of the interlaced distribution of built land, farmland, and woodland is formed.
According to the image classification results of Zhengzhou in 2001, 2009, and 2020, the areas of and changes in various types of land use are shown in Table 8. We can see that, in 2001, the spatial structure of Zhengzhou City was mainly farmland, woodland, and built land, with areas of 5681.03 km 2 , 390.55 km 2 , and 1272.78 km 2 , respectively, while water bodies, grassland, and other land were 107.78 km 2 , 132.36 km 2 , and 0.54 km 2 , respectively. In 2009, the land-use structure changed significantly, including a decrease of 434.24 km 2 in the area of built land, increases of 219.88 km 2 , 87.57 km 2 , and 90.17 km 2 in the areas of woodland, farmland, and water bodies, respectively, and a smaller change in the area of grassland compared with 2001. In 2020, the area of built land in Zhengzhou City increased significantly compared with 2009, with an increase of 1370.40 km 2 . The area of the other five types of land decreased to varying degrees; as the area of other land is too small, we did not consider it. The areas of farmland, water bodies, woodland, and grassland were 4579.31 km 2 , 117.30 km 2 , 569.88 km 2 , and 109.00 km 2 , respectively, compared to 5768.60 km 2 , 197.95 km 2 , 610.43 km 2 , and 157.52 km 2 in 2009, with decreases of 1189.29 km 2 , 80.65 km 2 , 40.55 km 2 , and 48.52 km 2 , respectively. In terms of the dynamic degree of land-use types, the land-use changes for other land, water bodies, and woodland are more drastic between 2001 and 2009, while changes for farmland, grassland, and built land are more moderate. Changes in built land and other land are more drastic between 2009 and 2020, and, in comparison, the dynamic degree of changes in other land-use types are lower, with none exceeding 4%.
As a result of the above analysis, with the rapid urbanization of Zhengzhou, significant changes took place in the built land, woodland, grassland, and farmland in Zhengzhou during the period of 2001–2020. Specifically, the area of built land increased, and the grassland and farmland area decreased. Water bodies and other land areas showed a slight growth trend. Woodland is mainly located in the highest elevation areas of Zhengzhou, water bodies are mainly located in the lowest elevation areas of Zhengzhou, and most of the buillt land and farmland are located in the plain area of Zhengzhou.

3.3. Land-Use Change Transfer Matrix

In order to quantitatively analyze these changes, a transformation matrix of Zhengzhou City is drawn. The results are shown in Table 9. The values of no transfer or a small transfer area are marked as 0. Although the other land types changed significantly compared with these areas, the proportion is very small. Therefore, it is not analyzed.
The total change in land-use types in Zhengzhou from 2001 to 2020 is 1396.65 km 2 , as shown in Table 9; this accounts for 18.41% of the total area of Zhengzhou City. As for increases, the changed categories, from largest to smallest, are built land, woodland, farmland, water body, and grassland. The newly increased built land mainly consists of altered farmland (946.48   km 2 ), while the newly increased farmland primarily consists of altered water bodies (40.0   km 2 ) and grassland (40.33   km 2 ). The newly increased woodland was converted from farmland (179.30   km 2 ), while the newly increased grassland consists of converted farmland (40.21   km 2 ). There are two possible reasons for this phenomenon; one is that the rapid development of Zhengzhou City has led to the rapid increase in built land, and the other is that the release and implementation of the national policy of returning farmland to woodland and grassland have led to the conversion of some farmland into woodland and grassland.
In summary, from 2001 to 2020, different land types were converted in various ways, mainly built land, farmland, and woodland. Between 2001 and 2020, new built land was largely converted from farmland, accounting for 69.80% of all new land types. With the development of Zhengzhou, the population and economy have increased rapidly, creating increased demand for built land. Therefore, the population and economic growth that occurred during this period is the main reason for the large-scale expansion of urban built land, which directly drives the conversion process of farmland to built land.

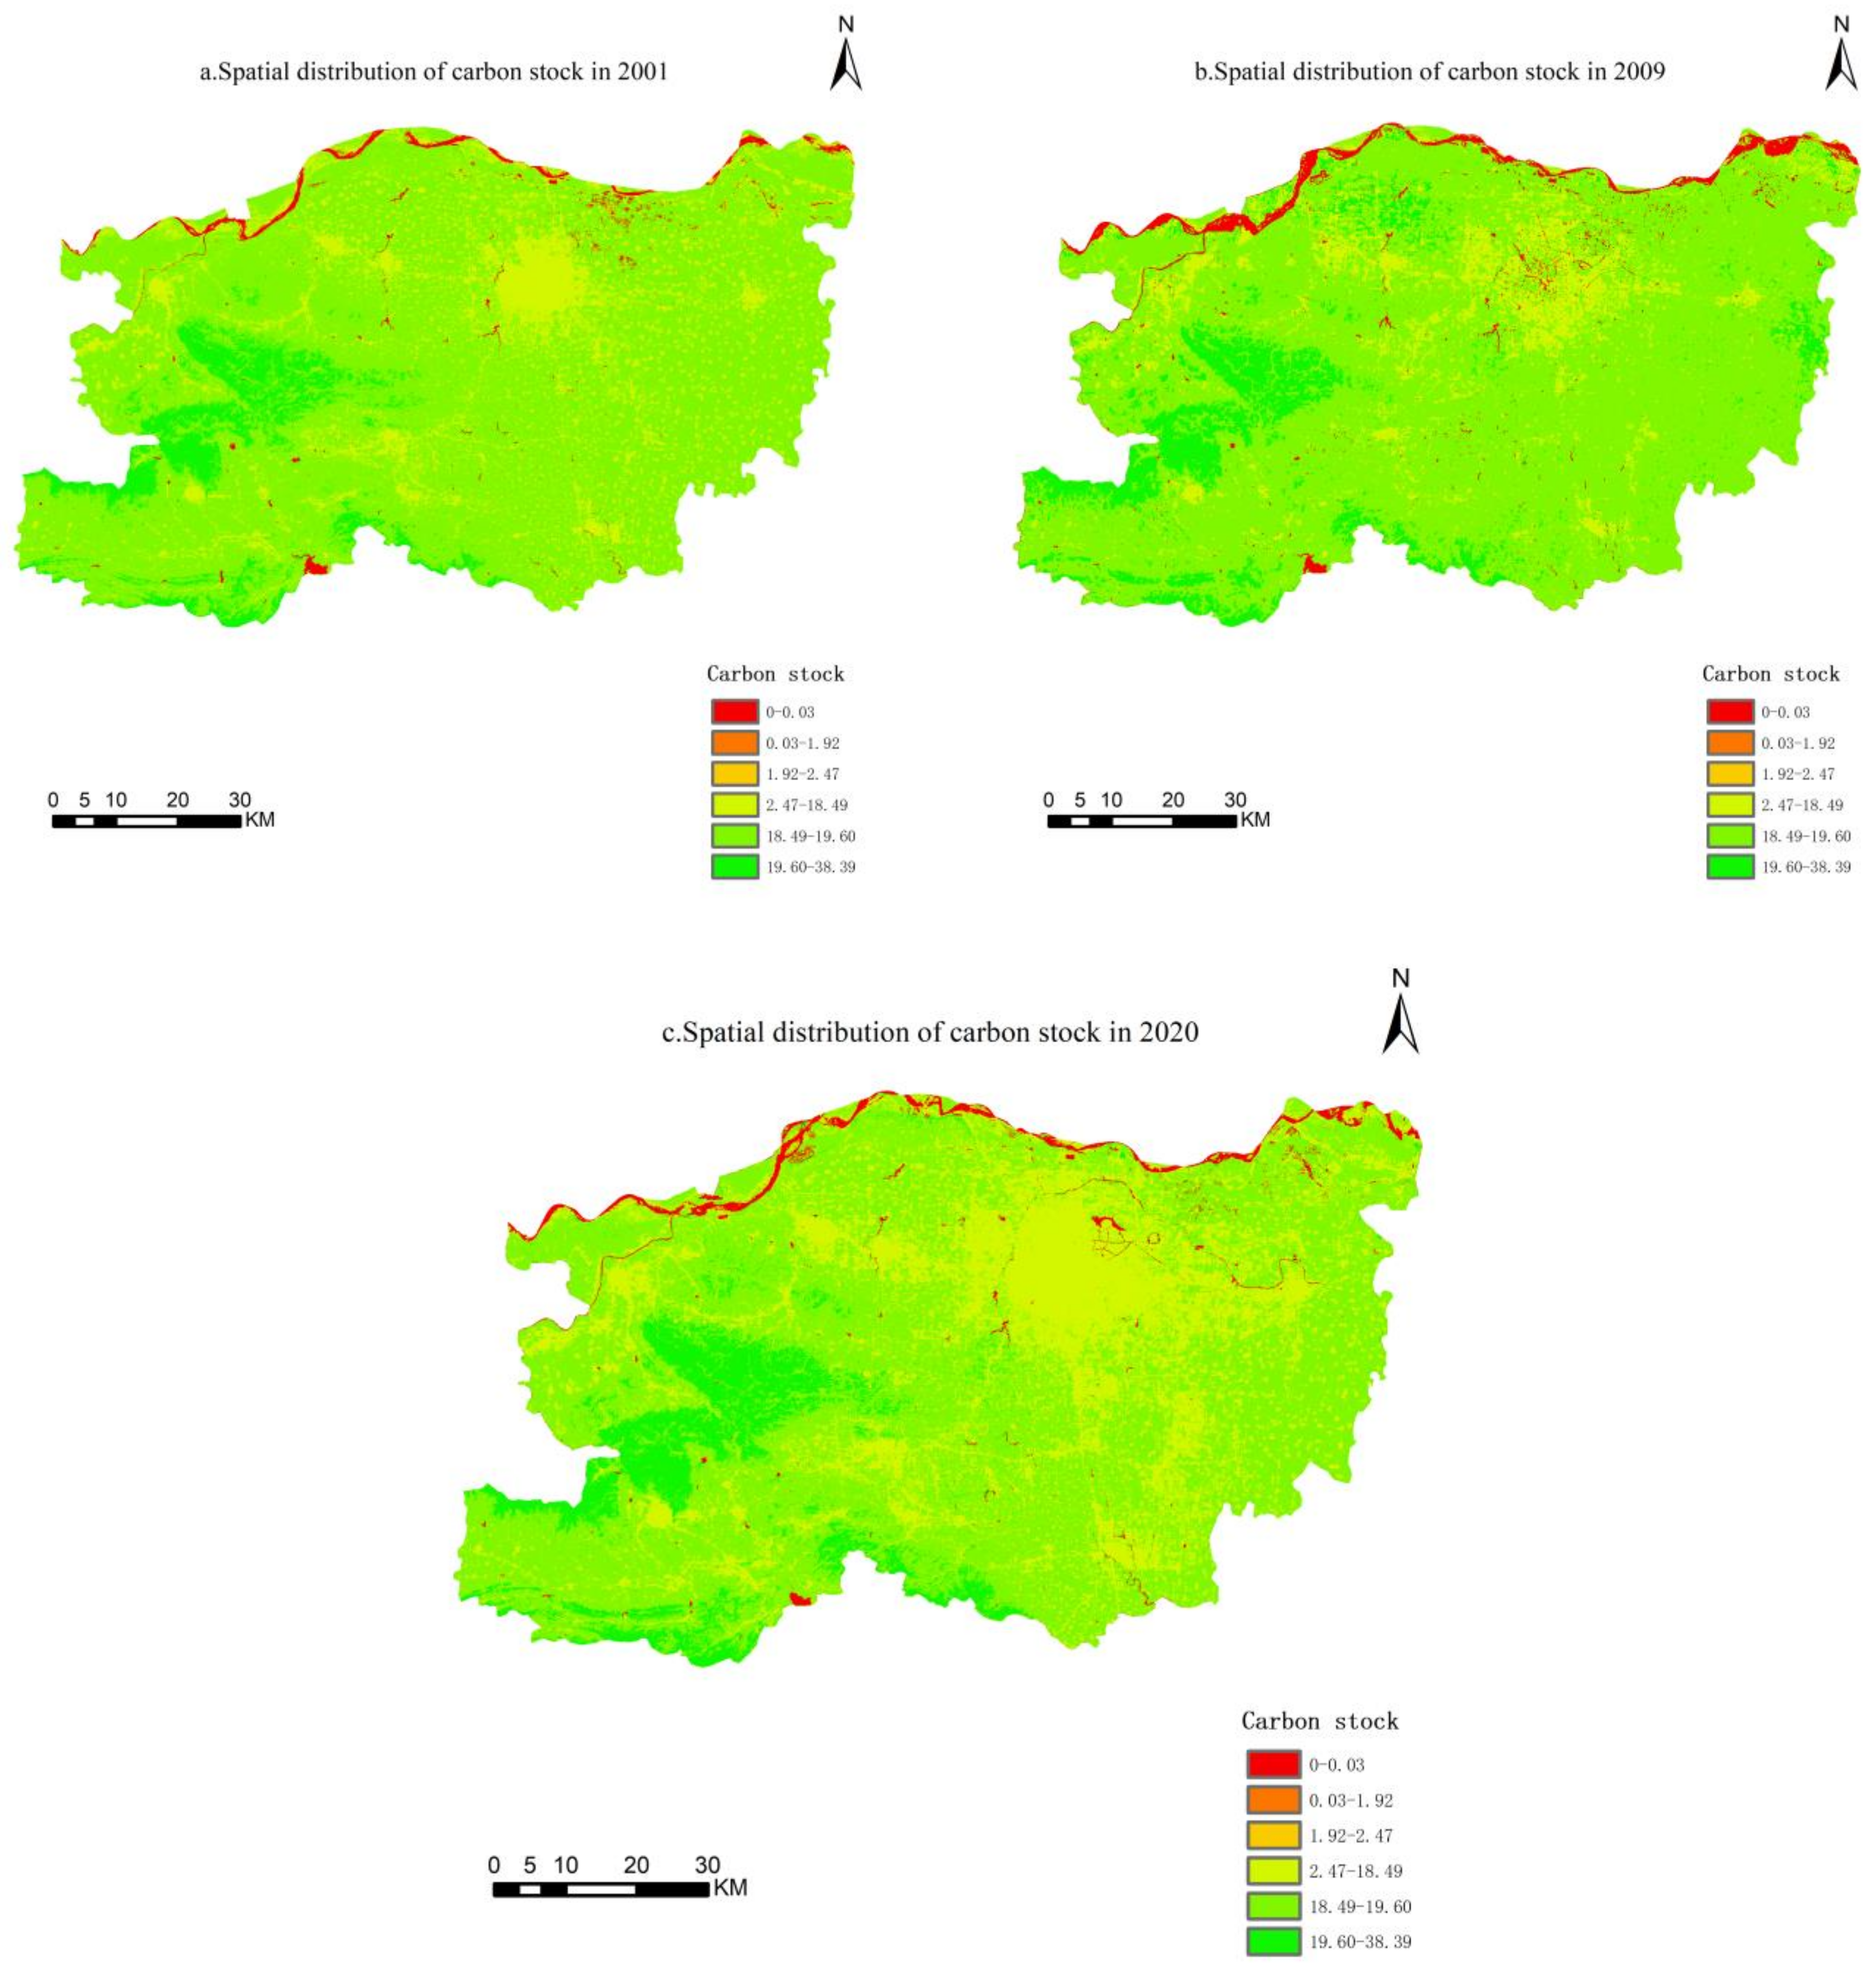
3.4. Carbon Stock Changes

In terms of quantity (Figure 9), the carbon stocks of Zhengzhou in 2001, 2009, and 2020 are 1.36 × 10 8 t, 1.44 × 10 8 t, and 1.21 × 10 8 t, respectively, showing a trend of “increase–rapid decrease”. Specifically, the carbon stock increased by 7.06 × 10 6 t from 2001 to 2009, up 5.21%. From 2009 to 2020, the carbon stock decreased by 2.19 × 10 7 t, a decrease of 15.4%.
Among the land-use types in Zhengzhou, farmland is the type with the highest carbon storage, as shown in Figure 10, accounting for 86.11% of the total regional carbon storage, followed by woodland (9.08%), construction land (2.68%), grassland (2.12%), water bodies (0.02%), and other land (less than 0.01%). The above proportions are obtained from the percentage of carbon storage in 2001. The proportional structure of the carbon reserves did not change significantly across the time points.
In Figure 11, the spatial distribution of carbon stocks in Zhengzhou City from 2001 to 2020 shows roughly the same pattern; specifically, the carbon stocks increase gradually from the east toward the west and southwest, showing a pattern of “high in the west and low in the east”. The low-carbon-stock area is mainly distributed in the north, the high-carbon-stock area is concentrated in the west and southwest, and the medium carbon stock is distributed in the middle of Zhengzhou. Because the same land-use type has the same carbon density value when using the model to estimate carbon reserves, the carbon stock distribution of different values is consistent with the classification results; the high-carbon-storage area corresponds to woodland, and the low-carbon-storage area corresponds to water bodies and other land. In contrast, the corresponding land type in the medium value carbon stock area is built land. Regarding spatial changes, the distribution pattern of carbon reserves in Zhengzhou has changed slightly. The expansion of built land is a highly important reason for this change and has led to a sharp increase in the median area of carbon reserves in the urban center.

3.5. Carbon Stock Changes Due to Land-Use Change

There is mutual conversion between six different types of land-use, because the differences in the area and type of conversion lead to changes in carbon reserves, as shown in Table 10. The conversion area affects the total number of carbon reserves, while the conversion type affects the carbon density.
The transfer away from farmland leads to a reduction in the carbon stock of 1.56 × 10 7 t; this is mainly because most of the farmland is converted into built land with a lower carbon density. Woodland has strong carbon sequestration abilities, and its carbon density is the maximum among the land types, so the transfer from woodland to any other land-use type is not conducive to carbon stock sequestration. The decrease in carbon stocks due to the transfer away from woodland is 2.93 × 10 5 t, while the increased woodland is mainly transferred from farmland, which increases the carbon stock by 1.97 × 10 6 t, accounting for 58.97% of the total increase in the carbon stock. The grassland fluctuated from “increase to rapid decrease”, showing an overall trend of grassland degradation, but the transfer away from grassland increased the carbon storage by 5.66 × 10 4 t. This is because the grassland is converted to woodland and farmland, with higher carbon densities, and the transfer area is large, resulting in an increase in carbon storage that is more significant than the decrease. Water bodies are a land type with relatively large changes in area, mainly being transferred from farmland and built land. The transfer away from water bodies increases the carbon stock by 8.89 × 10 5 t, accounting for 26.61% of the total increase. Built land shows a trend of “decrease–rapid increase”, and is mainly converted from farmland and water bodies. When farmland is converted to built land, it is not conducive to the increase in carbon reserves, with a total decrease of 1.68 × 10 7 t, accounting for 92.23% of the total decrease. Water bodies being converted to built land is conducive to increased carbon storage, with a total increase of 5.58 × 10 4 t. The transfer away from built land increased the carbon storage by 1.52 × 10 5 t, accounting for 4.59% of the total increase in carbon stock. This is because most of the built land is converted to water bodies and farmland; although the area converted to water bodies was larger, the carbon stock increased more when converted to farmland.
With the urbanization of Zhengzhou City, its ecological environment has been damaged, and the overall reduction in carbon stock in Zhengzhou City caused by land-use change between 2001 and 2020 is 1.48 × 10 7 t. The carbon storage increase caused by the positive evolution of the ecosystem (farmland, grassland, and other land types being converted to woodland, and farmland and other land types being converted to grassland) is 2.22 × 10 6 t, accounting for 66.64% of the total increase in carbon storage. The carbon stock reduction caused by the reverse evolution of the ecosystem (the transfer of woodland, farmland, and grassland to built land) is 1.71 × 10 7 t, accounting for 94.11% of the total carbon stock reduction. In other words, the reduction in the carbon stock in Zhengzhou from 2001 to 2020 is mainly due to the conversion of land types with higher carbon intensity, because of reverse ecosystem evolution and the acceleration of urbanization.

4. Discussion

This paper aims to address the problems of the low resolution of Landsat images, the thin edges of objects, and the complex and variable contours of large targets, which lead to the omission of small objects, the misclassification of large targets, and low classification accuracy. As such, this paper proposes the R-MFNet: (1) a BN layer is added to the residual structure, which reduces the drift of internal covariance and prevents the problems of network gradient disappearance and performance degradation that are caused by deepening the network with a residual structure. The shortcut connection is used to effectively fuse the low-level features and high-level features, so as to minimize the loss of effective information from the whole network. (2) To address the problems of the missing and inaccurate extraction of remote sensing image features by existing algorithms, the residual ASPP module is used as the network center to effectively extract multi-scale receptive field features from the feature map and to improve the classification ability of the model to process objects of different sizes. (3) Two attention models are combined to effectively reduce the loss of feature information in the transmission process. The experiment proves that this model has higher classification accuracy than the SVM model and the traditional residual network and provides a high-precision land-use classification map for subsequent carbon storage analysis. This article is consistent with the research results of Han, and, compared to traditional residual networks, fusing multi-scale features can improve accuracy by 2–3% [45]. Elsewhere, Guo improved the attention mechanism by incorporating residual connections, which can enable the network to focus on important features in images and improve classification performance. Adding attention mechanisms to CNN networks can improve accuracy by 2–3%, and adding residual connections further improves accuracy [46]. In the proposed network, we also added an improved attention module using residual connections to the CNN network. Through ablation experiments, it was found that adding this module increased the Kappa coefficient (*100) of the experimental results by 2.18, which is similar to Guo’s experimental results. Huan proposed a multi-scale feature fusion module that is different from the ASPP module, but its core premise is the extraction of features using residual connections and dilation convolutions with different expansion rates [47]. The network structure proposed in this article is centered around an improved ASPP module with residual connections. It is a pyramid structure that can extract multi-scale layered features and fully utilize original information. Through ablation experiments, we demonstrated its core position in classification tasks, and its contribution to the network is stronger than that of the residual attention module; due to its inclusion, the classification of large buildings and linear roads in images is more accurate.
Gao utilizes pre-activation residual networks and traditional residual networks to classify hyperspectral images, and concludes that the overall accuracy of the classification results using pre-activation residual networks is 0.2 to 0.5 percentage points higher than that of results obtained using traditional residual networks. Moreover, it is easier to generate better performance in training, as reaffirmed by our research results [48]. We designed a network containing only a single residual module to demonstrate the superiority of pre-activation residual networks, as shown in Table 11; the results in the table are the average of 10 experiments. From Table 11, it can be seen that, under the same training time and epoch, the loss of pre-activation is smaller. It has therefore been verified that its fitting speed is fast and its application value is high.
By analyzing the socio-economic development and land-use change factors in Zhengzhou from 2001 to 2020, we found that the main factors affecting the changes in carbon stock in Zhengzhou are the national ecological protection policies and urbanization in Zhengzhou. The state attaches great importance to ecological protection, has introduced many ecological protection policies, and has carried out many ecological protection projects. These ecological protection policies and measures have promoted land conservation and optimized regional land-use patterns. In particular, with the release and implementation of the policy of restoring farmland to woodland and grassland [49], significant changes have taken place in the types of land use in Zhengzhou from 2001 to 2020. The main impact of such projects is the shift from farmland to woodland and grassland, which subsequently led to marked changes in carbon storage. Deng showed that reforestation projects contributed many carbon sinks, which can offset some carbon emissions [50]. Shao concluded that, under the intensive green ecological conservation scenario in Beijing, more built land within the urban area is converted to other ecological land with higher carbon intensity values, and the area of the watershed also increases [51]. The conversion of farmland and grassland to built land is reduced, predicting a carbon stock of 16.39 × 10 6 t in 2035, which is 7.5 × 10 5 t higher than the lowest natural evolution scenario. Based on the research of Deng and Shao, we can surmise that, under the ecological protection policies, carbon storage will increase, which is consistent with our research results. Through experiments, we found that the policy of restoring farmland to forests and grassland in Zhengzhou has led to the positive evolution of land-use types, which accounts for about 66% of the total increase in carbon storage. Therefore, ecological projects, land management policies, and land-use changes caused by the ecological management of nature reserves can facilitate the maintenance of and increase in carbon stocks.
In addition, with the economic development and urbanization of Zhengzhou City, Zhengzhou’s carbon reserves will continue to decrease, forcing the government to introduce some arable land protection policies to protect the most basic arable land from damage. Zhu showed that the rapid economic development of Zhejiang Province has resulted in a substantial encroachment of farmland and grassland, which led to a decrease in the carbon stock of 17.5 × 10 9 t from 1990 to 2010 [52]. Lin concluded that, in the natural development scenario of Guangdong Province, the carbon stock of the coastal cities around the Pearl River Estuary will continue to decline, mainly because of the decrease in the area of farmland and the rapid increase in built land [53]. The research of Zhu and Lin shows that, with the rapid progress of urbanization, farmland has decreased across the board and built land has increased significantly, which is consistent with our research results. This is the main reason for the reduction in carbon storage, which is also consistent with our research results, because the reverse evolution of land use in Zhengzhou has reduced carbon storage, accounting for about 94% of the total reduction. Thus, we obtained the following results from our carbon storage research: the effect of land-use changes in different transfer directions on the carbon stocks of ecosystems is twofold. Considering their impact on carbon storage under positive ecosystems evolution, it is clear that Zhengzhou should continue to implement and consolidate the relevant policies.
Different land types have different carbon density values, so it is particularly important to study whether the carbon density values used are accurate. Carbon density is influenced by multiple factors such as the hydrological conditions, climate, and soil type [54]. When existing studies use a model to assess carbon stocks, they are mostly based on the carbon density that comes with that model. They are modified by combining field surveys and related studies, which greatly improves the universality and scientific validity of the model [55]. Because the carbon density values of Zhengzhou cannot be determined, the carbon density of regions with similar geographical conditions to Zhengzhou was corrected. However, the carbon stock module assumes that the ecosystem carbon density data remain constant over time, but the actual results show that there are variations, so the use of constant carbon density data may lead to errors in the estimations. Therefore, to further improve the estimation accuracy, the monitoring and investigation of the carbon densities of different land types need to be strengthened in future studies to obtain long-term and dynamic observation data, in order to reduce the uncertainty caused by carbon density.

5. Conclusions

Based on the Landsat TM/OLI images of Zhengzhou City, R-MFNet was proposed to classify the land use of Zhengzhou City to obtain high-precision land-use data. In addition, some documents were collected to obtain the national and local carbon density data; by correcting these values, the carbon density values of Zhengzhou were obtained. The InVEST model was used to evaluate some of the impacts of land-use change on carbon stocks between 2001 and 2020, and the following conclusions can be drawn.
From 2001 to 2020, the land use in Zhengzhou changed significantly, with transfers between more or less every land type, resulting in increases in woodland, built land, water bodies, and other land, and decreases in farmland and grassland. Regarding the speed of the change in land-use types (the dynamic index), that for built land is the fastest, while that for the other land-use types is relatively slow.
According to the results of the InVEST model, the carbon stocks in Zhengzhou in 2001, 2009, and 2020 are 1.36 × 10 8 t, 1.44 × 10 8 t, and 1.21 × 10 8 t, respectively, showing the trend of “increase–rapid decrease”, with an overall decrease of 1.48 × 10 7 t. The carbon stocks in the west and southwest of Zhengzhou are higher, while those in the central part are lower. The conversion of farmland and woodland to other types reduced carbon storage (other land uses are not considered here). A possible reason for this is that these land types are mainly converted to built land, which has low carbon intensity. Therefore, the reduction in farmland and the expansion of built land are important reasons for the reduction in regional carbon reserves.
In the future, if the urbanization of Zhengzhou is not prevented, its carbon reserves will continue to decrease. In order to actively respond to the national “double-carbon goal”, Zhengzhou should strictly implement the farmland protection policy, prevent the disorderly expansion of the city, coordinate ecological construction, and reasonably determine the scale of new built land. These measures will enable it to perform well in terms of ecological protection while maintaining high-quality development.

Author Contributions

Conceptualization, C.W. and K.Y.; methodology, K.Y.; validation, K.Y. and P.Z.; formal analysis, C.W. and K.Y.; investigation, K.Y.; resources, K.Y.; data curation, C.W. and W.Y.; writing—original draft preparation, K.Y.; writing—review and editing, C.W., W.Y., H.Q., H.X. and B.L.; visualization, K.Y.; supervision, C.W.; project administration, C.W. and W.Y.; funding acquisition, C.W. All authors have read and agreed to the published version of the manuscript.

Funding

This study was supported by the National Natural Science Foundation of China (NSFC) (42271124), Henan Provincial Science and Technology Research Project (232102211019, 222102210131), the Key Research Project Fund of Institution of Higher Education in Henan Province (23A520029), and Japan Society for the Promotion of Science (JSPS) KAKENHI Grant (No. 20K12146).

Data Availability Statement

This study analyzed publicly available datasets, which can be found here: Geospatial Data Cloud (https://www.gscloud.cn/, accessed on 12 April 2023).

Acknowledgments

The author would like to thank all institutions and researchers who provided code and data related to the experiment.

Conflicts of Interest

The authors declare no conflict of interest.

References

  1. Houghton, R.A. Revised estimates of the annual net flux of carbon to the atmosphere from changes in land use and land management 1850–2000. Tellus B Chem. Phys. Meteorol. 2003, 55, 378. [Google Scholar] [CrossRef]
  2. Grelle, A.; Hedwall, P.-O.; Strömgren, M.; Håkansson, C.; Bergh, J. From source to sink—Recovery of the carbon balance in young forests. Agric. For. Meteorol. 2023, 330, 109290. [Google Scholar] [CrossRef]
  3. Schimel, D.S.; House, J.I.; Hibbard, K.A.; Bousquet, P.; Ciais, P.; Peylin, P.; Braswell, B.H.; Apps, M.J.; Baker, D.; Bondeau, A.; et al. Recent patterns and mechanisms of carbon exchange by terrestrial ecosystems. Nature 2001, 414, 169–172. [Google Scholar] [CrossRef] [PubMed]
  4. Lal, R. Soil Carbon Sequestration Impacts on Global Climate Change and Food Security. Science 2004, 304, 1623–1627. [Google Scholar] [CrossRef] [PubMed]
  5. Meena, V.S.; Mondal, T.; Pandey, B.M.; Mukherjee, A.; Yadav, R.P.; Choudhary, M.; Singh, S.; Bisht, J.K.; Pattanayak, A. Land use changes: Strategies to improve soil carbon and nitrogen storage pattern in the mid-Himalaya ecosystem, India. Geoderma 2018, 321, 69–78. [Google Scholar] [CrossRef]
  6. Naidoo, L.; van Deventer, H.; Ramoelo, A.; Mathieu, R.; Nondlazi, B.; Gangat, R. Estimating above ground biomass as an indicator of carbon storage in vegetated wetlands of the grassland biome of South Africa. Int. J. Appl. Earth Obs. Geoinf. 2019, 78, 118–129. [Google Scholar] [CrossRef]
  7. Qiu, S.; Yang, H.; Zhang, S.; Huang, S.; Zhao, S.; Xu, X.; He, P.; Zhou, W.; Zhao, Y.; Yan, N.; et al. Carbon storage in an arable soil combining field measurements, aggregate turnover modeling and climate scenarios. CATENA 2023, 220, 106708. [Google Scholar] [CrossRef]
  8. Lindroos, A.-J.; Mäkipää, R.; Merilä, P. Soil carbon stock changes over 21 years in intensively monitored boreal forest stands in Finland. Ecol. Indic. 2022, 144, 109551. [Google Scholar] [CrossRef]
  9. Tang, L.; Wu, J.; Yu, L.; Bao, Q. Carbon emissions trading scheme exploration in China: A multi-agent-based model. Energy Policy 2015, 81, 152–169. [Google Scholar] [CrossRef]
  10. Zhengzhou People’s Government. Available online: https://www.zhengzhou.gov.cn/ (accessed on 12 April 2023).
  11. Zhang, C.; Ju, W.; Chen, J.M.; Wang, X.; Yang, L.; Zheng, G. Disturbance-Induced Reduction of Biomass Carbon Sinks of China’s Forests in Recent Years. Environ. Res. Lett. 2015, 10, 114021. [Google Scholar] [CrossRef]
  12. Sohl, T.L.; Sleeter, B.M.; Zhu, Z.; Sayler, K.L.; Bennett, S.; Bouchard, M.; Reker, R.; Hawbaker, T.; Wein, A.; Liu, S.; et al. A land-use and land-cover modeling strategy to support a national assessment of carbon stocks and fluxes. Appl. Geogr. 2012, 34, 111–124. [Google Scholar] [CrossRef]
  13. Fu, Y.; Lu, X.; Zhao, Y.; Zeng, X.; Xia, L. Assessment Impacts of Weather and Land Use/Land Cover (LULC) Change on Urban Vegetation Net Primary Productivity (NPP): A Case Study in Guangzhou, China. Remote Sens. 2013, 5, 4125–4144. [Google Scholar] [CrossRef]
  14. Li, C.; Sun, H.; Wu, X.; Han, H. Dataset of the net primary production on the Qinghai-Tibetan Plateau using a soil water content improved Biome-BGC model. Data Brief. 2019, 27, 104740. [Google Scholar] [CrossRef]
  15. Liu, T.Y.; Mao, F.J.; Li, X.J.; Xing, L.Q.; Dong, L.F.; Zheng, J.L.; Zhang, M.; Du, H.Q. Spatiotemporal dynamic simulation on aboveground carbon storage of bamboo forest and its influence factors in Zhejiang Province, China. Ying Yong Sheng Tai Xue Bao 2019, 30, 1743–1753. [Google Scholar] [CrossRef]
  16. Babbar, D.; Areendran, G.; Sahana, M.; Sarma, K.; Raj, K.; Sivadas, A. Assessment and prediction of carbon sequestration using Markov chain and InVEST model in Sariska Tiger Reserve, India. J. Clean. Prod. 2021, 278, 123333. [Google Scholar] [CrossRef]
  17. Zhao, S.; Liu, S.; Sohl, T.; Young, C.; Werner, J. Land use and carbon dynamics in the southeastern United States from 1992 to 2050. Environ. Res. Lett. 2013, 8, 044022. [Google Scholar] [CrossRef]
  18. Mendoza-Ponce, A.; Corona-Núñez, R.; Kraxner, F.; Leduc, S.; Patrizio, P. Identifying effects of land use cover changes and climate change on terrestrial ecosystems and carbon stocks in Mexico. Glob. Environ. Chang. 2018, 53, 12–23. [Google Scholar] [CrossRef]
  19. Hou, J.K.; Chen, J.J.; Zhang, K.Q.; Zhou, G.Q.; You, H.T.; Han, X.W. Temporal and Spatial Variation Characteristics of Carbon Storage in the Source Region of the Yellow River Based on InVEST and GeoSoS-FLUS Models and Its Response to Different Future Scenarios. Environ. Sci. 2022, 43, 5253–5262. [Google Scholar]
  20. Yang, L.W.; Zhao, J.; Zhu, J.T.; Liu, L.; Zhang, P. Spatial—Temporal change and prediction of carbon stock in the ecosystem of Xi’an based on PLUS and InVEST models. Remote Sens. Nat. Resour. 2022, 34, 175–182. [Google Scholar]
  21. Bengio, Y.; Courville, A.; Vincent, P. Representation learning: A review and new perspectives. IEEE Trans. Pattern Anal. Mach. Intell. 2013, 35, 1798–1828. [Google Scholar] [CrossRef]
  22. Li, X.-J.; Yang, G.-H. Adaptive Fault-Tolerant Synchronization Control of a Class of Complex Dynamical Networks With General Input Distribution Matrices and Actuator Faults. IEEE Trans. Neural Netw. Learn. Syst. 2017, 28, 559–569. [Google Scholar] [CrossRef] [PubMed]
  23. Gray, P.C.; Chamorro, D.F.; Ridge, J.T.; Kerner, H.R.; Ury, E.A.; Johnston, D.W. Temporally Generalizable Land Cover Classification: A Recurrent Convolutional Neural Network Unveils Major Coastal Change through Time. Remote Sens. 2021, 13, 3953. [Google Scholar] [CrossRef]
  24. Zhang, M.; Liu, Z.; Feng, J.; Liu, L.; Jiao, L. Remote Sensing Image Change Detection Based on Deep Multi-Scale Multi-Attention Siamese Transformer Network. Remote Sens. 2023, 15, 842. [Google Scholar] [CrossRef]
  25. Yuan, M.; Ren, D.; Feng, Q.; Wang, Z.; Dong, Y.; Lu, F.; Wu, X. MCAFNet: A Multiscale Channel Attention Fusion Network for Semantic Segmentation of Remote Sensing Images. Remote Sens. 2023, 15, 361. [Google Scholar] [CrossRef]
  26. Gong, M.; Zhao, J.; Liu, J.; Miao, Q.; Jiao, L. Change Detection in Synthetic Aperture Radar Images Based on Deep Neural Networks. IEEE Trans. Neural Netw. Learn. Syst. 2016, 27, 125–138. [Google Scholar] [CrossRef]
  27. Wang, C.; Zhang, Y.; Wu, X.; Yang, W.; Qiang, H.; Lu, B.; Wang, J. R-IMNet: Spatial-Temporal Evolution Analysis of Resource-Exhausted Urban Land Based on Residual-Intelligent Module Network. Remote Sens. 2022, 14, 2185. [Google Scholar] [CrossRef]
  28. Liu, B.; Li, Y.; Li, G.; Liu, A. A Spectral Feature Based Convolutional Neural Network for Classification of Sea Surface Oil Spill. ISPRS Int. J. Geo-Inf. 2019, 8, 160. [Google Scholar] [CrossRef]
  29. Zheng, Z.Z.; Liu, H.X.; Wang, Z.H.; Lu, P.; Shen, X.K.; Tang, P.F. Improved 3D-CNN-based hyperspectral image classification method. Remote Sens. Nat. Resour. 2021, 13, 2216. [Google Scholar]
  30. Qiao, X.X.; Shi, W.Z.; Liu, Y.X.; Lin, Y.H.; He, D.Y.; Wang, L.; Wen, P.Y. Remote Sensing Image Scene Classification Based on ResNet and Dual Attention Mechanism. Comput. Syst. Appl. 2021, 30, 243–248. [Google Scholar] [CrossRef]
  31. Xu, S.J.; Zhang, R.X.; Meng, Y.B.; Liu, G.H.; Han, J.Q. Fusion of fractal geometric features Resnet remote sensing image building segmentation. Opt. Precis. Eng. 2022, 30, 2006–2020. [Google Scholar] [CrossRef]
  32. Li, A.Q.; Ma, L.; Yu, H.L.; Zhang, H.B. Research on the classification of typical crops in remote sensing images by improved U-Net algorithm. Infrared Laser Eng. 2022, 51, 428–434. [Google Scholar]
  33. Wang, D.; Guo, Y.; Liu, C.; Tang, P.; Jiao, J.; Kong, W.; Liu, Y.; Kong, D. Identification of High-Value Land for Green Infrastructure in Urban Fringe Areas: A Case Study of Zhengzhou, Henan Province, China. J. Urban. Plann. Dev. 2023, 149, 05023005. [Google Scholar] [CrossRef]
  34. Wang, C.Y.; Tang, Z.M.; Wu, X.F.; Li, C.C.; Zhang, H.B. Semi-supervised Land Use Classification Based on Particle Swarm Optimization Probabilistic Neural Network. Trans. Chin. Soc. Agric. Mach. 2022, 53, 167–176. [Google Scholar]
  35. Xu, L.; He, N.P.; Yu, G.R. A dataset of carbon density in Chinese terrestrial ecosystems (2010s). Sci. Data Bank 2019, 4, 90–96. [Google Scholar]
  36. Zhang, P.P.; Li, Y.H.; Yin, H.R.; Chen, Q.T.; Dong, Q.D.; Zhu, L.Q. Spatio-temporal variation and dynamic simulation of ecosystem carbon storage in the north-south transitional zone of China. J. Nat. Resour. 2022, 37, 1183–1197. [Google Scholar] [CrossRef]
  37. Li, K. Vegetation and soil carbon storage in China. Sci. China Ser. D 2004, 47, 49. [Google Scholar] [CrossRef]
  38. Alam, S.A.; Starr, M.; Clark, B.J.F. Tree biomass and soil organic carbon densities across the Sudanese woodland savannah: A regional carbon sequestration study. J. Arid. Environ. 2013, 89, 67–76. [Google Scholar] [CrossRef]
  39. Giardina, C.; Ryan, M. Evidence That Decomposition Rates of Organic Carbon in Mineral Soil Do Not Vary with Temperature. Nature 2000, 404, 858–861. [Google Scholar] [CrossRef]
  40. Chen, G.S.; Yang, Y.S.; Xie, J.S.; Du, Z.X.; Zhang, J. Total below ground carbon allocation in china’s forests. Acta Ecol. Sin. 2007, 27, 5148–5157. [Google Scholar]
  41. He, K.; Zhang, X.; Ren, S.; Sun, J. Identity Mappings in Deep Residual Networks. In Computer Vision–ECCV 2016, Proceedings of the 14th European Conference, Amsterdam, The Netherlands, October 11–14, 2016; Springer: Berlin/Heidelberg, Germany, 2016. [Google Scholar] [CrossRef]
  42. Zhang, F.; Zhan, J.; Zhang, Q.; Yao, L.; Liu, W. Impacts of Land Use/Cover Change on Terrestrial Carbon Stocks in Uganda. Phys. Chem. Earth Parts ABC 2017, 101, 195–203. [Google Scholar] [CrossRef]
  43. Li, Y.; Liu, Z.; Li, S.; Li, X. Multi-Scenario Simulation Analysis of Land Use and Carbon Storage Changes in Changchun City Based on FLUS and InVEST Model. Land 2022, 11, 647. [Google Scholar] [CrossRef]
  44. Du, L.; Lu, Z.; Li, D. Broodstock breeding behaviour recognition based on Resnet50-LSTM with CBAM attention mechanism. Comput. Electron. Agric. 2022, 202, 107404. [Google Scholar] [CrossRef]
  45. Han, Y.; Cui, P.; Zhang, Y.; Zhou, R.; Yang, S.; Wang, J. Remote Sensing Sea Ice Image Classification Based on Multilevel Feature Fusion and Residual Network. Math. Probl. Eng. 2021, 2021, e9928351. [Google Scholar] [CrossRef]
  46. Guo, D.; Xia, Y.; Luo, X. Scene Classification of Remote Sensing Images Based on Saliency Dual Attention Residual Network. IEEE Access 2020, 8, 6344–6357. [Google Scholar] [CrossRef]
  47. Huan, H.; Li, P.; Zou, N.; Wang, C.; Xie, Y.; Xie, Y.; Xu, D. End-to-End Super-Resolution for Remote-Sensing Images Using an Improved Multi-Scale Residual Network. Remote Sens. 2021, 13, 666. [Google Scholar] [CrossRef]
  48. Gao, H.; Yang, Y.; Yao, D.; Li, C. Hyperspectral Image Classification With Pre-Activation Residual Attention Network. IEEE Access 2019, 7, 176587–176599. [Google Scholar] [CrossRef]
  49. Zhengzhou City Policy Information Publicity. Available online: https://public.zhengzhou.gov.cn/ (accessed on 12 April 2023).
  50. Deng, L.; Liu, S.; Kim, D.G.; Peng, C.; Sweeney, S.; Shangguan, Z. Past and future carbon sequestration benefits of China’s grain for green program. Glob. Environ. Chang. 2017, 47, 13–20. [Google Scholar] [CrossRef]
  51. Shao, Z.; Chen, R.; Zhao, J.; Xia, C.Y.; He, Y.T.; Tang, F.Y. Spatio-temporal evolution and prediction of carbon storage in Beijing’s ecosystem based on Flus and InVEST model. Acta Ecol. Sin. 2022, 42, 9456–9469. [Google Scholar]
  52. Zhu, E.; Deng, J.; Zhou, M.; Gan, M.; Jiang, R.; Wang, K.; Shahtahmassebi, A. Carbon emissions induced by land-use and land-cover change from 1970 to 2010 in Zhejiang, China. Sci. Total Environ. 2019, 646, 930–939. [Google Scholar] [CrossRef]
  53. Lin, T.; Yang, M.Z.; Wu, D.F.; Liu, F.; Yang, J.H.; Wang, Y.J. Spatial correlation and prediction of land use carbon storage based on the InVEST-PLUS model- A case study in Guangdong. China Environ. Sci. 2022, 42, 4827–4839. [Google Scholar] [CrossRef]
  54. Clerici, N.; Cote-Navarro, F.; Escobedo, F.J.; Rubiano, K.; Villegas, J.C. Spatio-temporal and cumulative effects of land use-land cover and climate change on two ecosystem services in the Colombian Andes. Sci. Total Environ. 2019, 685, 1181–1192. [Google Scholar] [CrossRef] [PubMed]
  55. Li, L.; Song, Y.; Wei, X.; Dong, J. Exploring the impacts of urban growth on carbon storage under integrated spatial regulation: A case study of Wuhan, China. Ecol. Indic. 2020, 111, 106064. [Google Scholar] [CrossRef]
Figure 1. Location map of Zhengzhou City.
Remotesensing 15 02823 g001
Figure 2. The overall structure of the network.
Remotesensing 15 02823 g002
Figure 3. Structure of a residual unit.
Remotesensing 15 02823 g003
Figure 4. Structure of the dual residual attention module.
Remotesensing 15 02823 g004
Figure 5. Structure of the R-ASPP module.
Remotesensing 15 02823 g005
Figure 6. Comparison of model classification effects. (a) True color image of a region in Zhengzhou; (b) Label; (c) 2D-CNN; (d) Resnet; (e) SVM; (f) R-MFNet.
Remotesensing 15 02823 g006
Figure 7. Contribution ratio of different combinations of modules.
Remotesensing 15 02823 g007
Figure 8. Land-use maps and elevation map of Zhengzhou City classified by R-MFNet.
Remotesensing 15 02823 g008aRemotesensing 15 02823 g008b
Figure 9. Change trend of carbon stock in Zhengzhou from 2001 to 2020.
Remotesensing 15 02823 g009
Figure 10. Distribution of carbon storage proportion of various land-use types in Zhengzhou.
Remotesensing 15 02823 g010
Figure 11. Distribution of the carbon stock in Zhengzhou.
Remotesensing 15 02823 g011
Table 1. Interpretation signs of different land-use types in Zhengzhou.
Land-Use TypeRemote Sensing Image CharacteristicsInterpretive Marker
FarmlandAppearing green in the S, N and B bandsDistributed throughout the study area
WoodlandAppearing red in the N, R and G bandsMostly in the western mountains
GrasslandMainly green and dark greenSporadic distribution
Water bodyBlue in the N, R and G bandsLinear distribution or point distribution
Built landDark purple in the N, R and G bandsDotted or facial distribution with strong aggregation
Other landMostly brown in the R, G and B bandConcentrated in the mountainous and bare area
Table 2. Total samples, training samples and verified samples in Zhengzhou City.
Total Number of SamplesTraining SamplesValidation Samples
200120092020200120092020200120092020
Farmland22,54426,50539,9356786793411,92015,75818,57128,015
Woodland485615,55011,577146847423562338810,8088015
Grassland1160139120363524277238089641313
Water body12,544599819,0263789178556038755421313,423
Built land54,35739,38072,36616,37111,84622,39837,98627,53449,968
Other land68954326202281547604613891860
Table 3. Carbon density of different land-use types corrected by meteorological data in Zhengzhou City ( t / hm 2 ).
Land-Use Type
C a b o v e
C b e l o w  
C s o i l  
C d e a d
Farmland16.1976.86103.249.35
Woodland40.38110.38151.2413.44
Grassland33.6282.3895.156.93
Water body0.29000
Built land2.3826.1900
Other land1.24020.570
Table 4. Comparison of classification accuracy of different models.
SVM *2D-CNNResNetR-MFNet
Water body90.23 a84.5392.9496.61
Built land
Farmland
94.44
83.76
98.56
96.89
98.16
98.46
98.98
99.64
OA/%89.1295.2397.8699.19
Kappa0.870.930.960.98
Note: * represents a traditional machine learning algorithm, a represents the user’s accuracy.
Table 5. Accuracy analysis of classification results of different years by using R-MFNet.
200120092020
OA/%95.5498.6998.43
Kappa0.940.970.98
Table 6. Comparison of classification accuracy of typical regional for classical methods.
1D-CNNU-netHybirdSNR-MFNet
Farmland92.2793.6696.0598.03
Woodland95.7797.2399.23100.00
Grassland90.1193.2393.0996.70
Water body92.9490.2391.3196.61
Built land98.4697.4999.4799.64
Other land97.2395.2395.7698.73
OA/%93.1395.0896.4798.87
Kappa0.920.940.950.98
Table 7. Ablation experiments with the R-MFNet model.
Module Combination Method(a)(b)OA/%Kappa
(1)99.820.9947
(2)×98.360.9809
(3)×97.110.9749
(4)××96.720.9531
Note: (a) is the residual attention mechanism module; (b) is the residual ASPP module; √ represents the inclusion of the module; × indicates that the module is not included.
Table 8. Change and dynamic degree of land-use types in Zhengzhou ( km 2 ).
200120092020Amount of ChangeDynamics/%
2001–20092009–20202001–20092009–2020
Water body107.78197.95117.3090.17−80.6510.46%−3.70%
Farmland5681.035768.604579.3187.57−1189.290.19%−1.87%
Woodland390.55610.43569.88219.88−40.557.04%−0.60%
Grassland132.36157.52109.0025.16−48.522.38%−2.80%
Built land1272.78838.542208.94−434.241370.40−4.26%14.86%
Other land0.542.460.851.92−1.6144.44%−5.95%
Table 9. Land-use transfer matrix of Zhengzhou City from 2001 to 2020 ( km 2 ).
Water BodyFarm-
Land
WoodlandGrasslandBuilt LandOther LandRoll-Out TotalContribution Rate of Transfer Out
Water body47.5940.040.230.1419.740.0260.184.31%
Farmland43.644471.34179.3040.21946.480.051209.6986.61%
Woodland0.0215.39369.182.523.440.0021.381.53%
Grassland0.0440.3321.1565.665.180.0066.714.78%
Built land26.0012.210.010.461234.090.0138.692.77%
Other land0.000.000.000.000.000.000.010.00%
Roll-in total69.70107.97200.7043.34974.850.091396.65-
Contribution rate of
transfer in
4.99%7.73%14.37%3.10%69.80%0.01%--
Table 10. Changes in land-use types and the resulting changes in carbon stocks from 2001 to 2020.
Land-Use ChangeArea of Change
/ h m 2
Proportion of Change Area Carbon   Density   Change / t · h m 2 Carbon Stock Change/tSubtotal of Carbon Storage
Roll OutRoll inIncreaseDecreaseIncreaseDecrease
Water bodyFarmland4004.194.31%205.35-8.22 × 10 5 -8.89 × 10 5
Woodland23.31 315.15-7.35 × 10 3 -
Grassland13.95 217.79-3.04 × 10 3 -
Built land1974.15 28.28-5.58 × 10 4 -
Other land2.52 21.52-5.40 × 10 1 -
FarmlandWater body4363.8386.61%-−205.35-8.96 × 10 5 −1.56 × 10 7
Woodland17,930.43 109.8-1.97 × 10 6 -
Grassland4021.2 12.44-5.00 × 10 4 -
Built land94,648.23 -−177.07-1.68 × 10 7
Other land5.31 -−183.83-9.76 × 10 2
WoodlandWater body1.981.53%-−315.15-6.24 × 10 2 −2.93 × 10 5
Farmland1538.91 -−109.8-1.69 × 10 5
Grassland252.45 -−97.36-2.46 × 10 4
Built land344.16 -−286.87-9.87 × 10 4
GrasslandWater body4.414.78%-−217.79-9.60 × 1025.65 × 10 4
Farmland4032.99 -−12.44-5.02 × 10 4
Woodland2115.09 97.36-2.06 × 10 5 -
Built land518.31 -−189.51-9.82 × 10 4
Built landWater body2599.652.77%-−28.28-7.35 × 10 4 1.52 × 10 5
Farmland1221.12 177.07-2.16 × 10 5 -
Woodland1.26 286.87-3.61 × 10 2 -
Grassland46.44 189.51-8.80 × 10 3 -
Other land0.72 -−6.76-5
Other landWater body0.180.00%-−21.52-4−2
Built land0.36 6.76-2-
Total139,665.15---3.34 × 10 6 1.82 × 10 7 −1.48 × 10 7
Table 11. Performance comparison between pre-activation residual module and traditional residual module.
EpochTraining TimeLoss
Pre-ActivationTraditionalPre-ActivationTraditional
508 s8 s0.0735980.150706
10012 s12 s0.0230580.040288
15016 s16 s0.0084720.027461
Disclaimer/Publisher’s Note: The statements, opinions and data contained in all publications are solely those of the individual author(s) and contributor(s) and not of MDPI and/or the editor(s). MDPI and/or the editor(s) disclaim responsibility for any injury to people or property resulting from any ideas, methods, instructions or products referred to in the content.

