Article

Monitoring Geological Risk Areas in the City of São Paulo Based on Multi-Temporal High-Resolution 3D Models

by
Amanda Mendes de Sousa
1,2,3,
Camila Duelis Viana
1,2,4,
Guilherme Pereira Bento Garcia
1,2 and
Carlos Henrique Grohmann
2,5,*
1
Institute of Geosciences, Universidade de São Paulo (IGc-USP), São Paulo 05508-080, Brazil
2
Spatial Analysis and Modelling Lab (SPAMLab), Institute of Energy and Environment, Universidade de São Paulo (IEE-USP), São Paulo 05508-010, Brazil
3
Coordination of Production and Analysis of Information (GEOINFO), Municipal Secretary of Urban Planning and Licensing (SMUL), São Paulo City Hall, São Paulo 01011-100, Brazil
4
Municipal Coordination of Civil Protection (COMDEC), Municipal Secretary of Urban Security (SMSU), São Paulo City Hall, São Paulo 01301-001, Brazil
5
Institute of Energy and Environment, Universidade de São Paulo (IEE-USP), São Paulo 05508-010, Brazil
*
Author to whom correspondence should be addressed.
Remote Sens. 2023, 15(12), 3028; https://doi.org/10.3390/rs15123028
Submission received: 28 February 2023 / Revised: 15 May 2023 / Accepted: 16 May 2023 / Published: 9 June 2023
(This article belongs to the Special Issue Application of Photogrammetry and Remote Sensing in Urban Areas)

Abstract

:
This paper presents a multi-temporal comparison of high-resolution 3D digital models from two urban areas susceptible to landslides in three time periods. The study areas belong to the São Paulo landslide risk mapping database and are named “CEU Paz” (CP) and “Parque Santa Madalena I” (PSM). For each area, a lidar digital surface model (DSM) (2017) and two structure-from-motion multi-view stereo DSMs (2019 and 2022) built from drone imagery were combined using raster algebra to generate three digital surface models of differences (DoDs). The DoDs were able to highlight changes in vegetation cover and buildings, which are important characteristics for evaluating geological risks in an urban context. Still, they were unable to highlight changes in the ground surface. The results demonstrate that the method greatly supports monitoring, allowing for greater detail and ease of detecting large-scale changes. Even with promising results, this technique should be understood as one more tool for mapping risk areas without replacing fieldwork.

Graphical Abstract

1. Introduction

Human vulnerability to natural hazards results from the socio-economic, physical, and environmental processes that characterize a social–ecological system and is thus socially constructed [1]. This view of hazards is even more relevant in urban areas where the environment is highly modified by physical infrastructures and socio-economic activities [2,3,4].
Risk mapping in scientific research involves understanding the concept of “hazard” and its evolving definition. According to the United Nations General Assembly (UNGA) of 2017 [5,6], a hazard is defined as a process, phenomenon, or human activity that can cause loss of life, injury, health impacts, property damage, social and economic disruption, or environmental degradation. This definition reflects the broader scope of hazards in the field of disaster risk reduction, encompassing both natural phenomena and human activities that can have short- and long-term effects [7].
The same document defines disaster risk as “the potential loss of life, injury, or destroyed or damaged assets which could occur to a system, society or a community in a specific period, determined probabilistically as a function of hazard, exposure, vulnerability, and capacity” [5]. To accurately assess risks, it is crucial to examine the interplay between hazard, exposure, vulnerability, and capacity. Hazard refers to the potential occurrence of an event within a specified time and space, while exposure involves the assets at risk, such as the environment, economy, buildings, or people. Vulnerability represents the susceptibility of these assets to damage or impact, and capacity encompasses the strengths, attributes, and resources available to manage and mitigate disaster risks [7].
The expanded definition of hazard includes human activities, necessitating re-evaluating how we perceive hazards, vulnerabilities, and exposures. For example, depending on the perspective, urban infrastructure system failure can be seen as both a vulnerability and a hazard. This perspective shift allows for a more comprehensive understanding of risks and their potential consequences. While the fundamental concepts of hazard, vulnerability, and exposure remain significant, their application varies depending on the specific problem context [7].
In summary, risk mapping necessitates a comprehensive understanding of hazards, considering both natural phenomena and human activities. Researchers can assess risks more effectively by examining the relationships between hazard, exposure, vulnerability, and capacity. This approach acknowledges the dynamic nature of hazards and allows for a nuanced evaluation of risks in various contexts. With this in mind, urban sprawl reserves growing challenges for the coming decades as the population growth projection will lead to cities’ growth. However, if not accompanied by adequate planning, urban management, and ecological balance, the impacts of disasters may increase [8]. This, in addition to climate change, may cause cities in developing countries to face higher impacts.
At the international level, natural disaster management gained more prominence when the United Nations (UN) General Assembly designated the 1990s as the International Decade for Natural Disaster Reduction (IDNDR) to decrease the loss of life, property destruction, and social and economic disruption caused by natural disasters. New global initiatives related to disaster risk reduction were proposed in the following years. Two of them are currently worth mentioning. The first is the Sendai Framework, adopted at the Third UN World Conference on Disaster Risk Reduction, which aims to achieve a substantial reduction in disaster risk and losses in lives, livelihoods, and health, as well as the economic, physical, social, cultural, and environmental assets of persons, businesses, communities, and countries between 2015 and 2030. The framework outlines seven clear targets and four priorities for action to prevent new and reduce existing disaster risks: (i) understanding disaster risk; (ii) strengthening disaster risk governance to manage disaster risk; (iii) investing in disaster reduction for resilience; and (iv) enhancing disaster preparedness for an effective response to “Build Back Better” in recovery, rehabilitation, and reconstruction. The second one is the 2030 Agenda for Sustainable Development. At its core are the seventeen Sustainable Development Goals (SDGs), an urgent call for action by all developed and developing countries in a global partnership. Since hazards are a product of societal constructions, disaster risk reduction (DRR) can be linked to multiple SDGs. Its primary association is with Goal 11—“Make cities and human settlements inclusive, safe, resilient and sustainable”.
Landslides are part of the natural processes of Earth’s surface dynamic, which can be accelerated or triggered by anthropic interference [9]. The most widely used classification [10] defines landslides as the downslope movement of soil, rock, and organic materials under the effects of gravity, which occurs when the gravitational driving forces exceed the frictional resistance of the material resisting on the slope. In urbanization conducted in a disorganized way, such as in informal settlements (also known as slums, or favelasfavela or aglomerado subnormal is defined by [11] as “forms of irregular occupation of land owned by others (public or private) for housing purposes in urban areas and, in general, characterized by an irregular urban pattern, lack of essential public services (official garbage collection, sewage network, water network, energy network, and street lighting) and location in areas with restrictions on occupation”), the stresses acting downslope can easily exceed the available strength of the soil, rock, or sediment. As development expands into unstable hillslope areas under the pressures of increasing population and urbanization, human activities have become important triggers for landslide occurrence [12], where commonly observed examples are cut and fills, which expose soil to more water infiltration, that may have inadequate geometry that favors its instability; removal of vegetation, which increases water infiltration and surface erosion processes; excess load due to the increase in the number of floors in houses without proper foundation structures; and increased discharge of wastewater onto slopes, due to leaks in pipes and the absence of adequate water supply and sewage systems. The same factors influence vulnerabilities and exposures in complex ways. For example, suppose a floor is added to a house. In this case, the house’s vulnerability may be increased due to its inadequate structure and building materials, and by accommodating more people, more people will be exposed. In this way, surface changes and interventions observed during the occupation process modify the conditions that determine the risk, that is, the probability of losses.
The disaster risk management cycle can be divided into five main stages: prevention, mitigation, preparedness, response, and reconstruction, with the first two occurring before a disaster occurs. In the prevention phase, priority measures and activities are executed to prevent or reduce the installation of new disaster risks. The first activity is risk identification via the mapping process, which produces cartographic instruments that help in the diagnosis of the physical environment and land occupation and can provide more quality and efficiency to risk and disaster reduction measures, directing mitigation and preparedness activities, as well as public policies [13]. However, cities change more quickly than the government manages to implement the planned measures, causing risk mapping to have its own update cycle, which involves both identifying new areas and monitoring changes in the existing conditions, with the latter being the object of study of this work.
Monitoring the risk areas in cities such as São Paulo, Brazil, is not a simple task, due to the reduced number of technicians, the large number of areas, the size of the territory, the density of occupations, and the diversity in conditioning factors in the landslide process [9,14]. Thus, it is necessary to develop a method that allows for monitoring on an adequate scale, in a reduced time, compatible with the city’s current risk mapping methodology, that is easily reproducible throughout the territory. As part of an integrated approach, monitoring via remote sensing methods is an efficient tool to gather information related to changes in human and environmental factors in areas of social fragility and prone to landslides [4].
With this in mind, structure-from-motion multi-view stereo (SfM-MVS) photogrammetry has great potential to be beneficial as a technology that hastens terrain modeling for these purposes [15,16]. SfM-MVS is a digital photogrammetry technique for high-resolution topographic reconstruction, ideally suited for low-budget research and application in remote areas. It operates under the same basic tenets as stereoscopic photogrammetry, namely, that a 3D structure can be resolved from a series of overlapping, offset images [15]. It has been gaining diverse applications in the most varied disciplines, including landslide studies [17], for being low-cost (regarding both hardware and software), being easy to learn and use, and providing point density and accuracy comparable to that obtained via lidar (light detection and ranging). When paired with remotely piloted aircrafts (RPAs), it can be even more efficient [18,19], as RPA-based SfM-MSV has proven to be extremely powerful for hazard mapping and landslide-related data collection [17,20,21,22,23,24,25,26,27,28,29,30,31,32,33,34]. For these reasons, RPA SfM-MVS is an excellent option for those applications that benefit from frequently revised terrain models for landslide risk monitoring.
This research, developed in partnership with the São Paulo Civil Protection office, aimed to present a fast, easily replicable method that uses images collected recurrently via RPAs and can increase the efficiency of geological risk mapping carried out by the municipal agency. The mapping generically named as “geological risk” by the São Paulo Civil Protection Office, using the classification proposed by UNDRR [35], comprises the hazards of landscape creep, rockfall, and riverbank erosion (geohazard type), as well as rock slide (meteorological and hydrological type/terrestrial cluster), in other words, the hazards related to soil and rock movement in the São Paulo context. Hence, throughout the article, geological risk will refer to to the mapping procedure surrounding these specific hazards, and landslide will refer to the particular process to be monitored in the study areas. Therefore, a comparison of 3D digital models, lidar (municipal reference data), and RPA (2019 and 2022 surveys) from two urban areas susceptible to landslides from three different periods was performed. The study areas belong to the geological risk mapping database and are named “CEU Paz” (CP) and “Parque Santa Madalena I” (PSM), located in São Paulo.
The remainder of this paper is organized as follows. Section 2 outlines the geographical location of the study areas and their geological, geomorphological, and socio-economic characteristics, factors that directly influence the risk classification according to the method adopted by the municipal agency. Section 3 presents an overview of the methodological framework, datasets, and products. Section 4 describes the results. Section 5 discusses the results and analyzes the proposed method’s advantages, disadvantages, challenges, and implementations within the municipal agency. Finally, Section 6 highlights the paper’s major findings.

2. Case Study

Brazil is a developing country with continental dimensions (ca. 8,500,000 km2) and an estimated population of over 213 million [36]. The country is divided into five regions (i.e., north, northeast, central-west, southeast, and south). The northeast, southeast, and south regions are most heavily affected by disasters. The population distribution along the territory and human development index suggest a panorama in which nearly one third of the Brazilian population could experience socio-economic weakness in a disaster. In urban areas with a higher population density, these conditions are intensified [36]. The expressive increase in the urban population, the lack of a national disaster policy until 2012 [37], and the nonexistence or inefficiency of plans, laws, and regulations to reduce the risk of disasters (<25% of municipalities) are elements that contribute the most to maintaining a high disaster risk [38]. The lack of urban planning and infrastructure has led the most underprivileged individuals to occupy naturally unsuitable areas or those highly susceptible to unstable slopes, primarily due to the low real estate value of the land [9].
São Paulo, located in the southeast region, is the most populous city in the country, with a projected population of over 12 million people living in a 1521 km2 territory. The city has over 500 mapped landslide risk areas, challenging risk management, and DRR. To confront risk successfully, it is essential to shift from unplanned and ad hoc responses when crises occur to proactive, systematic, and integrated risk management [39].

2.1. Landslide Risk Mapping in São Paulo

In Brazil, there is a national guidance document [40] that presents methodological procedures for landslide risk mapping in Brazilian slums, developed by the Institute for Technological Research (Instituto de Pesquisas Tecnológicas—IPT), and distributed by the Ministry of Cities. In this context, the risk is the relationship between the possibility of occurrence of a given process or phenomenon and the magnitude of damages or social and/or economic consequences regarding a given element, group, or community. The higher the vulnerability, the greater the risk.
São Paulo has adopted the ’risk zoning‘ procedure since 2010 [41]. It aims to support risk management and establish technical and social parameters to promote greater security and/or eliminate risks, as well as the adequacy of the products to be generated, given the municipal government’s need to devise intervention plans to control the identified risks [42]. In summary, risk zoning is a qualitative analysis that defines the probability degree of occurrence of an accident based on three factors: the typology of the expected process and its probability of occurrence, the vulnerability of urban settlements, and the potential damage.
During the field survey, the technicians evaluated a series of characteristics that related to the following factors: the categories of occupation, which characterize the occupation density and basic infrastructure; geological and geotechnical surface investigations, to identify the types of gravitational mass movements; the constraints of the destabilizing processes (e.g., slope characteristics and presence of debris, water, and vegetation); evidence of instability (e.g., house cracks, tree/wall inclinations, and erosion features), and indications of the development of destructive processes. Land use and land cover play an essential role in the methodology adopted, since they directly influence the vulnerability and the potential damage in urban settlements. After the analysis, the houses were grouped according to similar characteristics in sectors, and each one was appointed a probability degree according to the associated criteria [42]: low risk (R1), medium risk (R2), R3 high risk (R3), and very high risk (R4).

2.2. Study Areas

For the present research, two mapped areas with landslide risk were chosen: “CEU Paz”, located in the Brasilândia district, northern São Paulo, and “Parque Santa Madalena I”, situated in the Sapopemba district, eastern São Paulo (Figure 1 and Figure 2). The study areas were chosen mainly due to the complexity of the settlements in these areas, which are highly urbanized and have recurrent landslide records. Both areas are featured in the Special Zone of Social Interest 1 (Zona Especial de Interesse Social—ZEIS 1) by the Urban Development Policy (Política de Desenvolvimento Urbano) and the Strategic Master Plan for the city of São Paulo (Plano Diretor Estratégico do Município de São Paulo) (Municipal Law 16.050/2014). The ZEIS 1 areas are described in Article 45 of the Strategic Master Plan:
Areas characterized by slums, irregular allotments, social interest housing, and popular settlements mainly inhabited by low-income populations. The public interest is in maintaining inhabitants and promoting land and urban regularization, environmental recovery, and construction of Social Interest Housing.
Both areas are composed of metamorphic rocks, mainly schists [43], and intrusive igneous rocks [44], resulting in relief with convex summits, deep valleys, high drainage density, and steep slopes, resulting in high landslide susceptibility [45].
Figure 1. Overview of the study areas. (a) CEU Paz, photographed in 2019 via helicopter. (b) Parque Santa Madalena I, photographed via RPA in 2023.
Remotesensing 15 03028 g001
Popular settlements have significantly increased in “CEU Paz” from 2004, when the CEU building was built. According to the local Social Vulnerability Index (Índice Paulista de Vulnerabilidade Social—IPVS), which indicates citizens’ living conditions using social inequality parameters [46,47], and has emerged over the past decade as a quantitative measure of the social dimensions of natural hazard vulnerability [48], the “CEU Paz” area is classified as highly vulnerable. Places of high vulnerability are those located in urban census sectors and in subnormal agglomerations, where the socio-economic dimensions are low, with the family life cycle of young families living in subnormal agglomerates having an average nominal income of BRL 1401.
Figure 2. Images and locations of the study areas. (a) Map of South America with the location of São Paulo. (b) CEU Paz and Parque Santa Madalena I in respect to São Paulo. (c) Geological risk areas in São Paulo, with the study areas in yellow. (d) CEU Paz area. (e) Parque Santa Madalena area. (f) Geological map of CEU Paz area and legend. (g) Geological map of Santa Madalena area and legend. Geological maps after [49].
Remotesensing 15 03028 g002
The “Parque Santa Madalena I” area is composed of alluvial plains in valleys and sericite schist in hillslopes (sericite phyllite, metarenite, carbonaceous phyllite, and sericite-quartz shale), and is part of the Embu Complex [43,49]. It is inserted in the Ribeirão do Oratório watershed, crossed by an unnamed stream (N–NW), whose head is located at the northern limit of the area and is limited to the south by an unnamed tributary. The settlement is established on a headwater hillside. Topographic data show elevations ranging from 770 m in the valley to 820 m in the NW hillslopes.
Popular settlements in “Parque Santa Madalena I” started in 1972, and the IPVS ranges from medium to very high, with them being classified as settlements in subnormal urban clustering sectors [43,46].

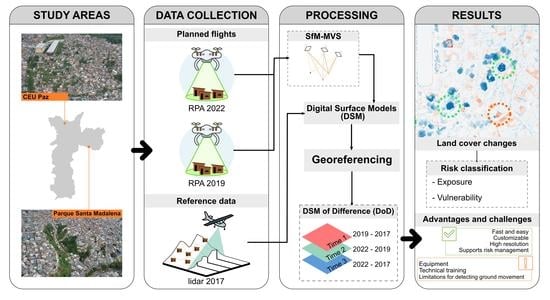
3. Data Collection and Methods

To achieve this project’s goals, two digital surface models (DSMs [50]) were generated using structure-from-motion multi-view stereo (SfM-MVS) photogrammetry. These SfM-MVS DSMs and another DSM generated via lidar were applied in a multi-temporal analysis to identify changes in the study areas and thus indicate possible soil instabilities. The complete workflow can be seen in Figure 3.
The images for the SfM-MVS were collected using an RGB FC6310 (8.8 mm) camera mounted on an RPA, known for its flexibility and cost efficiency which allow for high-quality cartographic surveys. The flights occurred in November 2019 and April 2022, using the DJI Phantom 4 Pro as a platform in both study areas and the parameters presented in Table 1. Image acquisition was automatically performed following a flight plan created using the MapPilotPro app, which facilitates data survey and allows for replication over time. Considering the rough terrain in both areas, the flights were programmed at a constant height relative to the ground to maintain a homogeneous spatial resolution.
For the CEU Paz area, the first flight was carried out in November 2019 in two perpendicular flight lines (N–S and W–E) at 186 m height, resulting in 145 images. The two flight lines were made by slightly adjusting the flight height relative to the topography to maintain a more homogeneous ground resolution in places with steeper topography. Initially, the second flight campaign was planned to take place after the rainy season (around April 2020), but it was postponed due to the restrictions imposed by the COVID-19 pandemic. Therefore, the second flight in the CP area was carried out in April 2022. The N–S and W–E flight paths were repeated at 168 m height, resulting in 150 images. For the Parque Santa Madalena area, the flight executed in November 2019 at 104 m height resulted in 71 images. In this case, the correction of the flight height regarding the topography was not performed. The second flight, in April 2022, was carried out at a height above ground of 112 m, resulting in 78 images.
In December of 2019, an airborne lidar survey of São Paulo made in 2017 was released as an open access dataset by the São Paulo City Hall [47]. This dataset is part of the survey that updates the official city hall database (municipal reference data). It comprises a dense point cloud with x, y, and z coordinates covering the São Paulo municipality, and served as the basis for georeferencing the RPA surveys. For DSM generation, first, the dataset was uploaded in GRASS-GIS 7.8 [51] and filtered to preserve the highest elevation points in 0.5 m cells. After that, a bilinear spline interpolation [52] was performed to generate the final DSM with 0.5 m spatial resolution. To match the lidar DSM with the RPA DSM, the original coordinate reference system (CRS) was converted from UTM SIRGAS 2000 23 K to UTM WGS84 23 K.
As the studied areas present significant social conflicts, collecting ground control point (GCP) coordinates for precise georeferencing was unsafe. This is a common reality in Brazilian geological risk areas, where there are also risks of damage and equipment theft. Thus, it was appropriate that the developed method did not rely on GCP.
For the RPA DSM generation, the image sets were processed using Agisoft Metashape Professional 1.7 [53] with default parameters. Metashape is based on SfM-MVS algorithms that can automatically create high-resolution 3D models from a set of 2D images obtained from different points of view [15]. High-density point clouds, photorealistic 3D models (textured mesh), orthomosaics, and DSMs were generated, with the latter being used for comparison and evaluation in the workflow (Figure 3).
In the next step, we evaluated all of the DSMs, lidar, and RPA to verify their georeferencing in the X, Y, and Z axes.
Analyzing the histograms and topography profiles of the 2019 and 2022 DSMs, we saw the need to correct the X and Y coordinates to compare the 2017, 2019, and 2022 models. Using 2017 as the reference, we identified fixed notable features, such as gutters and buildings, to perform the manual georeferencing of the 2019 and 2022 RPA DSMs.
Afterward, we compared the topographic profiles of the 2019 RPA DSM and the 2017 lidar DSM, which evidenced a substantial difference in the Z coordinate, mainly in the CEU Paz area. DoDs (DSMs of difference), computed using the raster calculator in QGIS, showed values of +1.56 m for Santa Madalena Park and −21.63 m for the CEU Paz area. With these DoD values, we adjusted the elevation from the SfM-MVS DSMs, adding 21.63 m to the CEU Paz DSM and subtracting 1.56 m from the Parque Santa Madalena DSM. After the adjustment, new DoDs were computed.
The same procedure was applied to the 2022 DSM. After calculations in QGIS, we adjusted the elevation from the SfM-MVS DSM, adding 91.27 m to the CEU Paz DSM and subtracting 73.47 m from the Parque Santa Madalena DSM.
The next step was to compare the DSMs from the different years using map algebra to identify changes in the study areas. This method sought to make simulations (models) of real-world phenomena, their aspects, and their parameters. The operation combined raster data pixel by pixel, resulting in a new information layer arising from arithmetic operations involving, as well as traditional algebra, a set of mathematical operators applied to geographic variables, such as the raster pixel [54].
To achieve this, we subtracted the 2017 lidar DSM from the 2019 SfM-MVS DSM (Time 1), the 2019 SfM-MVS DSM from the 2022 SfM-MVS DSM (Time 2), and the 2017 lidar DSM from the 2022 SfM-MVS DSM (Time 3). In this configuration, positive values in the resulting DSM indicate new structures and objects (e.g., new houses), and negative values indicate structures and objects that have been removed (e.g., suppressed trees).

4. Results

4.1. Digital Surface Models

The digital surface models were generated from the dense point cloud in Agisoft Metashape, using its default processing workflow and parameters set to high-quality. The total cloud points, their density, and the spatial resolution of the DSM obtained for each area and flight are shown in Table 2.

4.2. Orthomosaics

An intermediate product considered to be important in the proposed analysis is the orthomosaic. In addition to being used as a basis for delimiting risk sectors in the daily practice of risk mapping, especially in places where occupation is recent and it is not possible to be observed via satellite images or previous surveys, the proposed method serves as visual support in the more precise identification of places where there were changes in the terrain, indicated by the DoDs. For the orthomosaic generation, we used all of the images from each flight. The results obtained can be viewed in Table 3.

4.3. Digital Surface Models of Difference—DoDs

To identify the highlighted changes in the DoDs, they were analyzed in conjunction with the orthomosaic corresponding to the surveys used in their construction.
In the built DoDs, vegetation and buildings were the most easily identifiable changes. Even with the high level of detail of the created models, it was impossible to identify ground movements clearly. Below, we highlight the main observations in each of the areas of study.

4.3.1. CEU Paz

For the “CEU Paz” area (Figure 4), it is essential to note that most of the changes detected occurred in the risk sector mapped as being very high (R4), where the terrain slope is steeper and the occupation is more recent.
Regarding vegetation cover, DoD Time 1 (2017–2019) and Time 3 (2017–2022) highlighted tree suppression in most of the area, while Time 2 (2019–2022) highlighted an increase in the existing tree canopy size (Figure 5).
The increase in the number of houses and floors of buildings is more prominent in the models with the highest temporal interval, i.e., Time 2 (Figure 6) and Time 3 (Figure 7).
In 2019, a stepped spillway built in the southeast corner of the CEU Paz building was extended toward the base of the slope to direct water from the building’s superficial drainage system and assist in the dissipation of the energy of the descending water to avoid superficial erosion of the slope. Despite its significant length (approximately 94.2 m), DoD Time 3 did not highlight the structure (Figure 7).

4.3.2. Parque Santa Madalena

In the “Parque Santa Madalena I” area (Figure 8), the two main risk sectors are the slopes along the main access road (west and east), built over the unnamed stream. The houses are more sparse in these places due to the challenging conditions.
Regarding vegetation cover, all of the DoDs highlighted its decrease on the slopes (Figure 9, Figure 10 and Figure 11). In Time 2 (2019–2022) (Figure 10) and Time 3 (2017–2022) (Figure 11), it is possible to notice an increase in the canopy size for the trees along the southmost street, Custódio de Sá e Faria Avenue.
As for the CP area, the increase in the number of houses and floors of buildings is more prominent in the models with the highest temporal interval, i.e., Time 2 (Figure 10) and Time 3 (Figure 11).
Slope stabilization work occurred on the east slope from late 2021 to early 2022. For this reason, DoD Time 2 (Figure 10) and Time 3 (Figure 11) showed negative changes on the ground due to slope regrading.

5. Discussion

The main objective of this study was not to identify landslides but rather changes in their conditioning factors, mainly land use and cover in this highly urbanized context, which may change the risk classification to increase the efficiency of mapping updating according to the method adopted by the city. Therefore, in this section, the authors apply their experience working in Civil Protection to discuss if and how the city of São Paulo can broadly adopt the proposed method and its current state regarding regulations and technical training. This analysis is mainly aimed at drawing attention to the challenges that the municipality will have to address if it chooses to incorporate the proposed method into the current mapping and monitoring process, and describing the favorable conditions that São Paulo already has and the challenges that it still has to overcome, so that other municipalities can outline their methods and incorporate them into their public policies.
The presented results and methodology developed for the São Paulo context were proven to help in identifying changes in two of the main elements evaluated during landslide risk mapping: vegetation cover, which relates to occupation expansion, water infiltration, and runoff, and building characteristics, which refer to vulnerability and potential damage (exposure).
Another important element of the mapping process, which was expected to be highlighted in the high-resolution DoDs, was the change in terrain. During fieldwork, the main observed changes were slope cuts, landfills, and the accumulation of garbage and debris on the slope, which, as they are loose material, generally slide after rain episodes (Figure 12).
There are two possible reasons as to why such changes were not highlighted in the DoDs. The first is related to the adjustment between the models used in their calculation, which is discussed in detail in Section 5.1. The second is that the differences caused by terrain movement are smaller than those observed for vegetation and buildings, and therefore are masked in the overall result.
The ease of carrying out surveys for data collection in inaccessible areas is probably the most outstanding advantage of the RPA SfM-MVS technique. In daily practice, the images obtained using RPA are already used by the São Paulo Civil Protection Agency to complement the analysis and classification of risk sectors (Figure 13). Its use is essential due to the high degree of urbanization, where the disorderly construction of housing often leaves places susceptible to landslides inaccessible for field inspection.
Another advantage of this approach is the agility in identifying changes in the territory. Traditionally, changes in risk areas are identified using field surveys and visual analysis of oblique images captured via helicopter or RPA, with the latter being used more extensively in recent years. However, this method is not entirely efficient, as it may not cover all of the sites within an area, potentially leading to overlooking important changes during analysis. In contrast, the proposed method uses free software and the map algebra technique to compare the DSMs, which produces rapid responses with minimal processing effort, while ensuring complete coverage of the area and highlighting the most significant changes. Although not the focus of this study, it is important to highlight that this approach can be applied in quantitative analysis based on measurements of changes in volumes and distances in urban occupation.
The deployment of the RPA does not have to occur within the study area, which can sometimes be difficult to access. Instead, the only requirement is to have a location whereby the aircraft can operate within a visual line of sight (VLOS), as prescribed by national regulations [56]. This approach accelerates data collection surveys, eliminating the need for physical access to the study area. Moreover, taking off from outside the study area decreases the risk of damage to the aircraft resulting from hostile activities in areas with higher crime rates.
Monitoring geological risk areas using 3D elevation models has proven to be valuable and necessary in guiding risk management policies. The results have been significant enough that variations in this method can be applied in other phases of risk management, such as planning contingency plans (preparedness) and emergency response.
From a technical perspective, modifying the proposed method to improve the results is possible. The data collected using RPA can serve as inputs for other terrain analyses and tracking changes over time, allowing the models to serve as an integrating tool for planning changes and actions in the territory, e.g., housing, vegetation recovery, sanitation, and urbanization. Additionally, operationalization must also consider institutional characteristics and limitations. Some suggestions regarding these two fields are presented in the following items.

5.1. Technical Challenges

Although the results achieved were satisfactory for the proposed objective, analyzing the application of the method in the selected risk areas, the results were unable to detect small changes relevant to risk monitoring, e.g., leaning walls and trees. For instance, the construction of the stepped spillway in the CP area was not detected in the results. Such changes are important to be observed, as they may interfere positively (in the case of construction) or negatively (in the case of walls and leaning trees) in geological risk evaluation.
This difficulty can be attributed to the small differences that occur due to the positioning of the DSM and georeferencing. A possible solution to correct this situation and refine the analysis is to collect ground control points (GCPs) throughout the study areas, even if they are sparse.
Collecting GCPs scattered around the study areas, even if only a few, could allow precise DSM positioning and georeferencing to enhance model evaluation accuracy. Using GCPs during data collection surveys improves data quality and reduces the need for post-processing actions. Evaluating the feasibility of implementing fixed landmarks within communities is possible. The joint assessment is important to increase residents’ knowledge about their territory and protect structures against vandalism. This adjustment in the proposed flow should significantly improve the accuracy of the coordinates of the collected data and reduce or eliminate the need for manual adjustments with georeferencing.
It is important to emphasize that the slope gradient of the study area must be considered in RPA flight planning. RPA flights are usually planned to be performed at a standard elevation above ground, which can affect the spatial resolution of the collected images and their derived products in areas with large hillslope elevation variations, as observed in the studied areas.
The large-scale use of RPA for image acquisition is hindered by the extension of São Paulo and its dynamics. The batteries of the chosen RPA last for around 20 min each under fair weather conditions, which affects mission planning and monitoring campaigns. During the rainy season (Nov.–Mar.), when landslides are more likely to occur, increases in field surveys and monitoring campaigns are needed. To enable RPA support during these recurrent monitoring campaigns, spare batteries or constant recharging are required.
Finally, to make the workflow even faster, it is possible to search for the automation of the presented processes, including creating a database with the models built over time.

5.2. Institutional Challenges

Despite the technical challenges concerning the use of the RPA SfM-MVS technique for risk management, there are also institutional challenges related to permissions and municipal public agency resources to make the use of this method feasible.
In the Brazilian context, the city of São Paulo has advantages over other municipalities regarding the number of trained technicians and equipment required. The use of RPAs, for example, is already a consolidated reality in activities in different areas, made possible by the creation of Dronepol [57] in 2017, a specific department of the Municipal Secretariat of Urban Security which brings together RPA and pilots who provide support to other municipal bodies, being the one that operates drones the most in the country.
The lower costs of using RPA for data collection compared to conventional airborne image acquisition platforms are a relevant benefit. The development in digital photogrammetry, computer vision, and new image acquisition platforms has enabled the emergence and maturation of RPA for high-quality topographic surveys [58].
However, for risk monitoring based on the presented method to become part of daily practice, some previous preparation is required: the acquisition of RPA equipment, computers, and commercial software to perform SfM-MVS; an improvement in data processing and storage capacity; the technical training of employees for data collection, processing, and analysis; and the provision of infrastructure that supports the storage, analysis, and processing of data.
Currently, the city has over 500 geological risk areas, and the amount of resources invested must be proportional to this number. To adapt to the available resources, it is possible to prioritize the areas with a higher degree of risk, the area in square meters, and access difficulty.
Even with these institutional issues for city-scale adoption of the RPA SfM-MVS technique, the high cost-effectiveness compensates for the investment. The results achieved are crucial for monitoring risk areas and developing more efficient natural disaster prevention policies.

6. Conclusions

This study proposed applying high-resolution RPA-based SfM-MVS models to monitor geological risk areas and help with updating mapping by comparing 3D digital models from two urban areas susceptible to landslides from the city’s landslide risk mapping database from three different periods. Although the proposed technique has limitations and needs improvements, it successfully monitored the selected highly populated urban areas. We demonstrated that the method applied to landslide risk areas offers the following benefits:
  • It is fast, easily replicable, and uses images collected recurrently via RPA. The municipal body can define the flight frequency according to its planning criteria.
  • It greatly supports monitoring, allowing for greater detail and ease of detecting large-scale land use and land cover changes. This is essential information for risk mapping and disaster prevention.
  • It can be adapted by other municipalities, using their reference data instead of lidar data.
Even with promising results, this technique should be understood as one more tool for mapping risk areas without replacing fieldwork. In the context of risk management, especially prevention activities in densely urbanized environments, the available tools must cover a wide range of scales, ranging from regional to house-to-house detail.

Author Contributions

Conceptualization, C.H.G. and C.D.V.; methodology, C.H.G. and C.D.V.; formal analysis, A.M.d.S., C.D.V. and G.P.B.G.; writing—original draft preparation, A.M.d.S., C.D.V. and G.P.B.G.; writing—review and editing, A.M.d.S., C.D.V., G.P.B.G. and C.H.G.; visualization, A.M.d.S. and C.D.V.; supervision, C.H.G.; project administration, C.H.G.; funding acquisition, C.H.G. All authors have read and agreed to the published version of the manuscript.

Funding

This study was supported by the Sao Paulo Research Foundation (FAPESP) grant #2019/26568-0 and by Brazil’s National Council of Scientific and Technological Development, CNPq grant #311209/2021-1 to C.H.G. This study was financed in part by CAPES Brazil—Finance Code 001.

Data Availability Statement

Publicly available datasets were analyzed in this study (airborne lidar survey of São Paulo city). This data can be found here: http://geosampa.prefeitura.sp.gov.br (accessed on 1 June 2023). Digital Terrain Models and Digital Surface Models in raster format (0.5 m grid spacing) created from the lidar dataset are openly available in Kaggle at https://doi.org/10.34740/KAGGLE/DS/1915612 (accessed on 1 June 2023). RPA datasets are available in GeoNadir at https://data.geonadir.com/project-details/797 (CP—accessed on 1 June 2023) and https://data.geonadir.com/project-details/798 (PSM—accessed on 1 June 2023).

Acknowledgments

The authors acknowledge the support provided by the Institute of Energy and Environment, the Institute of Geosciences, and the Graduate Program in Mineral Resources and Hydrogeology (PPG-RMH). Special thanks go to the Civil Protection directors of the Freguesia do Ó/Brasilândia and Sapopemba districts, Manoel Matias do Nascimento and Sérgio Ramos de Oliveira, and the residents of the study areas for their support during the field surveys. Acknowledgments are extended to the Guest Editors, the Editor-in-Chief, and the anonymous reviewers for their criticism and suggestions, which have helped to improve this paper.

Conflicts of Interest

The authors declare no conflict of interest. The funders had no role in the design of the study; in the collection, analyses, or interpretation of data; in the writing of the manuscript; or in the decision to publish the results.

References

  1. Oliver-Smith, A. “What is a Disaster?”: Anthropological Perspectives on a Persistent Question. In The Angry Earth: Disaster in Anthropological Perspective; Routledge: New York, NY, USA, 1999; pp. 18–34. [Google Scholar]
  2. Kabisch, N.; Korn, H.; Stadler, J.; Bonn, A. (Eds.) Nature-Based Solutions to Climate Change Adaptation in Urban Areas; Theory and Practice of Urban Sustainability Transitions; Springer: Cham, Switzerland, 2017; p. 342. [Google Scholar] [CrossRef]
  3. Karagianni, A.; Lazos, I.; Chatzipetros, A. Remote Sensing Techniques in Disaster Management: Amynteon Mine Landslides, Greece. In Lecture Notes in Geoinformation and Cartography; Springer: Cham, Switzerland, 2019; pp. 209–235. [Google Scholar] [CrossRef] [Green Version]
  4. Kalantar, B.; Ueda, N.; Saeidi, V.; Ahmadi, K.; Halin, A.A.; Shabani, F. Landslide Susceptibility Mapping: Machine and Ensemble Learning Based on Remote Sensing Big Data. Remote Sens. 2020, 12, 1737. [Google Scholar] [CrossRef]
  5. United Nations General Assembly (UNGA). Report of the Open-Ended Intergovernmental Expert Working Group on Indicators and Terminology Relating to Disaster Risk Reduction; Technical Report; UNGA: New York, NY, USA, 2016. [Google Scholar]
  6. United Nations General Assembly (UNGA). Resolution Adopted by the General Assembly on 2 February 2017. 71/276. Report of the Open-Ended Intergovernmental Expert Working Group on Indicators and Terminology Relating To Disaster Risk Reduction; Technical Report; UNGA: New York, NY, USA, 2017. [Google Scholar]
  7. United Nations Office for Disaster Risk Reduction (UNDRR). Hazard Definition and Classification Review: Technical Report; UNGA: New York, NY, USA, 2020. [Google Scholar]
  8. Tominaga, L.; Santoro, J.; Amaral, R. Desastres Naturais: Conhecer Para Prevenir, 1st ed.; Instituto Geológico: São Paulo, Brazil, 2009. [Google Scholar]
  9. Bezerra, L.; Neto, O.d.F.; Santos, O.; Mickovski, S. Landslide risk mapping in an urban area of the city of Natal, Brazil. Sustainability 2020, 12, 9601. [Google Scholar] [CrossRef]
  10. Varnes, D. Slope Movement Types and Processes. In Landslides, Analysis and Control; Schuster, R., Krizek, R., Eds.; Number 176 in Special Report; Transportation Research Board, National Academy of Sciences: Washingtonm, DC, USA, 1978; pp. 11–33. [Google Scholar]
  11. Aglomerados Subnormais 2019: Classificação Preliminar e Informações de Saúde Para o Enfrentamento à COVID-19. 2019. Available online: https://biblioteca.ibge.gov.br/visualizacao/livros/liv101717_notas_tecnicas.pdf (accessed on 11 May 2023).
  12. Dai, F.; Lee, C.; Ngai, Y. Landslide risk assessment and management: An overview. Eng. Geol. 2002, 64, 65–87. [Google Scholar] [CrossRef]
  13. Ministério do Desenvolvimento Regional. GIRD+10: Caderno Técnico de gestão Integrada de Riscos e Desastres; Ministério do Desenvolvimento Regional, Secretaria Nacional de Proteção e Defesa Civil: Distrito Federal, Brazil, 2021; pp. 1–151.
  14. Goto, E.A.; Clarke, K. Using expert knowledge to map the level of risk of shallow landslides in Brazil. Nat. Hazards 2021, 108, 1701–1729. [Google Scholar] [CrossRef]
  15. Westoby, M.; Brasington, J.; Glasser, N.; Hambrey, M.; Reynolds, J. ‘Structure-from-Motion’ photogrammetry: A low-cost, effective tool for geoscience applications. Geomorphology 2012, 179, 300–314. [Google Scholar] [CrossRef] [Green Version]
  16. Ratner, J.; Sury, J.; James, M.; Mather, T.; Pyle, D. Crowd-sourcing structure-from- motion data for terrain modelling in a real-world disaster scenario: A proof of concept. Prog. Phys. Geogr. Earth Environ. 2019, 43, 236–259. [Google Scholar] [CrossRef] [Green Version]
  17. Godone, D.; Allasia, P.; Borrelli, L.; Gullà, G. UAV and Structure from Motion Approach to Monitor the Maierato Landslide Evolution. Remote Sens. 2020, 12, 1039. [Google Scholar] [CrossRef] [Green Version]
  18. de Magalhães, D.M.; Moura, A.C.M. Use of Remotely Piloted Aircraft to Update Spatial Data in Areas of Social Fragility. In Innovation in Urban and Regional Planning—Lecture Notes in Civil Engineering 146; La Rosa, D., Privitera, R., Eds.; Springer: Cham, Switzerland, 2021; pp. 213–220. [Google Scholar] [CrossRef]
  19. Khawte, S.S.; Koeva, M.N.; Gevaert, C.M.; Oude Elberink, S.; Pedro, A.A. Digital Twin Creation for Slums in Brazil Based on Uav Data. Int. Arch. Photogramm. Remote Sens. Spat. Inf. Sci.—ISPRS Arch. 2022, 48, 75–81. [Google Scholar] [CrossRef]
  20. Lucieer, A.; de Jong, S.M.; Turner, D. Mapping landslide displacements using Structure from Motion (SfM) and image correlation of multi-temporal UAV photography. Prog. Phys. Geogr. Earth Environ. 2013, 38, 97–116. [Google Scholar] [CrossRef]
  21. Jaukovic, I.C.; Hunter, A.J. Unmanned Aerial Vehicles: A new tool for landslide risk assessment. In Proceedings of the 11th ANZ Young Geotechnical Professionals Conference—11YGPC, Queenstown, New Zealand, 25–28 October 2016; pp. 299–304. [Google Scholar]
  22. Dugonjić Jovančević, S.; Peranić, J.; Ružić, I.; Arbanas, Ž.; Kalajžić, D.; Benac, Č. Use of Remotely Piloted Aircraft System (RPAS) in the analysis of historical landslide occurred in 1885 in the Rječina River Valley, Croatia. In Proceedings of the EGU General Assembly Conference Abstracts, 2016, EGU General Assembly Conference Abstracts, Vienna, Austria, 17–22 April 2016; p. EPSC2016-16165. [Google Scholar]
  23. Mozas-Calvache, A.T.; Pérez-García, J.L.; del Castillo, T.F. Monitoring of landslide displacements using UAS and control methods based on lines. Landslides 2017, 14, 2115–2128. [Google Scholar] [CrossRef]
  24. Eker, R.; Aydın, A.; Hübl, J. Unmanned aerial vehicle (UAV)-based monitoring of a landslide: Gallenzerkogel landslide (Ybbs-Lower Austria) case study. Environ. Monit. Assess. 2017, 190, 28. [Google Scholar] [CrossRef]
  25. Salvini, R.; Mastrorocco, G.; Esposito, G.; Bartolo, S.D.; Coggan, J.; Vanneschi, C. Use of a remotely piloted aircraft system for hazard assessment in a rocky mining area (Lucca, Italy). Nat. Hazards Earth Syst. Sci. 2018, 18, 287–302. [Google Scholar] [CrossRef] [Green Version]
  26. Giordan, D.; Hayakawa, Y.; Nex, F.; Remondino, F.; Tarolli, P. Review article: The use of remotely piloted aircraft systems (RPASs) for natural hazards monitoring and management. Nat. Hazards Earth Syst. Sci. 2018, 18, 1079–1096. [Google Scholar] [CrossRef] [Green Version]
  27. Rossi, G.; Tanteri, L.; Tofani, V.; Vannocci, P.; Moretti, S.; Casagli, N. Multitemporal UAV surveys for landslide mapping and characterization. Landslides 2018, 15, 1045–1052. [Google Scholar] [CrossRef] [Green Version]
  28. Valkaniotis, S.; Papathanassiou, G.; Ganas, A. Mapping an earthquake-induced landslide based on UAV imagery; case study of the 2015 Okeanos landslide, Lefkada, Greece. Eng. Geol. 2018, 245, 141–152. [Google Scholar] [CrossRef]
  29. Mitsova, D. Supporting Natural Hazards Management with Geospatial Technologies. In Oxford Research Encyclopedia of Natural Hazard Science; Oxford Press: Oxford, UK, 2019. [Google Scholar] [CrossRef]
  30. Santangelo, M.; Alvioli, M.; Baldo, M.; Cardinali, M.; Giordan, D.; Guzzetti, F.; Marchesini, I.; Reichenbach, P. Brief communication: Remotely piloted aircraft systems for rapid emergency response: Road exposure to rockfall in Villanova di Accumoli (Central Italy). Nat. Hazards Earth Syst. Sci. 2019, 19, 325–335. [Google Scholar] [CrossRef] [Green Version]
  31. Cignetti, M.; Godone, D.; Wrzesniak, A.; Giordan, D. Structure from Motion Multisource Application for Landslide Characterization and Monitoring: The Champlas du Col Case Study, Sestriere, North-Western Italy. Sensors 2019, 19, 2364. [Google Scholar] [CrossRef] [Green Version]
  32. Schaefer, M.; Teeuw, R.; Day, S.; Zekkos, D.; Weber, P.; Meredith, T.; van Westen, C.J. Low-cost UAV surveys of hurricane damage in Dominica: Automated processing with co-registration of pre-hurricane imagery for change analysis. Nat. Hazards 2020, 101, 755–784. [Google Scholar] [CrossRef] [Green Version]
  33. Bonali, F.L.; Corti, N.; Russo, E.; Marchese, F.; Fallati, L.; Mariotto, F.P.; Tibaldi, A. Commercial-UAV-Based Structure from Motion for Geological and Geohazard Studies. In Building Knowledge for Geohazard Assessment and Management in the Caucasus and other Orogenic Regions; Springer: Amsterdam, The Netherlands, 2021; pp. 389–427. [Google Scholar] [CrossRef]
  34. Garnica-Peña, R.J.; Alcántara-Ayala, I. The use of UAVs for landslide disaster risk research and disaster risk management: A literature review. J. Mt. Sci. 2021, 18, 482–498. [Google Scholar] [CrossRef]
  35. United Nations Office for Disaster Risk Reduction (UNDRR). Hazard Information Profiles—Supplement to: UNDRR-ISC Hazard Definition & Classification Review—Technical Report; UNDRR: Geneva, Switzerland, 2021. [Google Scholar]
  36. IBGE. Available online: https://cidades.ibge.gov.br/brasil/panorama (accessed on 25 February 2023).
  37. BRASIL. Política Nacional de Proteção e Defesa Civil—PNPDEC. Available online: http://www.planalto.gov.br/ccivil_03/_Ato2011-2014/2012/Lei/L12608.htm (accessed on 25 February 2023).
  38. Monte, B.E.O.; Goldenfum, J.A.; Michel, G.P.; Cavalcanti, J.R.d.A. Terminology of natural hazards and disasters: A review and the case of Brazil. Int. J. Disaster Risk Reduct. 2021, 52, 101970. [Google Scholar] [CrossRef]
  39. Twigg, J. Disaster Risk Reduction- Good Practice Review 9; Humanitarian Policy Network: London, UK, 2015; pp. 1–382. [Google Scholar]
  40. Brasil; Ministério das Cidades; Instituto de Pesquisas Tecnológicas—IPT. Mapeamento de Riscos em Encostas e Margens de Rios; Ministério das Cidades: Brasília, Brazil, 2007; p. 176.
  41. Pascarelli, L.; Lançone, R.; Costa, R.; Pires, L.; Macedo, E.; Mirandola, F.; Checchinato, F.; Canil, K. Mapping Geological at-Risk Areas in the City of São Paulo: Issues and Results from the Largest Risk Survey in Brazil; Springer: Berlin/Heidelberg, Germany, 2013; Volume 6, pp. 349–355. [Google Scholar] [CrossRef]
  42. de Macedo, E.S.; Canil, K.; Silva, F.C.; Mirandola, F.A.; Gramani, M.F.; Ogura, A.T.; Corsi, A.C.; Santos, L.P. Methodological Procedures to Landslide Risk Mapping in Brazilian Slums. In Landslide Science and Practice; Springer: Berlin/Heidelberg, Germany, 2013; Volume 6, pp. 399–403. [Google Scholar] [CrossRef]
  43. São Paulo (Município); SEMPLA/SAR/SEHAB/SVP; IPT. Carta Geotécnica do Município de São Paulo; São Paulo (Município): Sao Paolo, Brazil, 1992.
  44. Ross, J.L.S.; Moroz, I.C. Mapa Geomorfológico do Estado de São Paulo. Rev. Do Dep. De Geogr. 2011, 10, 41–58. [Google Scholar] [CrossRef]
  45. Ross, J.L.S. Relevo Brasileiro: Uma nova proposta de classificação. Rev. Do Dep. De Geogr. 2011, 40, 25–39. [Google Scholar] [CrossRef]
  46. Índice Paulista de Vulnerabilidade Social. Available online: http://ipvs.seade.gov.br/view/index.php (accessed on 25 February 2023).
  47. Da Cidade de São Paulo, M.D. Available online: https://geosampa.prefeitura.sp.gov.br/ (accessed on 25 February 2023).
  48. Tate, E. Social vulnerability indices: A comparative assessment using uncertainty and sensitivity analysis. Nat. Hazards 2012, 63, 325–347. [Google Scholar] [CrossRef]
  49. Almeida, V.V.; Loreti Jr., R. Projeto Materiais de Construção na Região Metropolitana de São Paulo: Estado de São Paulo; CPRM: Belo Horizonte, Brazil, 2019. [Google Scholar]
  50. Guth, P.L.; Van Niekerk, A.; Grohmann, C.H.; Muller, J.P.; Hawker, L.; Florinsky, I.V.; Gesch, D.; Reuter, H.I.; Herrera-Cruz, V.; Riazanoff, S.; et al. Digital elevation models: Terminology and definitions. Remote Sens. 2021, 13, 3581. [Google Scholar] [CrossRef]
  51. GIS, G. Available online: https://grass.osgeo.org (accessed on 25 February 2023).
  52. Brovelli, M.A.; Cannata, M.; Longoni, U.M. LIDAR Data Filtering and DTM Interpolation within GRASS. Trans. GIS 2004, 8, 155–174. [Google Scholar] [CrossRef]
  53. Metashape, A. Available online: https://www.agisoft.com/ (accessed on 25 February 2023).
  54. Barbosa, C.C.F. Álgebra de Mapas e Suas Aplicações em Sensoriamento Remoto e Geoprocessamento. Master’s Thesis, Instituto Nacional de Investigación Espacial del Brasil, São José dos Campos, Brazil, 1996. [Google Scholar]
  55. Viana, C.D.; de Morais, N.L. Mapeamento de Risco de Escorregamento e Solapamento em Assentamentos precáRios: Relatório FO-22—21/07/2022. 2022. Available online: https://geosampa.prefeitura.sp.gov.br/PaginasPublicas/_SBC.aspx (accessed on 11 April 2023).
  56. ICA 100-40/2020: Aeronaves Não Tripuladas e o Acesso ao Espaço aéReo Brasileiro. 2020. Available online: https://publicacoes.decea.mil.br/publicacao/ica-100-40 (accessed on 26 February 2023).
  57. Programa DRONEPOL. Available online: https://www.prefeitura.sp.gov.br/cidade/secretarias/seguranca_urbana/noticias/?p=238299 (accessed on 25 February 2023).
  58. Santos, L.F. Utilização de Dados 3D de Alta Resolução para Detecção de mudançAs em Movimentos de Massa em Perus, São Paulo (SP). Master’s Thesis, Instituto de Geociências, São Paulo, Brazil, 2020. [Google Scholar]
Figure 3. Proposed workflow for multi-temporal analysis in the study areas. Lidar DSM was converted to WGS84 and used as a reference for 2019 and 2022 RPA DSM georeferencing. Finally, the three DSMs were subtracted in pairs generating DSM Time 1 to 3 to identify changes in the study areas.
Remotesensing 15 03028 g003
Figure 4. DSMs of “CEU Paz” (CP) area. (a) Lidar 2017. (b) SfM-MVS 2019. (c) SfM-MVS 2022. (d) DoD 2019–2017. (e) DoD 2022–2019. (f) DoD 2022–2017.
Remotesensing 15 03028 g004
Figure 5. Notable differences with DoD Time 1 for CP area. (a) DoD Time 1 highlights the increase in the number of floors in buildings (orange circles) and the reduction in the vegetation cover (green circles). (b) Orthomosaic of 2019. (c) Orthomosaic of 2017.
Remotesensing 15 03028 g005
Figure 6. Notable differences with DoD Time 2 for CP area. (a) DoD Time 2 highlights denser settlement and increased vegetation size. (b) Orthomosaic of 2022. (c) Orthomosaic of 2019.
Remotesensing 15 03028 g006
Figure 7. Notable differences with DoD Time 3 for CP area. (a) DoD Time 3 highlights the increase in the number of floors in buildings (orange circles) and the reduction in the vegetation cover (green circles). (b) Orthomosaic of 2022, with the implemented stepped spillway highlighted in blue. (c) Orthomosaic of 2017.
Remotesensing 15 03028 g007
Figure 8. DSMs of “Parque Santa Madalena I” (PSM). (a) Lidar 2017. (b) SfM-MVS 2019. (c) SfM-MVS 2022. (d) DoD 2019–2017. (e) DoD 2022–2019. (f) DoD 2022–2017.
Remotesensing 15 03028 g008
Figure 9. Notable differences with DoD Time 1 for PSM area. (a) DoD Time 1 highlights the increase in the number of floors in buildings (orange circles) and the reduction in the vegetation cover (green circles). (b) Orthomosaic of 2019. (c) Orthomosaic of 2017.
Remotesensing 15 03028 g009
Figure 10. Notable differences with DoD Time 2 for PSM area. (a) DoD Time 2 highlights the increase in the number of floors in buildings (orange circle), the increase in tree canopy size (green ellipse), and the execution of slope containment work (blue ellipse). (b) Orthomosaic of 2022. (c) Orthomosaic of 2019.
Remotesensing 15 03028 g010
Figure 11. Notable differences with DoD Time 3 for PSM area. (a) DoD Time 3 highlights the increase in the number of floors in buildings (orange circles) and the execution of slope stabilization work (blue ellipse). (b) Orthomosaic of 2022. (c) Orthomosaic of 2017.
Remotesensing 15 03028 g011
Figure 12. Occurrences of small landslides in the study areas. (a) East slope of CP area in February 2020. (b) Southwest slope of the CP area in February 2019. (c) East slope of PSM area in February 2019. The yellow dot on the insets shows the landslide location.
Remotesensing 15 03028 g012
Figure 13. Example of RPA oblique image from CP area with risk sectors delimited by the São Paulo Civil Protection Agency [55].
Remotesensing 15 03028 g013
Table 1. Flight parameters for CEU Paz (CP) and Parque Santa Madalena (PSM).
CP 2019CP 2022PSM 2019PSM 2022
Number of images1451507178
Flying altitude186 m168 m104 m112 m
Ground resolution4.66 cm/pix4.15 cm/pix2.63 cm/pix2.77 cm/pix
Coverage area0.348 km20.328 km20.167 km20.173 km2
Table 2. DSM results for CEU Paz (CP) and Parque Santa Madalena (PSM).
CP 2019CP 2022PSM 2019PSM 2022
Number of points65,233,18773,239,67973,386,99871,916,148
Point density (pts/m2)115145362327
Spatial resolution (cm/pixel)9.338.315.255.53
Table 3. Orthomosaics results for CEU Paz (CP) and Parque Santa Madalena (PSM).
CP 2019CP 2022PSM 2019PSM 2022
Reprojection error (pixel)0.8240.9290.7170.709
Covered area (km2)0.3480.3280.1670.173
Spatial resolution (cm/pixel)4.664.152.632.77
Disclaimer/Publisher’s Note: The statements, opinions and data contained in all publications are solely those of the individual author(s) and contributor(s) and not of MDPI and/or the editor(s). MDPI and/or the editor(s) disclaim responsibility for any injury to people or property resulting from any ideas, methods, instructions or products referred to in the content.

