
GRACE Data Quantify Water Storage Changes in the Shiyang River Basin, an Inland River in the Arid Zone

Abstract
:
1. Introduction
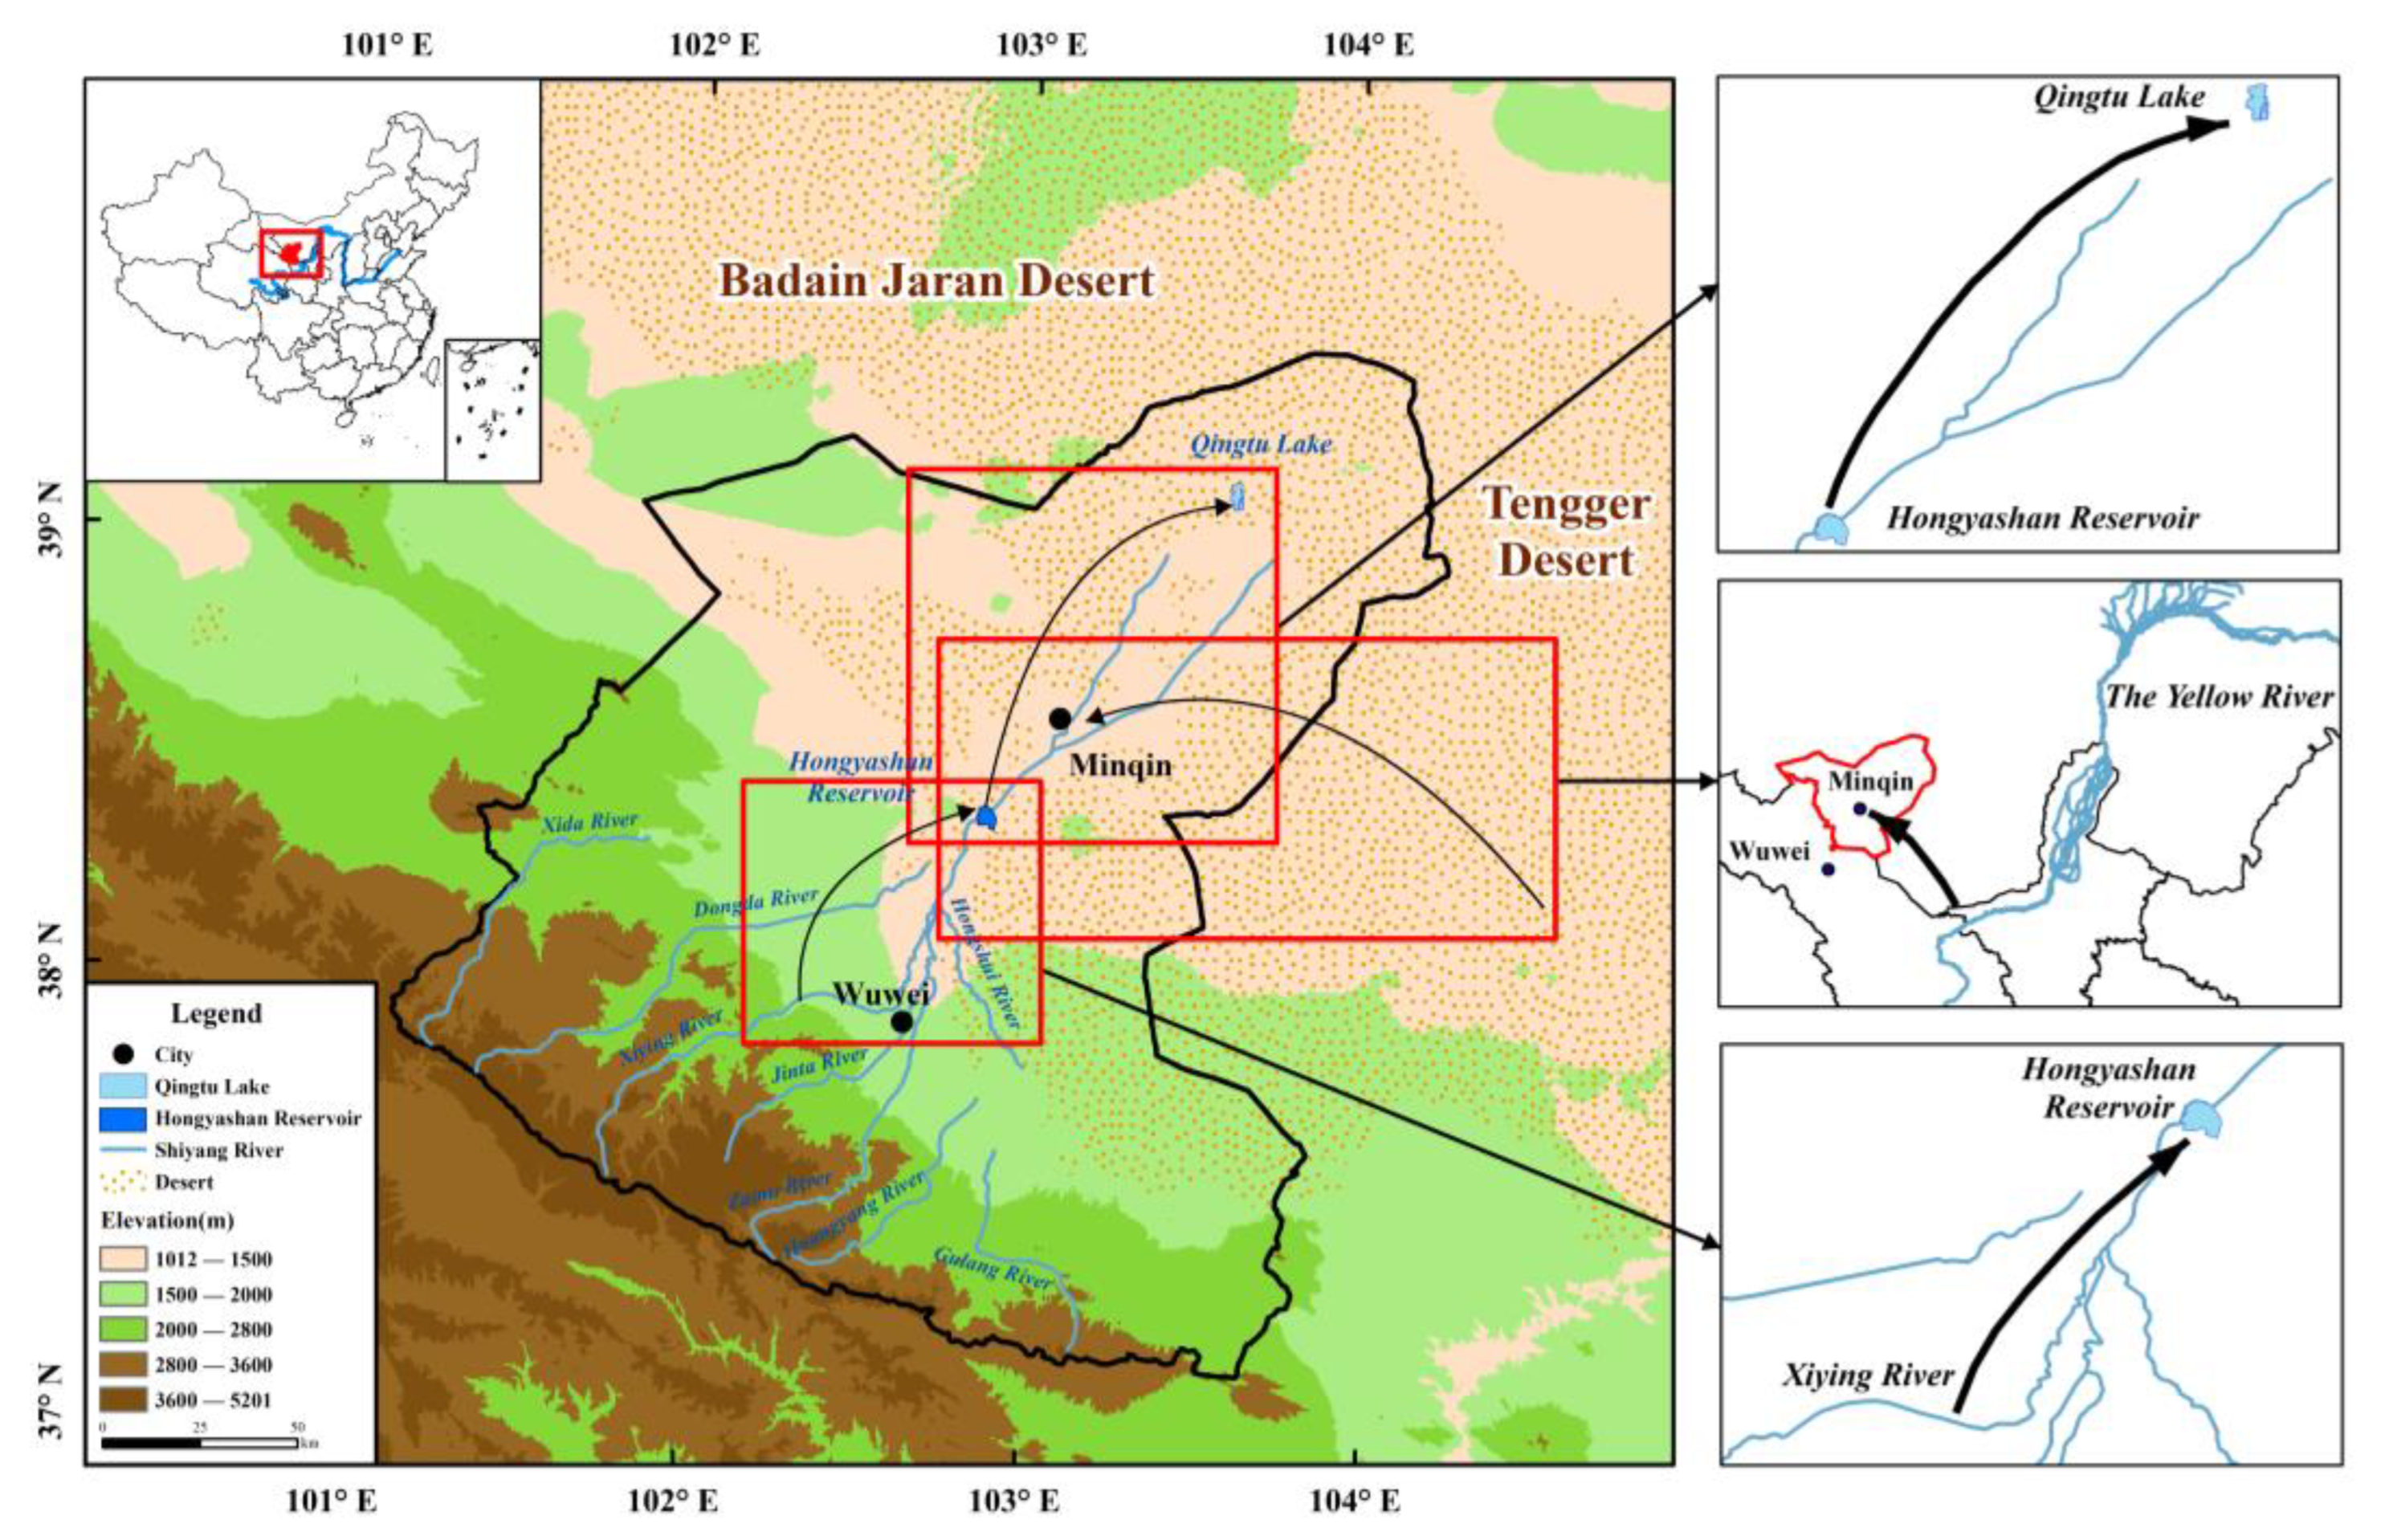
2. Study Area
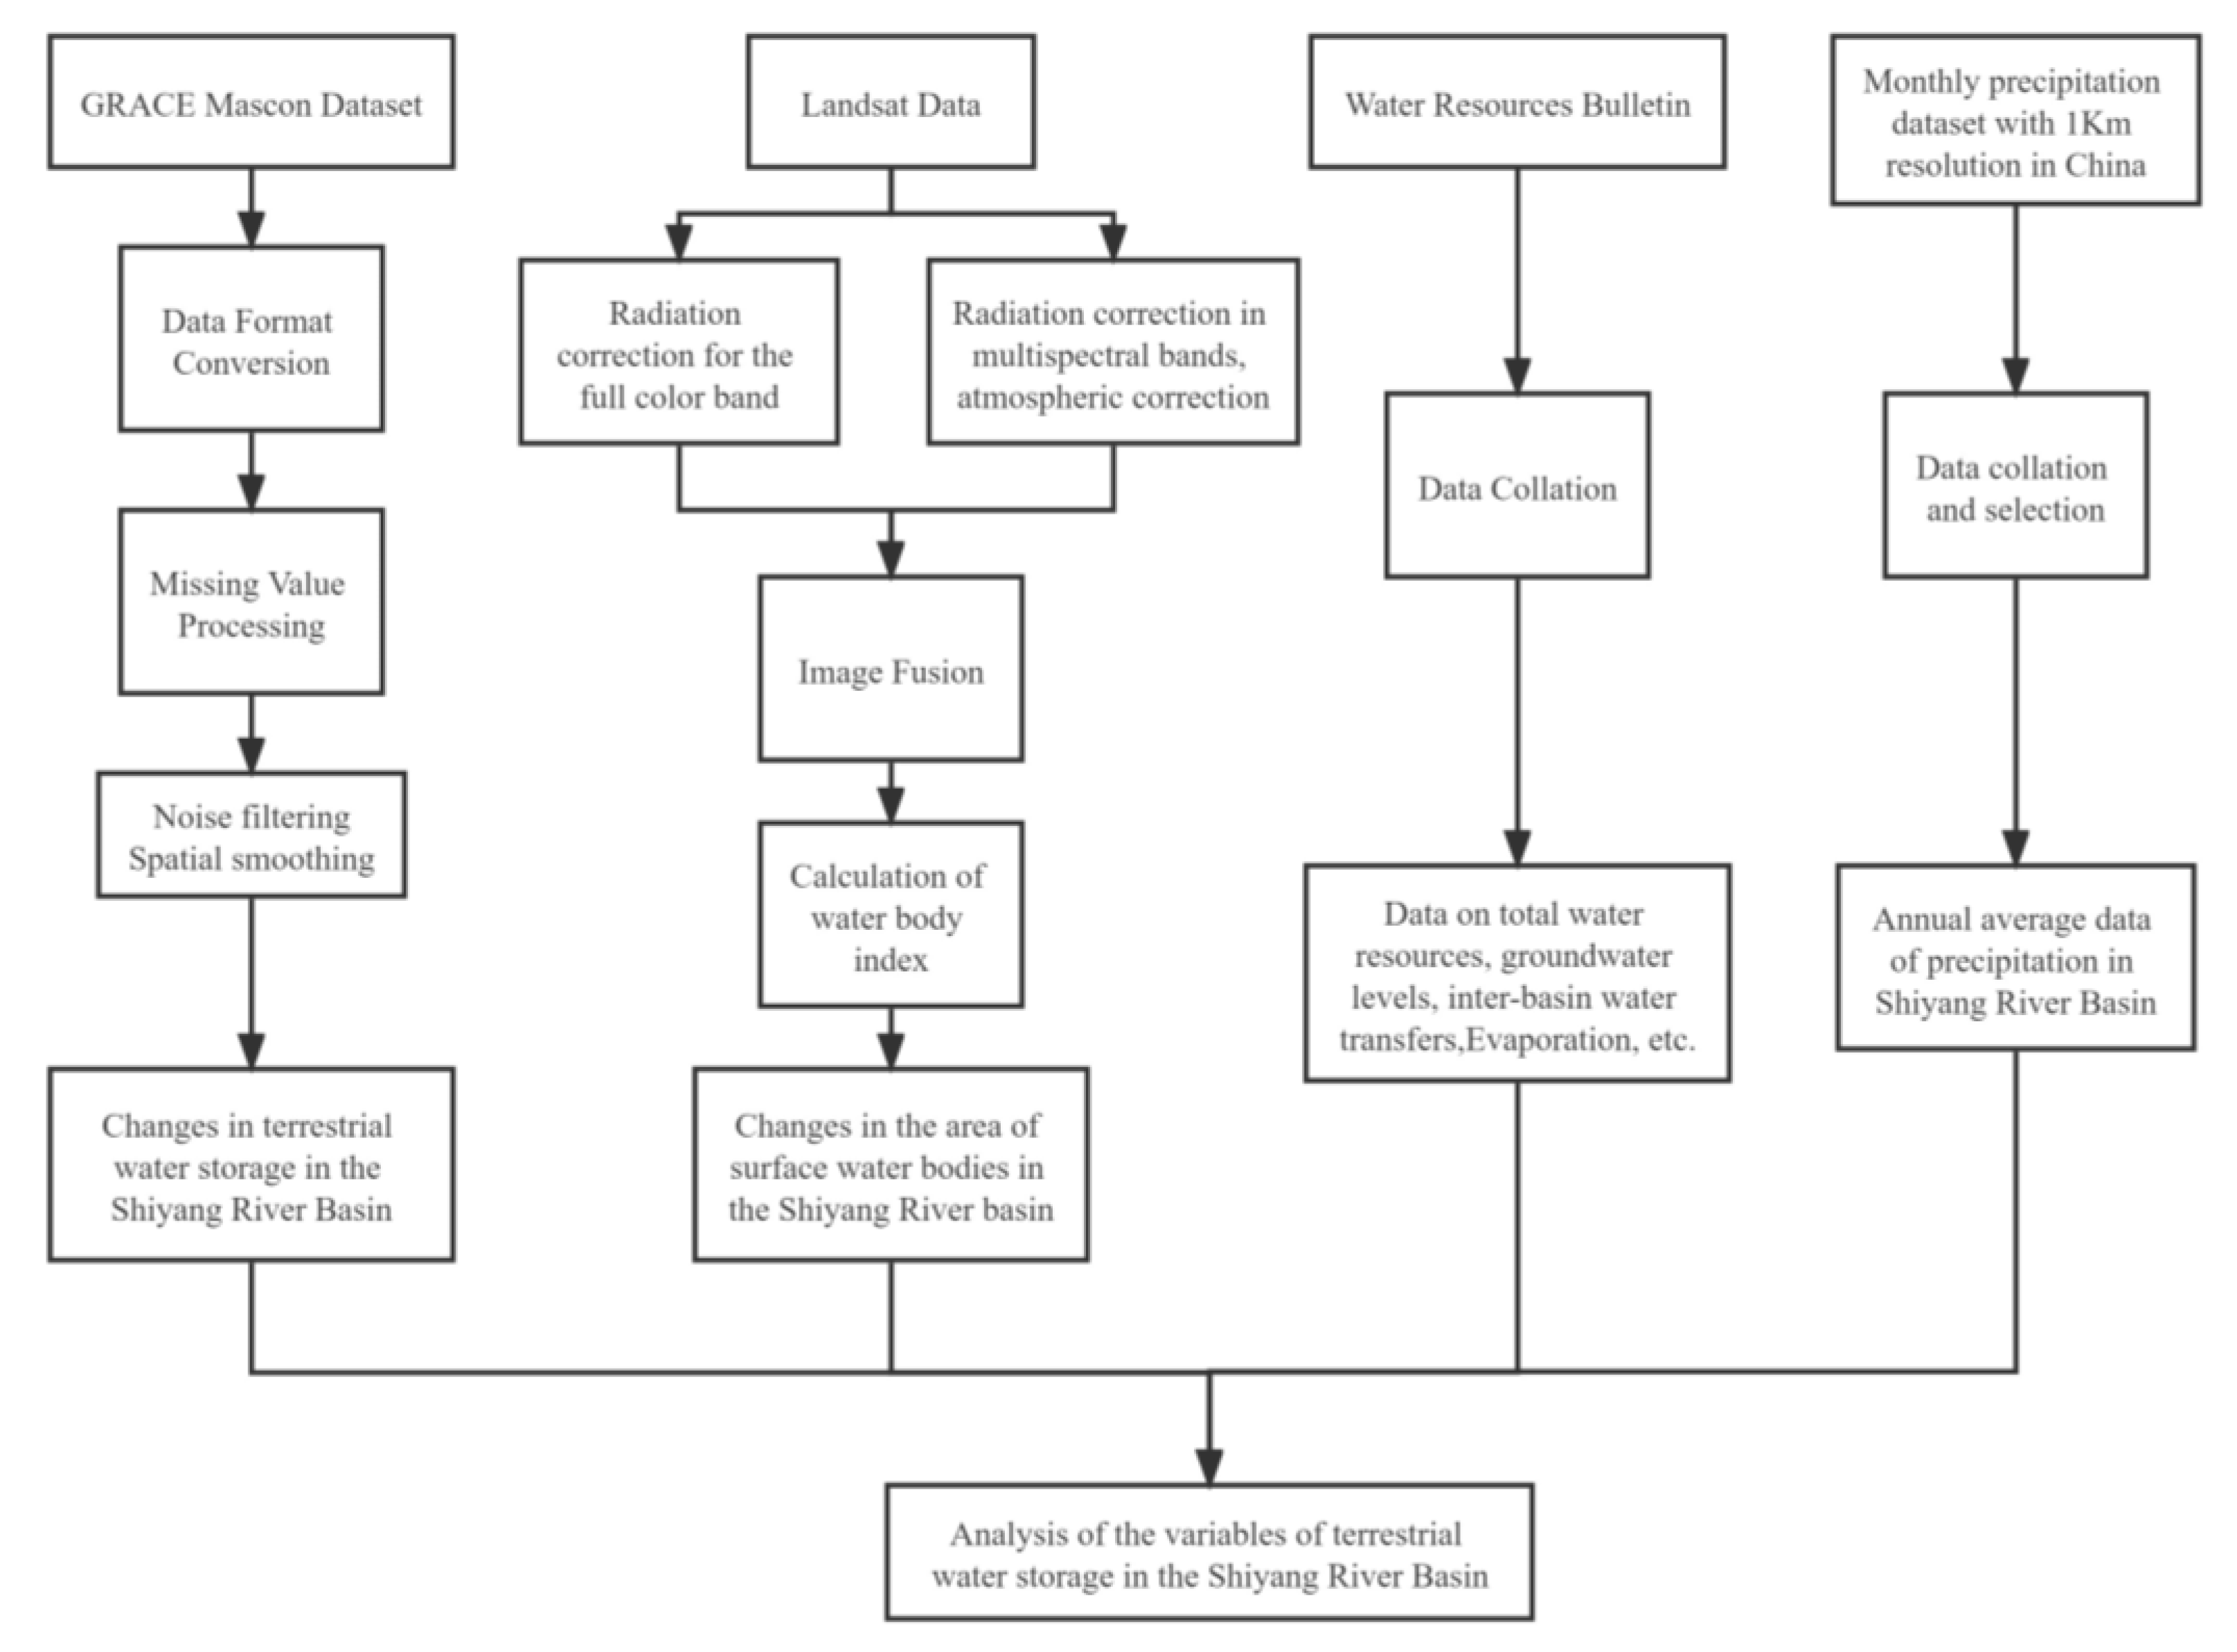
3. Data Sources and Methods
3.1. Data Sources
3.2. GRACE Model Inversion of Terrestrial Water Storage Changes
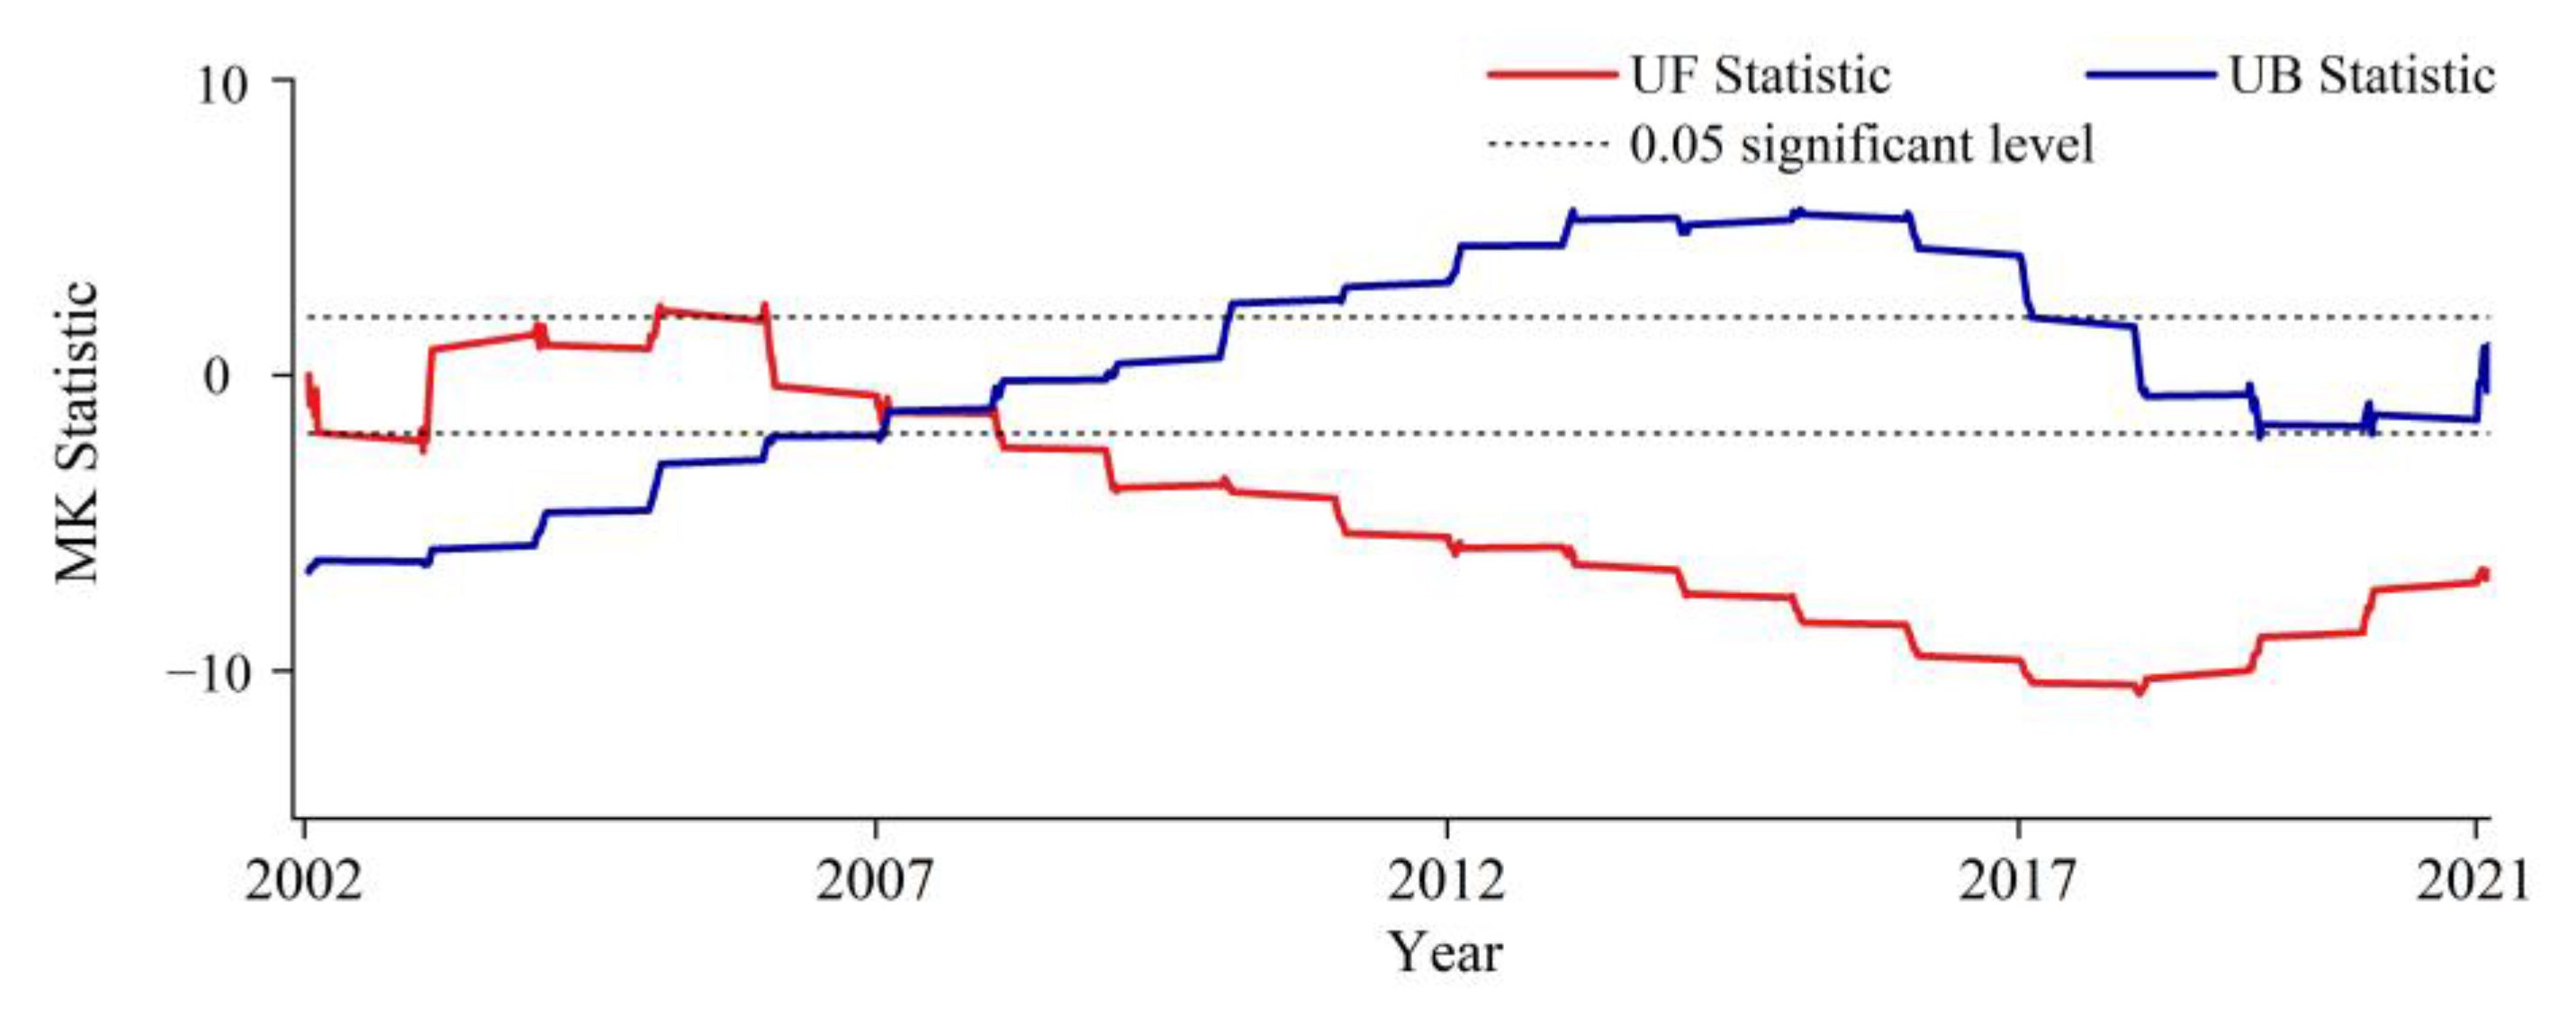
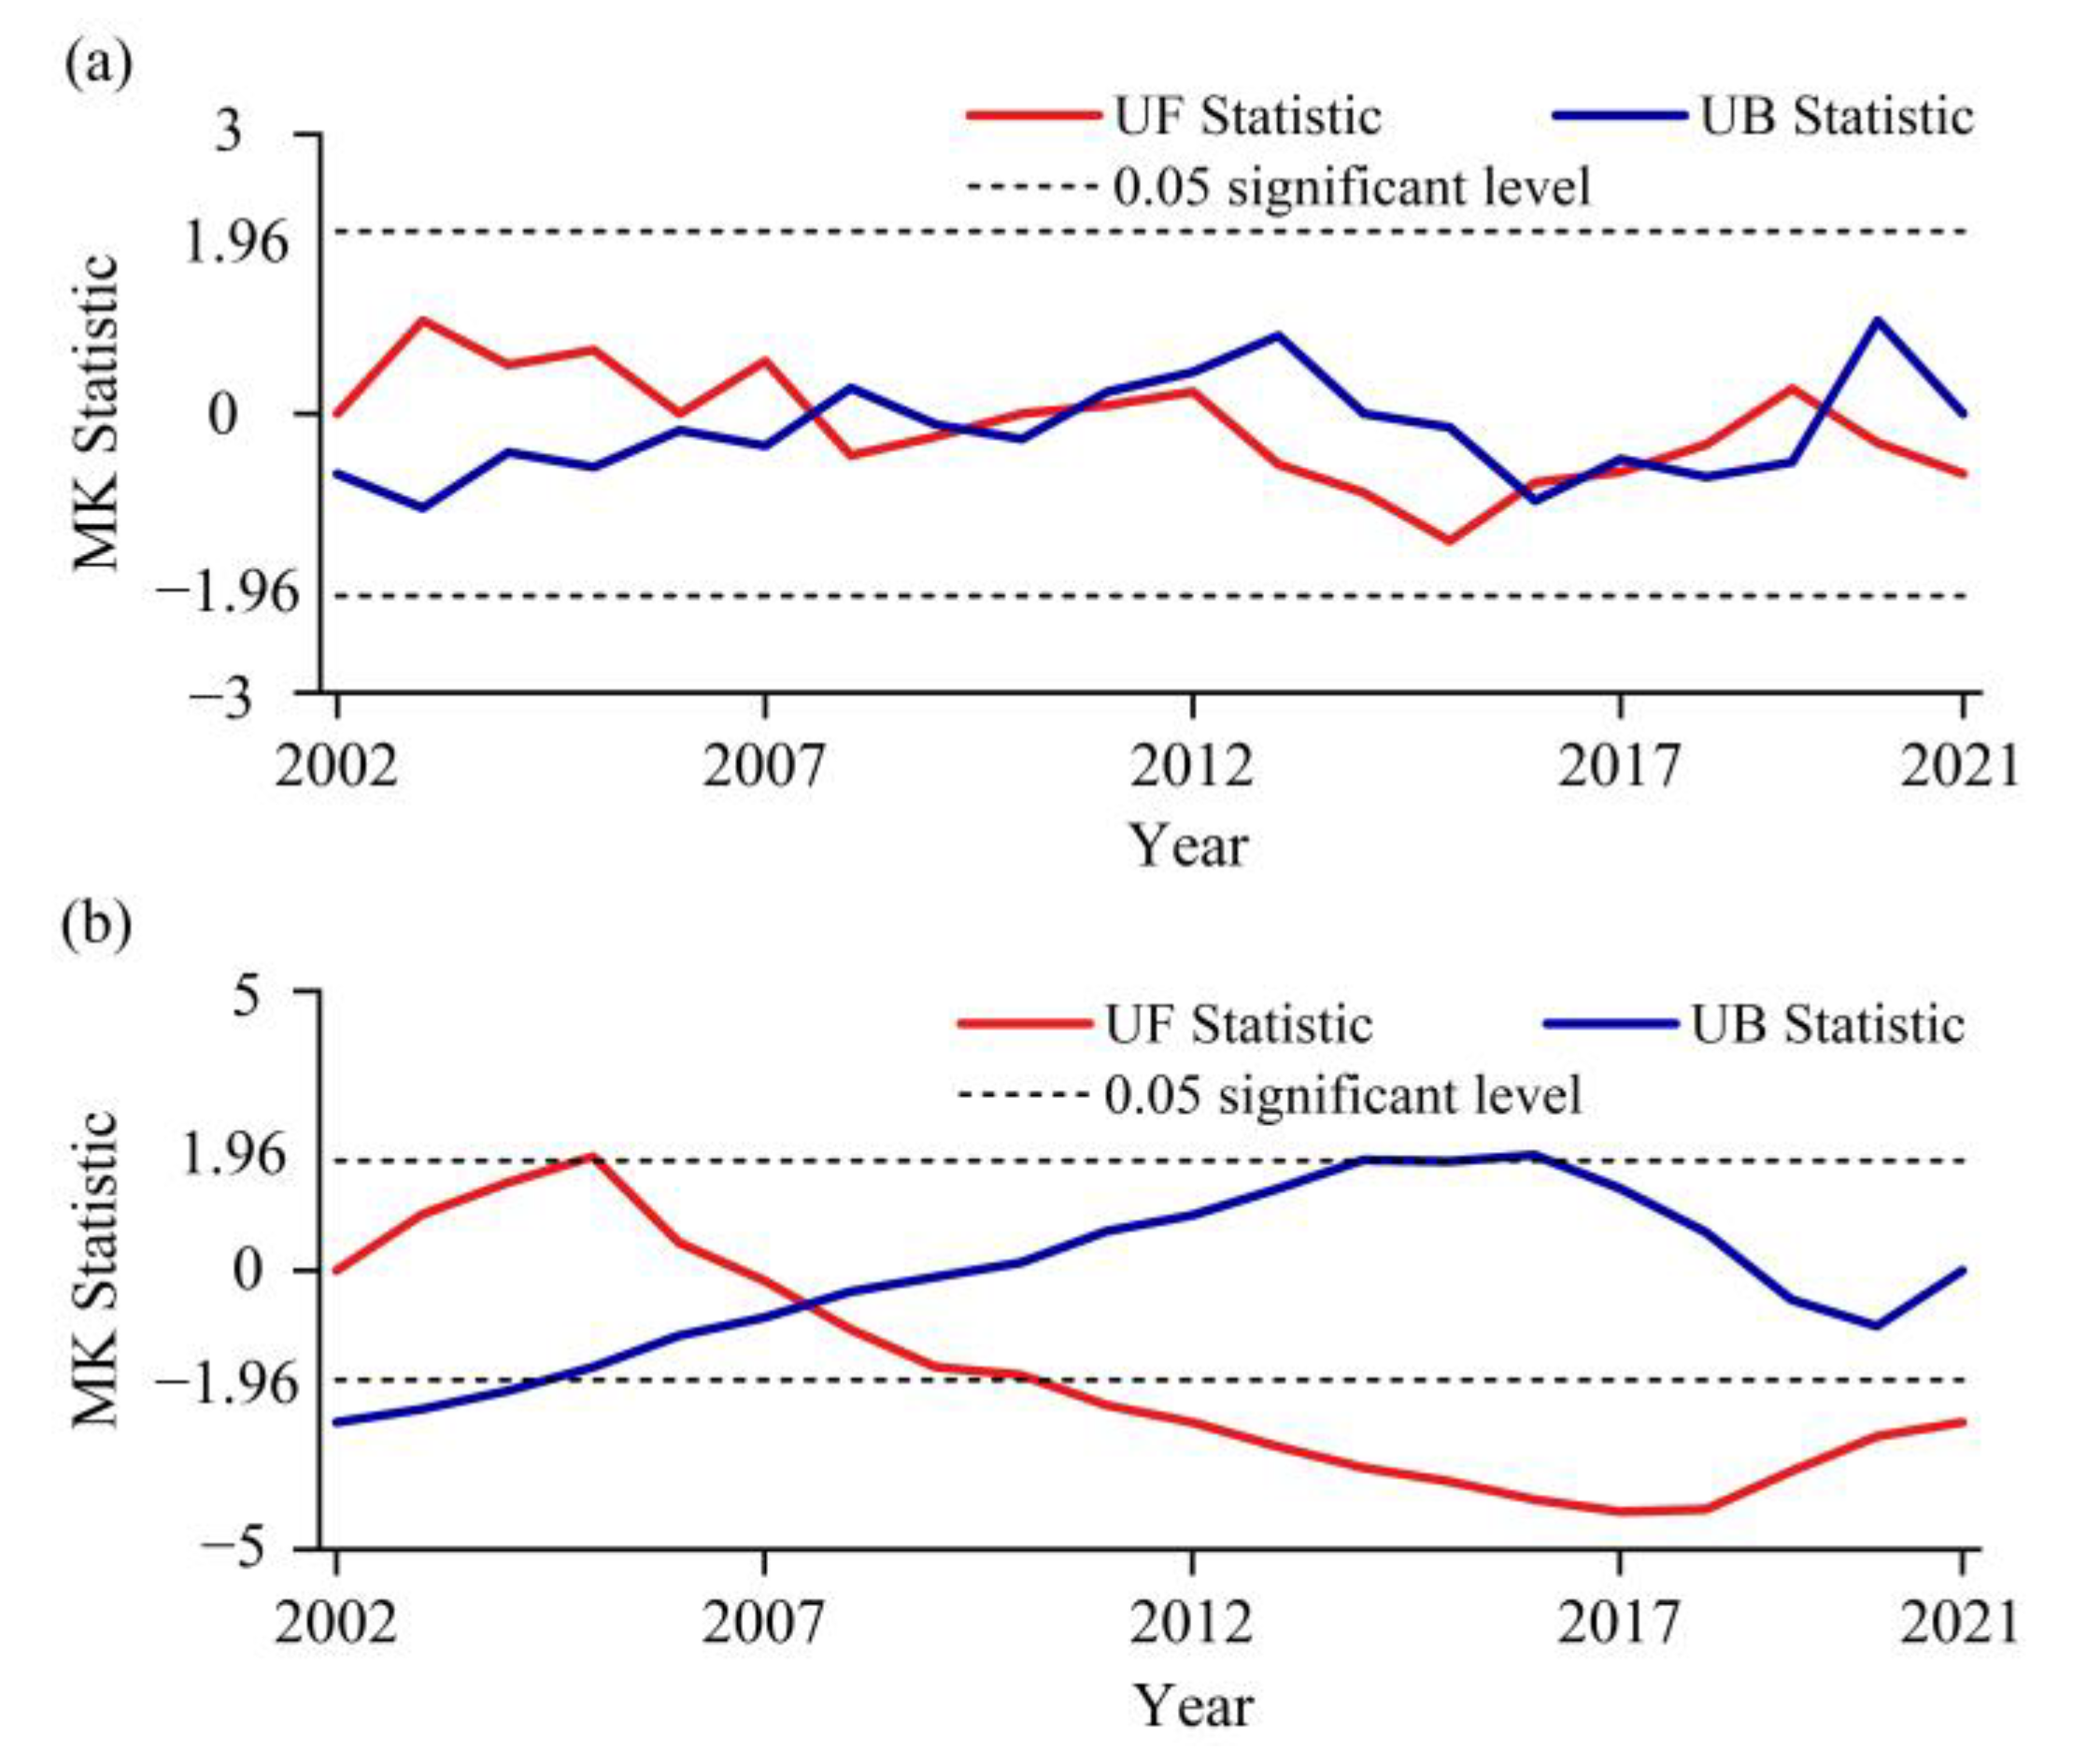
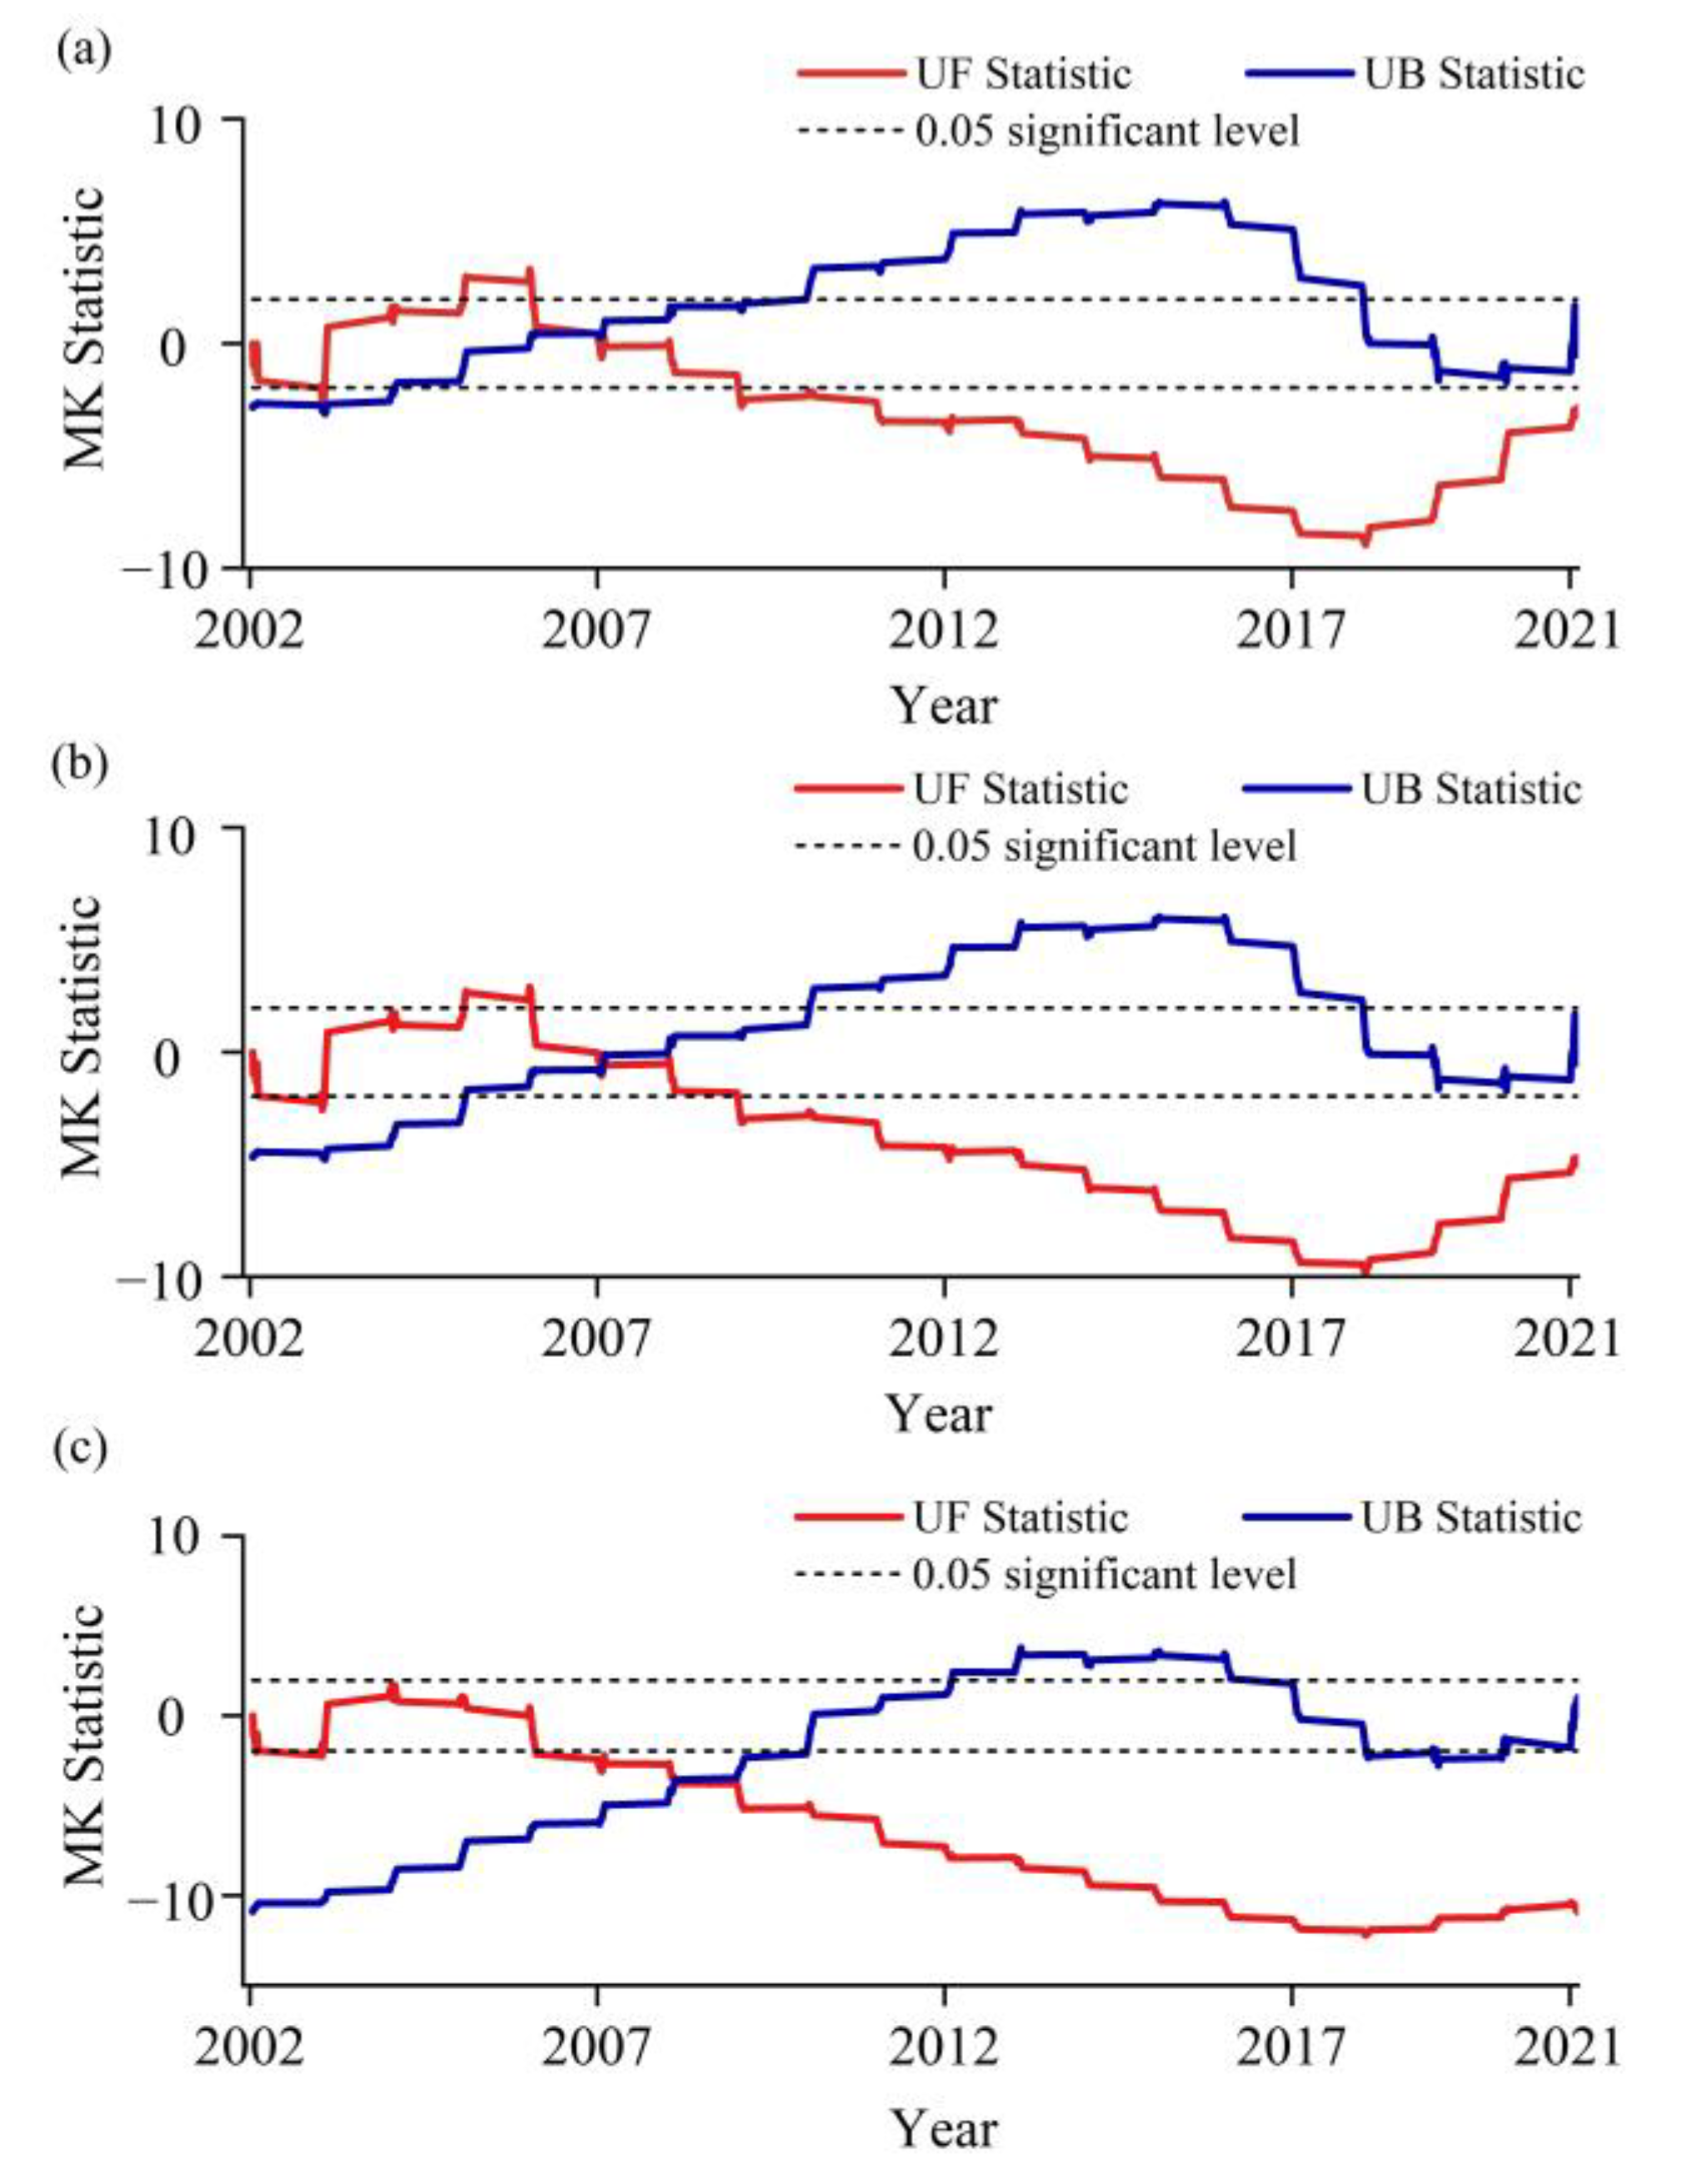
3.3. Mann–Kendall Test
4. Results and Analysis
4.1. Spatial Pattern Characteristics of Surface Water Body Area
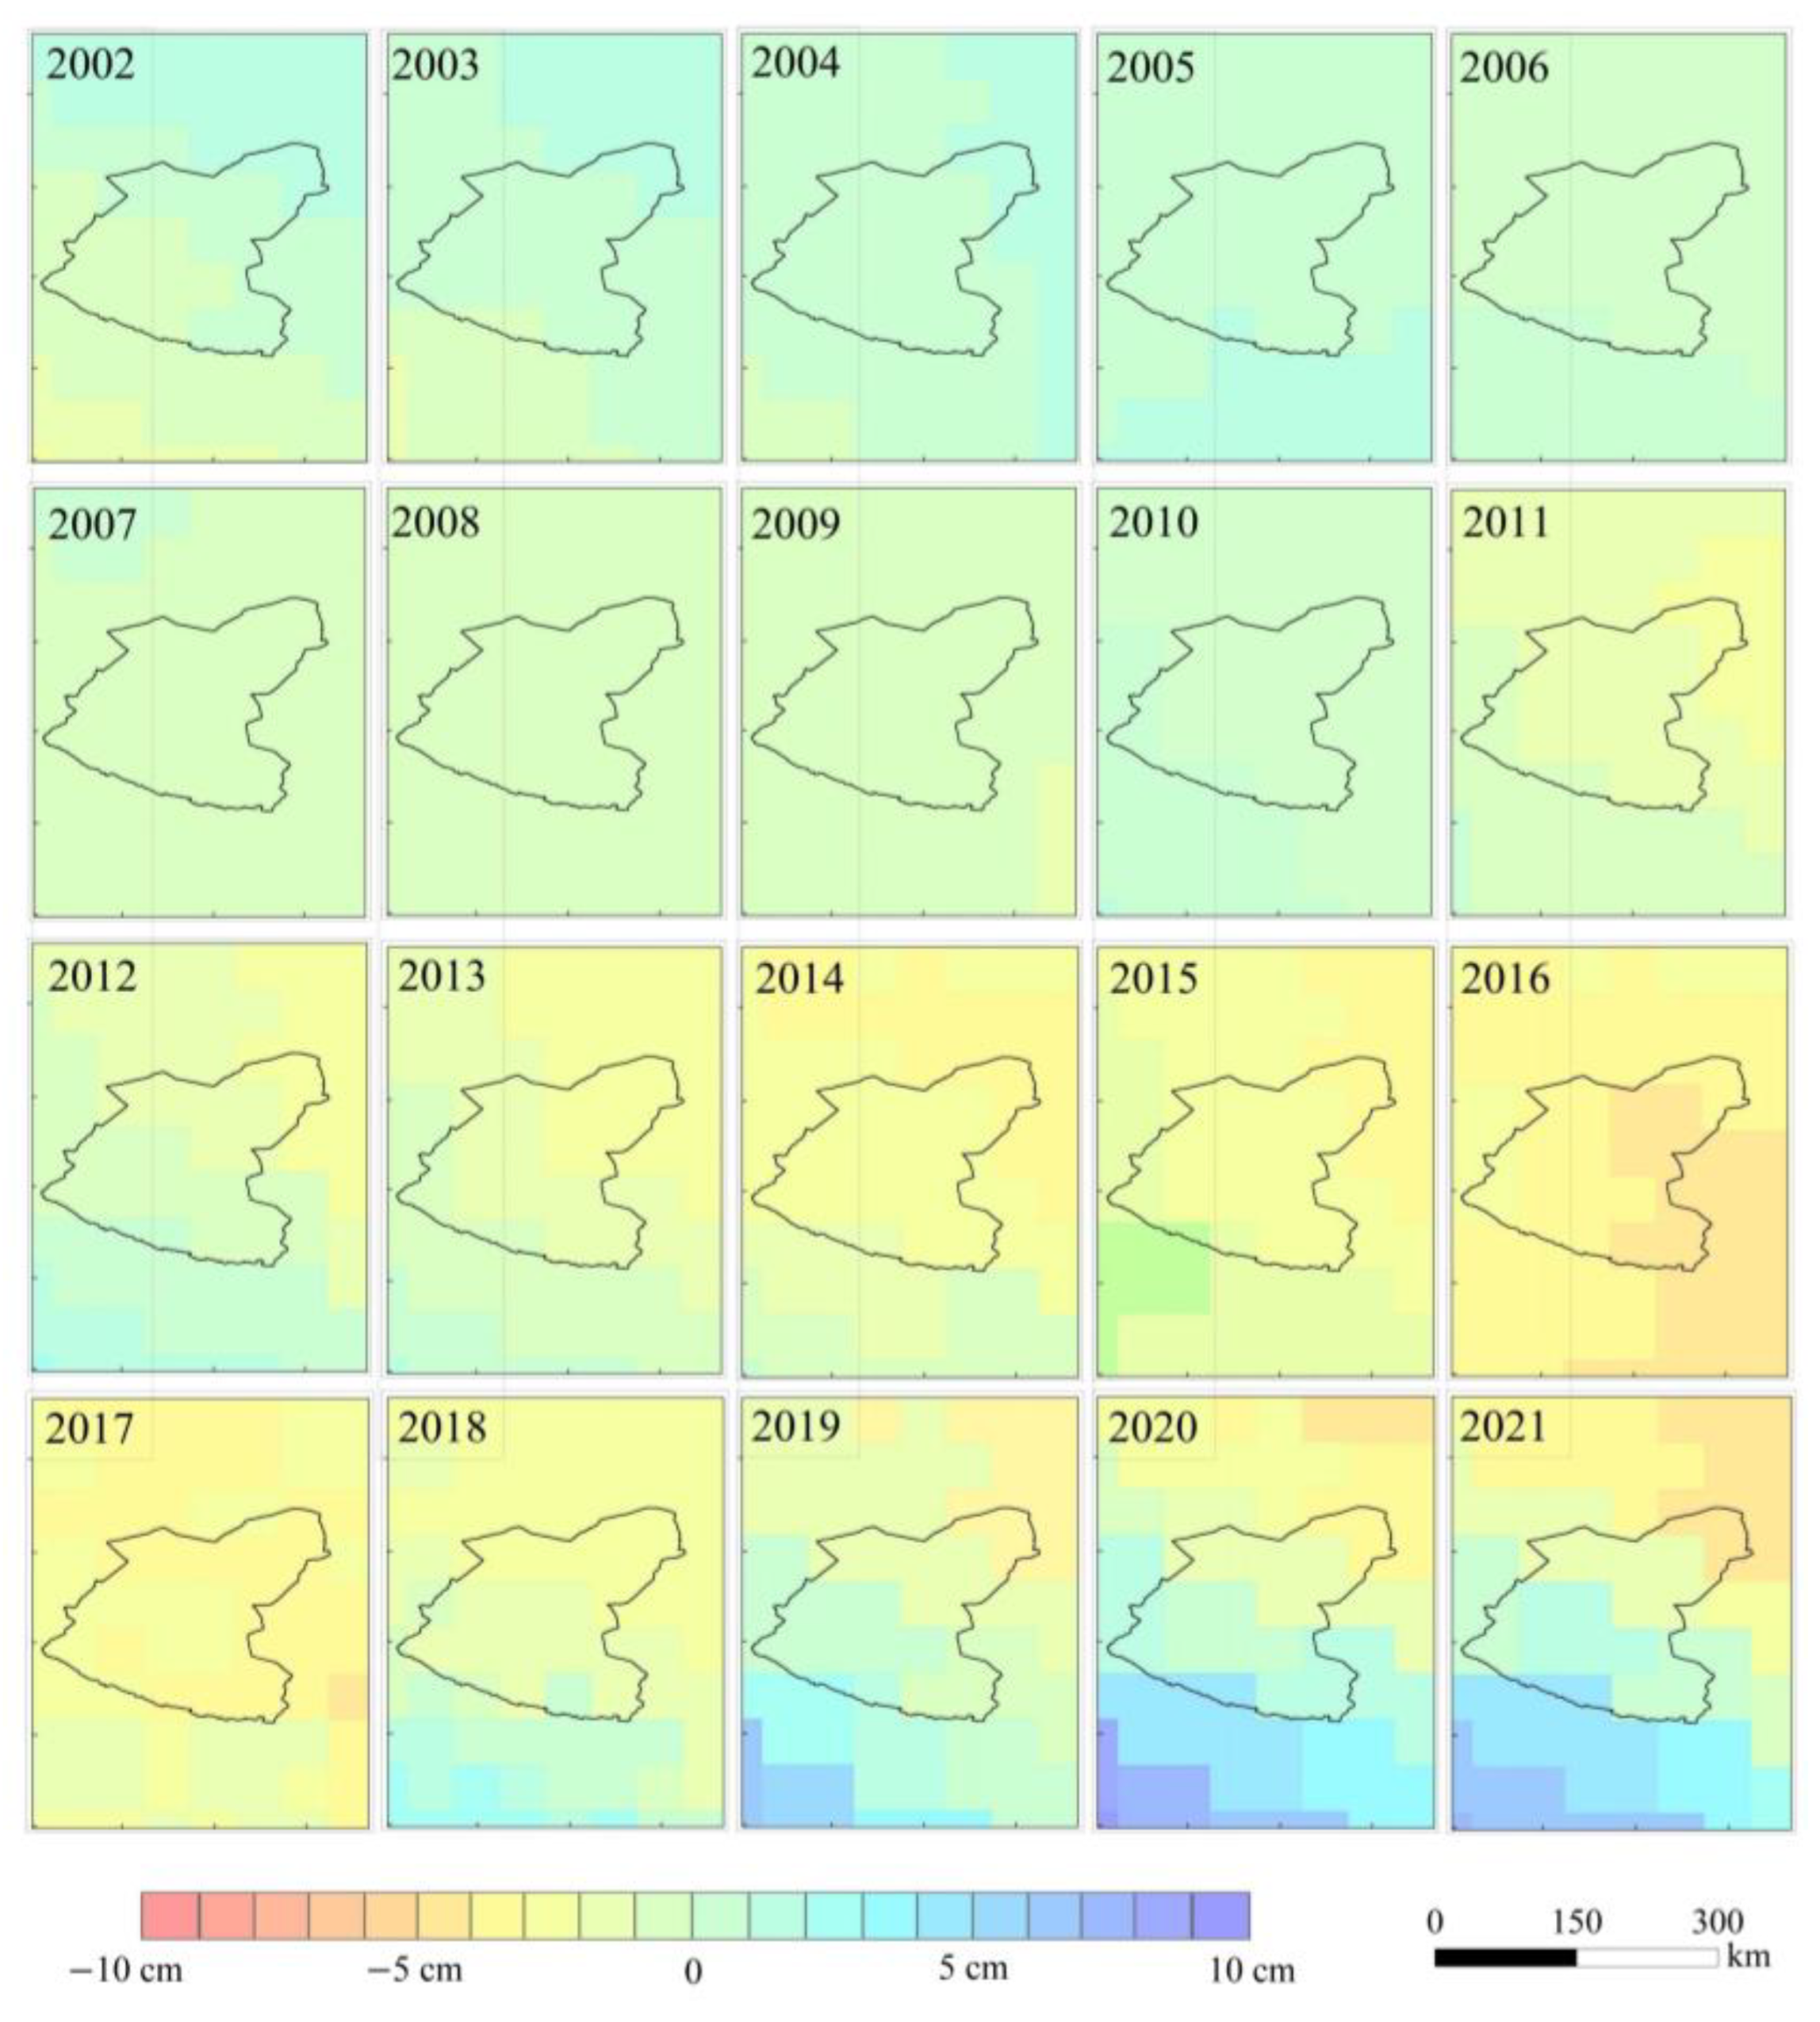
4.2. Analysis of Temporal and Spatial Variations of TWS
4.2.1. Spatial Distribution Characteristics
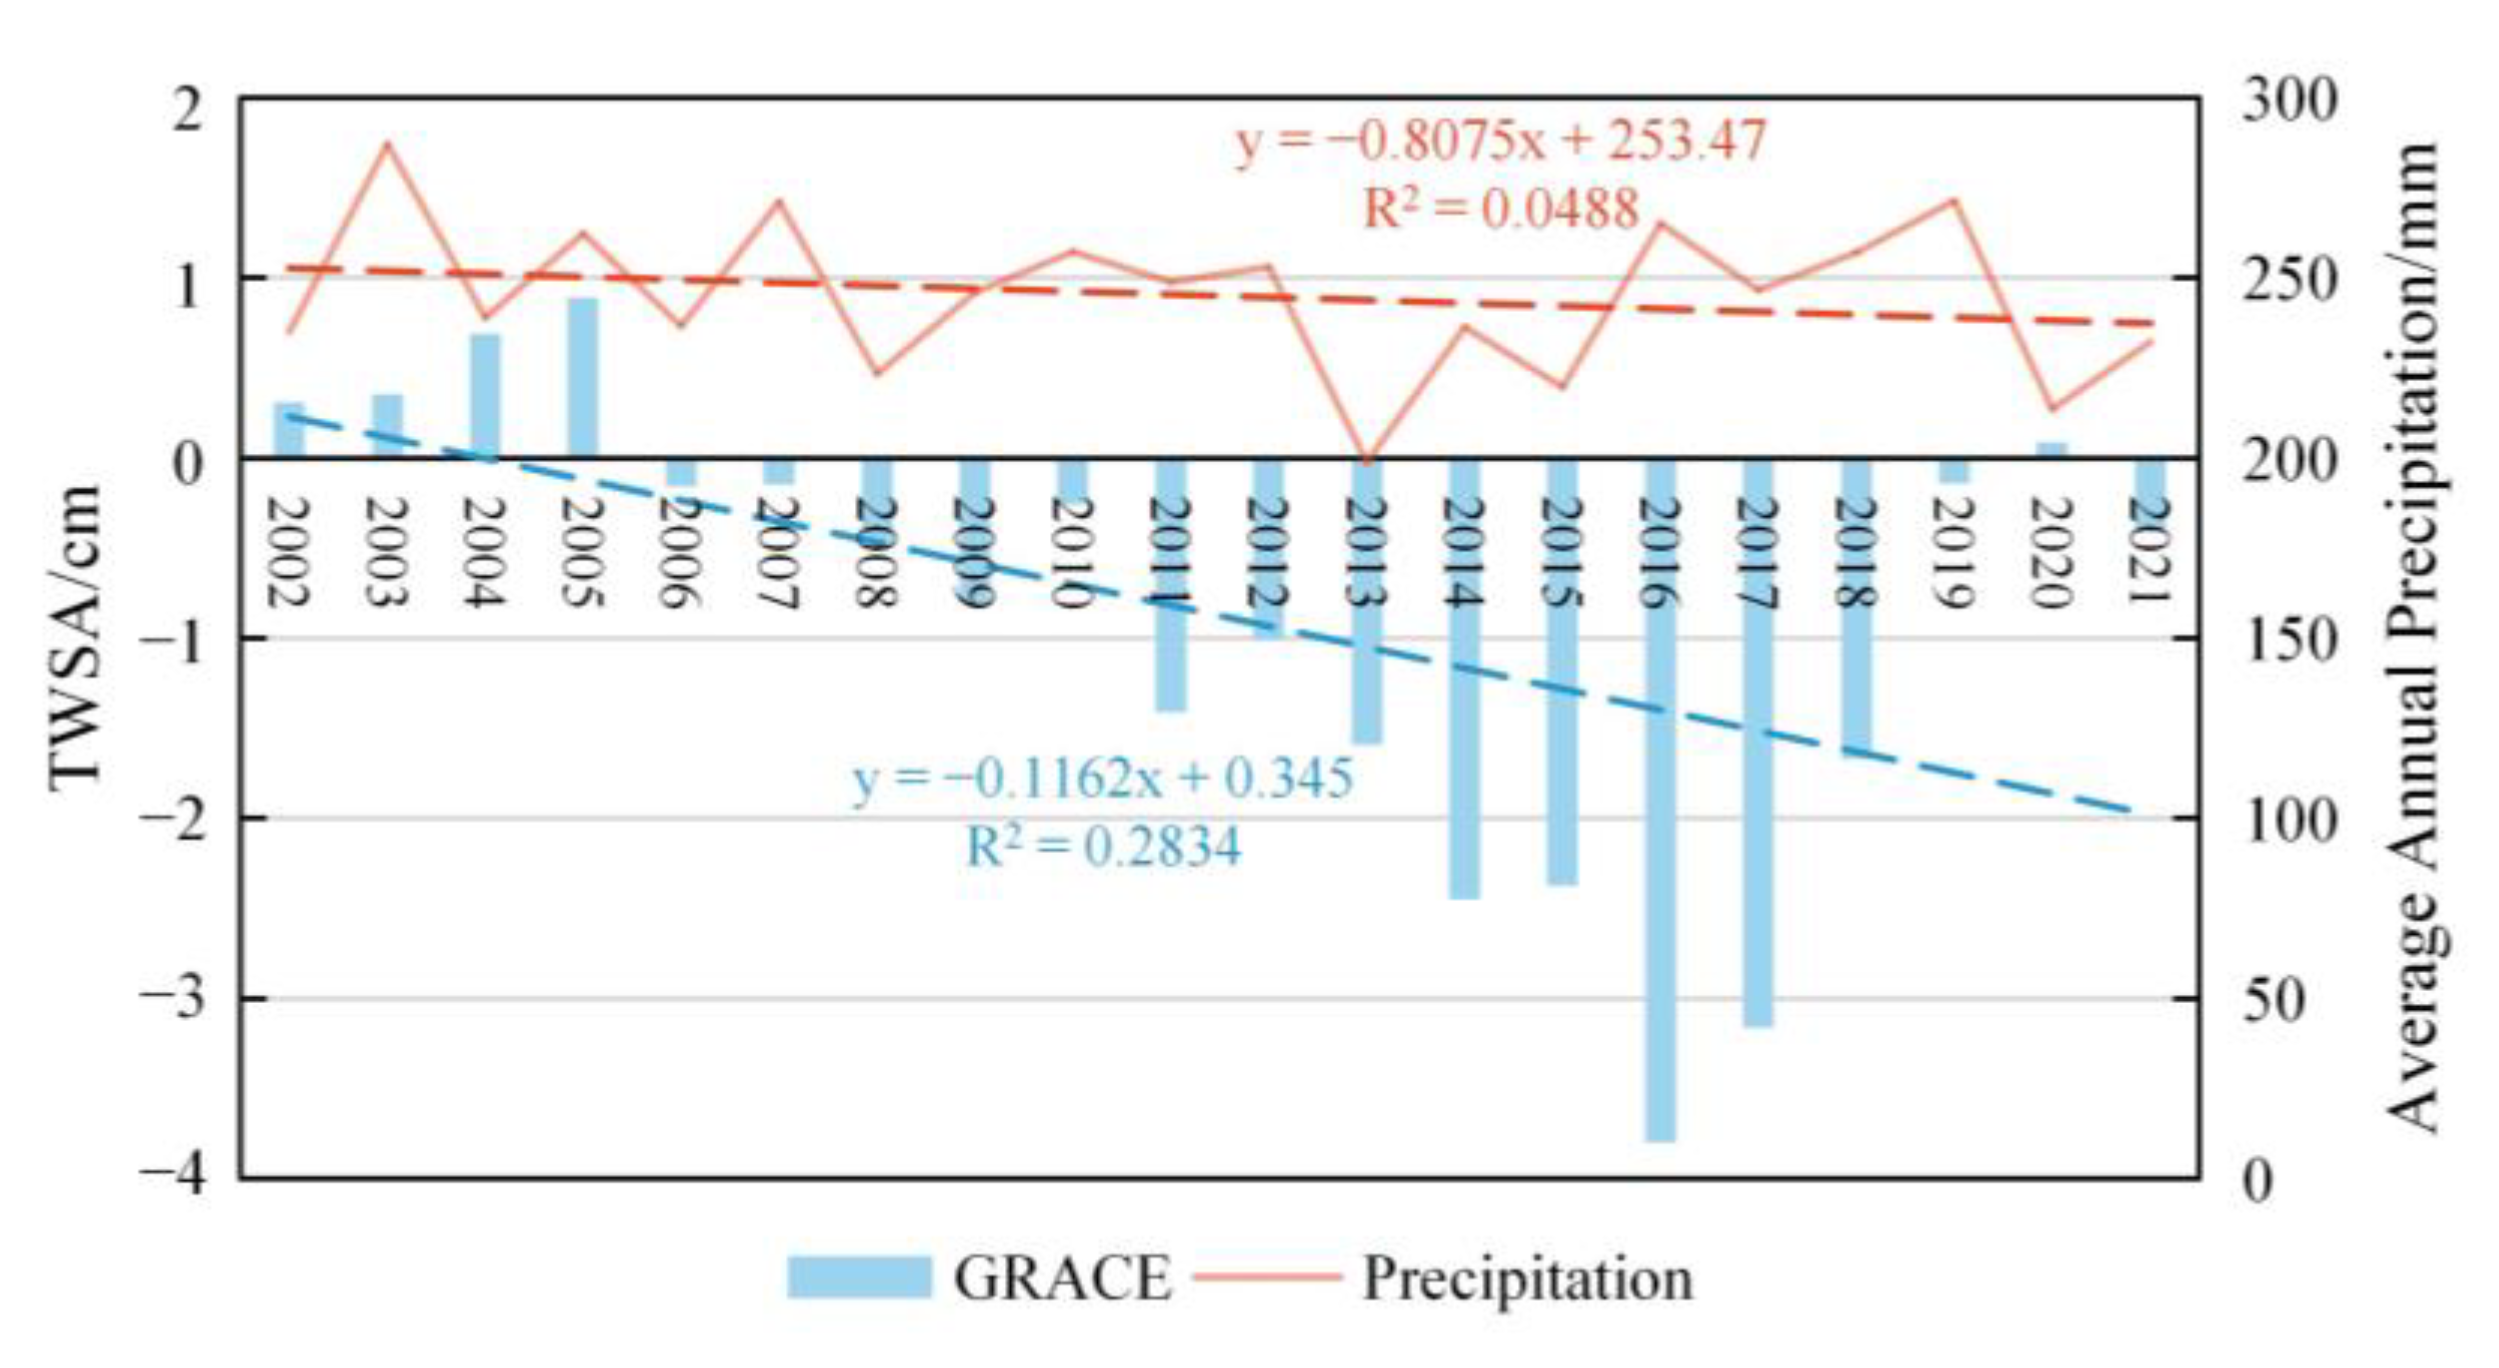
4.2.2. Time Variation Characteristics
4.3. Seasonal Characteristics of Water Storage Changes
5. Discussion
5.1. Impact of Climate Change on Water Storage
5.2. Impact of Water Projects on the Basin TWS
5.3. Uncertainty Analysis
6. Conclusions
Author Contributions
Funding
Data Availability Statement
Acknowledgments
Conflicts of Interest
References
- Vörösmarty, C.J.; McIntyre, P.B.; Gessner, M.O.; Dudgeon, D.; Prusevish, A.; Green, P.; Glidden, S.; Bunn, S.E.; Sullivan, C.A.; Liermann, C.D.; et al. Global threats to human water security and river biodiversity. Nature 2010, 467, 555–561. [Google Scholar] [CrossRef] [PubMed] [Green Version]
- Zhu, G.; Liu, Y.; Wang, L.; Sang, L.; Zhao, L.; Zhang, Z.; Lin, X.; Qiu, D. The isotopes of precipitation have climate change signal in arid Central Asia. Glob. Planet. Chang. 2023, 225, 104103. [Google Scholar] [CrossRef]
- Ma, T.; Sun, S.; Fu, G.; Hall, J.W.; Ni, Y.; He, L.; Yi, J.; Zhao, N.; Du, Y.; Tao, P.; et al. Pollution exacerbates China’s water scarcity and its regional inequality. Nat. Commun. 2020, 11, 650. [Google Scholar] [CrossRef] [Green Version]
- Tangdamrongsub, N.; Han, S.-C.; Jasinski, M.F.; Šprlák, M. Quantifying water storage change and land subsidence induced by reservoir impoundment using GRACE, Landsat, and GPS data. Remote Sens. Environ. 2019, 233, 111385. [Google Scholar] [CrossRef]
- Tapley, B.D.; Bettadpur, S.; Ries, J.C.; Thomptson, P.F.; Wtkings, M.W. GRACE measurements of mass variability in the Earth system. Science 2004, 305, 503–505. [Google Scholar] [CrossRef] [PubMed] [Green Version]
- Tapley, B.D.; Watkins, M.M.; Flechtner, F.; Reigber, C.; Bettadpur, S.; Roddel, M.; Sasgen, I.; Famiglietti, J.S.; Landerer, F.W.; Chambers, D.P.; et al. Contributions of GRACE to understanding climate change. Nat. Clim. Chang. 2019, 9, 358–369. [Google Scholar] [CrossRef]
- Singha, C.; Swain, K.C. Using Earth Observations and GLDAS Model to Monitor Water Budgets for River Basin Management. In Advanced Modelling and Innovations in Water Resources Engineering: Select Proceedings of AMIWRE 2021; Springer: Singapore, 2021; pp. 493–515. [Google Scholar]
- Ren, L.; Yu, W.; Jiang, S.; Yao, C. GRACE and GRACE-FO-based terrestrial water storage and its influencing factor analysis of the Yellow River Basin. Water Resour. Prot. 2022, 38, 26–32. [Google Scholar]
- Liu, J.; Zhu, G.; Zhao, K.; Jiao, Y.; Liu, Y.; Yang, M.; Zhang, W.; Qiu, D.; Lin, X.; Ye, L. GRACE Combined with WSD to Assess the Change in Drought Severity in Arid Asia. Remote Sens. 2022, 14, 3454. [Google Scholar] [CrossRef]
- Rodell, M.; Famiglietti, J.S.; Wiese, D.N.; Reager, J.T.; Beaudoing, H.K.; Landerer, F.W.; Ho, M.-H. Emerging trends in global freshwater availability. Nature 2018, 557, 651–659. [Google Scholar] [CrossRef]
- Wei, L.; Jiang, S.; Ren, L.; Tan, H.; Ta, W.; Liu, Y.; Yang, X.; Zhang, L.; Duan, Z. Spatiotemporal changes of terrestrial water storage and possible causes in the closed Qaidam Basin, China using GRACE and GRACE Follow-On data. J. Hydrol. 2021, 598, 126274. [Google Scholar] [CrossRef]
- Feng, W.; Zhong, M.; Lemoine, J.-M.; Biancale, R.; Hsu, S.-T.; Xia, J. Evaluation of groundwater depletion in North China using the Gravity Recovery and Climate Experiment (GRACE) data and ground-based measurements. Water Resour. Res. 2013, 49, 2110–2118. [Google Scholar] [CrossRef]
- Long, D.; Shen, Y.; Sun, A.; Hong, Y.; Longuevergne, L.; Yang, Z.; Lin, B.; Chen, L. Drought and flood monitoring for a large karst plateau in Southwest China using extended GRACE data. Remote Sens. Environ. 2014, 155, 145–160. [Google Scholar] [CrossRef]
- Zhu, Y.; Liu, S.; Yi, Y.; Qi, M.; Li, M.; Saifullah, M.; Zhang, S.; Wu, S. Spatio-temporal variations in terrestrial water storage and its controlling factors in the Eastern Qinghai-Tibet Plateau. Hydrol. Res. 2021, 52, 323–338. [Google Scholar] [CrossRef]
- Wang, X.; Xiao, X.; Zou, Z.; Dong, J.; Qin, Y.; Doughty, R.B.; Menarguez, M.A.; Chen, B.; Wang, J.; Hui, Y.; et al. Gainers and losers of surface and terrestrial water resources in China during 1989–2016. Nat. Commun. 2020, 11, 3471. [Google Scholar] [CrossRef]
- Lu, J.; Jia, L.; Zhou, J.; Jiang, M.; Zhong, J.; Meneneti, M. Quantification and assessment of global terrestrial water storage deficit caused by drought using GRACE satellite data. IEEE J. Sel. Top. Appl. Earth Obs. Remote Sens. 2022, 15, 5001–5012. [Google Scholar] [CrossRef]
- Vishwakarma, B.D.; Zhang, J.; Sneeuw, N. Downscaling GRACE total water storage change using partial least squares regression. Sci. Data 2021, 8, 95. [Google Scholar] [CrossRef]
- McFeeters, S.K. The use of the Normalized Difference Water Index (NDWI) in the delineation of open water features. Int. J. Remote Sens. 1996, 17, 1425–1432. [Google Scholar] [CrossRef]
- Tao, S.; Fang, J.; Zhao, X.; Zhao, S.; Shen, H.; Hu, H.; Tang, Z.; Wang, Z.; Guo, Q. Rapid loss of lakes on the Mongolian Plateau. Proc. Natl. Acad. Sci. USA 2015, 112, 2281–2286. [Google Scholar] [CrossRef] [Green Version]
- Xu, H. Modification of normalised difference water index (NDWI) to enhance open water features in remotely sensed imagery. Int. J. Remote Sens. 2006, 27, 3025–3033. [Google Scholar] [CrossRef]
- Murray, N.J.; Phinn, S.R.; DeWitt, M.; Legoretta, R.R. The global distribution and trajectory of tidal flats. Nature 2019, 565, 222–225. [Google Scholar] [CrossRef]
- Shugar, D.H.; Burr, A.; Haritashya, U.K.; Kargel, J.S.; Watson, C.S.; Kennedy, M.C.; Bevington, A.R.; Betts, R.A.; Harrison, S.; Strattman, K. Rapid worldwide growth of glacial lakes since 1990. Nat. Clim. Chang. 2020, 10, 939–945. [Google Scholar] [CrossRef]
- Zhu, G.; Liu, Y.; Shi, P.; Jia, W.; Zhou, J.; Liu, Y.; Ma, X.; Pan, H.; Zhang, Y.; Zhang, Z.; et al. Stable water isotope monitoring network of different water bodies in Shiyang River basin, a typical arid river in China. Earth Syst. Sci. Data 2022, 14, 3773–3789. [Google Scholar] [CrossRef]
- Wahr, J.; Swenson, S.; Zlotnicki, V.; Velicogna, I. Time-variable gravity from GRACE: First results. Geophys. Res. Lett. 2004, 31, 293–317. [Google Scholar] [CrossRef] [Green Version]
- Save, H.; Bettadpur, S.; Tapley, B.D. High-resolution CSR GRACE RL05 mascons. J. Geophys. Res. Solid Earth 2016, 121, 7547–7569. [Google Scholar] [CrossRef]
- Mann, H.B. Nonparametric tests against trend. Econom. J. Econom. Soc. 1945, 13, 245–259. [Google Scholar] [CrossRef]
- Panxing, H.; Pengfei, H.; Xiaoyu, M.; Jun, M. Impacts of climate change and human activities on terrestrial water storage. J. Earth Environ. 2019, 10, 38–48. [Google Scholar]
- Wang, J.; Chen, X.; Hu, Q.; Liu, J. Responses of terrestrial water storage to climate variation in the Tibetan Plateau. J. Hydrol. 2020, 584, 124652. [Google Scholar] [CrossRef]
- Shen, H.; Leblanc, M.; Tweed, S.; Liu, W. Groundwater depletion in the Hai River Basin, China, fromin situand GRACE observations. Hydrol. Sci. J. 2015, 60, 671–687. [Google Scholar] [CrossRef] [Green Version]
- Li, W.; Wang, W.; Zhang, C.; Weh, H.; Zhong, Y.; Zhu, Y.; Li, Z. Bridging terrestrial water storage anomaly during GRACE/GRACE-FO gap using SSA method: A case study in China. Sensors 2019, 19, 4144. [Google Scholar] [CrossRef] [Green Version]
- Zhu, Y.; Liu, S.; Yi, Y.; Xie, F.; Grunwalg, R.; Miao, F.; Wu, K.; Wi, M.; Wi, M.; Gao, Y.; et al. Overview of terrestrial water storage changes over the Indus River Basin based on GRACE/GRACE-FO solutions. Sci. Total Environ. 2021, 799, 149366. [Google Scholar] [CrossRef]


Disclaimer/Publisher’s Note: The statements, opinions and data contained in all publications are solely those of the individual author(s) and contributor(s) and not of MDPI and/or the editor(s). MDPI and/or the editor(s) disclaim responsibility for any injury to people or property resulting from any ideas, methods, instructions or products referred to in the content. |
© 2023 by the authors. Licensee MDPI, Basel, Switzerland. This article is an open access article distributed under the terms and conditions of the Creative Commons Attribution (CC BY) license (https://creativecommons.org/licenses/by/4.0/).
Share and Cite
Meng, G.; Zhu, G.; Liu, J.; Zhao, K.; Lu, S.; Li, R.; Qiu, D.; Jiao, Y.; Chen, L.; Sun, N. GRACE Data Quantify Water Storage Changes in the Shiyang River Basin, an Inland River in the Arid Zone. Remote Sens. 2023, 15, 3209. https://doi.org/10.3390/rs15133209
Meng G, Zhu G, Liu J, Zhao K, Lu S, Li R, Qiu D, Jiao Y, Chen L, Sun N. GRACE Data Quantify Water Storage Changes in the Shiyang River Basin, an Inland River in the Arid Zone. Remote Sensing. 2023; 15(13):3209. https://doi.org/10.3390/rs15133209
Chicago/Turabian StyleMeng, Gaojia, Guofeng Zhu, Jiawei Liu, Kailiang Zhao, Siyu Lu, Rui Li, Dongdong Qiu, Yinying Jiao, Longhu Chen, and Niu Sun. 2023. "GRACE Data Quantify Water Storage Changes in the Shiyang River Basin, an Inland River in the Arid Zone" Remote Sensing 15, no. 13: 3209. https://doi.org/10.3390/rs15133209