Article

Mitigation of Millimeter-Wave Radar Mutual Interference Using Spectrum Sub-Band Analysis and Synthesis

1
School of Electronic and Information Engineering, Beijing Jiaotong University, Beijing 100044, China
2
Beijing Institute of Radio Measurement, Beijing 100854, China
*
Author to whom correspondence should be addressed.
Remote Sens. 2023, 15(13), 3210; https://doi.org/10.3390/rs15133210
Submission received: 19 May 2023 / Revised: 15 June 2023 / Accepted: 19 June 2023 / Published: 21 June 2023
(This article belongs to the Special Issue Advances in Radar Systems for Target Detection and Tracking)

Abstract

:
Millimeter-wave radars are widely used in automotive radars because of their all-weather and all-day operation capability. However, as more and more radar sensors are used, the possibility of mutual interference between radars increases dramatically. Severe interference increases the noise level, affects target detection performance, and can lead to missed detection and wrong detection. In this study, a novel solution to the problem of mutual radar interference is introduced. The method is based on the analysis and synthesis of spectrum sub-bands. Specifically, the received radar signal is partitioned into sub-bands, after which interference mitigation is carried out in each sub-band. Finally, the signals are reconstructed to obtain interference-free data. The effectiveness of this approach is evaluated using both a simulated multi-target scenario and a real-life experimental environment. The results demonstrate that the proposed method outperforms existing techniques in terms of interference mitigation while exhibiting rapid processing speeds.

1. Introduction

As road safety has received increasing attention, various safety-critical driver assistance functions such as automatic emergency braking (AEB), blind spot detection (BSD), and adaptive cruise control (ACC) have been rapidly developed [1]. Advanced driver assistance systems (ADASs) improve the driving experience while warning drivers of impending hazards, thereby enhancing driving safety [2,3]. As human intervention in ADAS decreases, sensing systems need to acquire environmental information more accurately in order to provide the environmental basis for ADAS decisionmaking [4]. Thus, as the link between the vehicle and the environment, the sensing system represents the eyes of an autonomous vehicle.
The performance of the sensing system determines the capability of the ADAS. Existing sensing systems rely on sensors such as lasers, cameras, and radars [5,6,7,8,9]. Among these sensors, millimeter-wave (mmWave) radar plays an important role in ADAS due to its excellent all-weather working capability [10]. Radar is a popular installation in vehicles because of its low cost and ability to provide highly precise velocity measurements [11]. The application of radar sensors helps to avoid collisions and improve the safety of driving [12]. The importance of millimeter-wave radar in ADAS has led to a significant increase in its deployment [13]. Unfortunately, as the density of radar sensors on the road increases, the potential for mutual interference rises dramatically [14]. Interference caused by unwanted signals from other automotive radar sensors is referred to as mutual interference [15,16]. Interference increases the noise in the echo signal and decreases the signal-to-noise ratio (SNR), which affects radar detection performance, leading to an increase in missed detections and false alarms [17,18]. In certain cases, it can lead to false targets when the victim radar and interfering radar waveforms are identical [19]. Failure to use interference suppression techniques can result in incorrect target identification when target tracking is performed [20,21,22]. In summary, mutual interference exposes a number of vehicle safety issues.
Signal processing methods are generally used to address the degradation of radar detection performance caused by mutual interference. Zeroing the beat-frequency samples affected by the interference is the most straightforward mitigation method, however, it leads to signal discontinuities [23]. Although adding a cosine window can solve the signal discontinuity problem, there remains a loss of useful target signal when eliminating the interference [24]. To address information loss during interference mitigation, autoregressive (AR) models are used to predict the target information in the disturbed part [25]. Superior performance can be obtained with this method when the duty cycle of interference is low. However, the number of training samples available is insufficient when the duty cycle of interference is high, resulting in a decline in the performance of this method. All of the above methods perform interference mitigation in the time domain; recently, interference mitigation methods based on the time–frequency domain have been proposed [26]. Using time–frequency domain information can obtain more accurate interference localization results than time domain-based methods, thereby achieving better interference mitigation performance; however, due to the expansion of the interference information extraction region from the one-dimensional time domain to the two-dimensional time–frequency domain, a large amount of storage and computational power are required, limiting the application of time–frequency domain-based methods in practice. Consequently, there is a need to investigate additional interference mitigation techniques that can offer superior outcomes compared to time domain methods while presenting lower requirements for storage and computational resources than time–frequency domain-based methods.
To solve the limitations of AR model-based prediction, inaccuracy of interference localization in time domain-based methods, and large storage and computational effort in time–frequency domain-based methods, methods relying on signal decomposition have been proposed [27,28,29,30]. These decompose the received radar signal, then perform interference detection and mitigation on the different sub-signals obtained from the decomposition. Finally, the received target signal is reconstructed to yield a signal devoid of interference. Common decomposition techniques include wavelet decomposition, empirical modal decomposition (EMD), and variational mode decomposition (VMD). In [27], an interference mitigation technique based on wavelet decomposition was proposed in which the radar received signal is decomposed by wavelet transform, then the wavelet coefficients corresponding to the interference are thresholded, allowing the interference signal to be extracted after wavelet reconstruction. In this approach, interference mitigation is performed by subtracting the interference signal from the received signal. In methods based on EMD and VMD, the received signal is decomposed into different intrinsic mode function (IMF) components, then processes designed to detect and mitigate interference are carried out for each individual IMF component. Ultimately, the act of reconstruction yields a signal free of unwanted interference [29,30].
It is worth noting that the target’s range is proportional to the beat frequency in the echo signal of mmWave radar, and longer-range targets have higher beat frequencies. In cases of mutual interference, the target echo is confined to a sole frequency signal, whereas the interference assumes a broadband signal extending over a broad range. The efficacy of mmWave radars in mitigating interference may depend on the specific decomposition method chosen, particularly in relation to varied ranges. The frequency attributes of the wavelet and EMD techniques appear analogous to those of filter banks, in that each ensuing decomposition mode occupies the upper half of residuals of its previous pattern [31,32]. This characteristic leads to non-uniform decomposition in terms of frequency, meaning that the distance is not uniformly partitioned. This causes differences in the signal-to-interference ratio (SIR) between different decomposition modes, making the interference mitigation effect different in each mode, which leads to a decrease in the overall interference mitigation effect. In [30], VMD was used to decompose the signal into a collection of bandlimited IMFs. These IMFs possess distinct center frequencies and are quasi-orthogonal to one another. Thus, the decomposition result is uniform in range, achieving better interference mitigation performance. However, because VMD is a complex adaptive signal decomposition algorithm, the real-time performance of the algorithm cannot be guaranteed when it is implemented in practice [33].
In summary, time domain-based interference mitigation methods have the problem of less information, while the time–frequency domain-based methods have the problem of large storage capacity. The method of interference mitigation based on signal decomposition is chosen in this work, as it can obtain more target and interference information to provide an improved interference mitigation effect compared to time domain-based methods while at the same time having lower storage requirements compared to the time–frequency domain-based methods. In addition, to address the problem of wavelet and EMD decomposition being unable to split the spectrum equally and avoid the large computational burden of the VMD method affecting real-time performance, an interference mitigation method based on spectrum sub-band processing is proposed. Using spectrum decomposition of the received radar signal, the spectrum is divided equally into different sub-bands, then interference is mitigated in each sub-band, and finally the information of the sub-bands is integrated to obtain an interference-free signal. The decomposition and synthesis process of the spectrum is implemented using the fast Fourier transform (FFT), significantly improving the runtime efficiency of the algorithm.
Compared to previous interference mitigation methods, the proposed approach makes the following contributions:
  • Compared with interference mitigation methods based on signal decomposition, the spectrum sub-band decomposition method used in this work provides more flexibility in sub-band processing, as it can flexibly control the bandwidth and number of sub-bands compared to EMD and wavelet decomposition. Meanwhile, the spectrum sub-band decomposition based on FFT has faster runtime compared to VMD, which is beneficial to real-time processing.
  • For multi-target scenes, the signal is subjected to a sub-band decomposition that yields multiple bands with center frequencies that vary in value, meaning that the distance segments represented by each sub-band are approximately equal, effectively controlling the number of targets contained in each sub-band. These sub-bands exhibit orthogonality, indicating that they are mathematically independent of one another, thereby reducing the complexity of signal reconstruction.
  • Compared with the time domain method, spectrum sub-band decomposition can utilize more information, resulting in improved interference mitigation performance. Compared with time–frequency domain methods, the proposed approach has the advantage of low complexity.
  • The spectrum decomposition makes the interference power in the sub-bands lower, which in turn enhances the SIR and benefits interference detection.
  • The interference signal in each sub-band has a small support area in the time domain, which is more favorable for subsequent interference detection and signal recovery.
The ensuing sections of this paper are organized as follows. Section 2 illustrates the construction of the model of mutual interference signals. Section 3 expounds on the mitigation of interference by means of the sub-band decomposition of the signal spectrum. Performance assessments of the proposed technique conducted through simulations and real-world experimentation are described in Section 4 and Section 5, respectively. Finally, the paper is concluded in Section 6.

2. Signal Model with Mutual Interference

Linear frequency modulated (LFM) signals, known as chirp signals, undergo a linear increase in signal frequency over time, and are widely used in mmWave radar systems. LFM signals have a large time–bandwidth product, making it possible to achieve both high resolution and SNR. The workflow of an mmWave radar in a mutual interference scenario is shown in Figure 1.
In the signal transmitting phase, the waveform generator outputs the LFM signal, which is amplified by the power amplifier (PA) and radiated through the transmitting antenna into free space. The transmitted radar signal at this time is
x t ( t ) = 2 P t sin 2 π f c t + π S t 2 ,
where t is the time,  P t  is the transmitted signal power,  f c  is the carrier frequency, S is the slope of the transmitted LFM signal, which equals  B / T c , and B and  T c  are the bandwidth and duration of the transmitted signal, respectively.
In the merging phase of interference and target, the transmitted signal is scattered when it encounters the target, then this signal is reflected back to the radar. Subsequently, the radar receives an echo corresponding to the target:
x e ( t ) = 2 P e sin 2 π f c ( t τ ) + π S ( t τ ) 2 ,
where  P e  is the power of the target echo, which is related to the radar cross-section (RCS) of the target and is inversely proportional to the fourth power of the distance between the target and the radar, and  τ  is the time delay, which is related to the distance between the target and the radar as follows:
τ = 2 ( R v t ) c ,
where R is the distance between the target and the radar and v is the target’s velocity in the radial direction of the radar, which causes the Doppler frequency in the echo signal.
When there is mutual interference, it is commonly attributed to the presence of other radars, and generally has a different frequency, time delay, and LFM slope than the transmitted signal; the interference signal is
x i ( t ) = 2 P i sin 2 π f c i t τ i + π S i t τ i 2 ,
where  τ i  is the time delay of the interference,  S i  is the LFM slope of the interference signal, and the interference power  P i  exhibits an inverse square relationship with the spatial separation between the interfering and victim radars.
In the signal reception phase, the target echo and the interfering signal are mixed together and captured by the receiving antenna. The captured signal is then forwarded to a low-noise amplifier (LNA) for amplification. The received signal is
x r ( t ) = x e ( t ) + x i ( t ) .
Then, the received signal is mixed with the reference signal, and the beat-frequency signal is obtained as follows [30]:
x b ( t ) = x t ( t ) × x r ( t ) = P t P e sin 2 π S τ t + 2 π f c τ π S τ 2 + P t P i sin 2 π f c + 1 2 S t f c i 1 2 S i t + S i τ i t + 2 π f c i t i 1 2 S i τ i t i .
As can be seen from (6), the beat frequency signal is composed of three terms in the presence of interference, where the first term is the target echo in the form of a single frequency and the second and third terms are the interference. From the third term, it can be seen that the interference is a broadband signal in the form of LFM.

3. Interference Mitigation Method

In the signal obtained from the mmWave radar via beat frequency, the target behaves as a mono-frequency signal, in contrast to the interfering broadband signal. It is worth noting that the power of the interfering signal usually exceeds the power of the target echo, as the interfering signal travels a one-way propagation while the target echo travels along two-way propagation. Therefore, there exists a spectral line in the received signal that corresponds to the target, while the interference manifests as broadband spectrum noise. For this feature, if the beat frequency signal’s spectrum undergoes sub-band decomposition to yield various orthogonal sub-bands, the broadband spectrum interference similarly undergoes decomposition into distinct sub-bands, while the single-frequency target maintains the same power in the respective sub-bands. After such processing, the SIR in the sub-band is improved, which helps with subsequent interference mitigation and target information recovery.
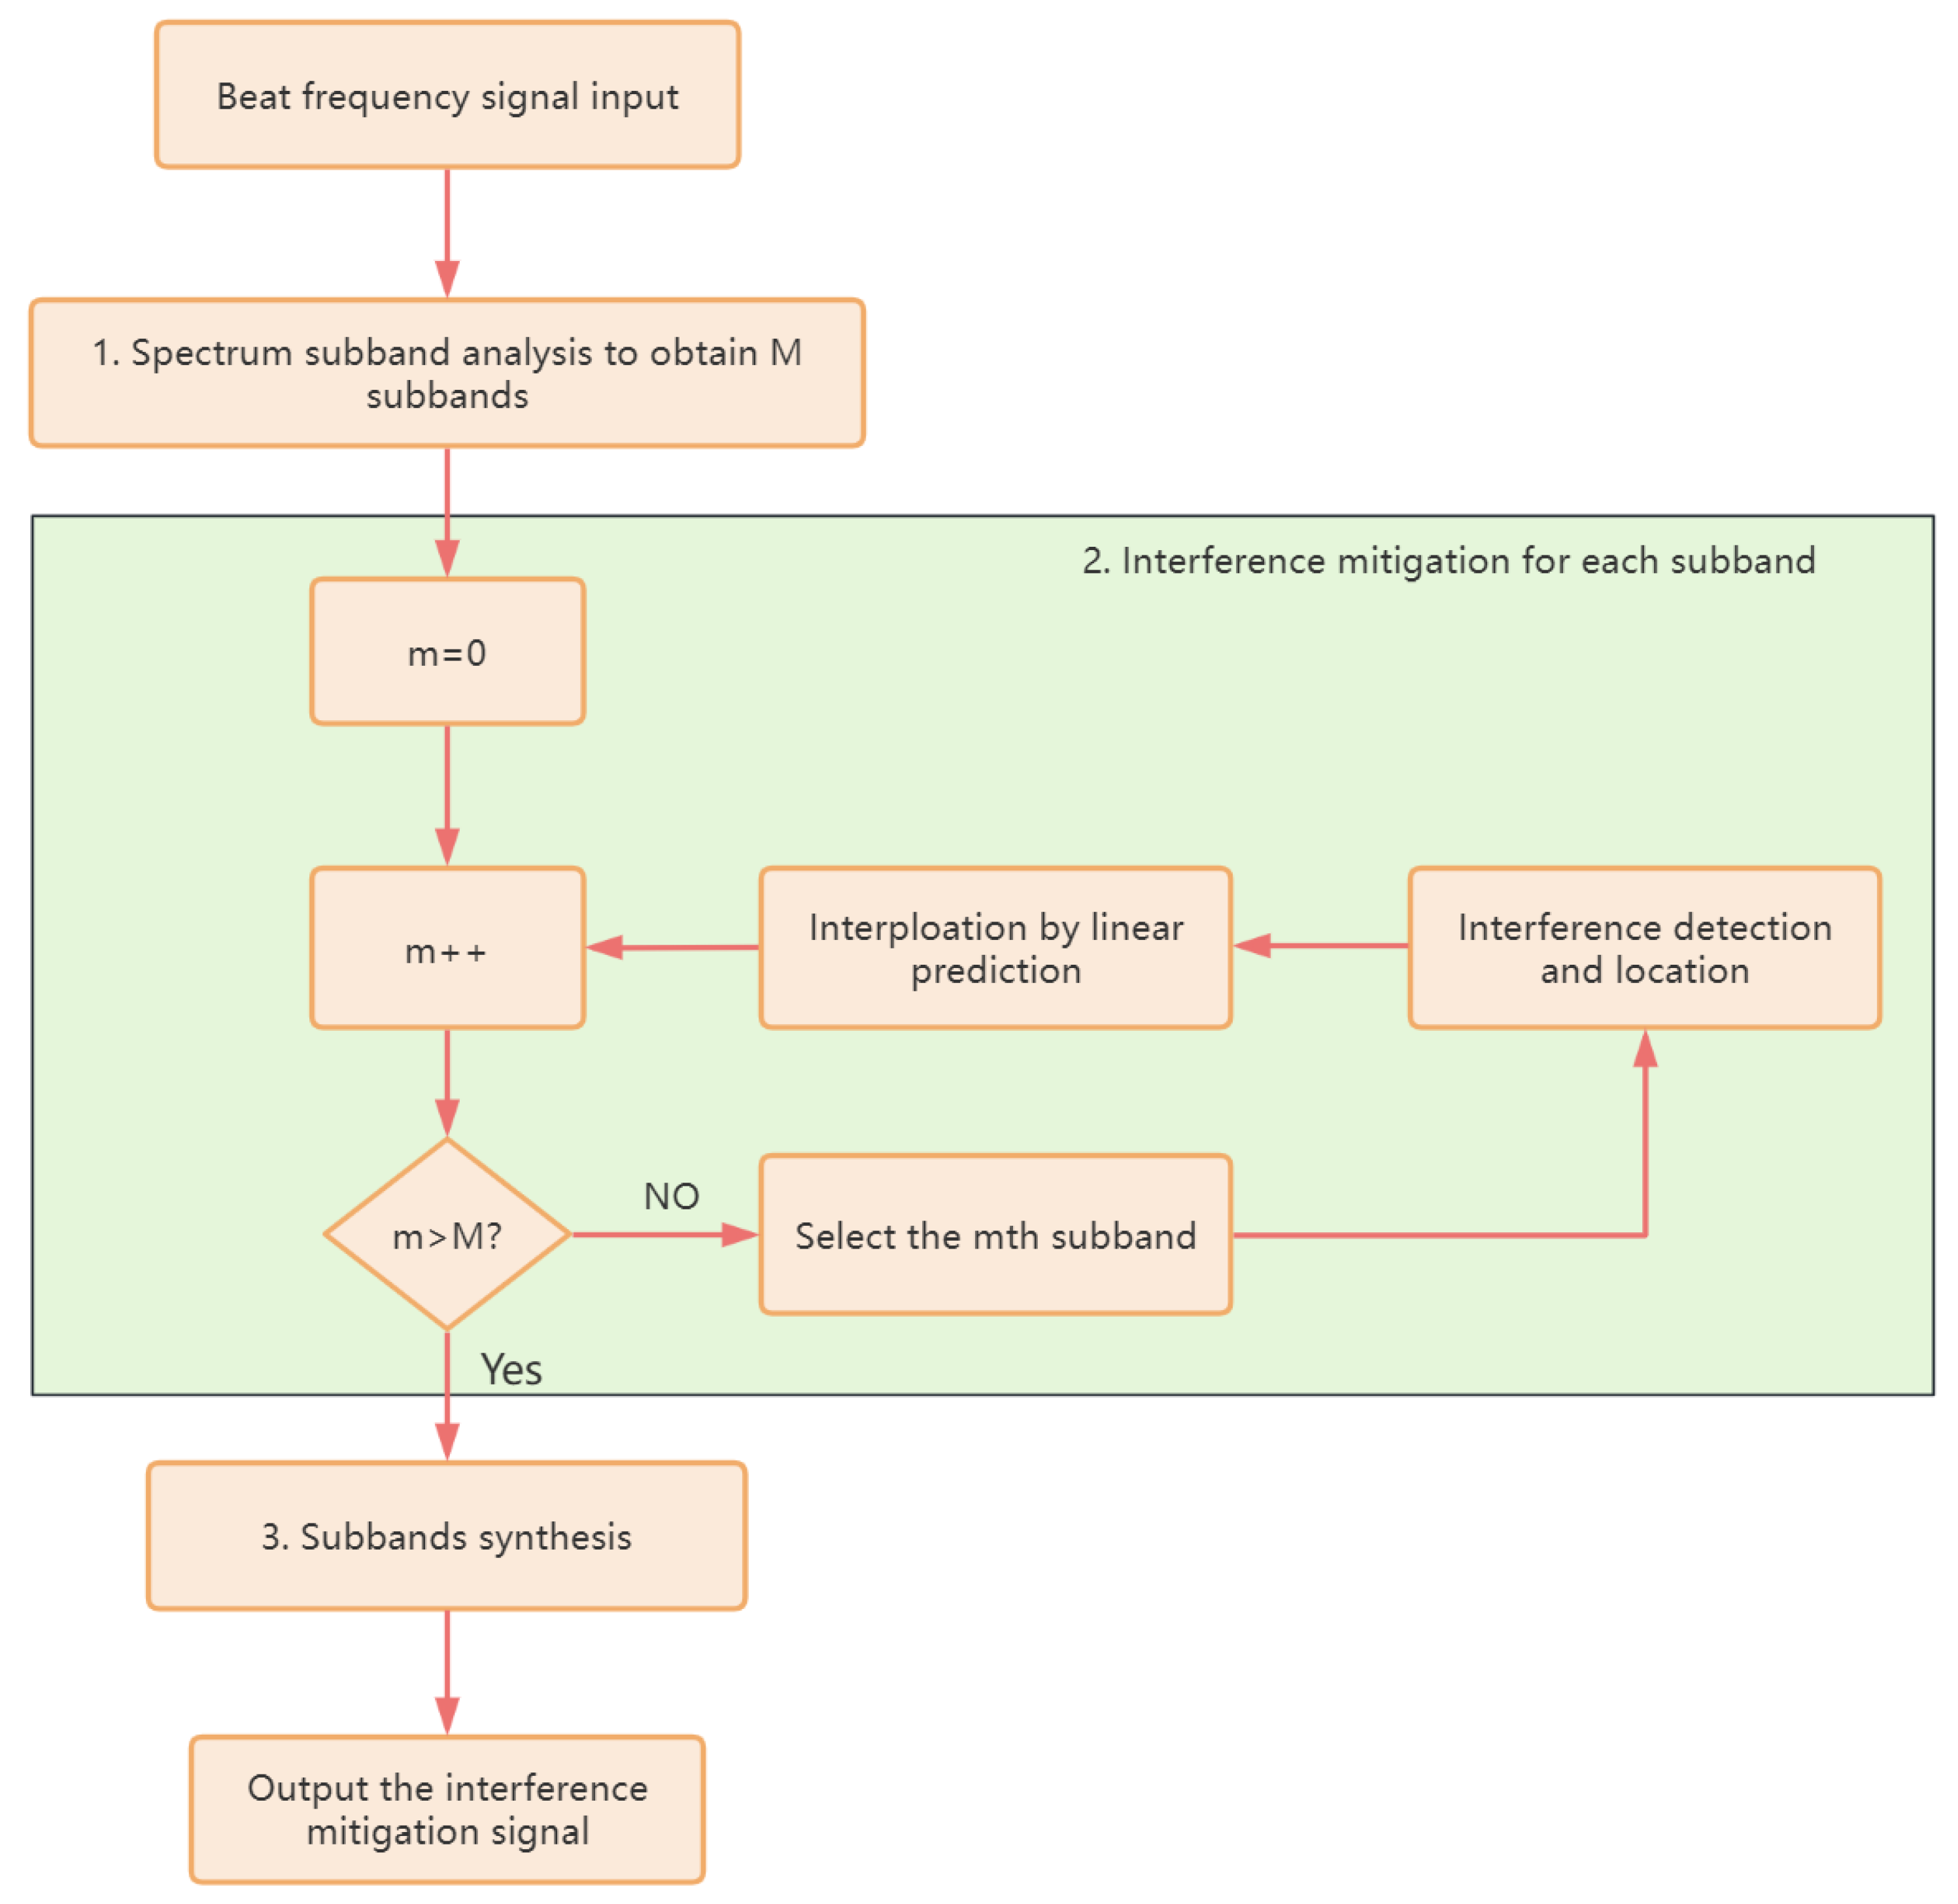
Based on the above motivation, the interference mitigation method shown in Figure 2 using spectrum sub-band analysis and synthesis is proposed. In general, the flow of the method is as follows:
  • After obtaining the beat frequency signal via ADC sampling, the beat frequency signal is transformed to the frequency domain using FFT and the spectrum is divided uniformly to obtain different sub-bands. After that, the inverse FFT (IFFT) is used to transform the sub-bands to the time domain and the time domain signal corresponding to each sub-band is obtained. This is called the spectrum sub-band analysis process. After decomposition, a total of M sub-bands signals are obtained.
  • For the mth decomposed sub-band signal, interference detection and mitigation are performed in the time domain. Meanwhile, the useful signal is recovered in the interference-detected region using the linear prediction technique.
  • After traversing all the sub-band signals, i.e., the total M sub-band signals, the signals from the time domain undergo transformation into the frequency domain by means of FFT. The individual spectrum sub-bands are then meticulously combined to derive the complete spectrum of the beat frequency signal, then IFFT is performed to obtain the interference-mitigated time domain signal; this process is referred to as sub-band synthesis.
By following the above steps, interference mitigation of the beat frequency signal is achieved. The details of the proposed method are described in the remainder of this section.

3.1. Spectrum Sub-Band Analysis of Beat Frequency Signal

First, FFT is applied to the beat frequency signal and the spectrum is obtained as follows:
X b = FFT ( x b ) .
Then, the obtained spectrum is divided into equidistant sub-bands such that each sub-band has a limited support domain covering different distance segments. In order to reduce the discontinuity at both ends after sub-band division, each sub-band is subjected to a windowing process (for instance, with a Hamming window). Then, the regions outside the sub-band are zero-filled to ensure that the sub-band spectrum has the same length as the original spectrum. Each sub-band is be obtained as follows:
X b m = X b ( n ) w ( n ( m 1 ) D ) with w ( n ) = w ham , ( m 1 ) D n m D 0 , otherwise 1 n N , 1 m M . ,
where m is the sub-band index, M is the total number of sub-bands, n is the frequency bin index, N is the length of the spectrum, D is the length of the sub-band, aka the window length, and  w ham  is the Hamming window.
For each subspectrum, the inverse Fourier transform is performed to obtain the time domain signal corresponding to the sub-band, as follows:
x b m = IFFT ( X b m ) .
The workflow diagram of the spectrum sub-band analysis is shown in Figure 3.

3.2. Interference Detection and Mitigation of Sub-Band Signals

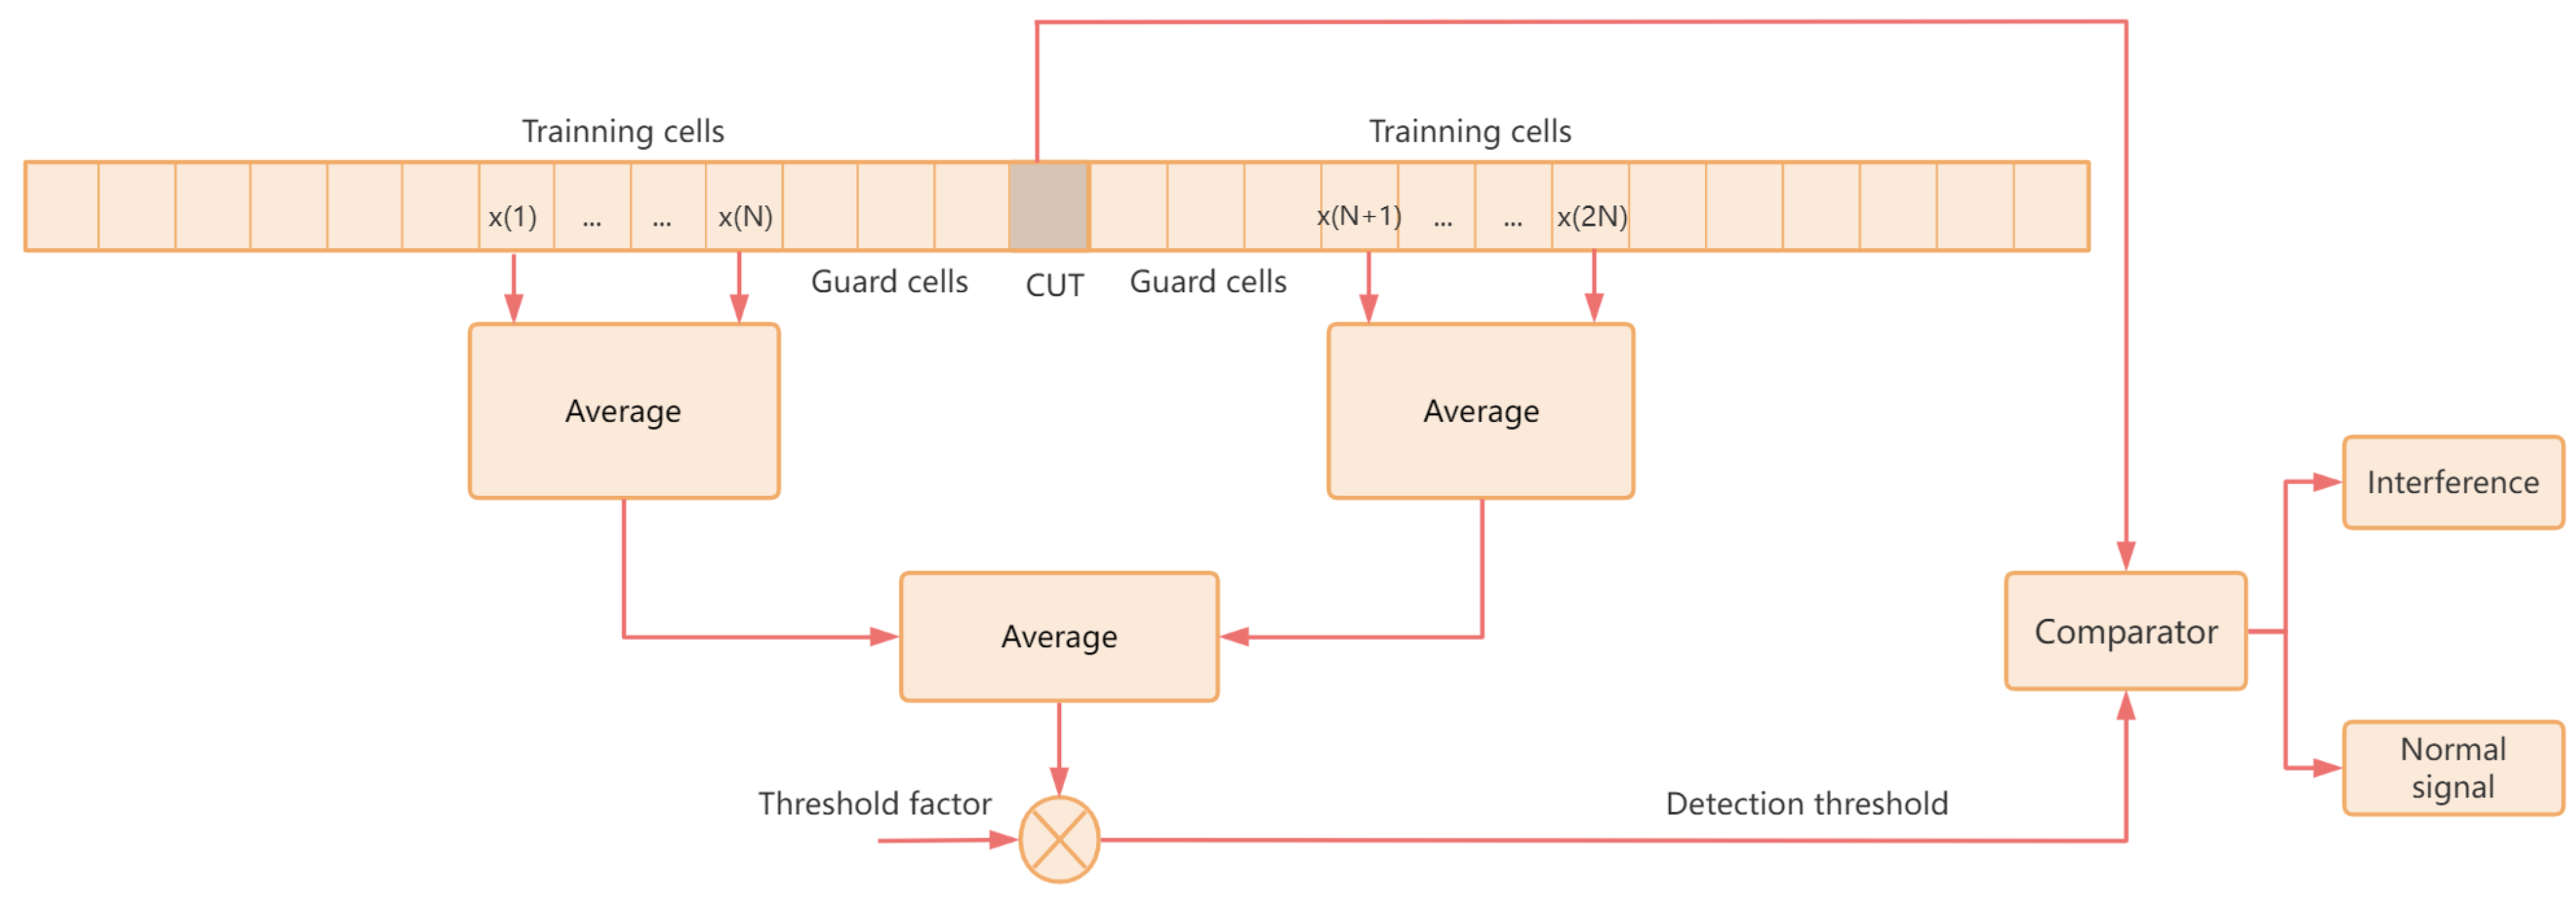
In the interference scenario, the interference signal is commonly endowed with greater power in contrast to the target echo due to its one-way propagation characteristic, while the target echo requires two-way propagation to reach the radar receiver, and consequently has greater free-space attenuation. Regarding this characteristic, the constant false alarm rate (CFAR) detector is used to detect the interference in the sub-band time domain signal [34].
The CFAR detector performs noise level estimation from samples in the neighborhood of the cell under test (CUT), setting an adaptive detection threshold to keep the false alarm rate constant. Its implementation flow is shown in Figure 4. For a CUT in the signal, a region of a certain length on both sides is selected as the guard cells and the region outside the guard area is used as the training cells to estimate the noise level. The average value of the training cells is calculated, and the detection threshold is obtained according to the detection coefficient. Finally, the CUT is compared with the detection threshold, and if the CUT is larger than the detection threshold, the CUT is considered as interference. The same operation is performed repeatedly for each sample point of the signal to complete the interference detection and localization process.
When the detection and localization of interference in the sub-band signal is completed, more useful data can be extracted by recovering the target signal in the interfered region through a linear prediction method. In this work, the autoregressive (AR) technique is employed for prediction of target echoes, as follows:
x b m ( t ) = a 1 x b m ( t 1 ) + a 2 x b m ( t 2 ) + + a p x b m ( t p ) + ε t = j = 1 p a j x b m ( t j ) + ε t ,
where p is the order of the AR model,  a j  is the autoregression coefficient, and  ε t  is the prediction error. Determination of the order p of an AR model is critical for resolving linear prediction problems, as the AR model represents a well-established approach for this purpose. It has been shown that prediction can be achieved with  2 L  samples when the signal is a sum of L sinusoidal signals. In millimeter wave radar applications, the number of targets is the number of sinusoidal signals. Therefore, setting the order of the AR model to  p = 2 L  provides a better prediction of the target echo [35].
It is worth noting that the number of targets on the road in the automotive radar application scenario is uncertain. A very large number of targets can exist within the detection range of the radar, e.g., when there is traffic congestion. However, after sub-band decomposition the process is equivalent to segmenting the radar detection range. Because the number of targets at a particular distance segment is limited, there are not very many targets in each sub-band signal. In other words, spectrum decomposition reduces the number of targets in each sub-band, allowing for better determination of the order of the AR model.

3.3. Signal Reconstruction

After interference mitigation of the sub-band signals, the sub-band signals need to be integrated into a beat frequency signal. This requires first transforming each sub-band signal to the frequency domain in order to obtain the corresponding spectrum. In contrast to decomposition of the signal, the spectrum of the sub-band signal first needs to be inversely windowed, after which the sub-band spectra can be stitched together into the complete spectrum of an interference-free signal, as follows:
X rec = m X b m ( n ) w i ( n ( m 1 ) D ) with w i ( n ) = 1 / w ham , ( m 1 ) D n m D 0 , otherwise 1 n N , 1 m M .
Subsequently, the beat frequency signal in the time domain can be acquired through the use of IFFT, as follows:
x rec = IFFT ( X rec ) .
The diagram outlining the process flow for reconstructing the beat frequency signal is shown in Figure 5.

4. Simulation Results

4.1. Simulation Setup

In order to evaluate the effectiveness of the proposed method, a simulation was conducted in a multi-target scenario. The simulation involved ten targets featuring varying distances and velocities. Specifically, the distances of the targets were evenly distributed in a range between 90 m and 900 m. The settings used for the simulated targets are shown in Table 1.
Because the experiment aimed to simulate the automotive radar scenario, it was conducted using the 77 GHz band. To introduce interference in the experiment, two radars utilizing distinct modulation directions, bandwidth and durations, were included for comparison with the victim radar. Table 2 provides a summary of these settings.
The simulation was built according to the workflow shown in Figure 1. During the signal transmission phase, the configurations from Table 2 were employed to simulate the victim radar and the two radar signals responsible for causing interference, and the simulation results for the victim and the two interfering radars were obtained. During the phase in which target scattering and interference are superimposed, the signal transmitted by the victim radar was returned to the receiver after two-way propagation in free space as well as target scattering, while the interference signal reached the receiver through one-way propagation in free space.
The simulation was conducted using the workflow depicted in Figure 1. Initially, the signal transmission phase was implemented, during which the configurations specified in Table 2 were utilized to simulate the signals of the victim radar and the two interfering radars. Subsequently, the simulation outputs for these signals were generated. In the ensuing stage, pertaining to target scattering and interference superposition, the victim radar’s transmitted signal underwent two-way propagation in free space, encountering target scattering before returning to the receiver. Conversely, the interference signal underwent one-way propagation in free space to reach the receiver. The target echo signal was the sum of received signals of ten targets according to (2) and the superposition of the target scattering and interference signals according to (5). During the signal receiving phase, the radar receiver accepted a composite signal composed of the target echo and interference. This composite signal was then mixed with a reference signal generated by the wave generator to produce a beat frequency signal. Next, the beat frequency signal was passed through a low-pass filter before being sampled to generate the final digital signal.

4.2. Performance Evaluation Methodology

Targets at different distances are reflected as sinusoidal signals of corresponding frequencies in the beat frequency signals; thus, the target distances can be measured by extracting the spectral peaks of the beat frequency signals. For the target’s velocity, a chirp sequence signal is required, and the measurement of the target’s velocity is performed by analyzing the phase difference between the chirps. These processing procedures can be achieved by arranging the received chirps in a matrix and calculating the FFT along two dimensions, i.e., fast time and slow time. The obtained two-dimensional spectrum is the range-Doppler (RD) response of the radar, which shows the target distribution in the case of a joint distance and velocity distribution.
In evaluating the interference mitigation performance, assessments in both the time domain and frequency domain were used. First, the signal-to-interference-plus-noise ratio (SINR) was employed in the time domain dimension to indicate the potential of the test method to mitigate interference [30]. The SINR expression is
SINR = 10 lg x e 2 x e x rec 2 ,
where  lg ( )  represents the logarithm with a base of 10,  x e  represents the target ground truth, the recovered target signal is denoted by  x rec , and SINR measures the degree of interference mitigation in the time domain.
The metric in the frequency domain is the multi-target integrated sidelobe ratio (MISLR) [30,36,37], which is defined as the ratio of the energy in a certain domain outside the target peak range to the energy inside the target peak range. The definition of MISLR involves
MISLR = 10 lg m = a g X rec 2 ( m ) + m = h b X rec 2 ( m ) m = g h X rec 2 ( m ) ,
where the spectrum of  x rec  is symbolized as  X rec [ g , h ]  is the target peak range, and  [ a , b ]  is the target’s neighborhood. Because MISLR describes the ratio between the sidelobe energy and the mainlobe energy, a smaller MISLR value indicates a smaller sidelobe energy, which makes for better the target detection performance. In practice, it is recommended that the neighborhood be chosen as at least five times the width of the mainlobe to ensure a sufficient number of sample points to approximate the energy in the sidelobes, that is, the interval  [ a , b ]  should have a length at least five times greater than the length of the interval  [ g , h ] .
In the performance evaluation, in addition to focusing on the interference mitigation effect, it is important to focus on the computational burden and calculate the runtimes of different test methods. Many scenarios in mmWave radar applications require real-time information processing capability, making run time an important indicator for the real-world operation of the algorithm.

4.3. Simulation Results

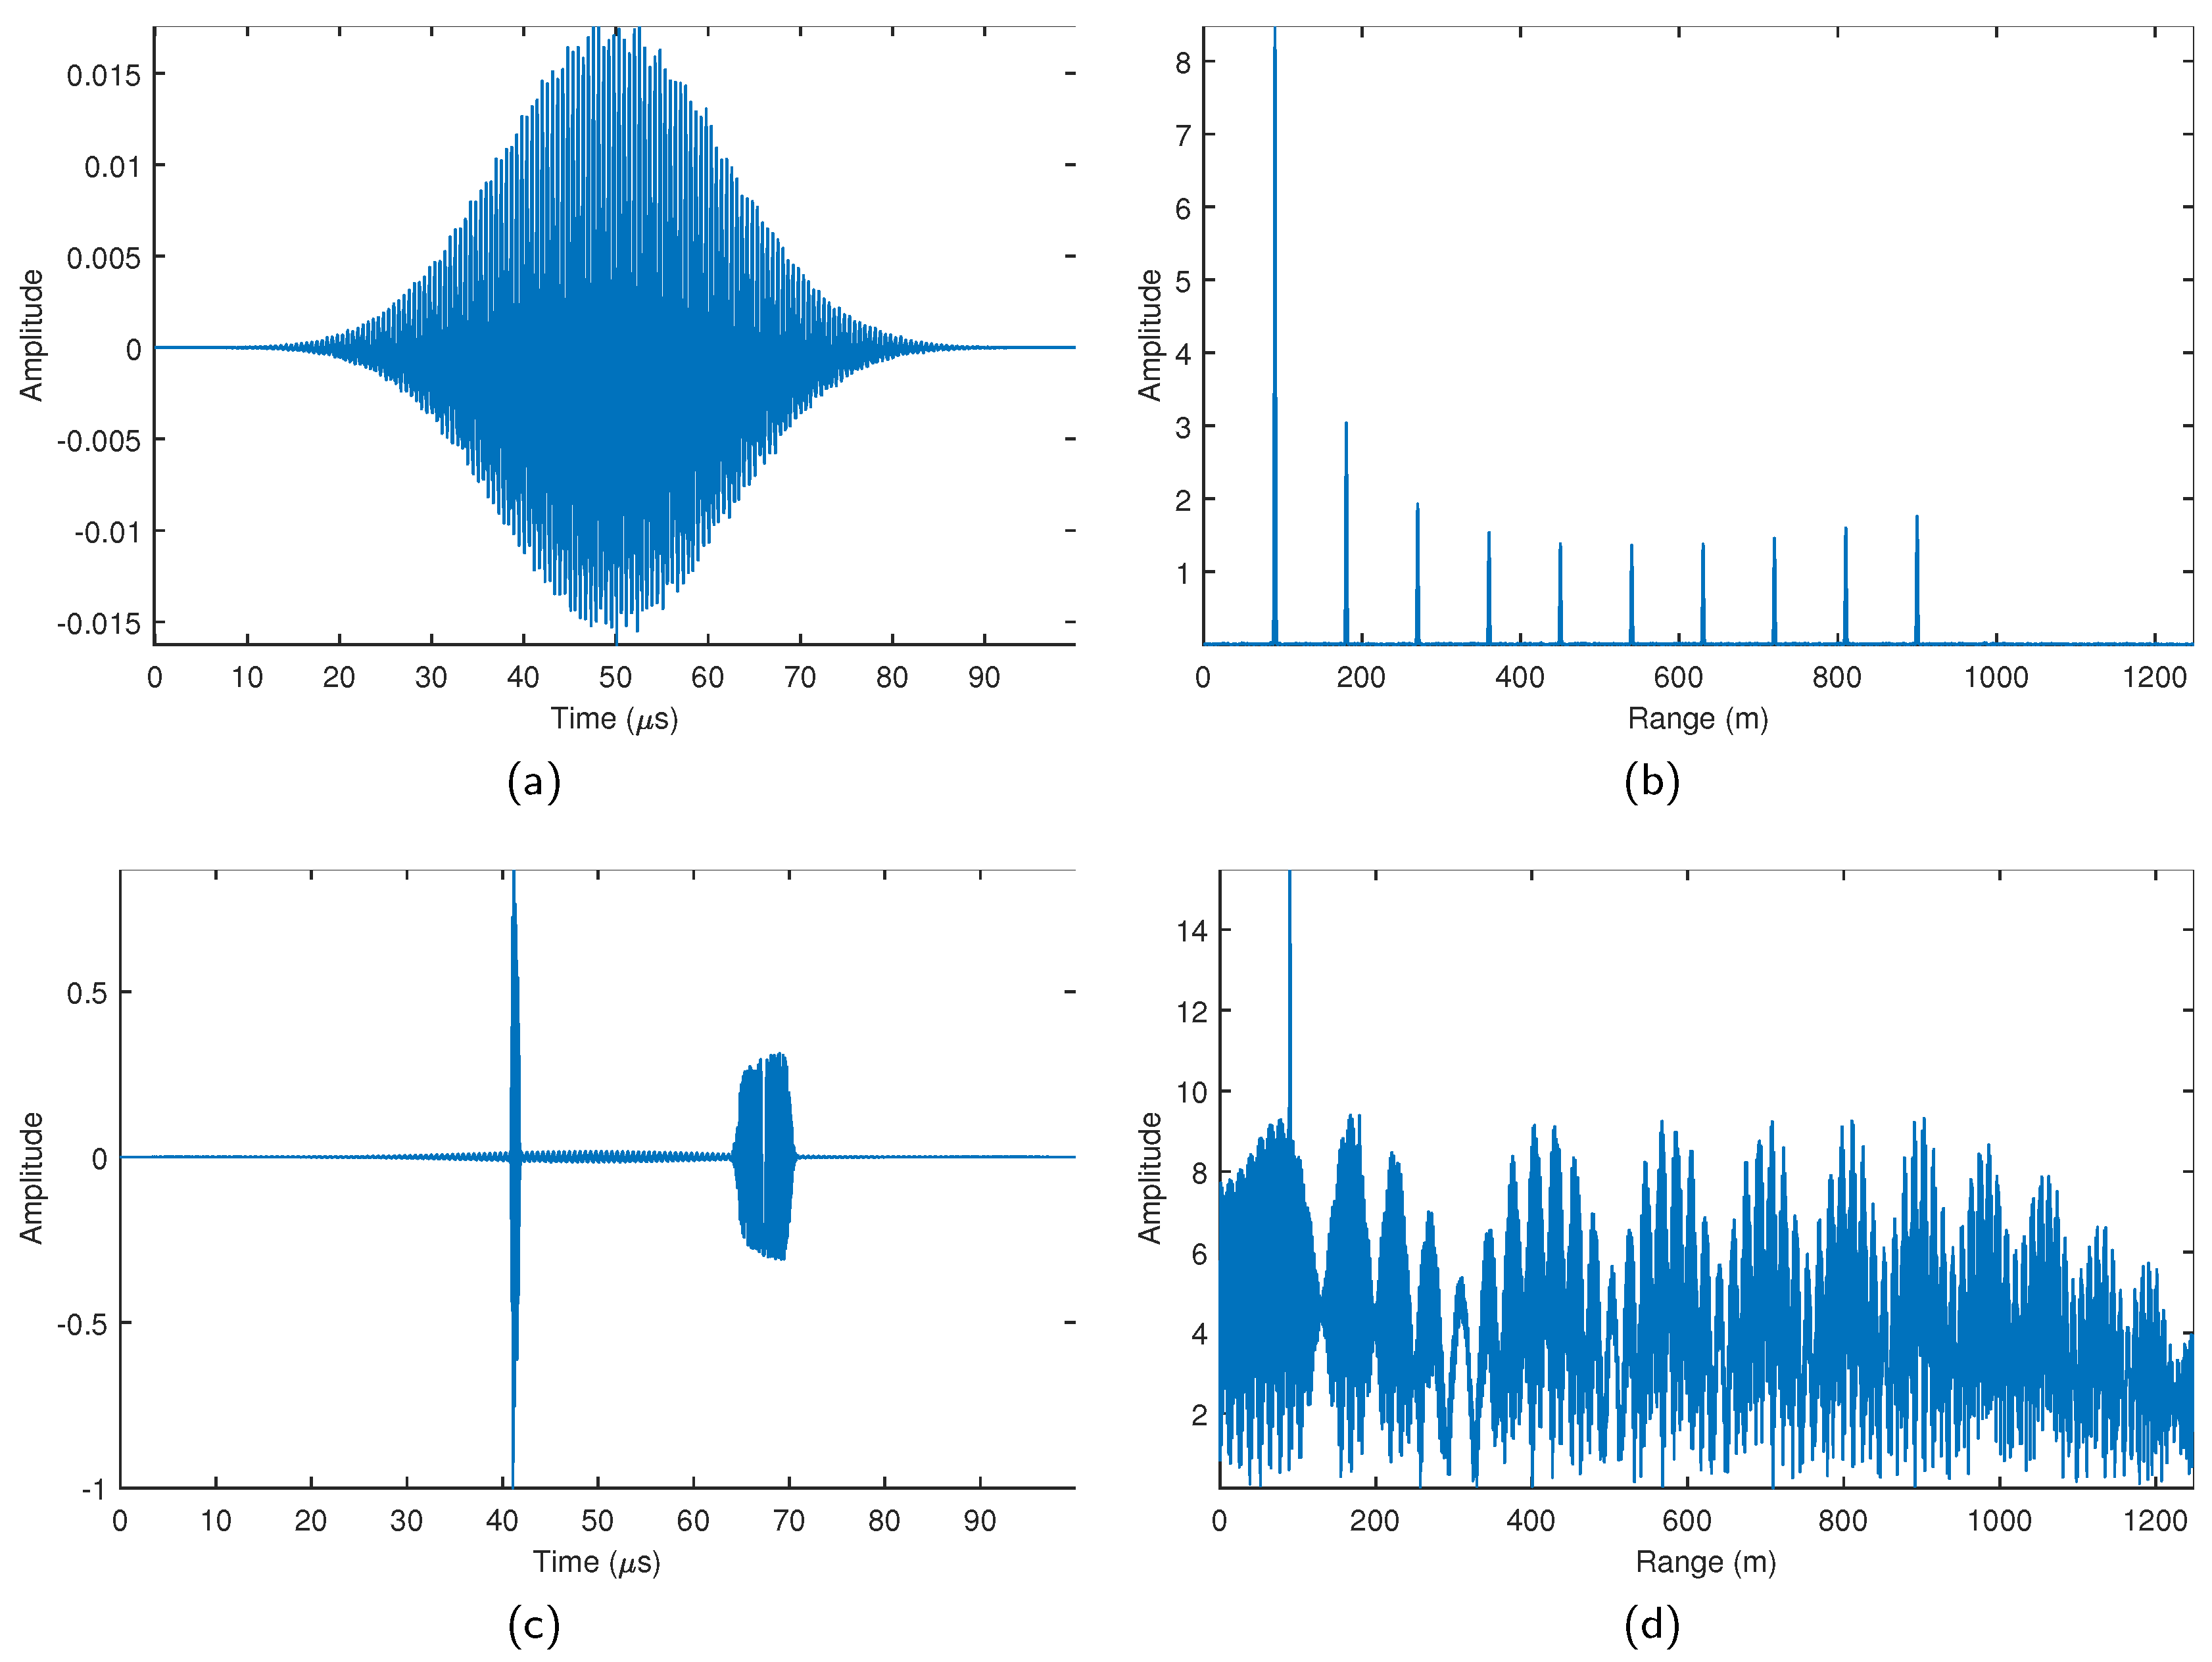
The radar simulation signal obtained after implementation of the simulation process illustrated in Figure 1 is presented in Figure 6. The comparative analysis of the time and frequency domain signals before and after adding interference to the target echoes shown in Figure 6a reveals that in the absence of interference, the amalgamation of ten distinct sinusoidal signals constitutes the radar echo signal in the time domain. The ten spectral peaks in the frequency domain correspond to the ten target locations as shown in Figure 6b. When there is interference in the returned echo, it acts as a high-power signal with a limited support area in the time domain, as illustrated by the depiction provided in Figure 6c, and as broadband noise in the frequency domain, which raises the overall noise level in the frequency domain. In this case, only the first target peak can be observed; all other targets are swamped by the interference and cannot be observed directly in the spectrum, as shown in Figure 6d.
Figure 7 depicts the time frequency map for the simulated signal, from which it can be observed that ten targets are located at equal intervals in front of the detection radar, corresponding to each single frequency signal component in the figure. Interference appears at two time points, and occupies the entire frequency axis.
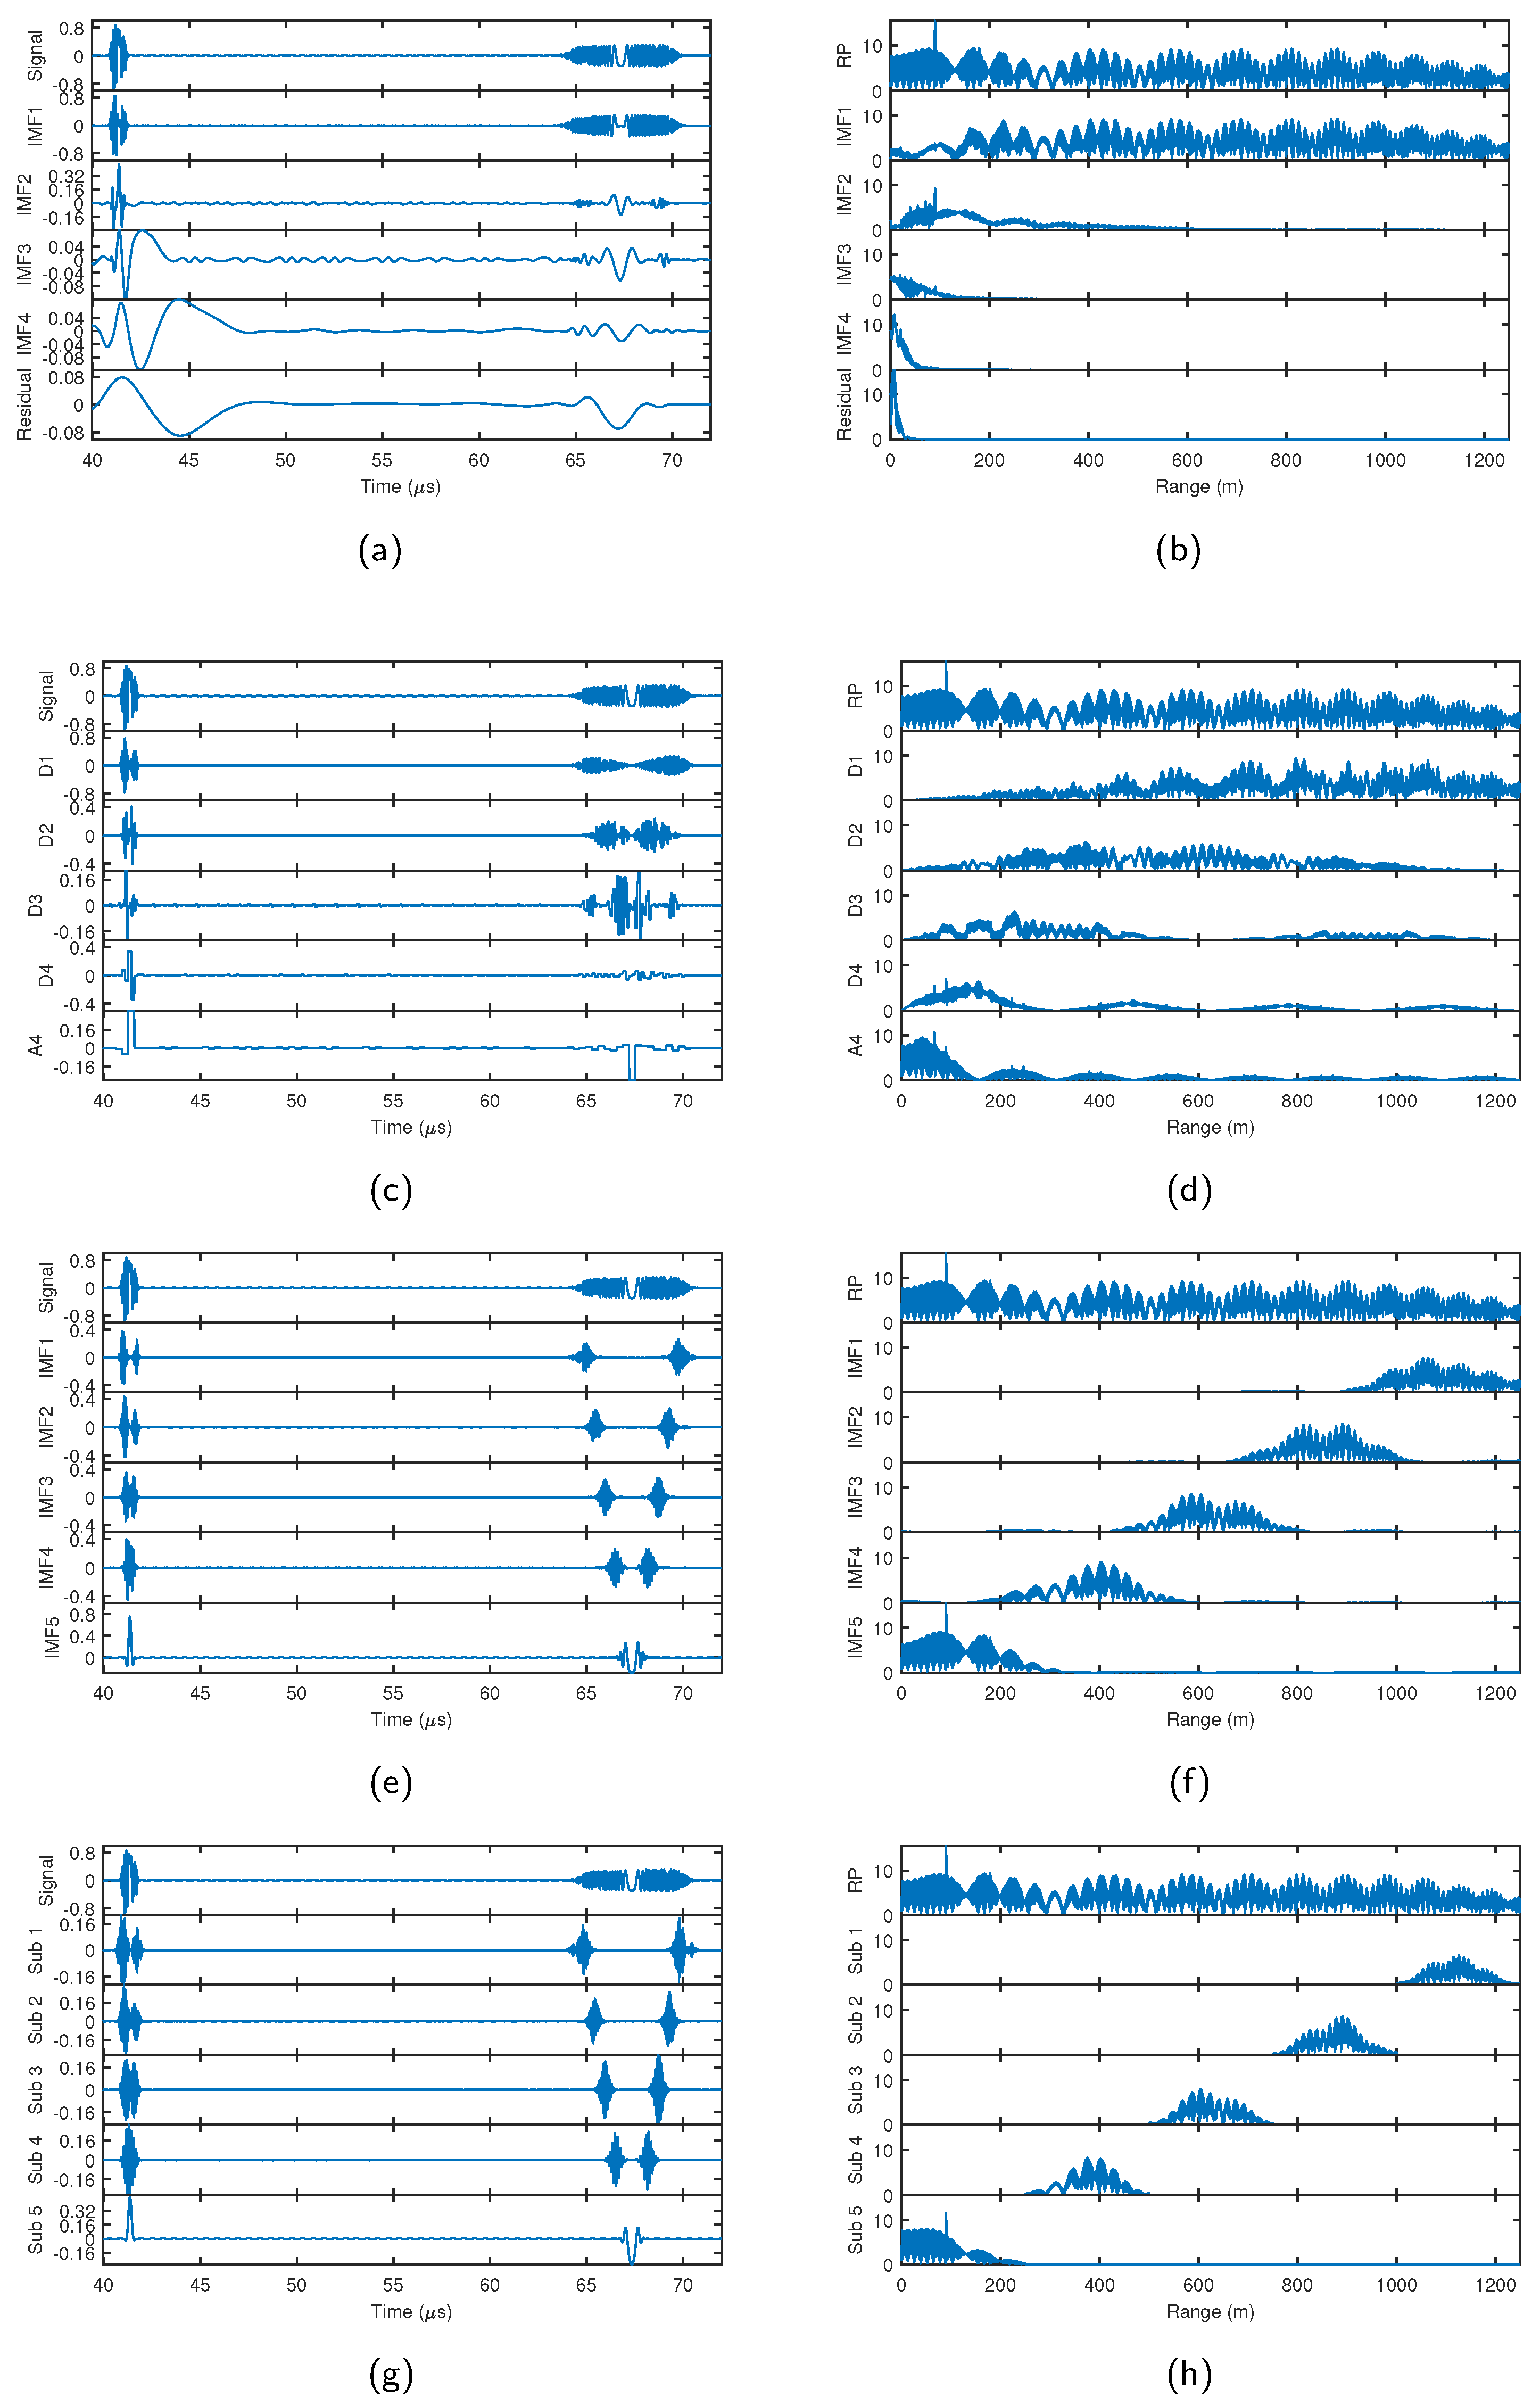
We conducted simulations of the EMD-based method described in [28,29], the wavelet-based method outlined in [27], and the VMD-based method presented in [30] in order to compare their performance with the proposed method based on spectrum sub-band analysis. During the decomposition of the beat frequency signal, each method decomposes the beat frequency signal into five components. For EMD and wavelet decomposition there are four IMFs and one residual, for VMD there are five IMFs, and for spectrum sub-band analysis there are five sub-bands. Using this decomposition setup, all of the tested methods divide a radar detection range of 1200 m into five distance segments. In Figure 6, it can be seen that the interference is mainly concentrated in the middle part of the time domain; therefore, for convenience of observation, the time range is scaled when drawing the decomposition time domain figure, and only the middle part of the time domain is shown. Figure 8 presents the decomposition outputs generated by applying the EMD, wavelet, VMD, and spectrum sub-band decomposition techniques to the simulated signal for analysis conducted across both the time domain and range profile dimensions.
Analysis of the decomposition outcomes produced by various decomposition techniques was carried out in the time domain and range profile dimensions, as elucidated below.
1. EMD results: As demonstrated by the decomposition outcomes of the range profile, the majority of the frequency components are contained within IMF1, as presented in Figure 8b. IMF1 exhibits a significant degree of overlap with the initial spectrum. While the spectral components of each subsequent IMF are approximately equivalent to half of the previous IMF, there is considerable spectral overlap between adjacent IMFs. This decomposition leads to the time domain decomposition of IMF1 shown in Figure 8a, which is almost identical to the original signal. At the same time, the residual component contains almost no signal component. In this case, the decomposition of the EMD does not play a very significant role in interference detection and mitigation.
2. Wavelet decomposition results: The wavelet decomposition outcomes exhibit similarities to EMD in decomposing most of the signal power into the first two detail components, as displayed in Figure 8c,d. However, this decomposition renders it challenging to achieve superior interference mitigation performance.
3. VMD results: In light of VMD’s quasi-orthogonal band-limit decomposition characteristic, the received signal undergoes a decomposition process wherein each IMF is almost uniformly distributed across the range profile. Consequently, targets at distinct distances are allotted different IMFs during the decomposition process. In summary, VMD is able to uniformly partition the radar’s detection range, as depicted in Figure 8f.
4. Spectrum sub-band decomposition results: Spectrum sub-band decomposition divides the signal spectrum uniformly to obtain sub-band signals in different frequency bands that are orthogonal to each other, as shown in Figure 8h. This decomposition offers two advantages. First, it uniformly divides the interference power into distinct sub-band signals; when aligned with the LFM attributes of the interference, the outcome is the decomposition of the time domain interference into signals of varying temporal durations, as shown in Figure 8g. Second, targets situated at dissimilar ranges become segregated into different sub-band signals; thanks to the orthogonality exhibited by the spectral sub-band decomposition, each target resides exclusively in one sub-band signal. The VMD and spectral sub-band decomposition schemes both rely on uniform decomposition. This mode of decomposition segregates targets at various distances into different sub-bands, thereby lowering the number of targets found in each sub-band signal relative to the primary signal, which aids in consecutive target echo recovery via linear prediction.
Figure 9 depicts the energy percentage of the decomposed modes using each of the four strategies. VMD and spectrum sub-band decomposition exhibit the most proportionate outcomes, with similar energy percentages allocated to each mode. Mode 5 commands a higher energy percentage than the other modes, as it embodies the initial high-powered strong target. The consistency of this energy division makes uniform decomposition more suitable for mmWave radar in the ADAS case, as targets are usually uniformly distributed over the forward distance segment.
The effectiveness of interference reduction across the time domain is depicted in Figure 10. Notably, the wavelet and EMD methods exhibit shortcomings in terms of their ability to detect and mitigate interference due to non-uniform energy distribution across the decomposition modes, which results in the concentration of interference in specific modes. Therefore, as compared to the original signal, neither of these methods provides additional benefit after performing signal decomposition. In contrast to the EMD and wavelet methods, both the VMD method and the method proposed in this paper decompose the interference into orthogonal sub-bands in the frequency domain and into different time segments in the time domain, causing the interference energy to be dispersed into different decomposed modes or sub-bands. This results in reduced interference power and a lower number of targets in each sub-band relative to the original signal, providing better results in terms of locating and suppressing the interference while additionally obtaining better target reconstruction. However, the results obtained using the proposed method are closer to the original signal in terms of the signal reconstruction effect than when using the VMD method.
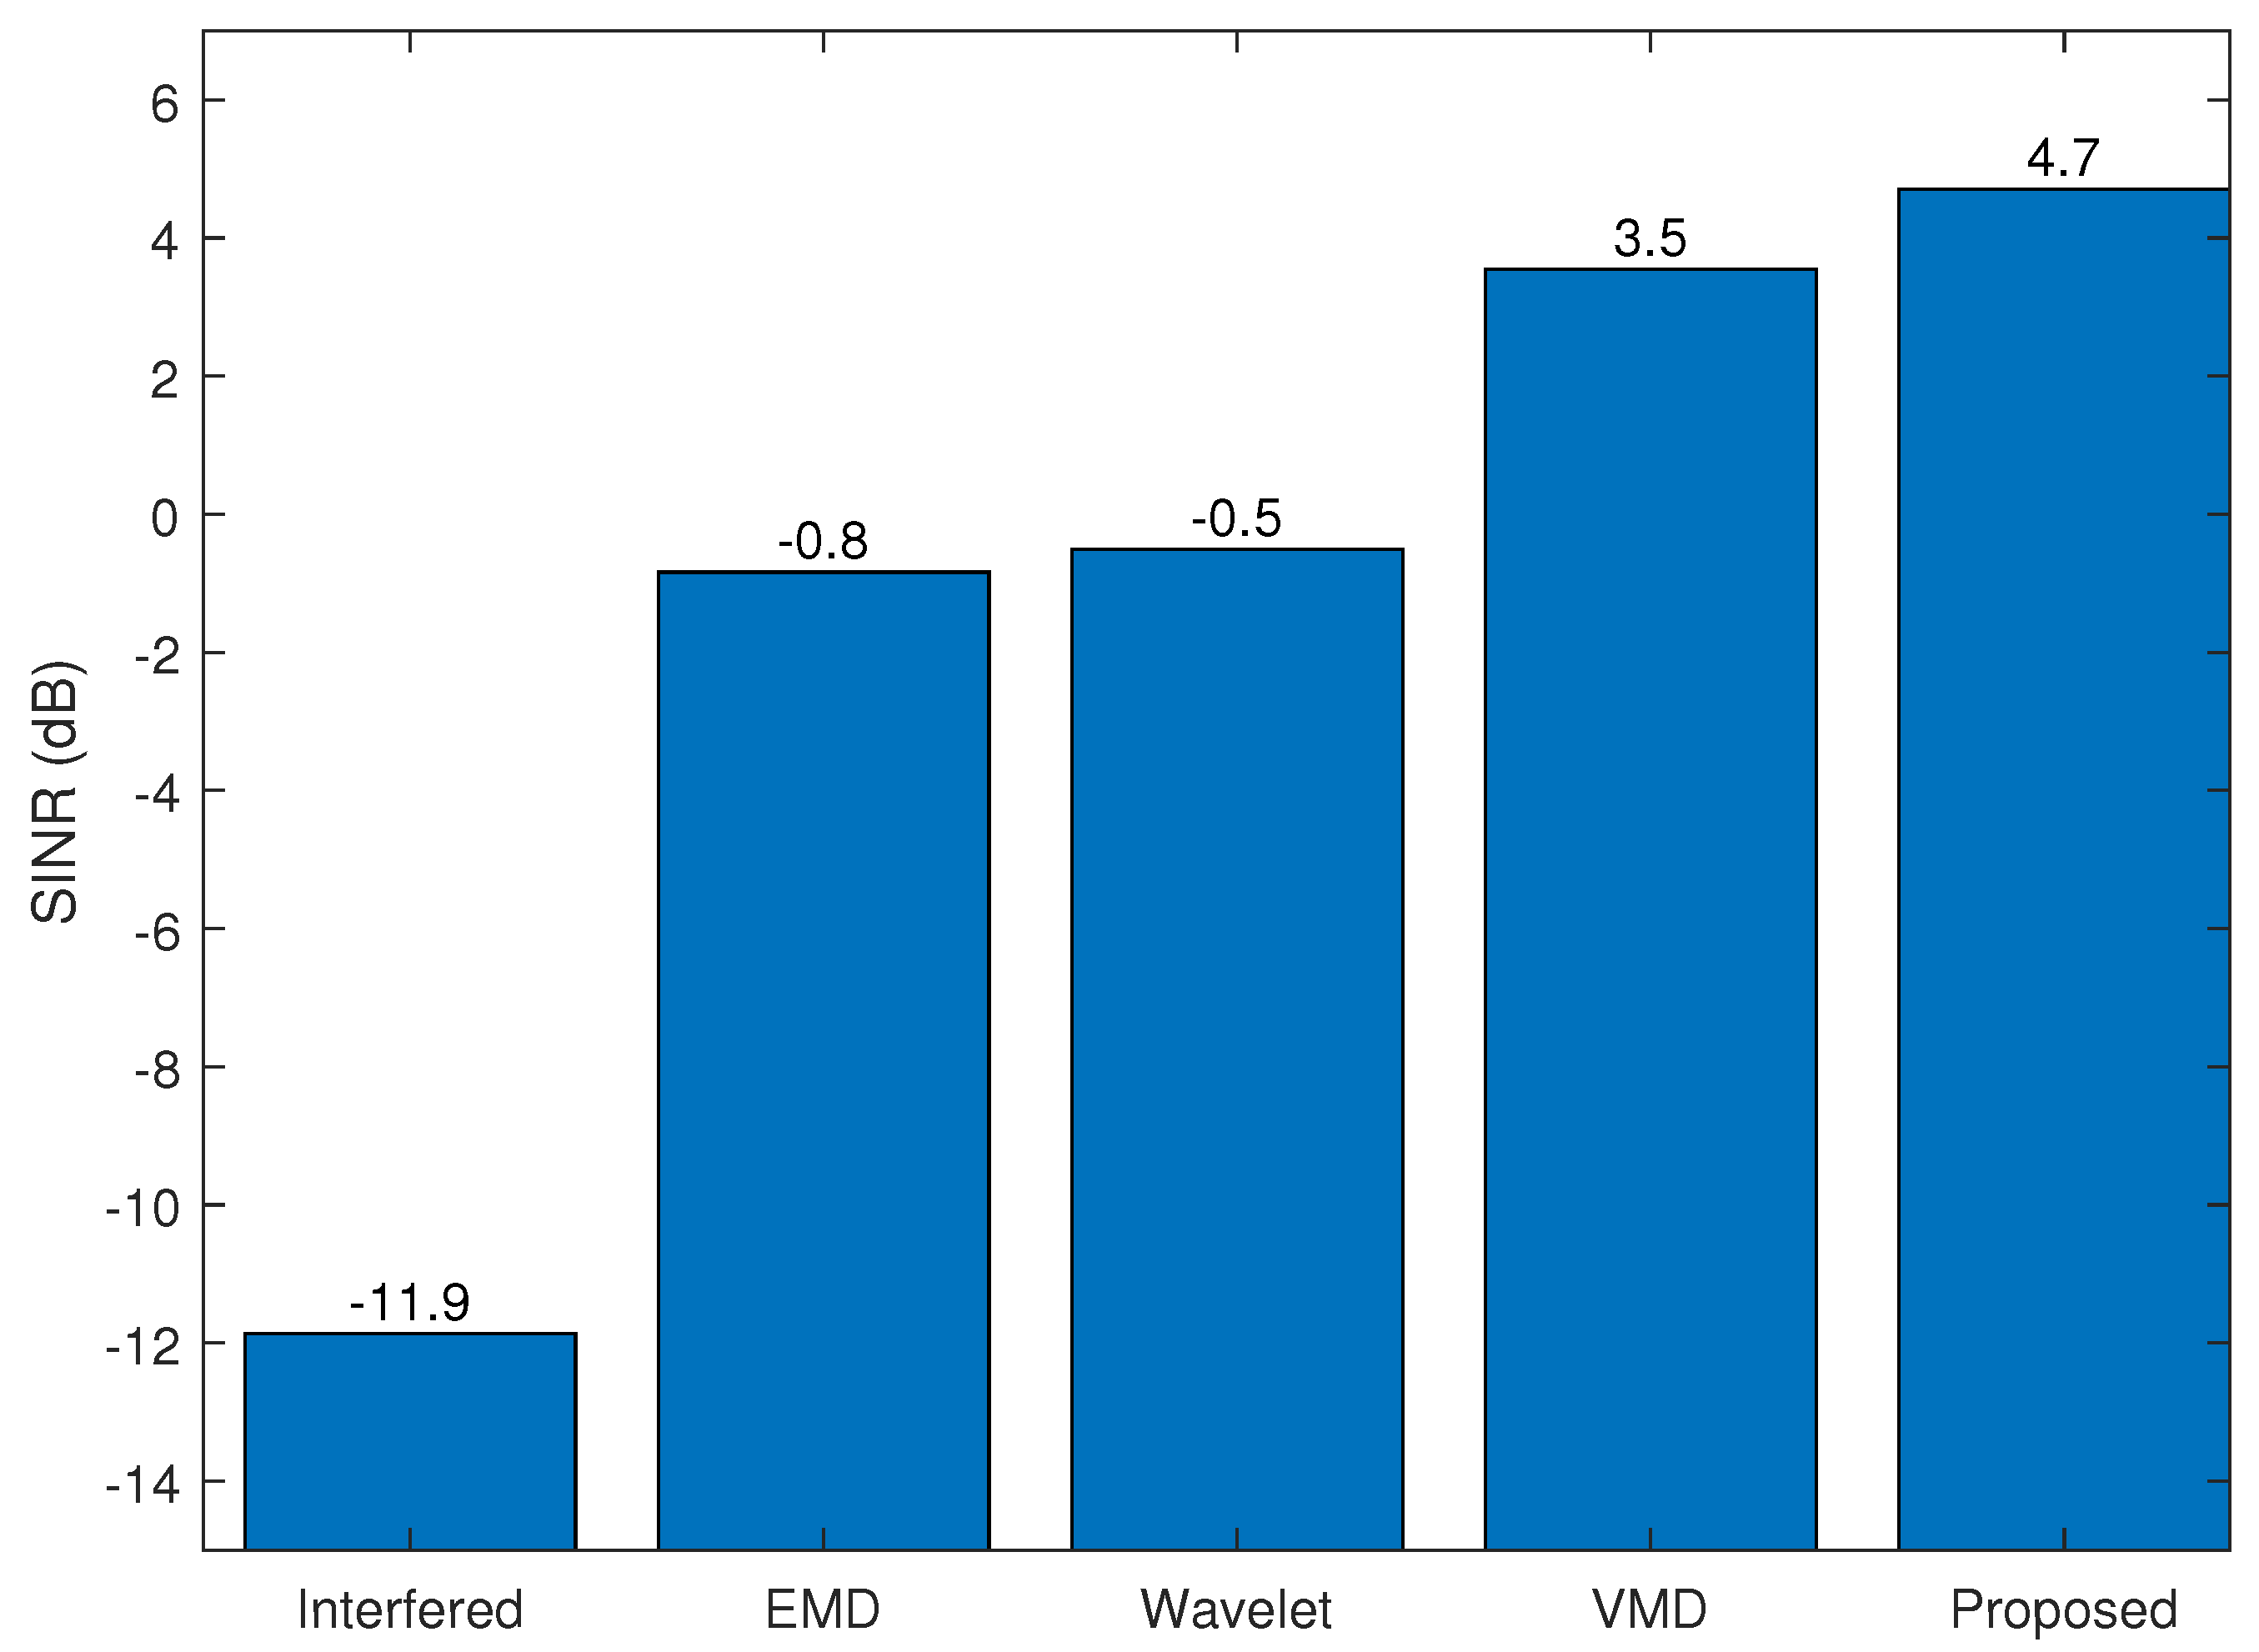
Figure 11 displays the results of the time domain evaluation, which assessed the interference mitigation capability of various methods using the signal-to-noise ratio (SINR). Specifically, the SINR was calculated for each method after interference mitigation, with the original signal’s SINR level serving as a reference. The results indicate that all four methods succeeded in mitigating interference, with the proposed method displaying the highest SINR. The proposed method outperformed the EMD and wavelet methods by approximately 5 dB and the VMD method by approximately 1 dB in terms of SINR enhancement.
The effectiveness of interference reduction across the range profile for the four examined techniques is depicted in Figure 12. Prior to interference mitigation, only the first strong target is detectable, with the other nine targets overwhelmed by the interference. Post-interference mitigation, all ten targets are evident when using each of the four methods. However, distinctions in noise levels are present, with the proposed method producing the least amount of noise across the entire range profile. Following spectrum decomposition and interference mitigation, the proposed method yields a range profile which closely approximates the interference-free signal.
The range profile’s quantitative outcomes are displayed in Figure 13, presenting the MISLR levels for the ten targets in comparison to the original MISLR levels utilized as a reference. Analysis indicates that VMD and the proposed method surpass the EMD and wavelet methods with respect to the enhancement of MISLR levels for most of the targets. Further, in terms of MISLR metrics, the proposed method demonstrates superior performance compared to the VMD method.
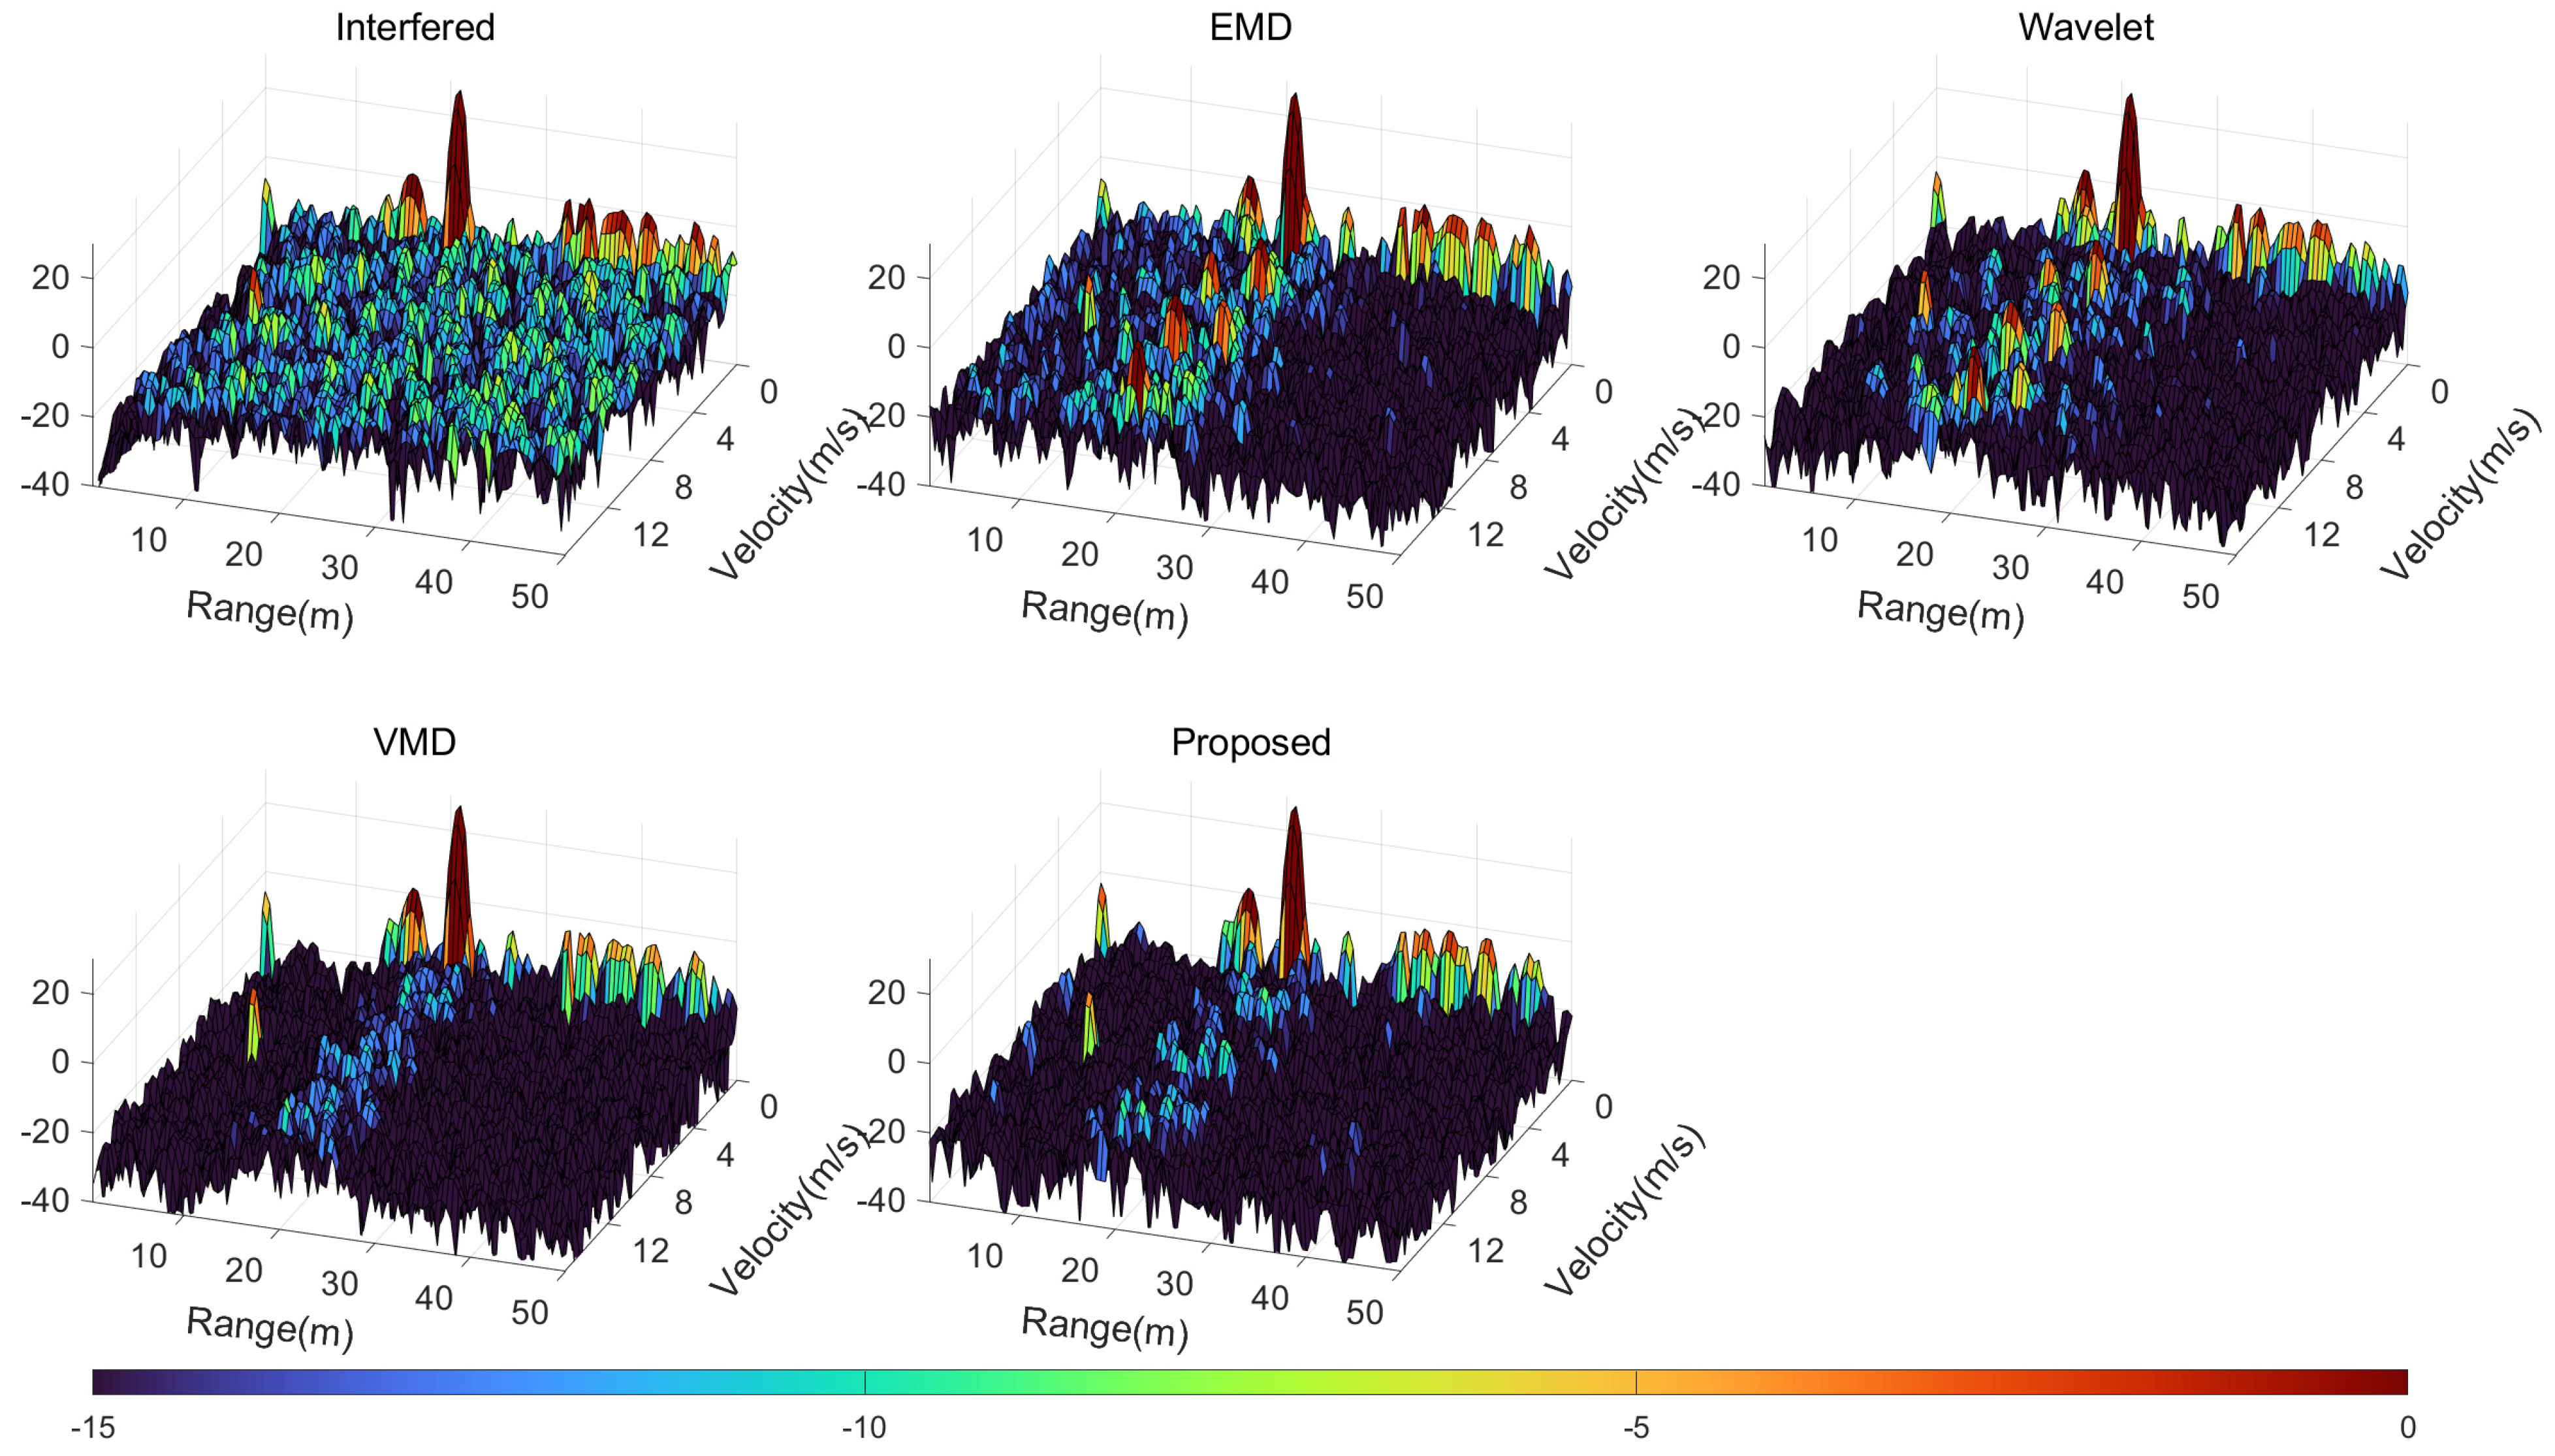
Figure 14 presents the interference mitigation evaluation of the RD response. For the simulation experiment, a chirp sequence was used to determine the velocity, consisting of 256 chirps in one frame. Each chirp underwent range FFT processing, and the resulting chirps were utilized to create a fresh frame. Doppler FFT processing was then performed on this new frame to attain the RD response. All four techniques were able to accurately extract the RD responses of the ten targets by comparing the interfered and interference-free RD responses. The VMD method and the method proposed in this paper show superior interference mitigation capabilities relative to the EMD and wavelet methods, and both achieve a reduction in noise level, which is beneficial for target detection.
To evaluate the computational burden of the explored algorithms, the runtime of each method was assessed using simulated data. The algorithmic flow of the methods for mitigating interference was divided into two primary stages: the partitioning of the signal, and the detection and elimination of interference. The run times for both stages were calculated separately, and the time elapsed during the implementation of each method was recorded for further analysis. The testing apparatus utilized in this study consisted of an i5-12500H CPU and 16 GB of RAM, and we used Matlab version R2022b. Table 3 details the runtime results for the simulated data.
The run time of the proposed method is longer than that of the EMD method and the wavelet decomposition method, while it is considerably shorter than that of VMD method. VMD is a process intended for solving optimization problems, and is more time-consuming than the other three signal decomposition methods. In the phase of detecting and mitigating interference, with the exception of the soft thresholding technique used in the wavelet method, the tested methods use CFAR detection for interference detection, which is a computationally intensive and time-consuming technique. Furthermore, both the proposed method and the VMD method include an AR model-based signal recovery process, which further increases the computational burden. While the wavelet method features the fastest algorithm structure, its processing effectiveness is inferior to that of the proposed method and the VMD method. In all, due to the trade-off between algorithmic performance and speed, the proposed method represents a superior interference mitigation solution, delivering better interference mitigation outcomes than the EMD and wavelet methods while imposing a lower computational burden than the VMD method.
In addition, in practical applications there may be benefit from utilizing parallel processing thanks to the proposed method’s approach of traversing each sub-band signal independently in the phase of detecting and mitigating interference, potentially achieving lower run times on multicore processors.

5. Real Experiment Results

Following successful validation via simulation, an experimental scenario was devised for further evaluation. This experiment employed three 77 GHz mmWave radars, with one of the radars serving as the victim and the remaining two as the interfering sources. A depiction of the experimental arrangement is provided in Figure 15, with the two interfering radars placed on either side of the victim radar at distances of 20 m and 30 m. Notably, a reflector was positioned 20 meters from the victim radar in the frontal direction to imitate a standard strong target signal.
The radar configurations utilized in the practical experiment are presented in Table 4. All three radar devices operated at 77 GHz; however, signal parameters such as signal bandwidth and sweep direction were different. In addition, the radars utilized distinct pulse repetition intervals (PRT) to enhance the likelihood of mutual interference.
The victim radar’s captured data were utilized to evaluate the level of interference reduction. In this experiment, interference mitigation was again performed on the measured data using EMD, wavelet, VMD, and the proposed method. In this case, the number of signal decomposition components was set to five. The decomposed IMFs or sub-band signals were then processed for interference detection based on CA-CFAR and target reconstruction based on the AR model.
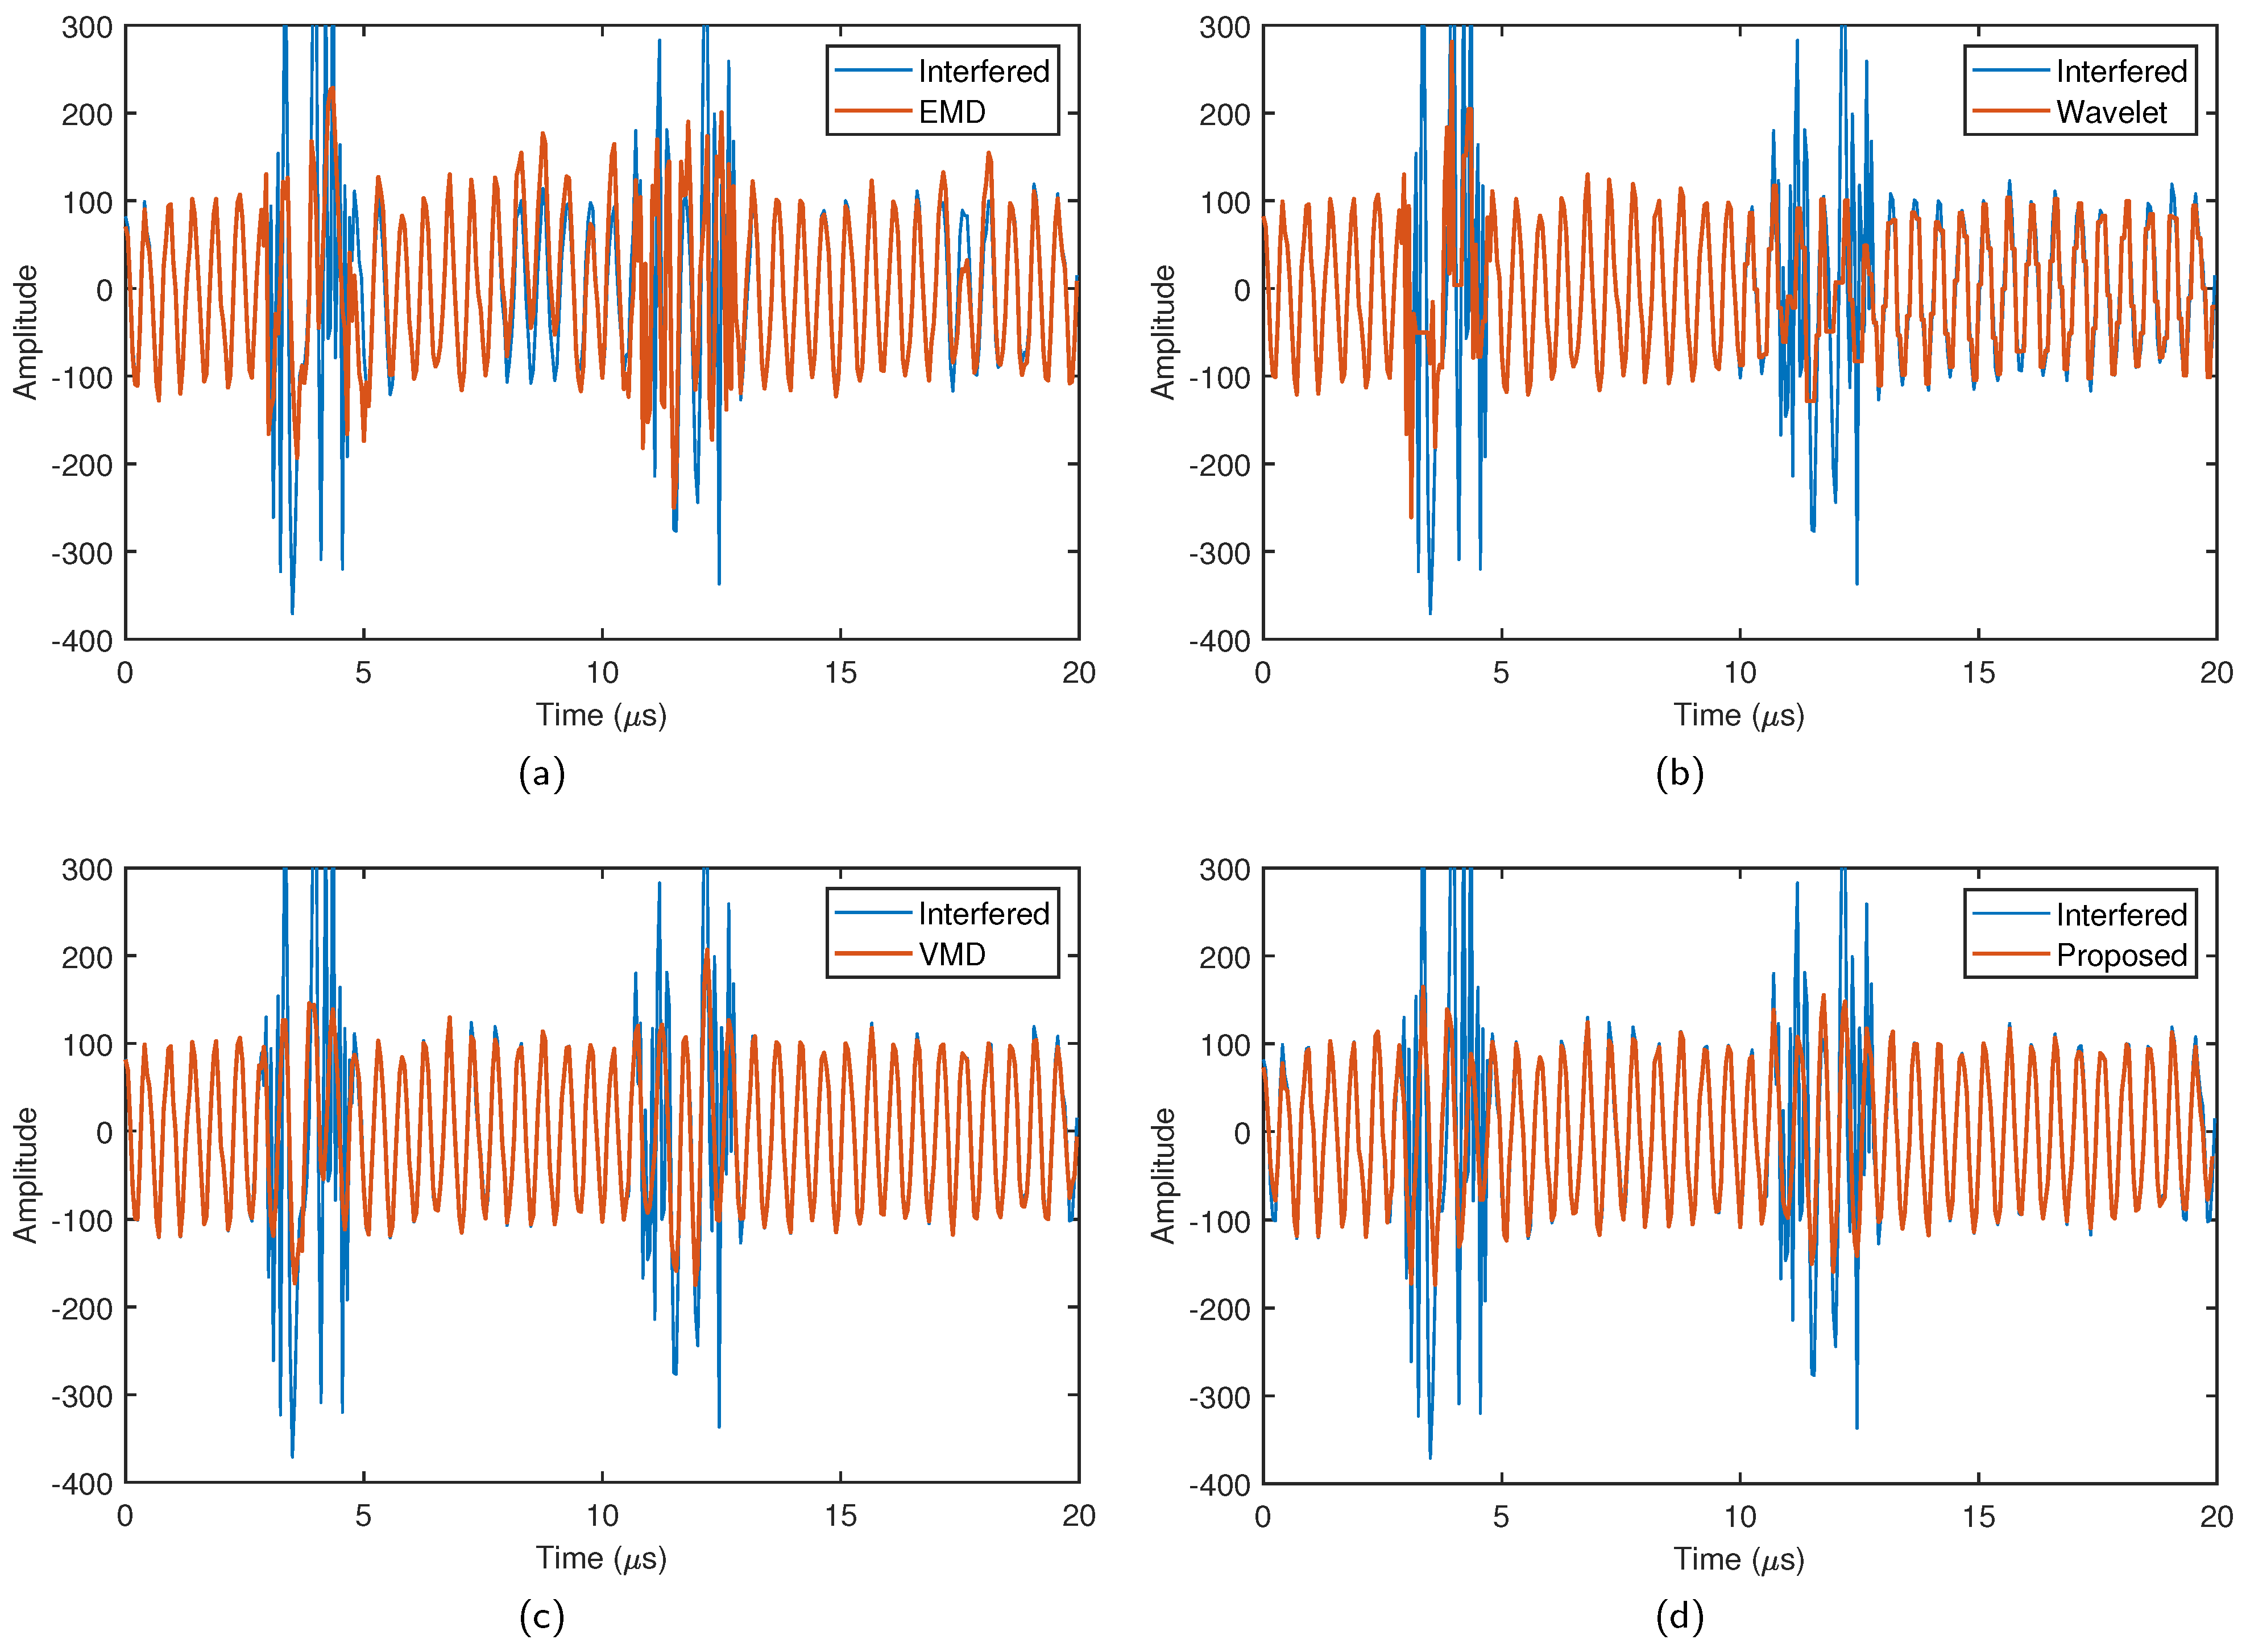
A comparison is presented in Figure 16 to illustrate the primary beat frequency signal and various post-interference reduction versions. The figure highlights the use of different techniques that have been employed for achieving mitigation. There are two interference sources in Figure 16, one generating short-duration interference and the other producing long-duration interference. Both VMD and the proposed method are able to successfully retrieve the sinusoidal waveform of the signal from the contaminated part while effectively reducing the interference, as highlighted in Figure 16c,d. Conversely, while the EMD and wavelet methods successfully suppress interference, they are unable to retrieve the sinusoidal signal, as is evident from Figure 16a,b. The proposed technique employs an orthogonal decomposition during signal decomposition to uniformly divide the range of radar detection, thereby decreasing the number of targets in the sub-bands. This facilitates effective selection and determination of the AR model order, ultimately leading to enhanced efficacy.
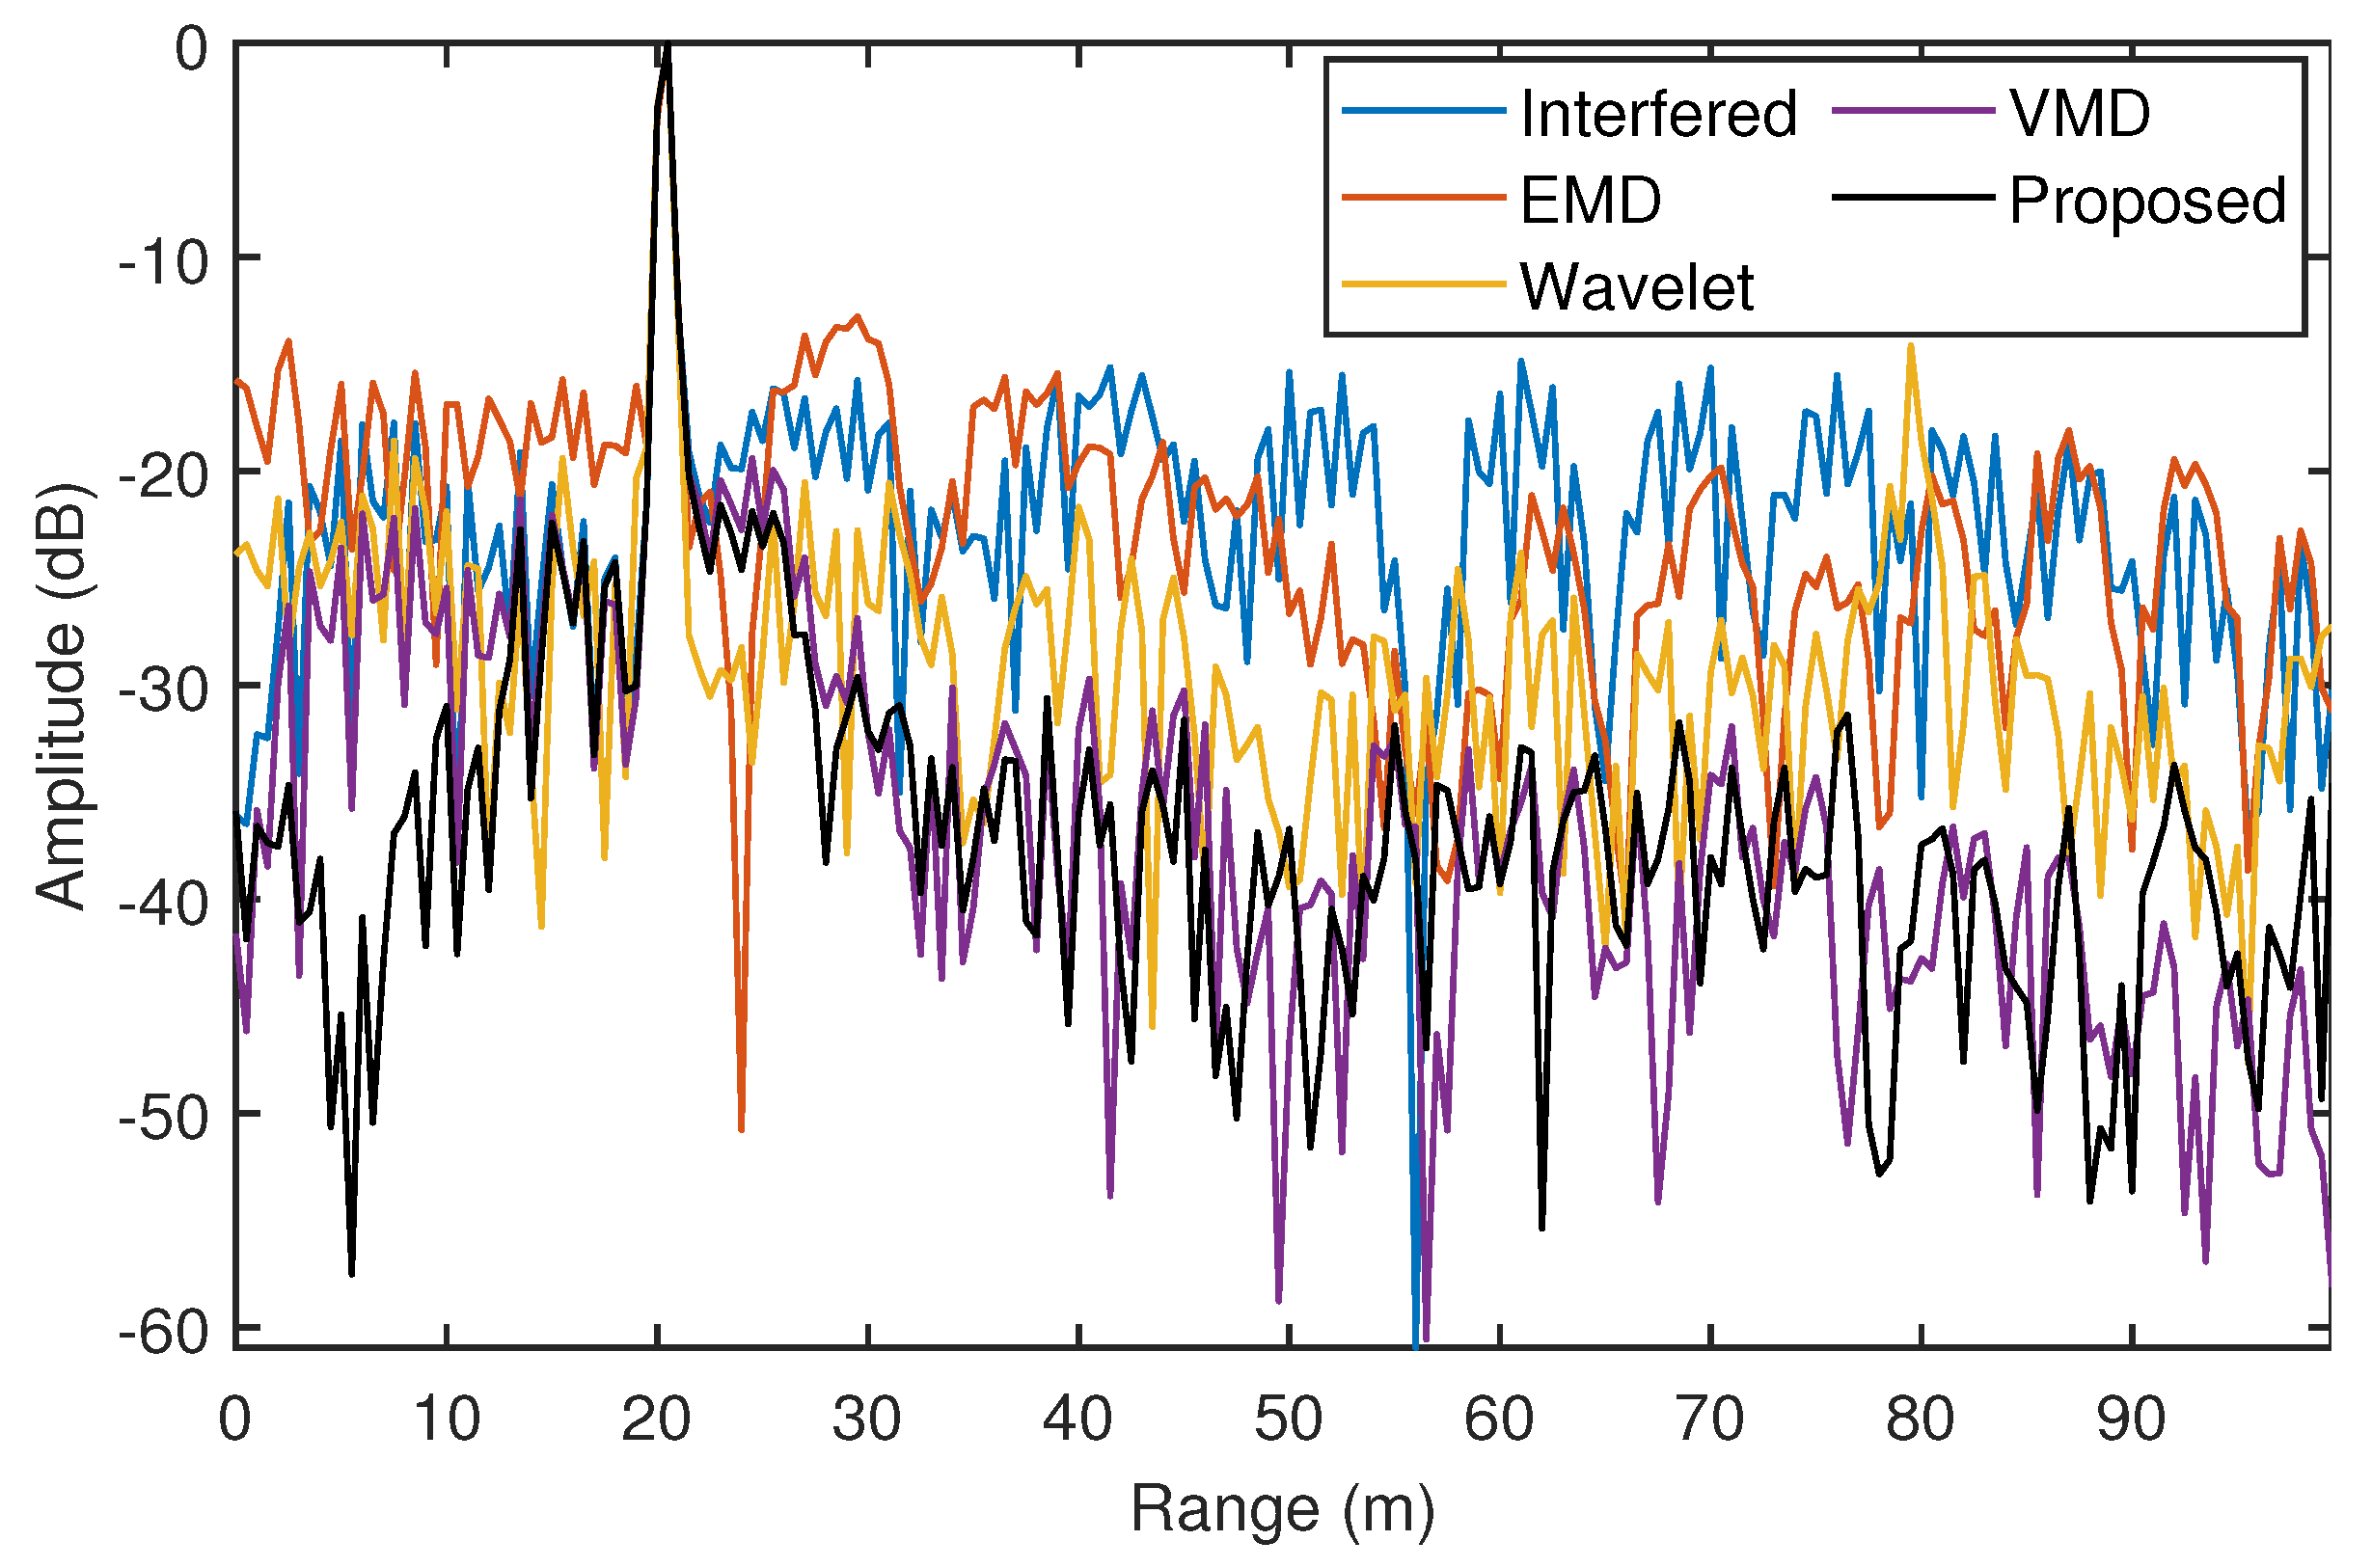
Figure 17 illustrates the interference reduction capabilities of the four tested methodologies on the range profile. It can be seen that there is a target signal at a distance of 20 m, which is consistent with the location of the corner reflector in the experimental setup. Prior to interference mitigation, although the target signal is not drowned by the noise, the interference greatly increases the noise floor. Following interference mitigation, all four methods eliminate a portion of the noise floor; of all the tested methods, the method proposed in this study displays the least amount of noise throughout the range profile.
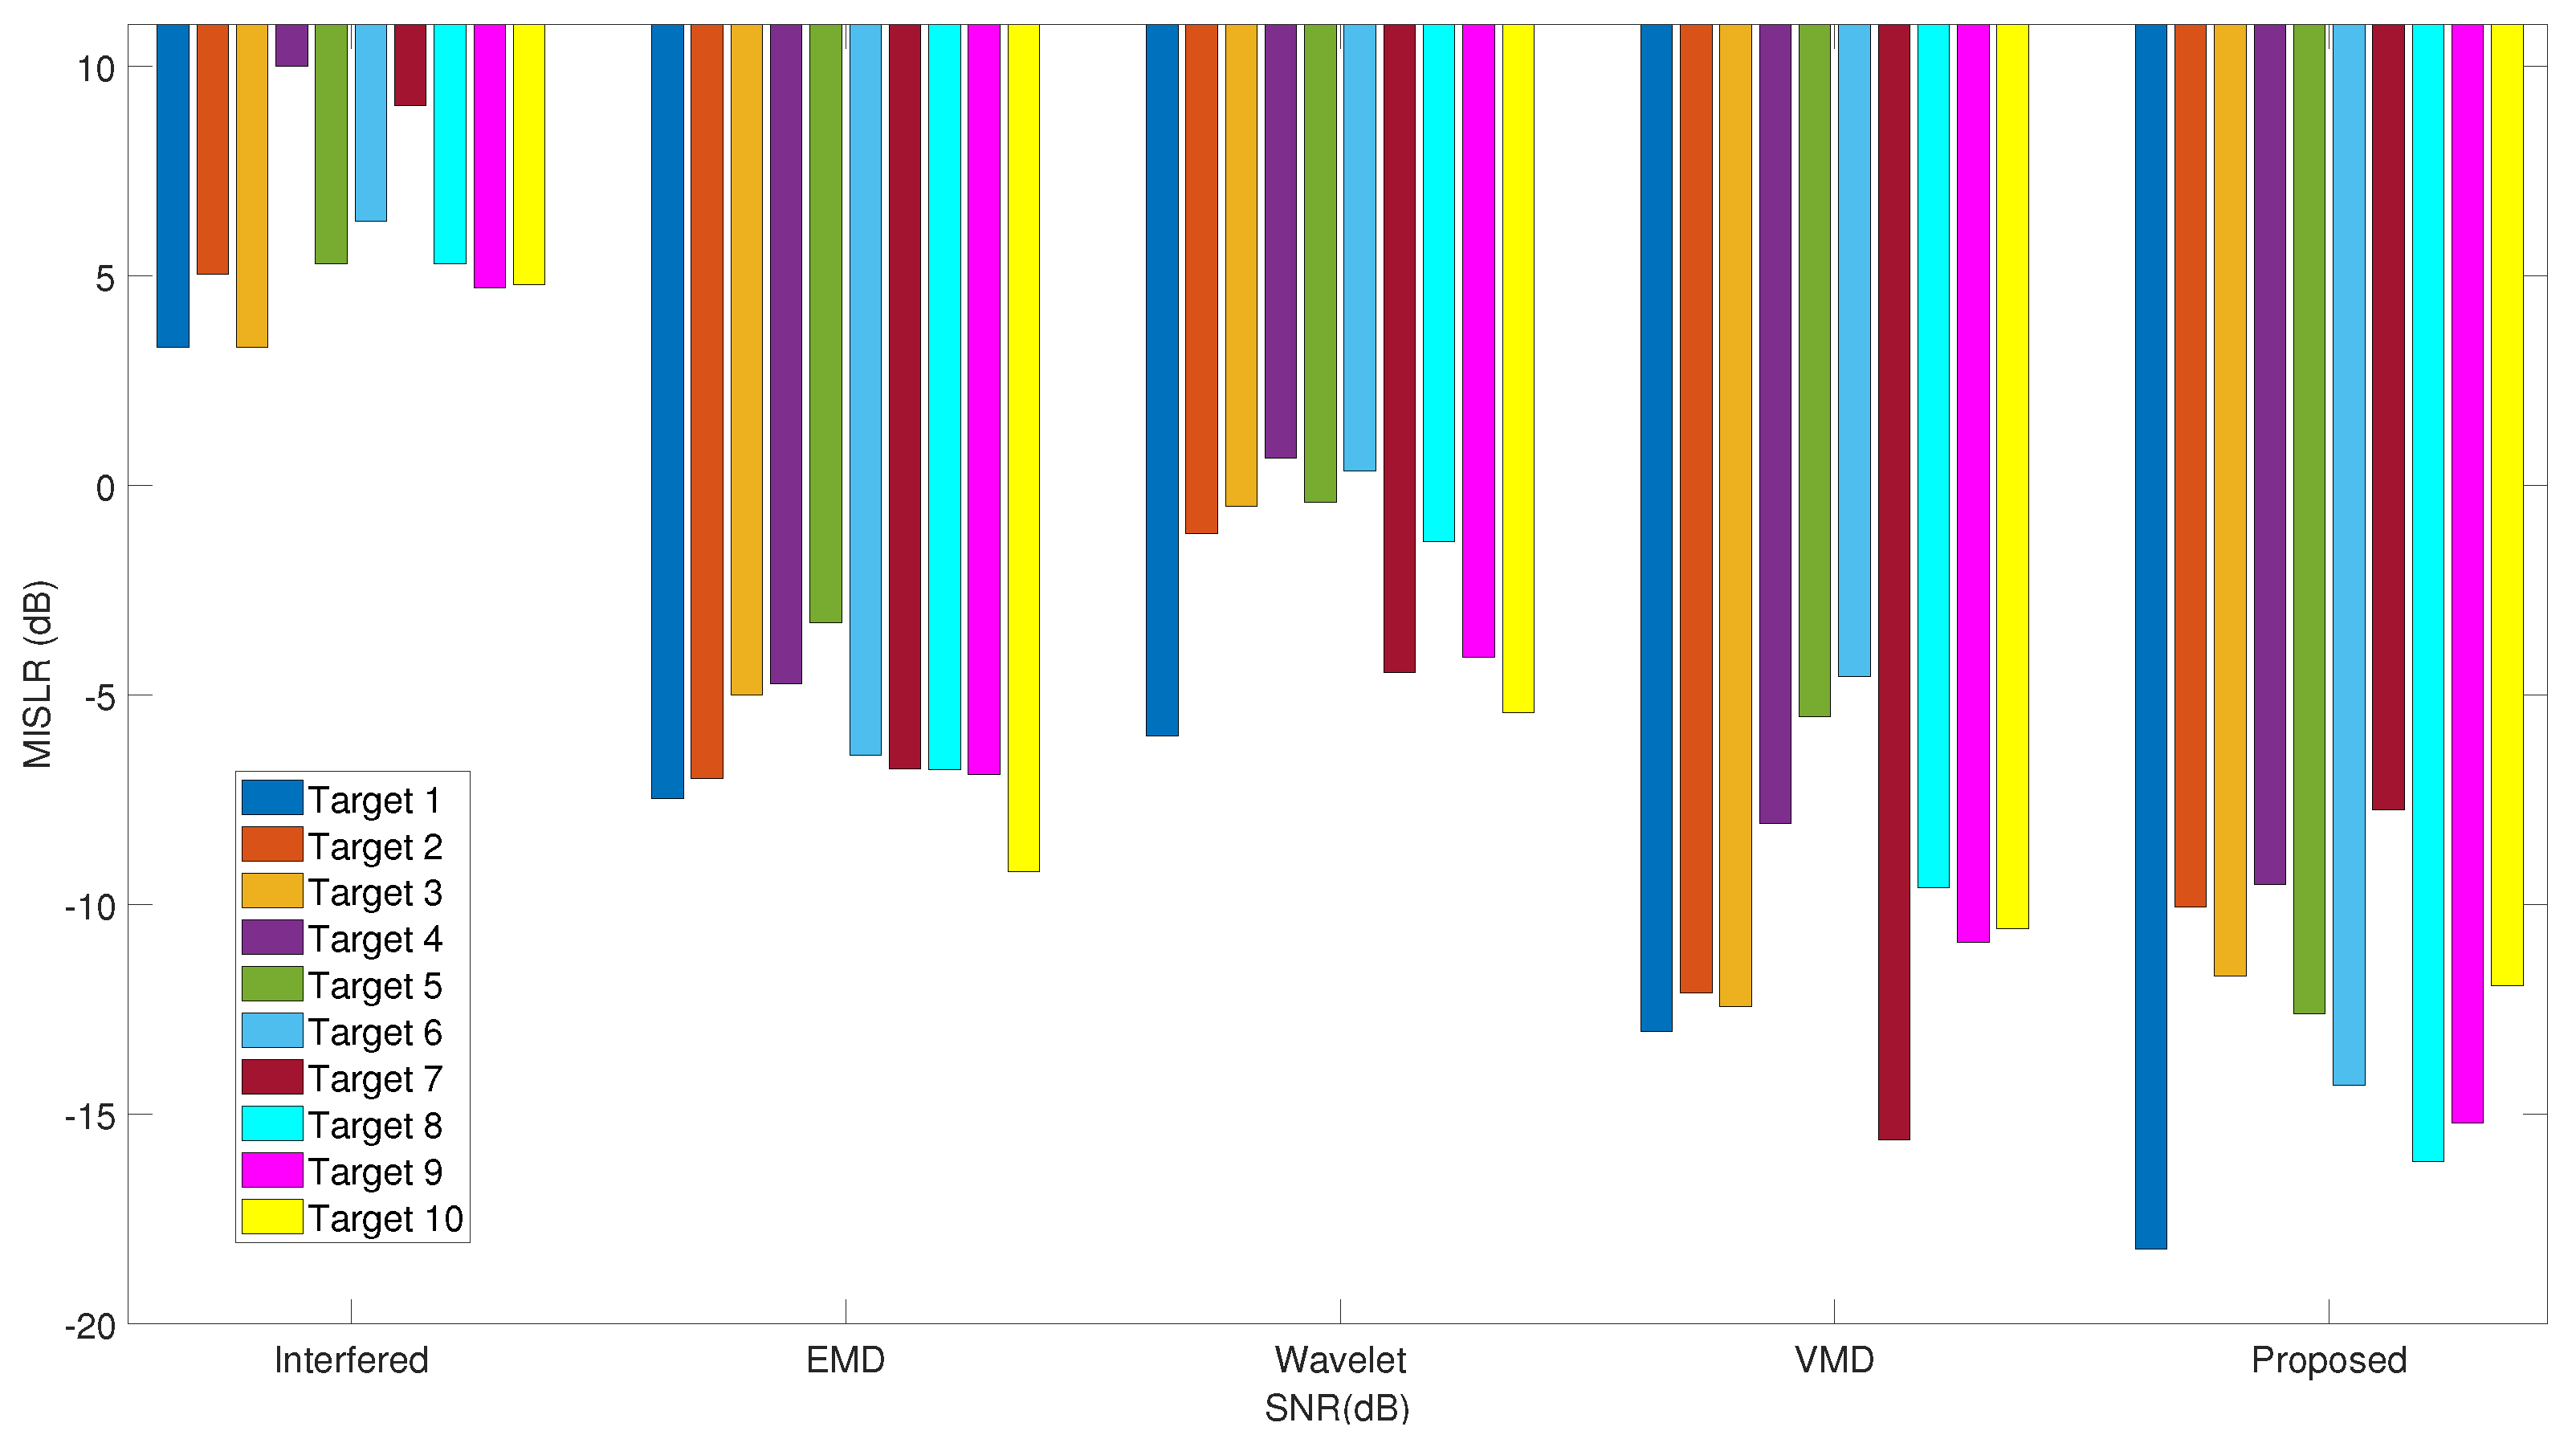
Figure 18 presents a quantitative evaluation of MISLR. The figure indicates that the proposed method delivers the lowest MISLR level. This substantiates its position as the finest interference mitigation technique in realistic experimental settings, returning the best possible target detection performance.
Figure 19 demonstrates the RD response of the measured data following interference mitigation. The RD response provides insights into the distribution of the range and velocity of the target. In other words, if a target can be found at a specific distance with a particular velocity, the RD map showcases a peak at the corresponding position. There are 128 chirps in each chirp sequence in the real experimental data, which are recorded as one frame. Each frame after interference mitigation is processed by 2D FFT to obtain the corresponding RD response. The experimental location of the corner reflector can be detected in the RD map, and is found to be positioned at 20 m with a velocity of 0 m/s. This observation is in agreement with the original experimental setup. Meanwhile, there is a motorcycle target in the scenario moving at a speed of 7.8 m/s at a position around 10 m from the radar. The RD response shows that after interference mitigation the moving target is clearly visible in the outcomes of the proposed approach. The RD response of the target can be accurately extracted by each of the four methods; however, the method proposed in this study demonstrates superior interference mitigation with a considerably lower noise level, an attribute that can greatly enhance target detection performance.

6. Conclusions

The objective of this paper was to address the issue of mutual interference mitigation in mmWave radars. In our proposed approach, the radar’s received signal spectrum is partitioned into discrete sub-band signals through an analysis of the frequency domain characteristics of target echoes and interference,. This enables targets at varying distances to be allocated across separate sub-bands while segregating interference power within specific sub-bands. As a result, the number of targets and interference power in each sub-band are reduced accordingly, which is beneficial to the subsequent interference detection and target echo reconstruction procedures. Using a CFAR detector and linear prediction model, a better interference mitigation effect and interference-free target echo signals can be obtained.
The results obtained through our simulations involving multi-target scenarios confirm that our method is able to outperform other methods that rely on decomposition techniques. Our proposed method achieves a good balance between performance and operational efficiency, and results obtained in a real-world scenario testing further verify its effectiveness.

Author Contributions

Conceptualization, Y.L.; Funding acquisition, Y.L.; Methodology, M.Y. and B.F.; Project administration, Y.L.; Software, M.Y. and B.F.; Supervision, Y.L.; Validation, B.F.; Writing—original draft, M.Y.; Writing—review and editing, M.Y. and B.F. All authors have read and agreed to the published version of the manuscript.

Funding

This work received the stabilization support of National Radar Signal Processing Laboratory under Grant JKW202208 and the Fundamental Research Funds for the Central Universities 2022RC008.

Data Availability Statement

The data presented in this study are available on request from the corresponding author.

Conflicts of Interest

The authors declare no conflict of interest.

References

  1. Dickmann, J.; Klappstein, J.; Hahn, M.; Appenrodt, N.; Bloecher, H.L.; Werber, K.; Sailer, A. Automotive radar the key technology for autonomous driving: From detection and ranging to environmental understanding. In Proceedings of the 2016 IEEE Radar Conference (RadarConf), Philadelphia, PA, USA, 2–6 May 2016; pp. 1–6. [Google Scholar] [CrossRef]
  2. Ziebinski, A.; Cupek, R.; Grzechca, D.; Chruszczyk, L. Review of advanced driver assistance systems (ADAS). AIP Conf. Proc. 2017, 1906, 120002. [Google Scholar] [CrossRef]
  3. Patole, S.M.; Torlak, M.; Wang, D.; Ali, M. Automotive radars: A review of signal processing techniques. IEEE Signal Process. Mag. 2017, 34, 22–35. [Google Scholar] [CrossRef]
  4. Karam, L.; Katupitiya, J.; Milanés, V.; Pitas, I.; Ye, J. Autonomous Driving: Part 1-Sensing and Perception [From the Guest Editors]. IEEE Signal Process. Mag. 2020, 37, 11–13. [Google Scholar] [CrossRef]
  5. Li, Y.; Ibañez-Guzmán, J. Lidar for Autonomous Driving: The Principles, Challenges, and Trends for Automotive Lidar and Perception Systems. IEEE Signal Process. Mag. 2020, 37, 50–61. [Google Scholar] [CrossRef]
  6. Dabral, S.; Kamath, S.; Appia, V.; Mody, M.; Zhang, B.; Batur, U. Trends in camera based Automotive Driver Assistance Systems (ADAS). In Proceedings of the 2014 IEEE 57th International Midwest Symposium on Circuits and Systems (MWSCAS), College Station, TX, USA, 3–6 August 2014; pp. 1110–1115. [Google Scholar] [CrossRef]
  7. Roos, F.; Bechter, J.; Knill, C.; Schweizer, B.; Waldschmidt, C. Radar Sensors for Autonomous Driving: Modulation Schemes and Interference Mitigation. IEEE Microw. Mag. 2019, 20, 58–72. [Google Scholar] [CrossRef] [Green Version]
  8. Hasch, J.; Topak, E.; Schnabel, R.; Zwick, T.; Weigel, R.; Waldschmidt, C. Millimeter-Wave Technology for Automotive Radar Sensors in the 77 GHz Frequency Band. IEEE Trans. Microw. Theory Tech. 2012, 60, 845–860. [Google Scholar] [CrossRef]
  9. Dickmann, J.; Appenrodt, N.; Bloecher, H.L.; Brenk, C.; Hackbarth, T.; Hahn, M.; Klappstein, J.; Muntzinger, M.M.; Sailer, A. Radar contribution to highly automated driving. In Proceedings of the 2014 44th European Microwave Conference, Rome, Italy, 6–9 October 2014; pp. 1715–1718. [Google Scholar]
  10. Yamada, H.; Kobayashi, T.; Yamaguchi, Y.; Sugiyama, Y. High-resolution 2D SAR imaging by the millimeter-wave automobile radar. In Proceedings of the 2017 IEEE Conference on Antenna Measurements & Applications (CAMA), Tsukuba, Japan, 4–6 December 2017; pp. 149–150. [Google Scholar] [CrossRef]
  11. Zhang, Z.; Wang, X.; Huang, D.; Fang, X.; Zhou, M.; Zhang, Y. MRPT: Millimeter-Wave Radar-Based Pedestrian Trajectory Tracking for Autonomous Urban Driving. IEEE Trans. Instrum. Meas. 2022, 71, 8000117. [Google Scholar] [CrossRef]
  12. Jones, W. Keeping cars from crashing. IEEE Spectr. 2001, 38, 40–45. [Google Scholar] [CrossRef]
  13. Norouzian, F.; Pirkani, A.; Hoare, E.; Cherniakov, M.; Gashinova, M. Phenomenology of automotive radar interference. IET Radar Sonar Navig. 2021, 15, 1045–1060. [Google Scholar] [CrossRef]
  14. Hakobyan, G.; Armanious, K.; Yang, B. Interference-Aware Cognitive Radar: A Remedy to the Automotive Interference Problem. IEEE Trans. Aerosp. Electron. Syst. 2020, 56, 2326–2339. [Google Scholar] [CrossRef]
  15. Goppelt, M.; Blöcher, H.L.; Menzel, W. Analytical investigation of mutual interference between automotive FMCW radar sensors. In Proceedings of the 2011 German Microwave Conference, Armstadt, Germany, 14–16 March 2011; pp. 1–4. [Google Scholar]
  16. Pirkani, A.A.; Norouzian, F.; Hoare, E.G.; Gashinova, M.S.; Cherniakov, M. Statistical Analysis of Automotive Radar Interference. In Proceedings of the 2020 IEEE Radar Conference (RadarConf20), Florence, Italy, 21–25 September 2020; pp. 1–6. [Google Scholar]
  17. Brooker, G.M. Mutual interference of millimeter-wave radar systems. IEEE Trans. Electromagn. Compat. 2007, 49, 170–181. [Google Scholar] [CrossRef]
  18. Kim, G.; Mun, J.; Lee, J. A peer-to-peer interference analysis for automotive chirp sequence radars. IEEE Trans. Veh. Technol. 2018, 67, 8110–8117. [Google Scholar] [CrossRef]
  19. Fan, Y.; Bao, J.; Wu, K.; Li, H. Ghost Image Due to mmWave Radar Interference: Experiment, Mitigation and Leverage. In Proceedings of the 2020 IEEE International Conference on Communications Workshops (ICC Workshops), Dublin, Ireland, 7–11 June 2020; pp. 1–6. [Google Scholar]
  20. Yan, J.; Pu, W.; Zhou, S.; Liu, H.; Greco, M.S. Optimal Resource Allocation for Asynchronous Multiple Targets Tracking in Heterogeneous Radar Networks. IEEE Trans. Signal Process. 2020, 68, 4055–4068. [Google Scholar] [CrossRef]
  21. Yan, J.; Pu, W.; Zhou, S.; Liu, H.; Bao, Z. Collaborative detection and power allocation framework for target tracking in multiple radar system. Inf. Fusion 2020, 55, 173–183. [Google Scholar] [CrossRef]
  22. Yan, J.; Jiao, H.; Pu, W.; Shi, C.; Dai, J.; Liu, H. Radar sensor network resource allocation for fused target tracking: A brief review. Inf. Fusion 2022, 86-87, 104–115. [Google Scholar] [CrossRef]
  23. Toth, M.; Meissner, P.; Melzer, A.; Witrisal, K. Performance Comparison of Mutual Automotive Radar Interference Mitigation Algorithms. In Proceedings of the 2019 IEEE Radar Conference (RadarConf), Boston, MA, USA, 22–26 April 2019; pp. 1–6. [Google Scholar] [CrossRef]
  24. Nozawa, T.; Makino, Y.; Takaya, N.; Umehira, M.; Takeda, S.; Wang, X.; Kuroda, H. An anti-collision automotive FMCW radar using time-domain interference detection and suppression. In Proceedings of the International Conference on Radar Systems (Radar 2017), Belfast, UK, 23–26 October 2017; pp. 1–5. [Google Scholar] [CrossRef]
  25. Rameez, M.; Dahl, M.; Pettersson, M.I. Autoregressive Model-Based Signal Reconstruction for Automotive Radar Interference Mitigation. IEEE Sens. J. 2020, 21, 6575–6586. [Google Scholar] [CrossRef]
  26. Neemat, S.; Krasnov, O.; Yarovoy, A. An Interference Mitigation Technique for FMCW Radar Using Beat-Frequencies Interpolation in the STFT Domain. IEEE Trans. Microw. Theory Tech. 2019, 67, 1207–1220. [Google Scholar] [CrossRef] [Green Version]
  27. Lee, S.; Lee, J.Y.; Kim, S.C. Mutual Interference Suppression Using Wavelet Denoising in Automotive FMCW Radar Systems. IEEE Trans. Intell. Transp. Syst. 2021, 22, 887–897. [Google Scholar] [CrossRef]
  28. Wu, J.; Yang, S.; Lu, W.; Liu, Z. Iterative modified threshold method based on EMD for interference suppression in FMCW radars. IET Radar Sonar Navig. 2020, 14, 1219–1228. [Google Scholar] [CrossRef]
  29. Zhou, F.; Xing, M.; Bai, X.; Sun, G.; Bao, Z. Narrow-Band Interference Suppression for SAR Based on Complex Empirical Mode Decomposition. IEEE Geosci. Remote Sens. Lett. 2009, 6, 423–427. [Google Scholar] [CrossRef]
  30. Li, Y.; Feng, B.; Zhang, W. Mutual Interference Mitigation of Millimeter-Wave Radar Based on Variational Mode Decomposition and Signal Reconstruction. Remote Sens. 2023, 15, 557. [Google Scholar] [CrossRef]
  31. Vetterli, M.; Herley, C. Wavelets and filter banks: Theory and design. IEEE Trans. Signal Process. 1992, 40, 2207–2232. [Google Scholar] [CrossRef] [Green Version]
  32. Flandrin, P.; Rilling, G.; Goncalves, P. Empirical mode decomposition as a filter bank. IEEE Signal Process. Lett. 2004, 11, 112–114. [Google Scholar] [CrossRef] [Green Version]
  33. Dragomiretskiy, K.; Zosso, D. Variational Mode Decomposition. IEEE Trans. Signal Process. 2014, 62, 531–544. [Google Scholar] [CrossRef]
  34. Miller, R. Fundamentals of Radar Signal Processing (Richards, M.A.; 2005) [Book review]. IEEE Signal Process. Mag. 2009, 26, 100–101. [Google Scholar] [CrossRef]
  35. Chan, Y.; Lavoie, J.; Plant, J. A parameter estimation approach to estimation of frequencies of sinusoids. IEEE Trans. Acoust. Speech Signal Process. 1981, 29, 214–219. [Google Scholar] [CrossRef]
  36. Chatzitheodoridi, M.E.; Taylor, A.; Rabaste, O. A Mismatched Filter for Integrated Sidelobe Level Minimization over a Continuous Doppler Shift Interval. In Proceedings of the 2020 IEEE Radar Conference (RadarConf20), Florence, Italy, 21–25 September 2020; pp. 1–6. [Google Scholar] [CrossRef]
  37. Davis, M.S.; Lanterman, A.D. Minimum integrated sidelobe ratio filters for MIMO radar. IEEE Trans. Aerosp. Electron. Syst. 2015, 51, 405–416. [Google Scholar] [CrossRef]
Figure 1. Signal workflow of FMCW radar system in interference scenario.
Remotesensing 15 03210 g001
Figure 2. Interference mitigation method workflow.
Remotesensing 15 03210 g002
Figure 3. Spectrum sub-band analysis workflow.
Remotesensing 15 03210 g003
Figure 4. CA-CFAR detector implementation.
Remotesensing 15 03210 g004
Figure 5. Sub-band signal synthesis workflow.
Remotesensing 15 03210 g005
Figure 6. Simulated signal before and after adding interference: (a) the interference−free signal in time domain; (b) the spectrum or range profile of the interference−free signal; (c) the interfered signal in the time domain; (d) the range profile of the interfered signal.
Remotesensing 15 03210 g006
Figure 7. Time−frequency map of the interfered simulated beat frequency signal.
Remotesensing 15 03210 g007
Figure 8. The resulting decomposition outcomes when the tested methods were applied to the simulated beat frequency signal: (a,b) illustrate the EMD outcomes in the time and range domains, respectively, while the wavelet method outcomes in both domains are presented in (c,d). The VMD outputs in the time and range domains are depicted in (e,f), respectively. Finally, the outputs of the proposed method in both domains are illustrated in (g,h).
Remotesensing 15 03210 g008
Figure 9. The energy contribution of the decomposition components of the tested methods.
Remotesensing 15 03210 g009
Figure 10. Simulated data analyzed for the effectiveness of interference reduction in the time domain: (a) reference signal, (b) EMD, (c) wavelet, (d) VMD, (e) our proposed method.
Remotesensing 15 03210 g010
Figure 11. The signal-to-interference-plus-noise ratio (SINR) after interference mitigation of simulated data using different methods.
Remotesensing 15 03210 g011
Figure 12. Range profile after interference mitigation of simulated data using different methods.
Remotesensing 15 03210 g012
Figure 13. The multi-target integrated sidelobe ratio (MISLR) after interference mitigation of simulated data using different methods.
Remotesensing 15 03210 g013
Figure 14. The range-Doppler (RD) response after interference mitigation of simulated data using different methods.
Remotesensing 15 03210 g014
Figure 15. Measured data collection scenario.
Remotesensing 15 03210 g015
Figure 16. Four distinct approaches were employed to assess the effects of interference mitigation on the measured data in the time domain: (a) EMD, (b) wavelet, (c) VMD, and (d) the proposed method.
Remotesensing 15 03210 g016
Figure 17. Range profile after interference mitigation of measured data using different methods.
Remotesensing 15 03210 g017
Figure 18. MISLR after interference mitigation.
Remotesensing 15 03210 g018
Figure 19. RD response after performing interference mitigation on the measured data using different methods.
Remotesensing 15 03210 g019
Table 1. Target parameters used in the simulation experiment.
Target Label12345678910
Range (m)91181271361451541631721811900
Speed (m/s)2.82.93.23.53.84.14.64.85.15.4
Table 2. Radar parameters in simulation experiment.
Rader ParametersVictimInterfere 1Interfere 2
Carrier frequency (GHz)777777
Sweep bandwidth (MHz)300600600
Pulse width ( μ s)1001050
Sweep directionUpDownUp
Sampling frequency (MHz)50--
Table 3. Run times of different methods.
Method ListRuntime of
Signal Decomposition
(ms)
Runtime of
Interference Detection
and Mitigation (ms)
Total Runtime (ms)
EMD35.5423.9459.4
Wavelet30.2239.1269.3
VMD2973.6628.83602.4
Proposed605.3627.51232.8
Table 4. Experimental configurations in real-world scenario.
Rader ConfigurationsVictimInterferer 1Interferer 2
Carrier frequency (GHz)777777
Sweep bandwidth (MHz)300300500
Pulse width ( μ s)202020
Sweep directionUpDownUp
PRT ( μ s)304361
Sampling frequency (MHz)20--
Disclaimer/Publisher’s Note: The statements, opinions and data contained in all publications are solely those of the individual author(s) and contributor(s) and not of MDPI and/or the editor(s). MDPI and/or the editor(s) disclaim responsibility for any injury to people or property resulting from any ideas, methods, instructions or products referred to in the content.