Article

The Aerosol Optical Characteristics in Different Dust Events Based on a 532 nm and 355 nm Polarization Lidar in Beijing

1
School of Ecology and Environment, Beijing Technology and Business University, Beijing 100048, China
2
State Environmental Protection Key Laboratory of Food Chain Pollution Control, Beijing Technology and Business University, Beijing 100048, China
3
Anhui Institute of Optics and Fine Mechanics, Chinese Academy of Sciences, Hefei 230031, China
4
CMA Meteorological Observation Centre, Beijing 100081, China
*
Author to whom correspondence should be addressed.
Remote Sens. 2023, 15(14), 3494; https://doi.org/10.3390/rs15143494
Submission received: 2 June 2023 / Revised: 4 July 2023 / Accepted: 8 July 2023 / Published: 11 July 2023

Abstract

:
Extreme weather events are happening more frequently as a result of global climate change. Dust storms broke out in the spring of 2017 in China and drastically impacted the local air quality. In this study, a variety of data, including aerosol vertical profiles, surface particle concentration, meteorological parameters, and MODIS–derived aerosol optical depth, as well as backward trajectory analysis, were employed to analyze two dust events from April to May in Beijing. The dust plumes were mainly concentrated below 0.8 km, with peak PM10 values of 1000 μg·m−3 and 300 μg·m−3 in the two cases. The aerosols showed different vertical distribution characteristics. The pure dust in case 1 from 4 to 5 May 2017 had a longer duration (2 days) and presented a larger aerosol extinction coefficient (2.27 km−1 at 355 nm and 1.25 km−1 at 532 nm) than that of the mixed dust in case 2 on 17 April 2017 (2.01 km−1 at 355 nm and 1.33 km−1 at 532 nm). The particle depolarization ratio (PDR) remained constant (0.24 ± 0.03 in case 1) from the surface to 0.8 km in height. In contrast, the PDR profile in the mixed dust (case 2) layer was split into two regions—large values exceeding 0.15 above 0.6 km and small values of 0.11 ± 0.03 below 0.6 km. The influence of meteorological information on aerosol distribution was also investigated, and wind was predominant through the observing period. The pure dust in case 1 was mainly from Mongolia, with strong northwest winds, while the near-surface mixed pollution was caused by the combination of long-transported sand and local emission. Furthermore, lidar-derived profiles of dust mass concentrations in the two cases were presented. This study reveals the vertical characteristics of dust aerosols in the production and dissipation of localized dust events and confirms the efficacy of thorough observations with multiple approaches from the ground to space to monitor dust events in real time.

1. Introduction

Dust is a kind of weather phenomenon in which strong winds raise a large amount of dust and sand on arid and semi-arid surfaces, making the air turbid and reducing the horizontal visibility [1]. Dust particles can be suspended in the atmosphere and transported for a long distance in the global atmospheric circulation [2]. The sedimentation and loss rate of dust with different particle sizes, coupled with a change in wind direction, results in a difference in dust pollution intensity and occurrence seasons [3].
Beijing, the political and economic center of China, is located on the North China Plain and surrounded by mountains on three sides. Because of the adjacent northwest desert and the leeward direction of Mongolian dust, it is more likely to be affected by a Mongolian air mass when northern winds are prevalent in the spring [4]. Benefiting from the improvement of natural conditions (i.e., weaken surface wind speed, enhanced precipitation, and soil water), as well as the promotion of vegetation cover caused by afforestation in North China (by the Three-North Shelter Forest Program) [5], the occurrence of dust storms in China has been continuously declining for the past two decades [6,7]. However, several severe dust events have reoccurred in the North China Plain in the spring of 2017–2023 [8,9], significantly impacting the air quality in Beijing, as well as the downstream areas [10]. Therefore, it is vital to investigate dust evolution for weather and air quality forecasts.
Light Detection and Ranging (lidar), as one of the widely used remote sensing technologies, is desirable to obtain the temporal and spatial variability of aerosols, as well as aerosol optical and microphysical properties in the atmosphere. Many different lidar systems have been employed to observe aerosols [11,12]. Among them, polarization lidar can provide multiple aerosol properties (i.e., particle depolarization ratio (PDR) and aerosol extinction coefficient (Ext. Coef.)) and is a good tool to detect dust [13,14,15,16,17]. For example, Shimizu et al. [18] reported the occurrence frequency and the vertical distribution of dust particles based on the continuous operation of polarization lidars in Beijing (China) and Nagasaki and Tsukuba (Japan). He et al. [19] showed that dust aerosols almost spread out in the troposphere from the ground up to an altitude of ~10 km, with a PDR value of 0.2 near the surface. A slightly large PDR (0.25 ± 0.03) and small Ångström exponent (0.11 ± 0.44) were observed by Chen et al. [20] in pure dust pollution. In addition to the optical characteristics, numerous investigations have also concentrated on the meteorological impacts on aerosols during dust evolution. For instance, the influences of dust on aerosol optical characteristic climatic changes and strong Mongolian cyclones were attributed to Asian dust transportation, according to Yin et al. [21]. Different contributions of dust sources were responsible for the distinct seasonal variations in dust occurrence frequencies and vertical distributions over the Jianghan Plain [22]. In addition to cyclones or anticyclones, the transit of a cold front indirectly contributed to the increase in the particulate matter (PM) concentration in Shijiazhuang via the long-transported upper airflow [23]. Furthermore, the relationship between PM concentrations and wind speed in dust pollution was also investigated [24].
However, most of the above studies were carried out independently or focused on a single pollution event, and few studies have been conducted on the different types of dust events at a certain observation point [25]. And the simultaneous retrieval of vertical profiles of PM mass concentrations is also scarce. Thus, in our study, a 532 nm and 355 nm depolarized lidar was deployed in Beijing from 1 April to 30 May 2017 to detect the dust aerosol optical properties. Compared to the previous study of the dust event in May 2017 [26], we focused on a more local site (Beijing) and tried to find different aerosol optical properties (i.e., PDR and Ångström exponent) during two specific dust events in the spring of 2017.
The paper is organized as follows. Section 2 presents the observing site and explains the retrieval methods for the aerosol optical properties (Ext. Coef., PDR, and Ångström exponent) and PM mass concentration. Section 3 compares the vertical structures of aerosols for two dust events (4–6 May 2017 and 16–17 April 2017), together with source identification by backward trajectories. Section 4 discusses the similarities and differences between the two cases with previous studies and retrieves the vertical profiles of dust mass concentrations to verify the accuracy of the observation results. Section 5 summarizes the article with a brief conclusion.

2. Site, Measurements, and Model Data

2.1. Observation Sites

The ground-based lidar observation site was located at the Institute of Atmospheric Physical, Chinese Academic of Sciences (39°90′N, 116°30′E). It is seated between the North Third Ring Road and Fourth Ring Road in Beijing, which means its monitoring results can directly reflect the level of pollution in this central city.

2.2. Measurements

2.2.1. Lidar

The lidar utilized in our study was developed by the Anhui Institute of Optics and Fine Mechanics, Chinese Academy of Sciences (AIOFM, CAS). The transmitting system includes an Nd:YAG laser emitting a 1064 nm laser, and a double- and triple-frequency converter converting the 1064 nm laser to 532 and 355 nm lasers. The receiving system consisting of a 200 mm diameter telescope records the returned signal using a photomultiplier tubes (PMT) detector with a temporal resolution of 15 min per 7.5 m. The specific parameters of the lidar setup are shown in Table 1. The gain ratio K of the lidar system can be determined through the experimental “+45°method” on a clear and cloudless day. Detailed procedures can be found in [27]. The lowermost height related to the geometric overlap factor depends on the laser divergence angle, receiving field of view (FOV), and the distance between the laser and the receiving telescope [28]. Based on the method described in [29], the minimum height is approximately 0.2 km when the FOV is 1.5 mrad and the diameter of the telescope is 200 mm. The signal-to-noise ratio (SNR) and ranged-corrected signal (RCS profiles in Figure 1) can also confirm the minimum available height. Therefore, we only presented the results of 0.2–1.8 km in the subsequent analysis.

2.2.2. Surface Pollutant Concentration and Meteorological Data

During the dust event, the hourly-averaged surface pollutant mass concentrations (PM2.5 and PM10) from the China National Environmental Monitoring Center (CNEMC) were utilized to present the dust presence. In addition, the meteorological information, including the ground temperature (T), relative humidity (RH), wind speed, and wind direction, was also simultaneously obtained to investigate their influences on dust evolution. The meteorological information was provided by the China Meteorological Data Service Centre (http://data.cma.cn/ (accessed on 15 October 2022)).

2.2.3. MODIS AOD

To examine the dust influences on the aerosol optical characteristics at our observing site, the level 2 aerosol property data from the Moderate Resolution Imaging Spectroradiometer (MODIS) instrument carried on both the Terra (MOD04_L2) and Aqua (MYD04_L2) satellites were utilized to provide the aerosol optical depth (AOD) at 550 nm. The satellite orbits passed China every day at around 10:30 (Terra) and 13:30 (Aqua) LST (Local Standard Time). The AODs were retrieved with both the Dark Target and Deep Blue algorithms [30]. The uncertainty in the retrieved AOD was 0.05 ± 0.15 × AOD for AOD ≤ 1.0 [31].

2.2.4. Backward Trajectory Simulation

In order to identify the dust sources and their path, the Hybrid Single-Particle Lagrangian Integrated Trajectory (HYSPLIT) model was used. The HYSPLIT model [32] (https://www.arl.noaa.gov/hysplit/getrun–hysplit/ (accessed on 10 December 2022)) is a professional model developed by the National Oceanic and Atmospheric Administration (NOAA) that can calculate the backward trajectories of an air mass. The 72-h backward trajectories were calculated at altitudes of 0.3 km, 0.5 km, and 1 km to track the airflow prior to it reaching Beijing in our study.

2.3. Aerosol Optical Properties

In this study, the backscattering coefficient (Bs. Coef.), Ext. Coef., PDR, and backscattering-related Ångström exponent (BAE) were calculated from lidar observations to investigate the aerosol optical properties (Table 2). The original backscattered signals were preprocessed by atmospheric and electronic background subtraction, dead time correction, and the merging of the analog and photon counting (PC) signals. The method of merging the analog and PC signals is to find a range in which the SNR of the analog signal is relatively high, the PC signal is effective, and the two-channel signals have the best linear correlation. Regarding the particular circumstances of every study procedure, the reference height in an aerosol-free region is chosen to be between 5 and 8 km. A constant lidar ratio (the ratio of the Ext. Coef. to the Bs. Coef. for atmospheric aerosols) must be assumed to obtain the aerosol optical properties from the elastic backscattered signal at 532 nm. Here, the lidar ratio for Asian dust events was taken as 45 sr [33,34]. After the data preprocessing, the particle Bs. Coef. and the Ext. Coef. at 532 nm could be retrieved by using Klett’s method [35]. Profiles of the Ångström exponent could also be derived from particle backscattered profiles.
PDR, the ratio of the cross-polarized to the co-polarized atmospheric backscatter intensity, is imperative for identifying dust aerosols. For spherical targets, the depolarization ratio approaches 0. However, for non-spherical particles (e.g., dust aerosols), the depolarization ratio is greater than 0. Under normal circumstances, the PDR is often less than 0.1 for fine aerosols, such as 0.01 ± 0.001 for sea salt, while Asian and Saharan dust aerosols can reach 0.39 ± 0.4 and 0.39 ± 0.05, respectively [36]. Moreover, the Ångström exponent reflects the dependence of aerosol extinction on the wavelength of incident light and characterizes the sizes of atmospheric aerosols (small values mean large particle sizes) [37]. The BAE is expressed by Equation (1) [17]:
A λ 1 λ 2 α = ln β λ 1 β λ 2 ln λ 1 λ 2
where λ1 and λ2 represent the wavelengths of 355 nm and 532 nm, respectively.

2.4. Dust Mass Concentration Retrieval

In order to separate the dust component from the total aerosol Bs. Coef. and retrieve the dust mass concentration profiles, we assumed a two-type mixture of dust and urban aerosols [38]. The primary principle of this approach is introducing two threshold values of the PDR [39]. Then, we estimate the profiles of the dust Ext. Coef. by multiplying the dust Bs. Coef. with the respective values of the dust LR [40,41]. Because the dust mass concentration is directly proportional to the dust Ext. Coef. [42], the linear model can be presented in the following form [43]:
  m d = ξ · α d + C
where ξ and C are constants that are related to the composition and optical index of atmospheric aerosols. The processes of the vertical distribution of dust mass concentration retrieval with the above model are as follows [44].
(1)
Obtain the near-surface aerosol and dust mass concentration at the same location simultaneously. The Ext. Coef. at 0.2 km is obtained by lidar, and the PM mass concentration is from CNEMC.
(2)
Obtain the model parameters. Choose 10 pairs of αd and mass concentration data and then calculate the model parameters of ξ and C using the iterative method.
(3)
Retrieve the vertical distribution of the dust mass concentration. The vertical Ext. Coef. with a spatial resolution of 7.5 m can be measured by lidar. Based on the model parameters of ξ and C in step 2, the dust mass concentration at the corresponding height can be obtained. By calculating the Ext. Coef. of all the points, the vertical profiles of the dust mass concentration can be retrieved.
Uncertainties in the retrieval of the dust mass concentrations mainly include two parts [45]: (1) uncertainty of the Bs. Coef. results due to the assumption of the parameters during Klett’s retrieval [46] and (2) the parameters ξ and C for the linear model. Considering the uncertainty of ∼10% in the dust LR [33], the uncertainty in the dust Ext. Coef. is estimated to be 15–25%. Then, uncertainties in retrieved mass concentrations can be calculated by the law of error propagation. Combining the uncertainties of the dust Ext. Coef. and linear model parameters, the uncertainty of particle mass concentrations below 2 km ranges from 30% to 50%.

3. Results

3.1. Overview

To distinguish “dusty days” from other days, the criteria are based on the PM concentration and aerosol optical parameters. Specifically, the threshold is 150 μg·m−3 for PM10 and 75 μg·m−3 for PM2.5, respectively [47]. The depolarization ratio ranging from 0.1 to 0.4 [48], the AOD from 0.5 to 2.8 [49], and the absolute value of BAE smaller than 0.7 [50] are combined to help identify dusty pollution. Figure 2 shows the time series of surface PM10 and PM2.5. The three episodes when the peak values of the PM mass concentrations occurred can be classified as dust events. They appeared on 3 April, 16–17 April, and 4–6 May, coinciding with the reported dust events (www.xinhuanet.cn (accessed on 8 October 2022)). Among them, the two dust events in April (3 April and 16–17 April) presented similar sources and aerosol properties, so we chose case 1 (16–17 April) and case 2 (4–6 May) to investigate in more detail.

3.2. Case 1: 4–6 May 2017

3.2.1. Meteorological Condition and MODIS Observation

Figure 3a,b show the synoptic conditions in North China on 4 and 5 May, with the observing site marked with a green star. At 06:00 LST on May 4, the site was affected by an approaching air mass from the northwest. The strong northwest winds formed an anticyclonic airflow and brought large amounts of dust aerosols. Subsequently, the first PM peak (1000 μg·m−3 at PM10) occurred 2 h later, from 08:00 to 12:00 LST. The high pressure moved towards the southeast on 5 May, with a core pressure of 1032.5 hPa. Then, the dust weakened significantly and tended to dissipate. Figure 3c presents the spatial distribution of the MODIS daily AOD on 4 May. On 4 May, the AOD values in North China predominantly surged to >1.8 (in red), indicating strong dust in the Beijing area. Under the influence of northwest winds, the dust aerosols were driven by a cyclone to move southeast and gradually affected Shandong Province and other places the next day (Figure 3d). Meanwhile, the AOD values in our observation site fell below 0.6.

3.2.2. Aerosol Optical Properties

Simultaneously, the vertical distribution of the RCS (arb. unit) and PDR at 532 nm were detected by the ground-based lidar, as shown in Figure 4. It is noticeable that case 1 experienced one stage of growth (S1, from 00:00 LST on 4 May to 12:00 LST on 5 May) and one stage of dissipation (S2, from 12:00 LST on 5 May to the end). During S1, the averaged RCS at 532 nm of the aerosols was 0.88 ± 0.10 at 0.3 km, while this value was 0.39 ± 0.20 at 0.3–0.8 km. However, the RCS values above 0.8 km were basically less than 0.2. This phenomenon suggests the accumulation of high concentrations of dust aerosols at lower heights [51]. In the meantime, the PDR increased to the maximum value of 0.28 at 1.0 km at 10:00 LST on 5 May. Compared to S1, S2 experienced an aerosol decrease. Specifically, the averaged RCS below 0.3 km decreased to 0.80 ± 0.15 and PDR to 0.12 ± 0.03, suggesting the diffusion of this dust event.
The averaged profiles of Bs. Coef. and Ext. Coef. at 532 nm and 355 nm, PDR at 532 nm, and BAE (355 nm/532 nm) during the peak period (8:00–12:00 LST on 4 May) are illustrated in Figure 5. It shows that the dust layer was mainly concentrated at 0.2–0.8 km in height from the ground, and the maximum Ext. Coef. At 355 nm and 532 nm were approximately 2.27 km−1 and 1.25 km−1, respectively. It reflects the large concentrations of dust particles aerosols (especially below 0.3 km) [52]. As for the PDR in Figure 5c, a larger peak value of 0.27 was also observed, representing the abundance of coarse particles in S1. In addition, the large PDR values were more distributed around lower heights, which was similar to the observation from Dong et al. [53]. Furthermore, the value of BAE (−0.40 ± 0.16) in S1 was inversely proportional to heights below 0.8 km (Figure 5d), proving more larger particles were suspended at heights below 0.8 km [20].

3.2.3. Surface Data and Backward Trajectories

Figure 6 shows the surface data, including pollutants (PM2.5 and PM10), and the meteorological factors (WS and WD). The PM2.5 and PM10 concentrations simultaneously increased rapidly and reached their maximum values of 480 μg·m−3 and nearly 1000 μg·m−3 at 08:00 LST on 4 May (Figure 6a), coinciding with the time of the peak of the RCS and PDR observed in Figure 4. In addition, the PM2.5/PM10 ratios were mainly below 0.5 during the peak period (because the monitoring site’s PM10 measurement limit was 1000 μg·m−3, and the actual ratio might have been smaller), indicating that coarse mode particles were the main contributors to this dust event. For the wind information, a northwest wind was prevalent, though it fluctuated between northerly and westerly winds (Figure 6b). The wind speed rapidly increased up to 7.9 m/s in the aerosols increasing period, followed by the occurrence of the PM peak concentration. It was reasonable that the northwest winds initially brought large amounts of dust from Mongolia. Then, the much stronger winds (up to 13 m/s) at noon correlated with a sharp decrease in the PM mass concentration, leading to pollution dissipation. In summary, we could see that the pure dust in case 1 was mainly from the Mongolian desert under the dominance of moderate northwest winds. Then, the dust layer sedimented gradually to the lower heights with increased PDR, deteriorating the ground air quality significantly. The strong flow after 12:00 LST on 5 May led to rapid dust dissipation.
In order to analyze the source and path of the air mass, Figure 6c,d show the 72-h backward trajectory based on the HYSPLIT model altitudes of 0.3 km, 0.5 km, and 1.0 km (only 0.3 km is marked in the figure, since the aerosols are homologous below 0.5 km). At the beginning of the dust event on 4 May (Figure 6c), the air mass passed through Mongolia and Inner Mongolia, carrying large amounts of dust to Beijing. Though the airflow source did not change much on 5 May (Figure 6d), the shortened flow path and strong winds resulted in dust dissipation on the afternoon of 5 May.

3.3. Case 2: 16–17 April 2017

3.3.1. Meteorological Condition and MODIS Observation

In case 2, the wind direction turned from north (6:00 LST on 17 April) to northwest (18:00 LST on 17 April) and formed an air circulation around Beijing (Figure 7a,b). For this period, the Beijing area was dominated by a medium-low wind speed, with a low-pressure value (997.5–1000 hPa). Hence, the local near-surface air mass gradually mixed with the long-distance transported air mass from the northwest, eventually leading to dust pollution. However, this dust event was weaker, with lower AOD values (≤0.8), as shown in Figure 7c. More comparisons on the aerosol optical properties between the two cases are discussed in Section 3.3.2.

3.3.2. Aerosol Optical Properties

Compared to case 1, the aerosols in case 2 presented a more variable spatial distribution (Figure 8a,b). Specifically, the averaged RCS at 532 nm was 0.82 ± 0.12 (arb. unit) below 0.4 km when the PDR values were also less than 0.10 before 18:00 LST on 16 April. Then, the aerosol layer was lifted to 0.5 km and developed gently. The aerosol layer was divided into two layers from 18:00 LST on 16 April to 12:00 LST on 17 April. At 0.3–0.5 km in height, the higher RCS at 532 nm and lower PDR (0.12 ± 0.02) suggested that the dust plume in case 2 contained more relatively finer particles. The region below 0.3 km maintained a low value of RCS (0.35 ± 0.21) until late at night on 18 April.
Figure 9 shows similar profiles as Figure 5 but from 14:00–18:00 LST on 17 April. The averaged PDR was 0.11 ± 0.03 below 0.6 km and 0.16 ± 0.09 above 0.6 km. This discrepancy suggests that numerous foreign coarse particles are present at high altitudes. Similarly, the value of BAE showed a negative proportional relationship with the height, as in case 1, ranging from −0.2 to −0.5. This could also be caused by the upper air coarse particles sinking closer to the surface at the end of the event. In comparison to the peak period of case 1, the Ext. Coef. in case 2 was slightly smaller, and the PDR was half of the value in case 1, with a thinner aerosol layer thickness of 0.4 km. Compared to case 1, the dust layer in case 2 mixed more fine particles near the surface, while more coarse particles were surrendered at higher heights (above 0.6 km).

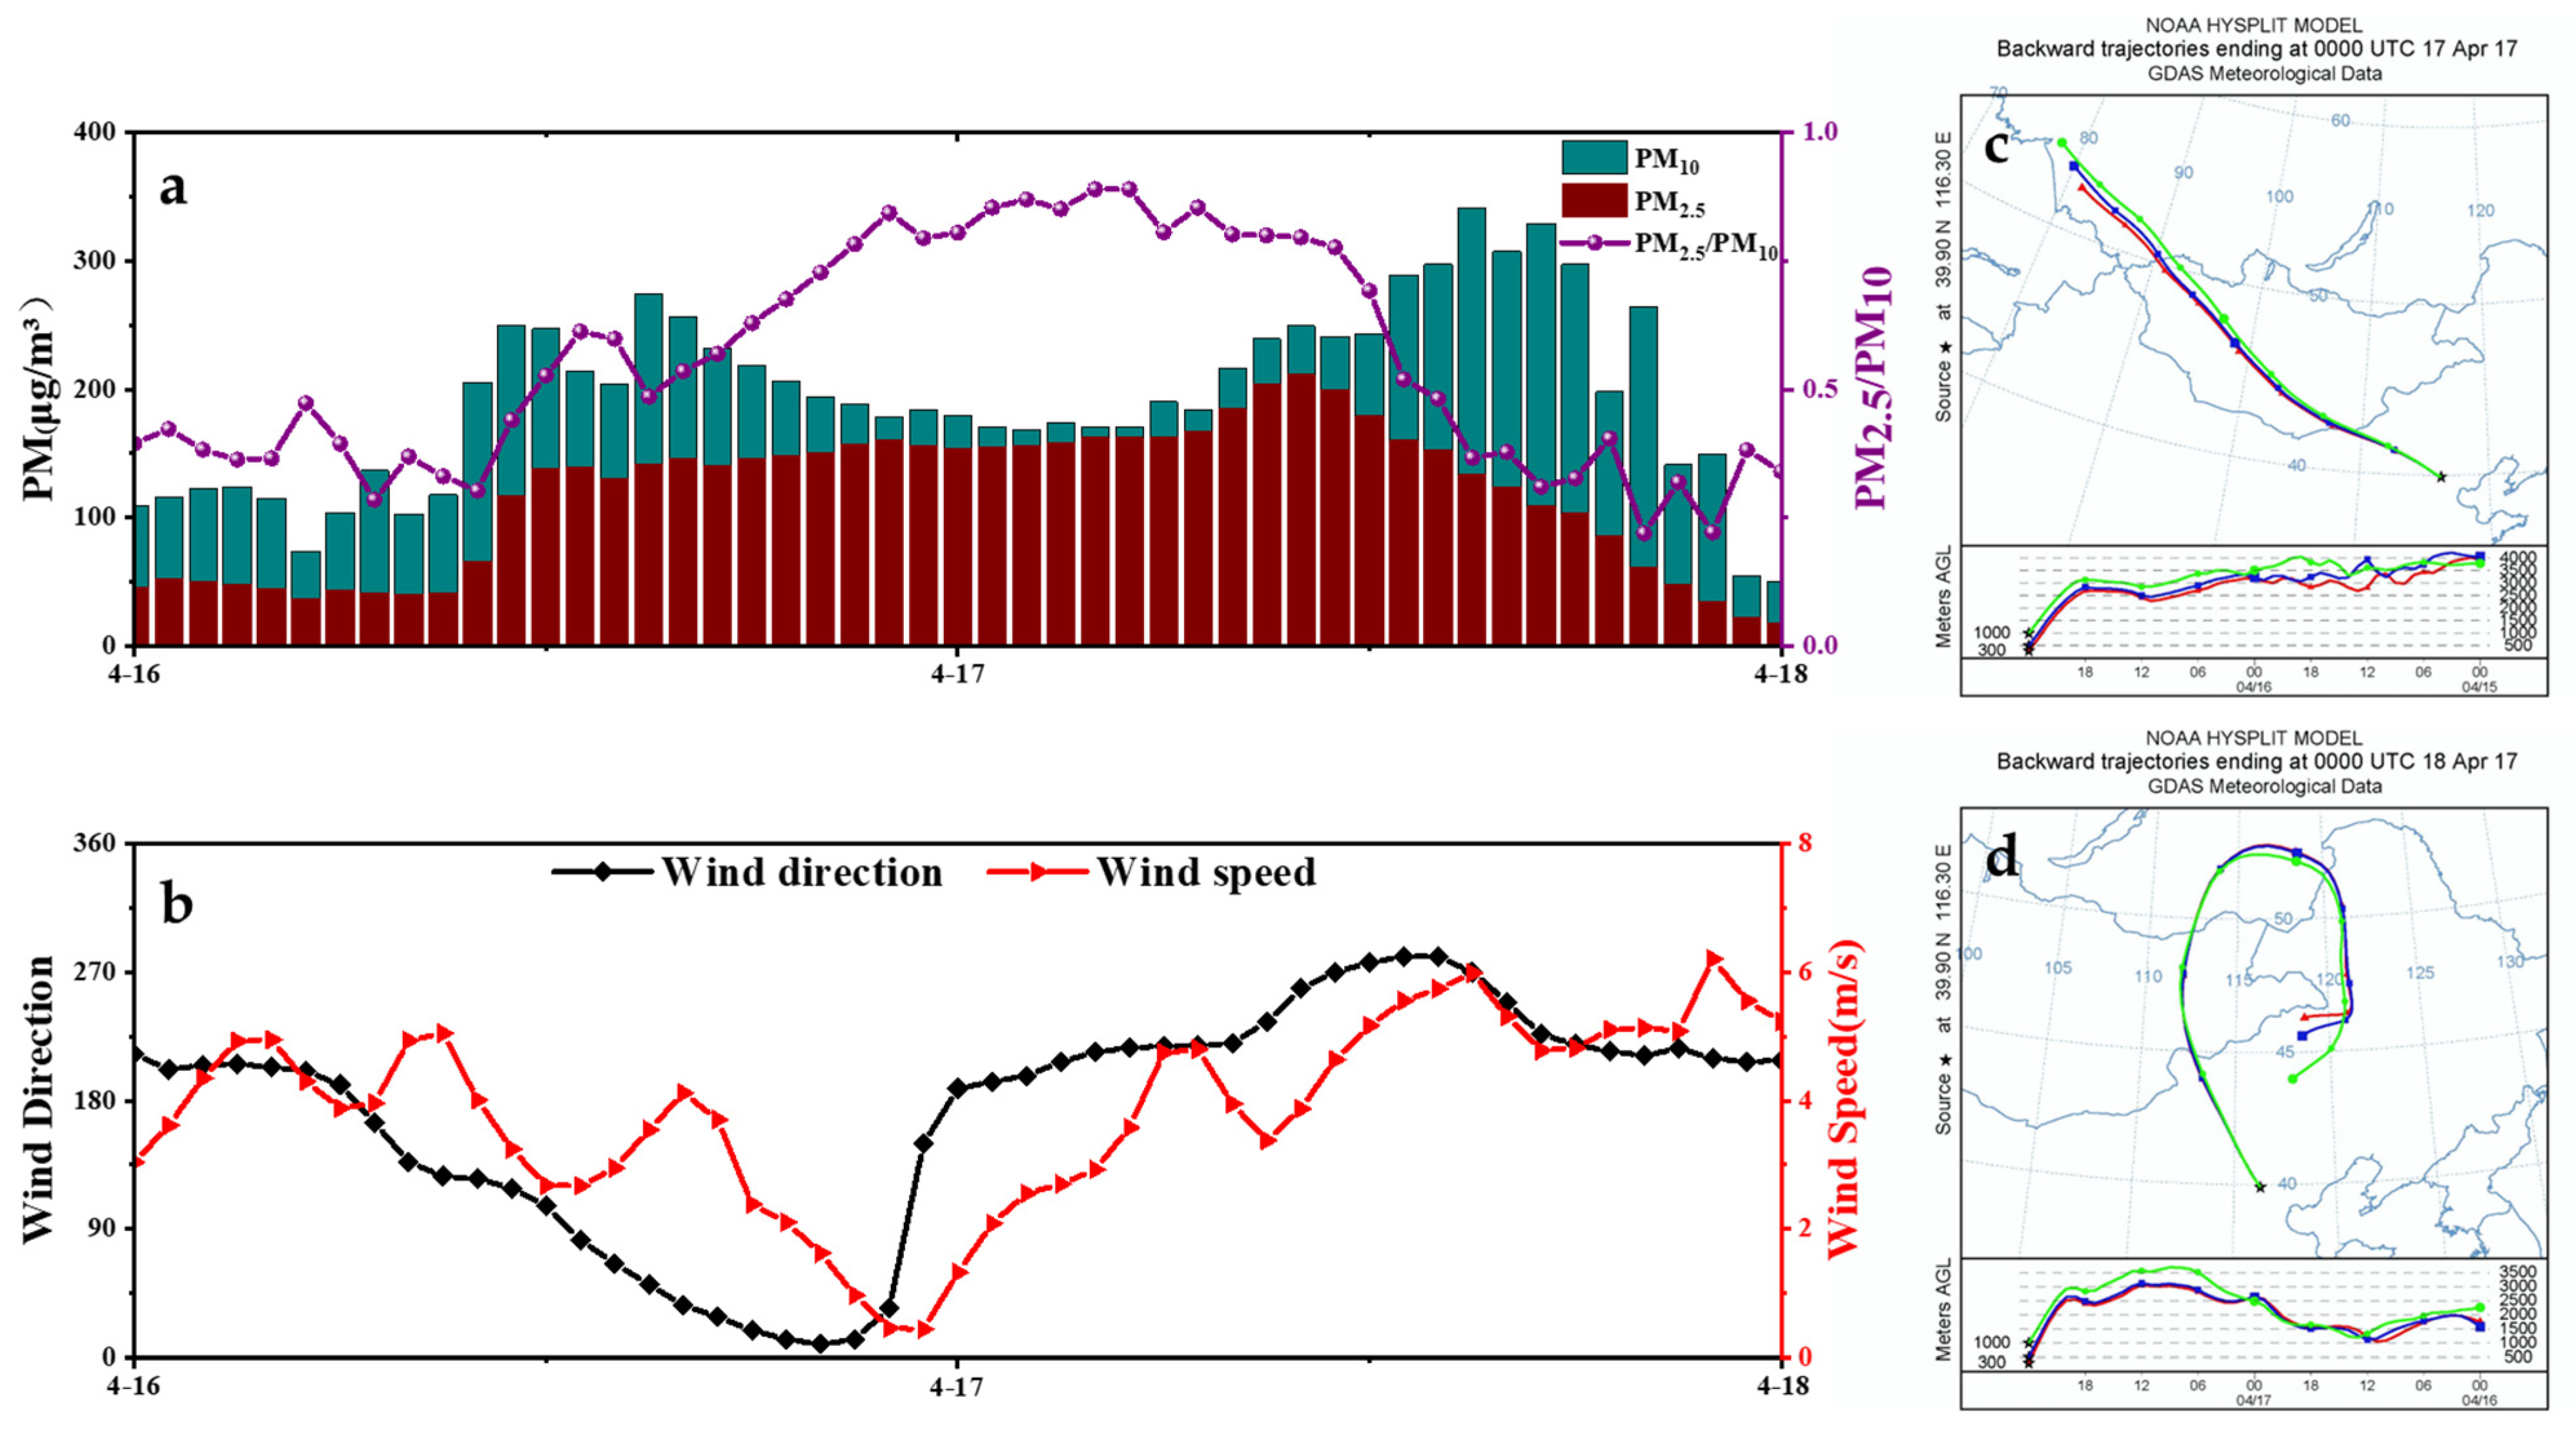
3.3.3. Surface Data and Backward Trajectories

Accordingly, the PM2.5 and PM10 concentrations were relatively lower, with both less than 350 μg·m−3 in Figure 10a. Similar to the trend in Figure 7, the PM mass concentration peaked after 12:00 LST on 17 April and dissipated to normal levels afterward. However, the PM2.5/PM10 ratio was equal to or greater than 0.5, representing more near-surface fine aerosols. Particularly, the ratio reached the maximum value of 0.88 when the pollution peak occurred. The wind shifted from the southeast to the southwest, leading to an increase in the aerosol concentrations.
The backward trajectory originated from Northeast China and Mongolia on 17 April in Figure 10c,d. Then, it moved counterclockwise to the north before arriving in Beijing on 18 April. The mixed airflow brought dust particles and local pollutants, such as sulfate and nitrate, to Beijing, forming the mixed dust plume in case 2.

4. Discussion

4.1. Comparison to Previous Observations

Generally, the values of the PDR and BAE in two dust events are significantly different, which indicates the difference in aerosol compositions in their vertical distribution. Case 1 is dominated by coarse particles, while case 2 involves fine particles mixing with local aerosols.
To compare our results with previous reports, we summarized an overview of the dust Bs. Coef., PDR, and BAE in the Beijing area during dust events, as shown in Table 3. Our observations showed that the Bs. Coef. at 532 nm was 0.014 ± 0.011 km−1·sr−1 and PDR at 532 nm was 0.24 ± 0.03 in case 1. For the mega dust events in March of 2013, 2018, and 2021 [19,54,55], the Bs. Coef. At 532 nm were 0.0008–0.0086, 0.017–0.040, and 0.020 ± 0.020 km−1·sr−1, respectively, and the PDR were all in the range of 0.1–0.4, which was in good agreement with our results. The lower PDR of 0.19 ± 0.03 at 532 nm and the Bs. Coef. at 532 nm of 0.007 ± 0.001 km−1·sr−1 [20] were smaller than that in our study, implying a weaker intensity of the dust event in October 2019. Other research has generally been close to our results, though the different transportation paths and mixing states of dust aerosols might contribute to some differences [45,56]. In addition, large amounts of big dust particles in the source region also led to a larger PDR compared to Beijing areas [57].

4.2. Vertical Profiles of Dust Mass Concentration

To demonstrate the rationality of our observations, we also provided lidar-derived vertical profiles of the dust mass concentrations in two cases in Figure 11. The profile of 5 May revealed the presence of a thick aerosol layer in case 1 (0.2–0.8 km). In addition, the near-surface dust concentration profile in case 1 (523.8 μg·m−3) was much greater than that in case 2 (248.5 μg·m−3), as demonstrated in Section 3. The top of the contaminated dust layer was at about 0.6 km in height above ground level. Furthermore, the dust mass concentration was uniformly distributed within the polluted dust layer, helping better understand how dust particles mix with local aerosols.
Moreover, we found that the particle mass concentration obtained by ground-based lidar was smaller than the values obtained from ground PM monitoring, which could be attributed to several reasons. (1) The near-surface results of the PM mass concentration obtained from lidar were not as accurate as that from the PM monitoring sites due to the existence of blind areas (0.2 km), and (2) the differences in the mass density, conversion factor, and particle shape might be a source of disagreement in the results [58].

5. Conclusions

A 355 and 532 nm, polarization lidar, combined with MODIS AOD data, as well as backward trajectories, was used for dust observations in Beijing from April to May 2017. Two dust events with different vertical intensities were selected for a detailed analysis. In particular, we calculated the backscattering coefficients (Bs. Coef.), extinction coefficient (Ext. Coef.), PDR, backscattering-related Ångström exponent (BAE), and mass concentration profiles of dust plumes. The results of this study are summarized below.
(1)
The larger values of Ext. Coef. (2.27 km−1 at 355 nm and 1.25 km−1 at 532 nm) in case 1 compared to that of the mixed dust (2.01 km−1 at 355 nm and 1.33 km−1 at 532 nm) in case 2 confirmed the stronger intensity of the pure dust in case 1. The PDR in case 1 remained constant (0.24 ± 0.03) from the surface to 0.8 km in height. In contrast, the PDR profile in the mixed dust layer (case 2) was split into two regions—large values exceeding 0.15 above 0.6 km and small values 0.11 ± 0.03 below 0.6 km. This suggested a stable aerosol layer full of coarse aerosols from the ground to the dust layer in the pure dust plume of case 1, while the stratification in case 2 implied mixed coarse and fine aerosols below 0.6 km and prevalent coarse aerosols exceeding 0.6 km. The absolute values of the BAE were negatively correlated with height in the two cases.
(2)
Although the dust aerosols in the two events both originated from the northwest, the metrological influences of the dust vertical distribution and ground air quality were different. In case 1, a moderate speed carried dust plumes to Beijing, resulting in the occurrence of dust pollution. Then, strong winds dilated the dust rapidly the next day. That is to say, the wind effect of exacerbating or mitigating dust pollution depends on the intensity of wind speeds. However, the wind kept an aggravating influence on the dust aerosols when a circulation was formed in case 2. This might be attributed to a more complicated airflow moving path.
(3)
We retrieved vertical profiles of the dust mass concentrations by means of lidar. The larger dust mass concentration of 523.8 μg·m−3 in case 1 and moderate value of 248.5 μg·m−3 in case 2 showed good agreement with the results from multi-source data.
Moreover, the observation also showed the potential ability of polarization lidar in dust monitoring compared to surface PM measurements. In order to better understand dust evolution and meteorological influences, more information such as the boundary layer height, wind at different heights, more accurate separation of dust and non-dust aerosols, and other observations are needed. Additional efforts should also be made to investigate the long-distance transportation of dust using numerical models, so as to better understand the influence of cross-border dust plumes on local air qualities.

Author Contributions

Conceptualization and methodology, Y.H. and Z.C.; software, Y.H. and X.C.; validation, Y.H. and C.J.; resources, Z.Y. and T.Z.; data curation, Y.H.; writing—original draft preparation, Y.H.; writing—review and editing, Z.C. and G.F.; visualization, Y.H.; and supervision, Z.Y. All authors have read and agreed to the published version of the manuscript.

Funding

This project was funded by the Key Lab. of Environmental Optics and Technology, CAS (2005DP173065-2021-07), the Meteorological Observation Center of China Meteorological Administration (SY2022031),and the School of Ecology and Environment at Beijing Technology and Business University.

Data Availability Statement

Data sharing is not applicable to this article.

Acknowledgments

The authors thank the Anhui Institute of Optics and Fine Mechanics, Chinese Academic of Sciences for providing the lidar system and data support. We are also grateful to the Chinese National Environmental Monitoring Centre for providing the surface meteorological data. The authors gratefully acknowledge the NOAA Air Resources Laboratory (ARL) for providing the HYSPLIT transport and dispersion model used in this research.

Conflicts of Interest

The authors declare no conflict of interest.

References

  1. Wu, X.; Xin, J.; Zhang, W.; Gong, C.; Wu, F. Optical, Radiative and Chemical Characteristics of Aerosol in Changsha City, Central. China Adv. Atmos. Sci. 2020, 37, 1310–1322. [Google Scholar] [CrossRef]
  2. Qian, W.; Quan, L.; Shi, S. Variations of the dust storm in China and its climatic control. J. Clim. 2002, 15, 1216–1229. [Google Scholar] [CrossRef]
  3. Cai, Z.; Li, D.; Huang, H. Analysis of impact of dust transport on aerosol evolution in Xuzhou region in spring 2021. J. Atmos. Environ. Optics. 2022, 17, 409–419. [Google Scholar]
  4. Gui, K.; Yao, W.; Che, H.; An, L.; Zheng, Y.; Li, L.; Zhao, H.; Zhang, L.; Zhong, J.; Wang, Y.; et al. Record–breaking dust loading during two mega dust storm events over northern China in March 2021: Aerosol optical and radiative properties and meteorological drivers. Atmos. Chem. Phy. 2022, 22, 7905–7932. [Google Scholar] [CrossRef]
  5. Chen, C.; Park, T.; Wang, X.; Piao, S.; Xu, B.; Chaturvedi, R.K.; Fuchs, R.; Brovkin, V.; Ciais, P.; Fensholt, R.; et al. China and India lead in greening of the world through land–use management. Nat. Sustain. 2019, 2, 122–129. [Google Scholar] [CrossRef]
  6. Yao, W.; Gui, K.; Wang, Y.; Che, H.; Zhang, X. Identifying the dominant local factors of 2000–2019 changes in dust loading over East Asia. Sci. Total. Environ. 2021, 777, 146064. [Google Scholar] [CrossRef]
  7. Gui, K.; Che, H.; Zheng, Y.; Zhao, H.; Yao, W.; Li, L.; Zhang, L.; Wang, H.; Wang, Y.; Zhang, X. Three–dimensional climatology, trends, and meteorological drivers of global and regional tropospheric type–dependent aerosols: Insights from 13 years (2007–2019) of CALIOP observations. Atmos. Chem. Phys. 2021, 21, 15309–15336. [Google Scholar] [CrossRef]
  8. Mu, F.; Liuz, E.W.; Fiedler, S. On the dynamics and air–quality impact of the exceptional East Asian dust outbreak in mid–March 2021. Atmos. Res. 2023, 292, 106846. [Google Scholar] [CrossRef]
  9. Chen, S.; Zhao, D.; Huang, J.; He, J.; Chen, Y.; Chen, J.; Bi, H.; Lou, G.; Du, S.; Zhang, Y.; et al. Mongolia Contributed More than 42% of the Dust Concentrations in Northern China in March and April 2023. Adv. Atmos. Sci. 2023, 40, 1–9. [Google Scholar] [CrossRef]
  10. Zhang, Y.; Sun, Z.; Chen, S.; Chen, H.; Guo, P.; Chen, S.; He, J.; Wang, J.; Nian, X. Classification and source analysis of low–altitude aerosols in Beijing using fluorescence-Mie polarization lidar. Opt. Commun. 2020, 479, 126417. [Google Scholar] [CrossRef]
  11. Igor, V.; Alexei, K.; Vadim, G.; Detlef, M.; Kathleen, F.; David, N. Inversion of multiwavelength Raman lidar data for retrieval of bimodal aerosol size distribution. Appl. Optics. 2004, 43, 1180–1195. [Google Scholar]
  12. Gao, F.; Veberič, D.; Stanič, S.; Bergant, K.; Hua, D.X. Performance improvement of long–range scanning Mie lidar for the retrieval of atmospheric extinction. J. Quant. Spectrosc. RA 2013, 122, 72–78. [Google Scholar] [CrossRef]
  13. Sugimoto, N.; Shimizu, A.; Matsui, I.; Uno, K.; Dong, X.; Zhao, S.; Zhou, J.; Lee, C.H. Study of Asian Dust Phenomena in 2001–2003 Using A Network of Continuously Operated Polarization Lidars. Water Air Soil Pollut. 2005, 5, 145–157. [Google Scholar] [CrossRef]
  14. Winker, D.M.; Pelon, J.; McCormick, M.P. The CALIPSO mission: Space–borne lidar for observation of aerosols and clouds. Proc. SPIE 2003, 4893, 1–11. [Google Scholar]
  15. Liu, Z.; Winker, D.; Omar, A.; Vaughan, M.; Trepte, C.; Hu, Y.; Powell, K.; Sun, W.; Lin, B. Effective lidar ratios of dense dust layers over North Africa derived from the CALIOP measurements. J. Quant. Spectrosc. RA 2011, 112, 204–213. [Google Scholar] [CrossRef]
  16. Dietrich, A.; Detlef, M.; Albert, A.; Wandinger, U.; Helgard, H.; Ernst, C.; Steffen, Z. Scanning 6-Wavelength 11-Channel Aerosol Lidar. J. Atmos. Ocean. Technol. 2000, 17, 1469–1482. [Google Scholar]
  17. Anna, K.J.; Tadeusz, S.; Grzegorz, K.; Michał, P.; Szymon, P.M. Particle size distribution retrieval from multiwavelength lidar signals for droplet aerosol. Appl. Opt. 2009, 48, B8–B16. [Google Scholar]
  18. Shimizu, A.; Sugimoto, N.; Matsui, I. Continuous observations of Asian dust and other aerosols by polarization lidars in China and Japan during ACE–Asia. J. Geophys. Res. 2004, 109, D19S17. [Google Scholar] [CrossRef]
  19. He, Y.; Yi, F.; Yin, Z.; Liu, F.; Yi, Y.; Zhou, J. Mega Asian dust event over China on 27–31 March 2021 observed with space—Borne instruments and ground-based polarization lidar. Atmos. Environ. 2022, 285, 119238. [Google Scholar] [CrossRef]
  20. Chen, S.; Nian, X.; Chen, H.; Zhang, Y.; Guo, P.; Bu, Z. Observation and analysis of aerosol optical properties during pollution episodes in Beijing. Optical. Technique 2021, 47, 570–576. [Google Scholar]
  21. Yin, Z.; Yi, F.; He, Y.; Liu, F.; Yu, C.; Zhang, Y.; Wang, W. Asian dust impacts on heterogeneous ice formation at Wuhan based on polarization lidar measurements. Atmos. Environ. 2021, 246, 118166. [Google Scholar] [CrossRef]
  22. Liu, C.; Yin, Z.; He, Y.; Wang, L. Climatology of dust aerosols over the Jianghan Plain revealed with space-borne instruments and MERRA—2 reanalysis data during 2006–2021. Remote. Sens. 2022, 14, 4414. [Google Scholar] [CrossRef]
  23. Chen, J.; Zhang, Y.; Yang, P.; Qian, W.; Wang, X.; Han, J. Pollution process and optical properties during a dust aerosol event in Shijiazhuang. China Environ. Sci. 2016, 36, 979–989. [Google Scholar]
  24. Lei, X.; Qian, Y.; Zhong, L.; Quan, Q. Analysis of a Dust Pollution Process in Nanchong City Based on Particulate LiDAR. Si Chuan Environ. 2017, 36, 93–102. [Google Scholar]
  25. Liu, Q.; Cheng, A.; Zhu, J.; Chang, S.; Tam, K. Ultra–Violet Mie Lidar Observations of Particulates Vertical Profiles in Macao during a Record High Pollution Episode. Remote. Sens. 2022, 14, 118. [Google Scholar] [CrossRef]
  26. Zhang, X.; Sharratt, B.; Liu, L.; Wang, Z.; Pan, X.; Lei, J.; Wu, S.; Huang, S.; Guo, Y.; Li, J.; et al. East Asian dust storm in May 2017: Observations, modelling, and its influence on the Asia–Pacific region, Atmos. Chem. Phys. 2018, 18, 8353–8371. [Google Scholar] [CrossRef] [Green Version]
  27. Tong, Y.; Tong, X.; Zhang, K.; Xiao, D.; Rong, Y.; Zhou, Y.; Liu, C.; Liu, D. Polarization lidar gain ratio calibration method: A comparison. Chin. Opt. 2021, 14, 685–703. [Google Scholar]
  28. Sasano, Y.; Shimizu, H.; Takeuchi, N.; Okuda, M. Geometrical form factor in the laser radar equation: An experimental determination. Appl. Opt. 1979, 18, 3908–3910. [Google Scholar] [CrossRef]
  29. Wang, S.; Cao, K.; Hu, X.; Wei, H. Analysis and determination lidar geometrical factor. Laser. Tech. 2008, 32, 147–150. [Google Scholar]
  30. Hsu, N.C.; Jeong, M.J.; Bettenhausen, C.; Sayer, A.M.; Hansell, R.; Seftor, C.S.; Tsay, S.C. Enhanced deep blue aerosol retrieval algorithm: The second generation. J. Geophys. Res. Atmos. 2013, 118, 9296–9315. [Google Scholar] [CrossRef]
  31. Levy, R.C.; Mattoo, S.; Munchak, L.A.; Remer, L.A.; Sayer, A.M.; Hsu, N.C. The Collection 6 MODIS aerosol products over land and ocean. Atmos. Meas. Tech. 2013, 6, 159–259. [Google Scholar] [CrossRef] [Green Version]
  32. Cai, Z.; Jiang, F.; Chen, J.M.; Jiang, Z.; Wang, X. Weather condition dominates regional PM2.5 pollutions in the eastern coastal provinces of China during winter. Aerosol. Air. Qual. Res. 2018, 18, 969–980. [Google Scholar] [CrossRef]
  33. Peng, L.; Yi, F.; Liu, F.; Yin, Z.; He, Y. Optical properties of aerosol and cloud particles measured by a single-line-extracted pure rotational Raman lidar. Opt. Express 2021, 29, 21947–21964. [Google Scholar] [CrossRef] [PubMed]
  34. Hu, Q.; Wang, H.; Goloub, P.; Li, Z.; Veselovskii, I.; Podvin, T.; Li, K.; Korenskiy, M. The characterization of Taklamakan dust properties using a multiwavelength Raman polarization lidar in Kashi, China, Atmos. Chem. Phys. 2020, 20, 13817–13834. [Google Scholar]
  35. Klett, J.D. Stable analytical inversion solution for processing LiDAR returns. Appl. Opt. 1981, 20, 211–220. [Google Scholar] [CrossRef] [Green Version]
  36. Sakai, T.; Nagai, T.; Zaizen, Y.; Mano, Y. Backscattering linear depolarization ratio measurements of mineral, sea-salt, and ammonium sulfate particles simulated in a laboratory chamber. Appl. Opt. 2010, 49, 4441–4449. [Google Scholar] [CrossRef]
  37. Ångström, A. The parameters of atmospheric turbidity. Tellus 1964, 16, 64–75. [Google Scholar] [CrossRef] [Green Version]
  38. Ansmann, A.; Mamouri, R.E.; Hofer, J.; Baars, H.; Althausen, D.; Abdullaev, S.F. Dust mass, cloud condensation nuclei, and ice-nucleating particle profiling with polarization lidar: Updated Poliphon conversion factors from global AERONET analysis. Atmos. Meas. Tech. 2019, 12, 4849–4865. [Google Scholar] [CrossRef] [Green Version]
  39. Mamouri, R.E.; Ansmann, A. Fine and coarse dust separation with polarization lidar. Atmos. Meas. Tech. 2014, 7, 3717–3735. [Google Scholar] [CrossRef] [Green Version]
  40. He, Y.; Zhang, Y.; Liu, F.; Yin, Z.; Yi, Y.; Zhan, Y.; Yi, F. Retrievals of dust-related particle mass and ice-nucleating particle concentration profiles with ground-based polarization lidar and sun photometer over a megacity in central China. Atmos. Meas. Tech. 2021, 14, 5939–5954. [Google Scholar] [CrossRef]
  41. Tesche, M.; Ansmann, A.; Müller, D.; Althausen, D.; Engelmann, R.; Freudenthaler, V.; Groß, S. Vertically resolved separation of dust and smoke over Cape Verde using multi-wavelength Raman and polarization lidars during Saharan Mineral Dust Experiment. Geophys. Res. 2008, 114, D13202. [Google Scholar] [CrossRef]
  42. Christoph, M.; Stefan, E.; Wolfgang, J.M. Aerosol concentration measurements with a lidar ceilometer: Results of a one year measuring campaign. Proc. SPIE 2004, 5235, 486–496. [Google Scholar]
  43. Sun, J.; Zhang, H. Atheoretical analysis of remote measurement of mass concentration of atmospheric dust using lidar. Acta Sci. Circumstantiae 1982, 2, 36–43. [Google Scholar]
  44. Han, D.; Liu, W.; Liu, J.; Lu, Y.; Zhao, N. Retrieval Method for Aerosol Mass Concentration Vertical Distribution based on Extinction. Proc. SPIE 2008, 6824, 1567–1573. [Google Scholar]
  45. Wang, Z.; Liu, C.; Dong, Y.; Hu, Q.; Liu, T.; Zhu, Y.; Xing, C. Profiling of Dust and Urban Haze Mass Concentrations during the 2019 National Day Parade in Beijing by Polarization Raman Lidar. Remote. Sens. 2021, 13, 3326. [Google Scholar] [CrossRef]
  46. Heese, B.; Flentje, H.; Althausen, D.; Ansmann, A.; Frey, S. Ceilometer lidar comparison: Backscatter coefficient retrieval and signal-to-noise ratio determination. Atmos. Meas. Tech. 2010, 3, 1763–1770. [Google Scholar] [CrossRef] [Green Version]
  47. Zhang, R.; Wang, M.; Pu, Y. Analysis on the chemical and physical properties of “2000. 4.6” super dust storm in Beijing. Clim. Environ. Res. 2000, 5, 259–266. [Google Scholar]
  48. Sathe, Y.; Kulkarni, S.; Gupta, P.; Kaginalkar, A.; Islam, S.; Gargava, P. Application of Moderate Resolution Imaging Spectroradiometer (MODIS) Aerosol Optical Depth (AOD) and Weather Research Forecasting (WRF) model meteorological data for assessment of fine particulate matter (PM2.5) over India. Atmos. Pollut. Res. 2019, 10, 418–434. [Google Scholar] [CrossRef]
  49. Wang, H.; Li, Z.; Goloub, P.; Hu, Q.; Wang, F.; Lv, Y.; Ge, B.; Hu, X.; Shang, J.; Zhang, P. Identification of typical dust sources in Tarim Basin based on multi-wavelength Raman polarization lidar. Atmos. Environ. 2022, 290, 119358. [Google Scholar] [CrossRef]
  50. Xu, Q.; Gong, C.; Li, X.; Mei, H.; Li, C.; Zhu, W.; Zhan, J. Measurement and analysis of optical parameters of dust aerosol in Zhangbei Area [A]. In Proceedings of the 5th Cross—Strait Aerosol Technology Seminar, Urumqi, China, 2–6 September 2008; pp. 59–64. [Google Scholar]
  51. Ahmad, S.R.; Billiet, E.M. Implications of atmospheric attenuation in Raman lidar detection of pollutants. Opt. Laser Techno. 1991, 23, 180–188. [Google Scholar] [CrossRef]
  52. Zhang, S.; Huang, Z.; Li, M.; Shen, X.; Wang, Y.; Dong, Q.; Bi, J.; Zhang, J.; Li, W.; Li, Z.; et al. Vertical Structure of Dust Aerosols Observed by a Ground–Based Raman Lidar with Polarization Capabilities in the Center of the Taklimakan Desert. Remote. Sens. 2022, 14, 2461. [Google Scholar] [CrossRef]
  53. Dong, Q.; Huang, Z.; Li, W.; Li, Z.; Song, X.; Liu, W.; Wang, T.; Bi, J.; Shi, J. Polarization Lidar Measurements of Dust Optical Properties at the Junction of the Taklimakan Desert–Tibetan Plateau. Remote Sens. 2022, 14, 558. [Google Scholar] [CrossRef]
  54. Gui, H.; Qin, H.; Zhao, P.; Wang, F.; Tang, Z.; Wang, J.; Zhu, Y.; Chu, Y. Characteristics of atmospheric boundary layer and sources of a sand-dust event during spring 2018 in Beijing. J. Meteorol. Environ. 2021, 37, 18–25. [Google Scholar]
  55. Deng, M.; Zhang, J.; Jiang, Y. Vertical distribution and source analysis of dust aerosol in Beijing under the influence of a dust storm. J. Meteoro. Sci. 2015, 35, 550–557. [Google Scholar]
  56. Liang, Y.; Che, H.; Wang, H.; Zhang, W.; Li, L.; Zheng, Y.; Gui, K.; Zhang, P.; Zhang, X. Aerosols Direct Radiative Effects Combined Ground-Based Lidar and Sun-Photometer Observations: Cases Comparison between Haze and Dust Events in Beijing. Remote Sens. 2022, 14, 266. [Google Scholar] [CrossRef]
  57. Yang, L.; Hu, Z.; Huang, Z.; Wang, L.; Han, W.; Yang, Y.; Tao, H.; Wang, J. Detection of a dust storm in 2020 by a multi-observation platform over the Northwest China. Remote Sens. 2021, 13, 1056. [Google Scholar] [CrossRef]
  58. Xiao, D.; Wang, N.; Chen, S.; Wu, L.; Müller, D.; Veselovskii, I.; Li, C.; Landulfo, E.; Sivakumar, V.; Li, J.; et al. Simultaneous profiling of dust aerosol mass concentration and optical properties with polarized high–spectral–resolution lidar. Sci. Total Environ. 2023, 872, 162091. [Google Scholar] [CrossRef]
Figure 1. (a) SNR and (b) RCS profiles of the ground-based lidar.
Remotesensing 15 03494 g001
Figure 2. Near-surface PM mass concentrations from 1 April to 31 May 2017.
Remotesensing 15 03494 g002
Figure 3. Mean sea-level pressure (MSLP) of the observing site at (a) 6:00 LST on 4 May 2017 and (b) 0:00 LST on 5 May 2017. Evolution of the MODIS daily AOD over North China on (c) 4 May 2017 and (d) 5 May 2017 (Beijing is marked as a green star).
Remotesensing 15 03494 g003
Figure 4. The vertical structures of aerosols were detected by ground-based lidar in Beijing on 4–6 May 2017. (a) RCS at 532 nm; (b) PDR at 532 nm.
Remotesensing 15 03494 g004
Figure 5. Vertical profiles of aerosol optical properties in Beijing in case 1. (a) Bs. Coef. at 532 nm and 355 nm; (b) Ext. Coef. at 532 nm and 355 nm; (c) PDR at 532 nm; (d) BAE (355 nm/532 nm).
Remotesensing 15 03494 g005
Figure 6. Near-surface particulate matter (a) PM10 and PM2.5 concentrations and (b) wind direction and wind speed from 4 May to 6 May. (c,d) Backward trajectory ensembles at 0.3 km (red line), 0.5 km (blue line), and 1.0 km (green line) ending at Beijing at 0:00 UTC on 4 and 5 May 2017. The plot is presented according to the HYSPLIT calculation scheme.
Remotesensing 15 03494 g006
Figure 7. Mean sea-level pressure (MSLP) of the observing site at (a) 6:00 LST on 17 April 2017 and (b) 18:00 LST on 17 April 2017. Evolution of the MODIS daily AOD over North China on (c) 17 April 2017 (Beijing is marked as a green star).
Remotesensing 15 03494 g007
Figure 8. The vertical structure of aerosols was detected by ground-based lidar in Beijing on 16–17 April 2017. (a) RCS at 532 nm; (b) PDR at 532 nm.
Remotesensing 15 03494 g008
Figure 9. Vertical profiles of the aerosol optical properties in Beijing in case 2. (a) Bs. Coef. at 532 nm and 355 nm; (b) Ext. Coef. at 532 nm and 355 nm; (c) PDR at 532 nm; (d) BAE (355 nm/532 nm).
Remotesensing 15 03494 g009
Figure 10. Near-surface particulate matter (a) PM10 and PM2.5 concentrations and (b) wind direction and wind speed from 16 April to 17 April. (c,d) Backward trajectory ensembles at 0.3 km (red line), 0.5 km (blue line), and 1.0 km (green line) ending in Beijing at 0:00 UTC on 17 and 18 April 2017. The plot is presented according to the HYSPLIT calculation scheme.
Remotesensing 15 03494 g010
Figure 11. Retrieved vertical profiles of the dust mass concentration.
Remotesensing 15 03494 g011
Table 1. Components and parameters of lidar from AIOFM, CAS.
Components and Parameters
Laser typeNd:YAG laser
Detector typePMT (Hamamatsu R9880U)
Telescope typeCassegrain
Wavelength (nm)532/355
FOV (mard)1.5
Pulse energy (mJ)50.0 (532), 76.5 (355)
Pulse repetition rate (Hz)20
Linear polarized purity>99%
Telescope diameter (mm)200
Detection distance (m)200~10,000
Spatial resolution (m)7.5
Temporal resolution (min)15
Table 2. Aerosol optical characteristics observed in our study.
Optical ParametersPhysical Significance
Rang-corrected signal (RCS)the signal intensity received by lidar
Bs. Coef. (β)the aerosol concentration
Ext. Coef. (α)
Particle depolarization ratio (PDR)the aerosol spherical property
Backscattering-related Ångström exponent (BAE)the aerosol size
Table 3. Comparison of optical characteristics of dust aerosols observed by lidar.
TimeBs.coef at 355 nm (km−1·sr−1)Bs.coef at 532 nm (km−1·sr−1)PDR at 532 nmBAE (355 nm/532 nm)References
21–23 October 20190.013 ± 0.0020.007 ± 0.0010.19 ± 0.030.04~1.4Chen et al., 2021 [20]
28 October 20190.003 ± 0.0030.003 ± 0.0040.25 ± 0.03−0.28~0.75
27 March 2021––0.020 ± 0.0200.25 ± 0.05––He et al., 2022 [19]
27–29 March 2018––0.017–0.040>0.3––Gui et al., 2021 [54]
10 March 2013––0.0008–0.00860.1–0.4––Deng et al., 2015 [55]
4–6 May 2017
(case 1)
0.031 ± 0.0150.014 ± 0.0110.24 ± 0.03−0.40 ± 016This study
16–17 April 2017
(case 2)
0.030 ± 0.0100.019 ± 0.0090.11 ± 0.03
0.16 ± 0.09
−0.28 ± 0.10
Disclaimer/Publisher’s Note: The statements, opinions and data contained in all publications are solely those of the individual author(s) and contributor(s) and not of MDPI and/or the editor(s). MDPI and/or the editor(s) disclaim responsibility for any injury to people or property resulting from any ideas, methods, instructions or products referred to in the content.

